Embed Size (px)
Citation preview

Participatory risk assessment I - Introduction -
‘Learning Event’ on risk analysis and participatory methods
CSRS, November 28, 2014
Kohei Makita Associate Professor of Veterinary Epidemiology at
Rakuno Gakuen University (OIE Joint Collaborating Centre for Food Safety) Joint Appointment Veterinary Epidemiologist at International Livestock Research Institute (ILRI)

Outline
• Food safety in informal market
• Participatory Risk Analysis
• Monte Carlo simulation
• Key distributions
2

3

4

Why food safety?
• Every year, at least 2 billion cases of diarrhea occur and 1.5 million children under 5 yrs die worldwide
• Poor, young, elderly, pregnant women and immune-suppressed most affected
• Food borne diseases include non-diarrheal severe zoonoses

Why animal source foods?
• Two-thirds of human pathogens are zoonotic – many of these transmitted via animal source food
• Animal source food is a single most important cause of food-borne disease
• Many food-borne diseases cause few symptoms in animal host
• Many zoonotic diseases controlled most effectively in animal host/reservoir

Formal marketing
Informal marketing in sub-Saharan Africa (90-95%)
Dominance of informal markets in developing countries
“Absence of structured sanitary inspection”

8
Informal ≠ Illegal
Outline
• Food safety in informal market
• Participatory Risk Analysis
• Monte Carlo simulation
• Key distributions
9

10
Risk analysis A tool for decision-making
under uncertainty
11
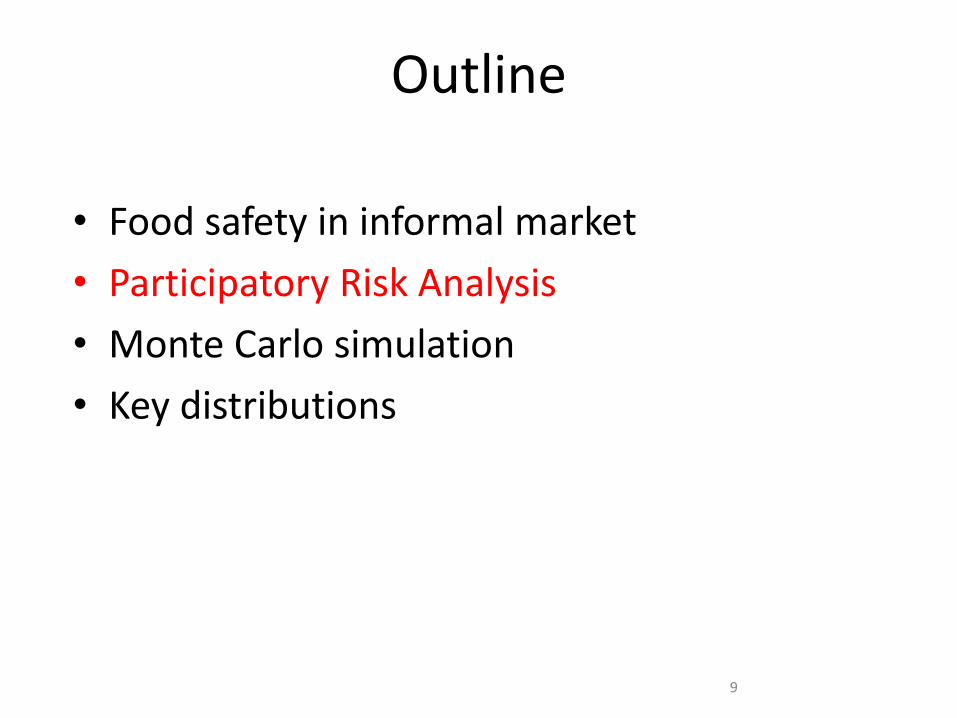
OIE Import Risk Analysis
Release assessment
Exposure assessment
Consequence assessment
Risk management
Risk assessment
Hazard identification
Risk communication

OIE Risk analysis for antimicrobial resistance
Release assessment
Exposure assessment
Consequence assessment
Risk management
Risk assessment
Hazard identification
Risk communication
Use of antimicrobials at farm and selection of resistant bacteria
Food chain and consumption of the foods contaminated
Weaker response of antimicrobials in treatment

Hazard Analysis and Critical Control Point (HACCP) system
• Adopted by Codex Alimentarius Commission
• Science based and systematic system which identifies specific hazards and measures for their control to ensure the safety of food
13

14
Risk
Assessment
Risk
Management
Risk
Communication
Codex Alimentarius Commossion Food safety risk analysis
A tool for decision-making under uncertainty
*Risk is a probability of occurrence of a scenario and its size of impact (Vose, 2008)

15
Risk
Assessment
Risk
Management
Risk
Communication
Food safety risk analysis in informal marketing system
Participatory methods

16
Advantage of participatory risk assessment
• -Speed
• -Affordability
• -Flexibility in application
• -Understanding of culture
• -Best control option
• -Potential to change behavior

17
Food safety risk assessment Codex Alimentarius Commission system
Hazard identification
Hazard characterization Exposure assessment
Risk characterization Participatory methods
fit well
Risk communication

Codex Alimentarius Commission Risk assessment framework (CAC/GL-30 (1999))
Hazard identification
Exposure assessment
Hazard characterization
Risk characterization
18

Statement of purpose of risk assessment
• Clear statement of the specific purpose of the particular risk assessment
• Output form
– Prevalence of illness
– Annual incidence rate (eg. case/10,000)
• Preliminary investigation phase may be required
Hazard identification
Exposure assessment
Hazard characterization
Risk characterization
19

Hazard identification
• The identification of biological, chemical, and physical agents –
• capable of causing adverse health effects –
• and which may be present in a particular food or group of foods
Hazard identification
Exposure assessment
Hazard characterization
Risk characterization
20

Exposure assessment
• Assessment of the extent of actual or anticipated human exposure
• Based on potential extent of food contamination by a particular agent or its toxins, and on dietary information
Hazard identification
Exposure assessment
Hazard characterization
Risk characterization
21

Hazard characterization
• Qualitative or quantitative description of the severity and duration of adverse effects that may result from the ingestion of a microorganisms or its toxin in food
• A dose-response assessment should be performed if the data are obtainable
Hazard identification
Exposure assessment
Hazard characterization
Risk characterization
22

Factors that need to be considered in hazard characterization
• Factors related to the microorganism – Replication
– Virulence and infectivity
– Delay of onset following exposure
– Attributes altering pathogenicity, e.g., high fat content of a food vehicle
• Factors related to the host – Genetic factors
– Host susceptibility characteristics • Age, pregnancy, nutrition, immune status etc.
– Population characteristics • Population immunity, access to and use of
medical care etc.
Hazard identification
Exposure assessment
Hazard characterization
Risk characterization
23

Dose-response Assessment
• Determination of the relationship between the magnitude of exposure (dose) to a chemical, biological or physical agent and the severity and/or frequency of associated adverse health effects (response)
Hazard identification
Exposure assessment
Hazard characterization
Risk characterization
24

Risk characterization
• Integration of previous three steps to obtain a Risk Estimate
• A qualitative or quantitative estimate of the likelihood and severity of the adverse effects which could occur in a given population
• Degree of confidence: uncertainty and variability
• Influence of the estimates and assumptions by sensitivity analyses
Hazard identification
Exposure assessment
Hazard characterization
Risk characterization
25

Uncertainty and variability
• “Variability is a phenomenon in the physical world to be measured, analysed and where appropriate explained. By contrast, uncertainty is an aspect of knowledge”
26
Sir David Cox

Uncertainty and variability
27
• Each of them are uncertainty distributions
• The variety of uncertainty distributions shows variability
• Variability in this case is the growth speed of S. aureus

Uncertainty
• Assessor’s lack of knowledge about the parameters that characterise the physical system that is being modeled
• Level of ignorance, degree of belief
• Sometime reducible through further measurement or study
• In our (food safety risk assessor) case; – Prevalence of pathogens/ antibodies in foods
– Temperature of foods
– Cooking and consumption behavior (could be dealt as variability if you know well)
– Time from production to processing/ consumption
28

Variability
• A function of the system
– In our (food safety risk assessors) case; • Variety in virulence
• Variety in speed of bacteria multiplication
• System of the value chain
• Amount of foods passing through value chains
• Seasonal variety
• Inter-individual variability
– Height
– Weight
– Sex
29

Documentation
• Systematic documentation for communication to risk manager
• Reporting the limitations is important in transparent process of the decision making
• Description of the model for other risk assessors to repeat and critique the work
Hazard identification
Exposure assessment
Hazard characterization
Risk characterization
30
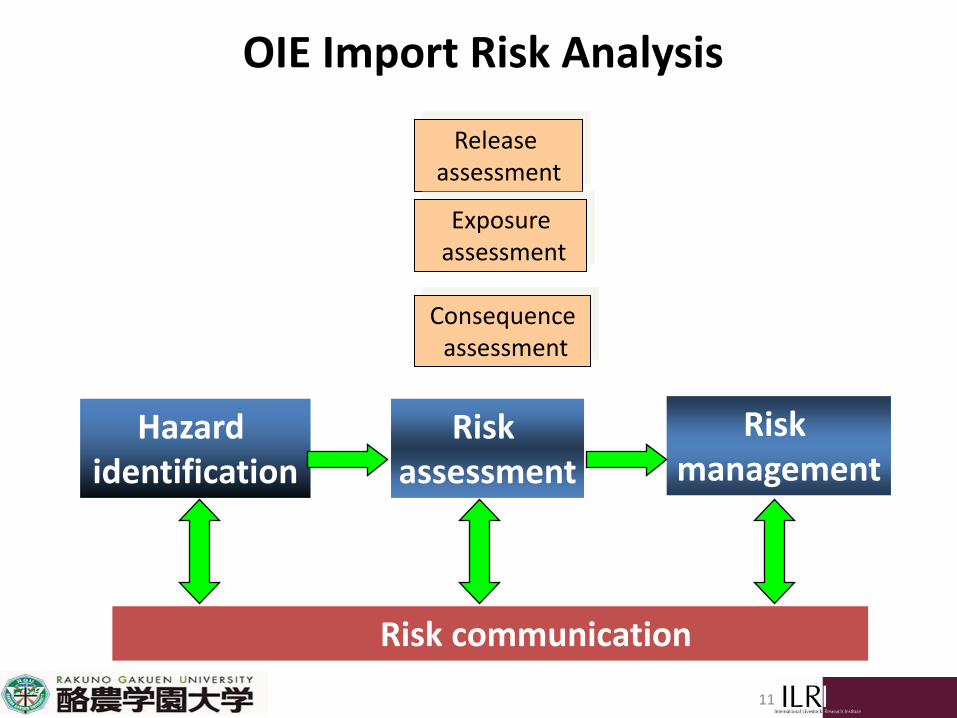
Types of Risk assessment
• Qualitative risk assessment – Qualitative statement (Negligible, low, medium,
high, extremely high etc.)
• Quantitative risk assessment – Deterministic risk assessment
• Single point estimates
– Stochastic risk assessment • Probability distribution
31

Outline
• Food safety in informal market
• Participatory Risk Analysis
• Monte Carlo simulation
• Key distributions
32

What is Monte Carlo simulation?
• Imagine this EcoHealth work; – Probability that vegetable A on farm is contaminated with
Salmonella came from pig waste: 30% (PA)
– Probability of reduction of Salmonella prevalence by washing at home: 90% (PB)
– After washing, contaminated vegetable contains 20 Salmonella/g (CFU)
– A person ingests 50g of salad of vegetable A at a time (Cons)
– In the country, this salad is consumed once a week (Rate)
– Dose-response (DR) relationship known
– What is the probability of salmonellosis due to consumption of vegetable A as salad?
Probability of illness = PA x (1-PB) x CFU x Cons x DR x Rate
Deterministic model = 0.3 x (1-0.9) x 20 x 50 x DR x 1/7
Stochastic model assigns distributions for each parameter Then how we calculate? 33
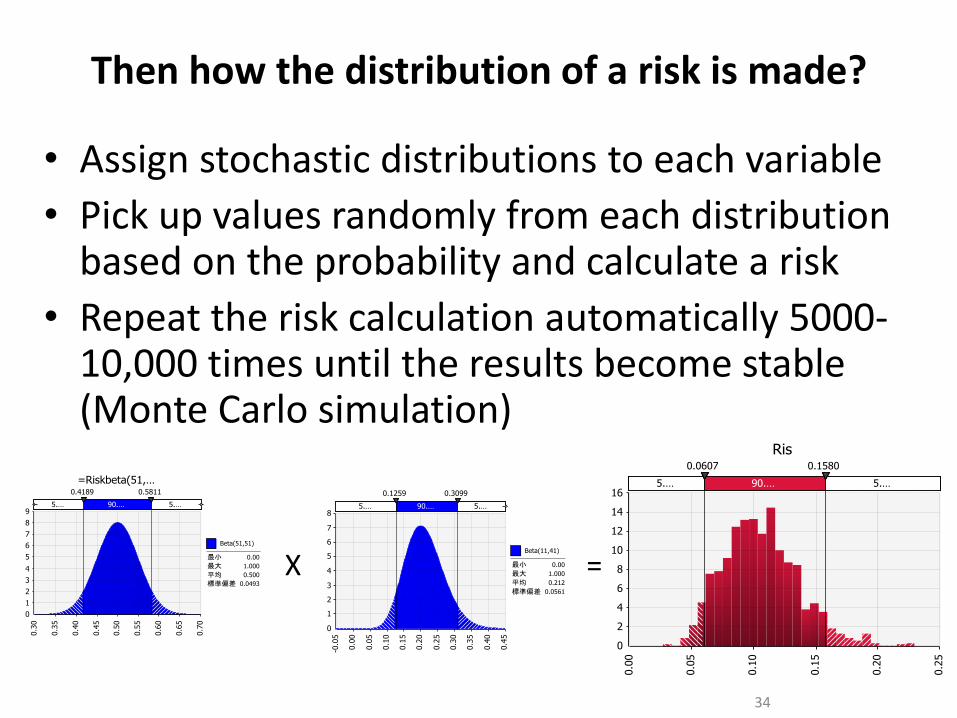
Then how the distribution of a risk is made?
• Assign stochastic distributions to each variable
• Pick up values randomly from each distribution based on the probability and calculate a risk
• Repeat the risk calculation automatically 5000-10,000 times until the results become stable (Monte Carlo simulation)
34
X =

Outline
• Food safety in informal market
• Types of Risk Analysis (Codex, OIE, HACCP)
• Monte Carlo simulation
• Key distributions
35

Types of data Head or tail 0 or 1 Healthy or diseased
Binomial data
Milk yield Body weight
Continuous data
Animal breed Districts
Categorical data Bacteria load Number of animals
Count data
36

Parametric and non-parametric statistics
E.g. Milk yield E.g. Rank of psychological stress during FMD outbreak among vets
Parametric Non-parametric
37

Parametric and non-parametric statistics
Does not make any distributional assumptions about the data
Parametric tests Non-parametric tests
Make assumptions about the underlying distribution of the observations and the parameters which define that distribution
38
39
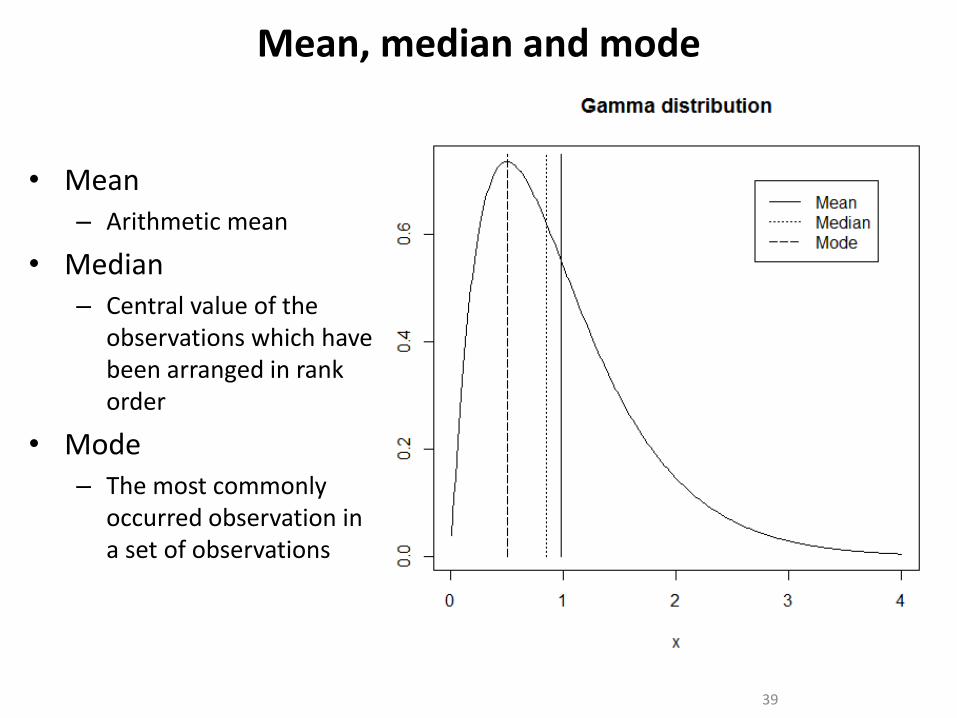
• Mean – Arithmetic mean
• Median – Central value of the
observations which have been arranged in rank order
• Mode – The most commonly
occurred observation in a set of observations
Mean, median and mode

40
Normal distribution
• Continuous data
• Two parameters
– Mean
– Standard deviation
• Mean, mode and median are same
Where
Probability density function

41
Binomial distribution
• Two parameters – Trial, probability
• Logit-link
• (E.g.) 10% chicken carcasses is known to be contaminated with Campylobacter
• You sampled four carcasses
• How many were contaminated?
Probability mass function
Where x success in n trials Probability P of success

• Binomial/ Binary response data
• Two parameters – Trial
– Success
• (E.g.) Prevalence of E. coli in foods
• (E.g.) Prevalence of brucellosis among cattle herds
Beta (2,30) Beta (30,2)
Beta (6,26) Beta (26,6)
Beta (16,16)
Probability density function for Beta (a, b)
1
0
11
11
)1(
)1()(
dttt
xxxf
ba
ba
42

Poisson distribution
• Count data
• One parameter – Shape
• Log-link
• (E.g.) Number of customer per day
λ=10
λ=0.9 λ=3
λ=6
!
)()(
x
texf
xtλλ
Probability mass function
43

Gamma distribution
44
• Gamma (α,β)
• Two parameters
– Number of events α
– Time between events β
• Mean: αβ
• Variance:αβ 2
Gamma(1,2)
Gamma(1,1)
Gamma(2,1)
Gamma(4,1)
Probability density function
)(
)/exp()(
1
αΓ
ββ αα xxxf
When
0
1)( dtetn txΓ

Exponential distribution
45
Expon (1)
Expon (2)
Expon (5)
• Exp(β)=Gamma (1, β) – Special case of Gamma
distribution when α=1
• Time between successive occurrences
β
β/
)(xe
xf
Probability density function

Key parametric distributions
• Normal distribution
• Binomial distribution
• Beta distribution
• Poisson distribution
• Gamma distribution
• Exponential distribution
46
There are more parametric distributions but they are key ones to relate other distributions used for food safety risk assessment

Any questions?
47