Embed Size (px)
Citation preview
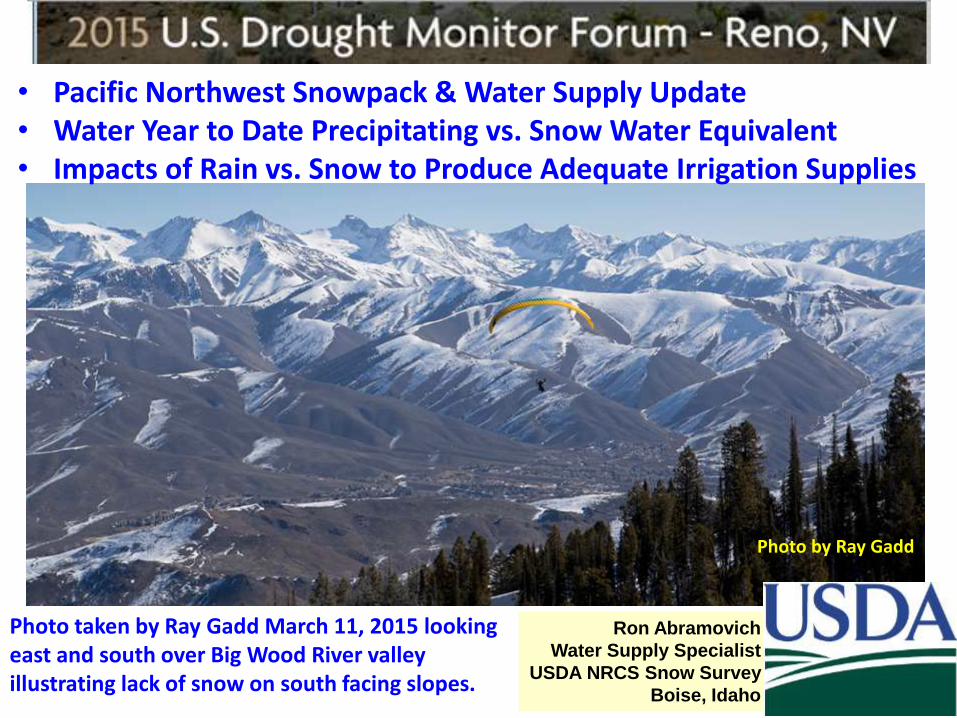
Photo taken by Ray Gadd March 11, 2015 looking east and south over Big Wood River valley illustrating lack of snow on south facing slopes.
Photo by Ray Gadd
Ron Abramovich
Water Supply Specialist
USDA NRCS Snow Survey
Boise, Idaho
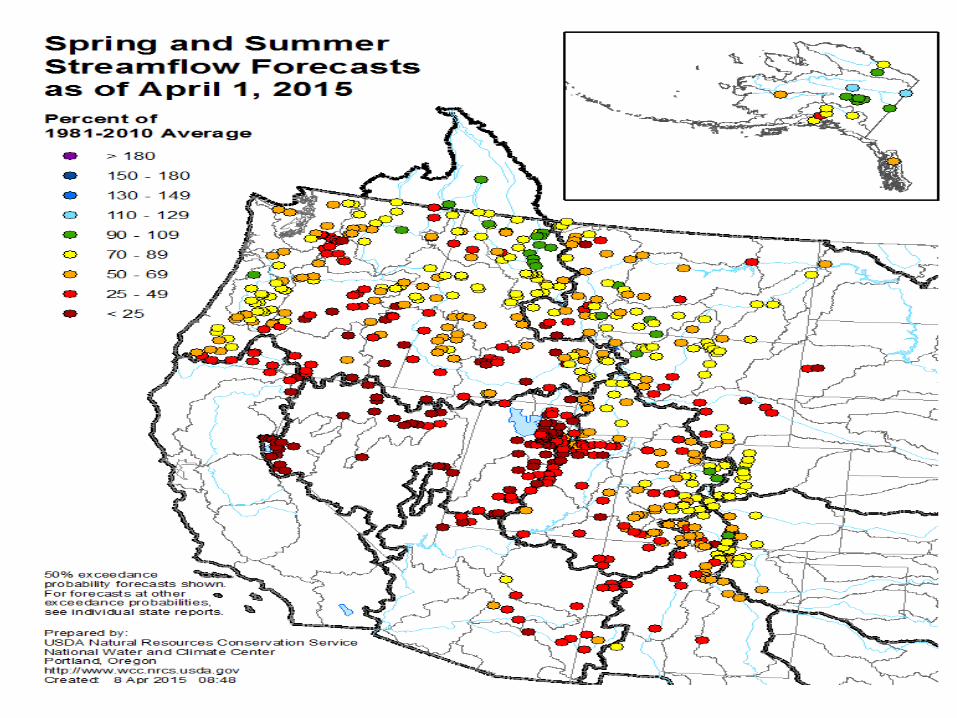
• Pacific Northwest Snowpack & Water Supply Update • Water Year to Date Precipitating vs. Snow Water Equivalent• Impacts of Rain vs. Snow to Produce Adequate Irrigation Supplies
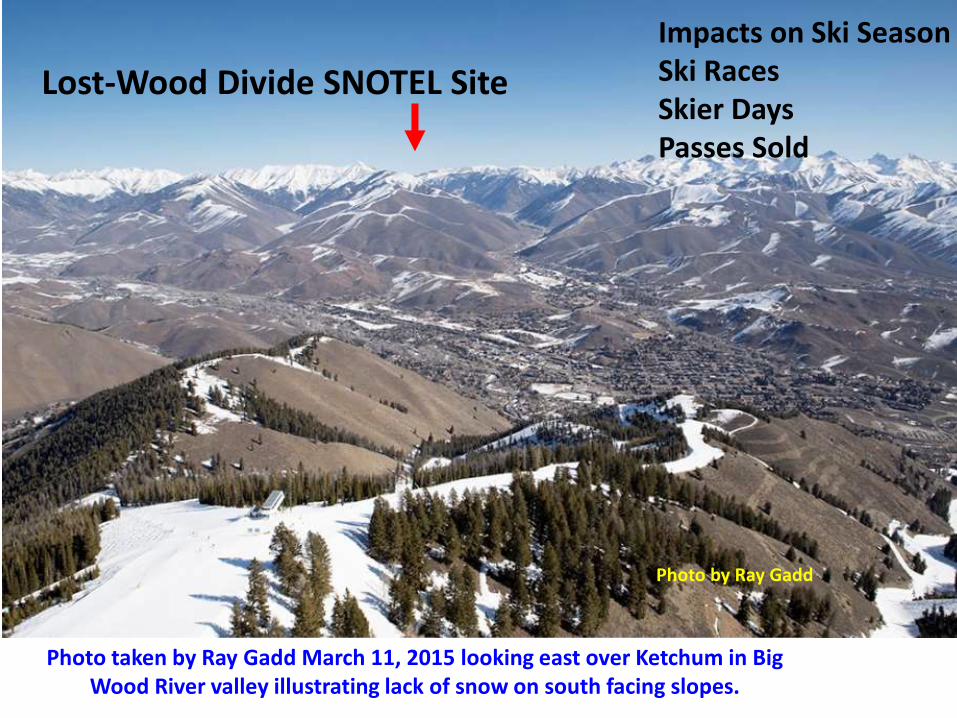
Photo by Ray Gadd
Photo taken by Ray Gadd March 11, 2015 looking east over Ketchum in Big Wood River valley illustrating lack of snow on south facing slopes.
Lost-Wood Divide SNOTEL Site
Impacts on Ski SeasonSki RacesSkier DaysPasses Sold
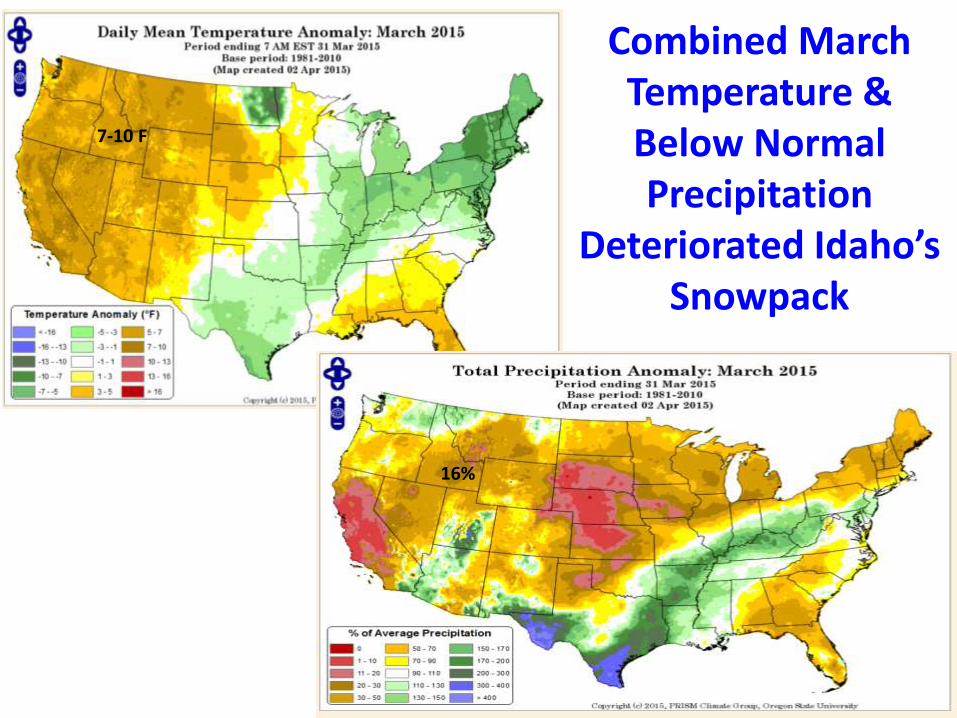
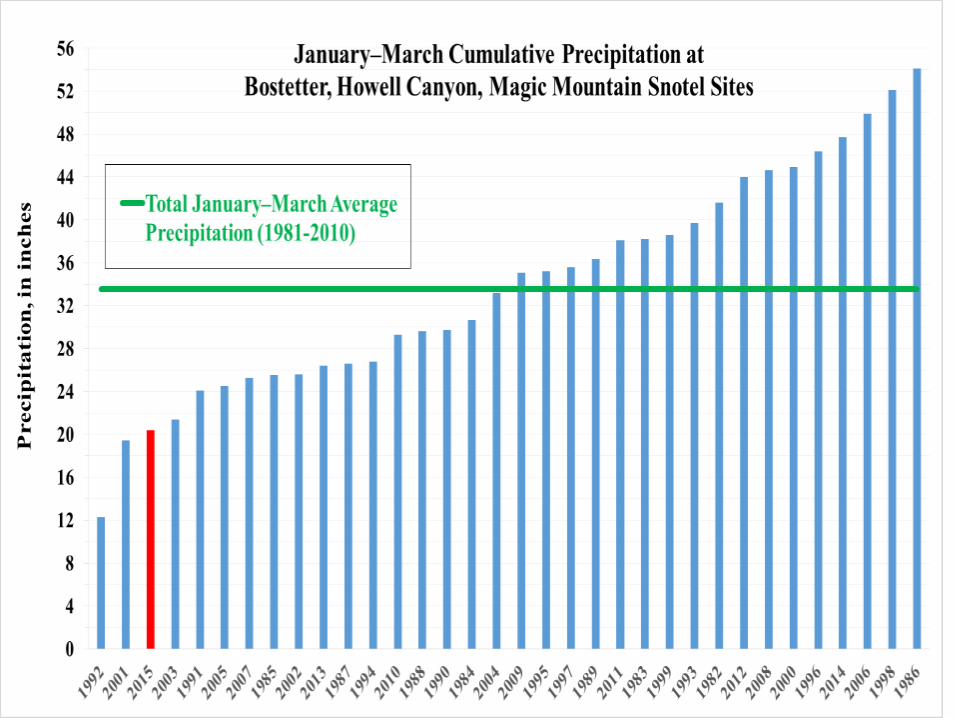
Combined March Temperature & Below Normal Precipitation
Deteriorated Idaho’s Snowpack
7-10 F
16%
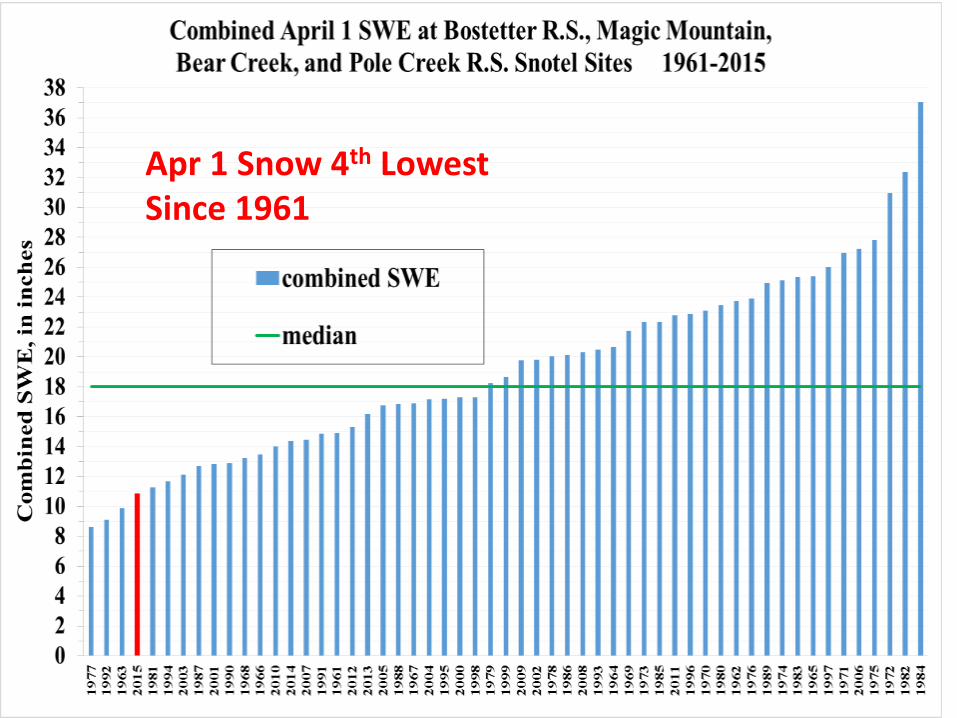
Apr 1 Snow 4th Lowest Since 1961
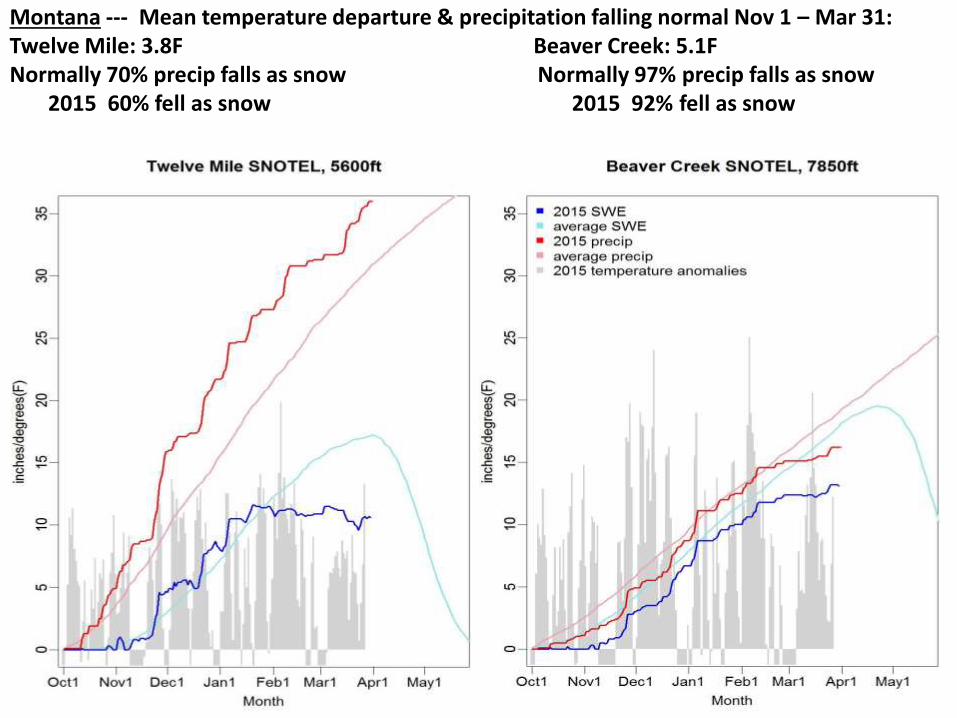
Montana --- Mean temperature departure & precipitation falling normal Nov 1 – Mar 31: Twelve Mile: 3.8F Beaver Creek: 5.1FNormally 70% precip falls as snow Normally 97% precip falls as snow
2015 60% fell as snow 2015 92% fell as snow
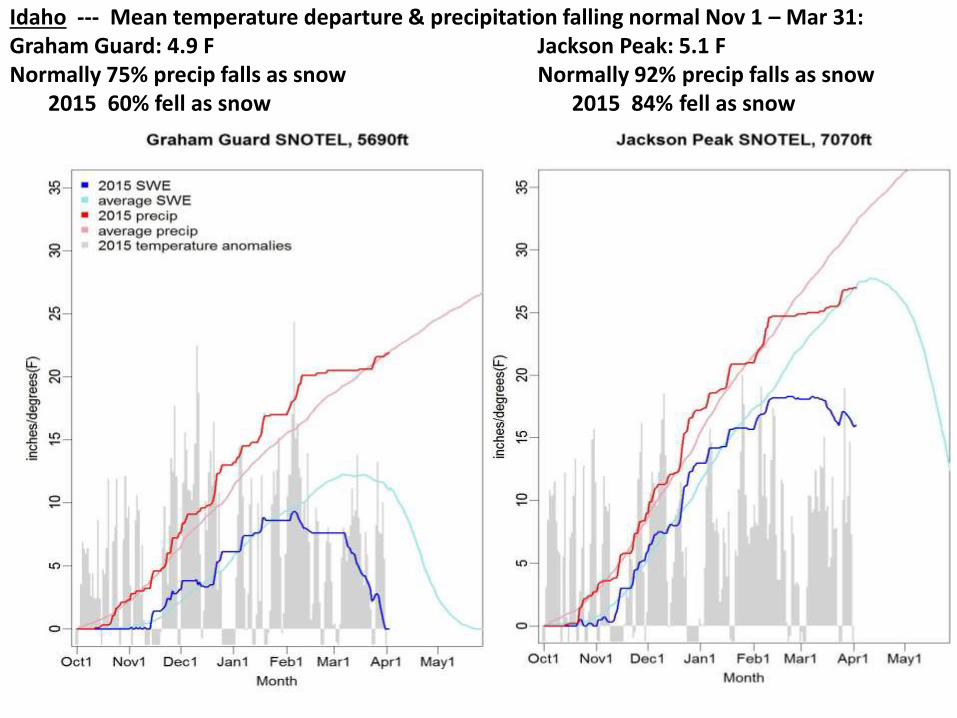
Idaho --- Mean temperature departure & precipitation falling normal Nov 1 – Mar 31: Graham Guard: 4.9 F Jackson Peak: 5.1 FNormally 75% precip falls as snow Normally 92% precip falls as snow
2015 60% fell as snow 2015 84% fell as snow
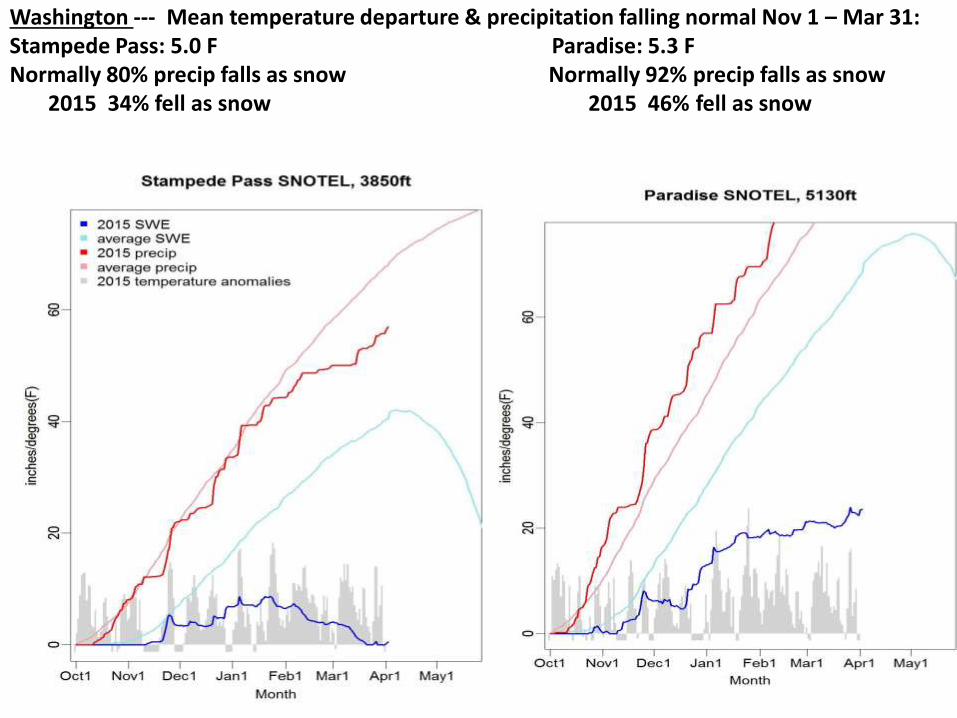
Washington --- Mean temperature departure & precipitation falling normal Nov 1 – Mar 31: Stampede Pass: 5.0 F Paradise: 5.3 FNormally 80% precip falls as snow Normally 92% precip falls as snow
2015 34% fell as snow 2015 46% fell as snow
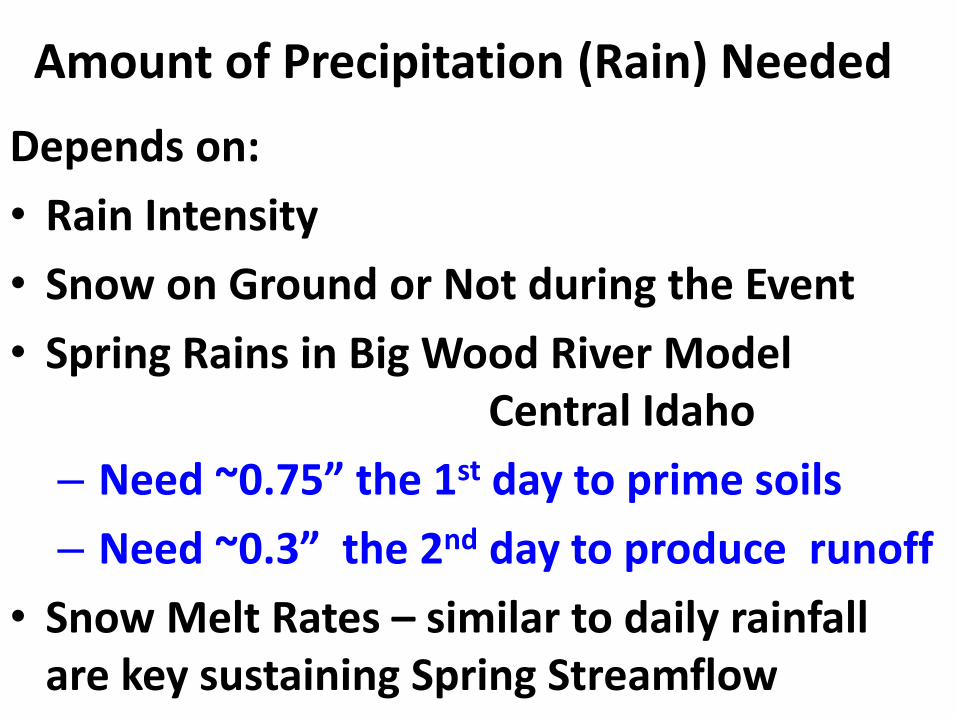
Amount of Precipitation (Rain) Needed
Depends on:
• Rain Intensity
• Snow on Ground or Not during the Event
• Spring Rains in Big Wood River Model Central Idaho
– Need ~0.75” the 1st day to prime soils
– Need ~0.3” the 2nd day to produce runoff
• Snow Melt Rates – similar to daily rainfall are key sustaining Spring Streamflow
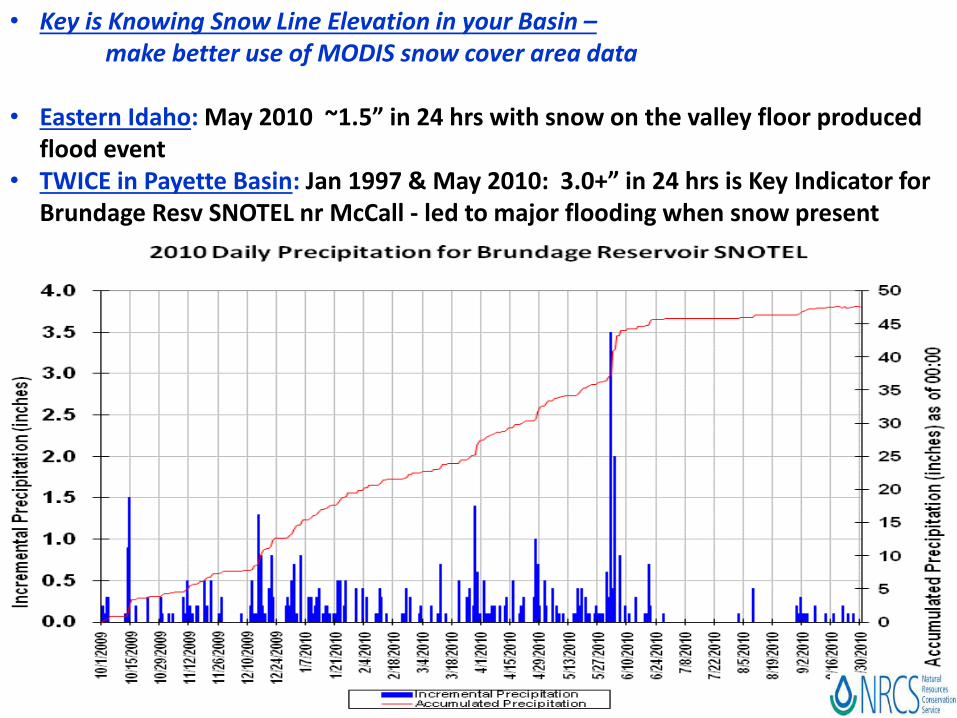
• Key is Knowing Snow Line Elevation in your Basin –make better use of MODIS snow cover area data
• Eastern Idaho: May 2010 ~1.5” in 24 hrs with snow on the valley floor produced flood event
• TWICE in Payette Basin: Jan 1997 & May 2010: 3.0+” in 24 hrs is Key Indicator for Brundage Resv SNOTEL nr McCall - led to major flooding when snow present
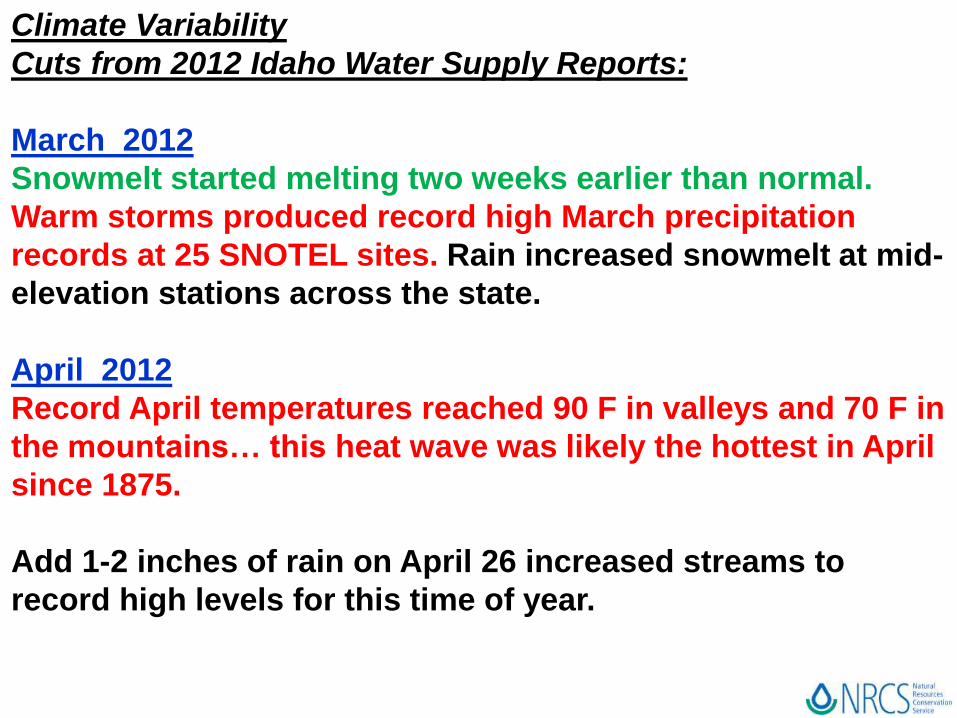
Climate Variability
Cuts from 2012 Idaho Water Supply Reports:
March 2012
Snowmelt started melting two weeks earlier than normal.
Warm storms produced record high March precipitation
records at 25 SNOTEL sites. Rain increased snowmelt at mid-
elevation stations across the state.
April 2012
Record April temperatures reached 90 F in valleys and 70 F in
the mountains… this heat wave was likely the hottest in April
since 1875.
Add 1-2 inches of rain on April 26 increased streams to
record high levels for this time of year.
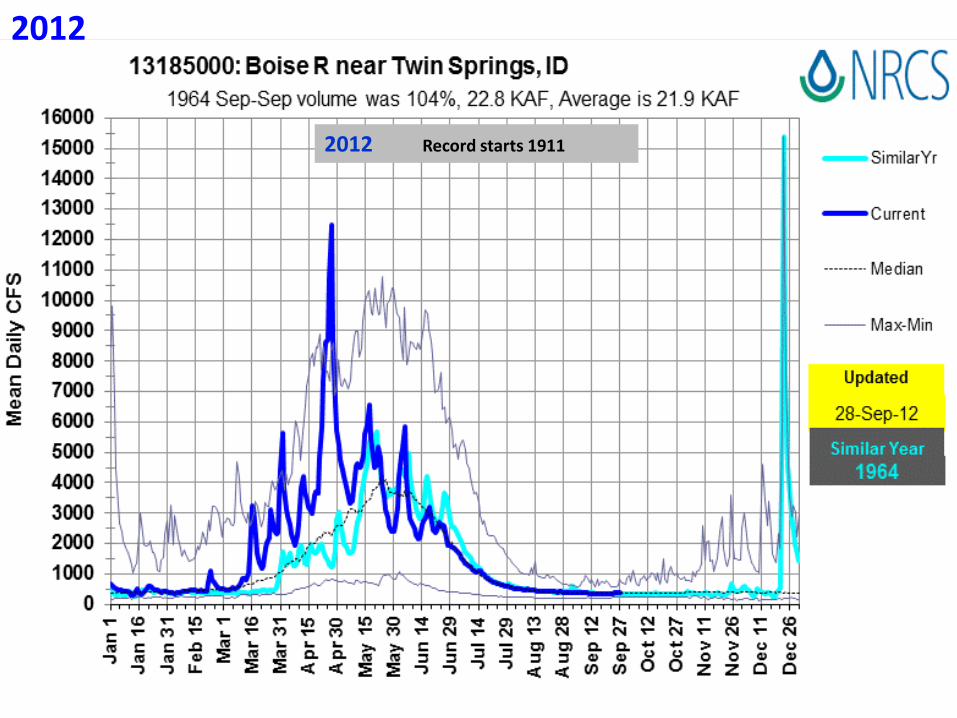
2012 Record starts 1911
2012
May
1
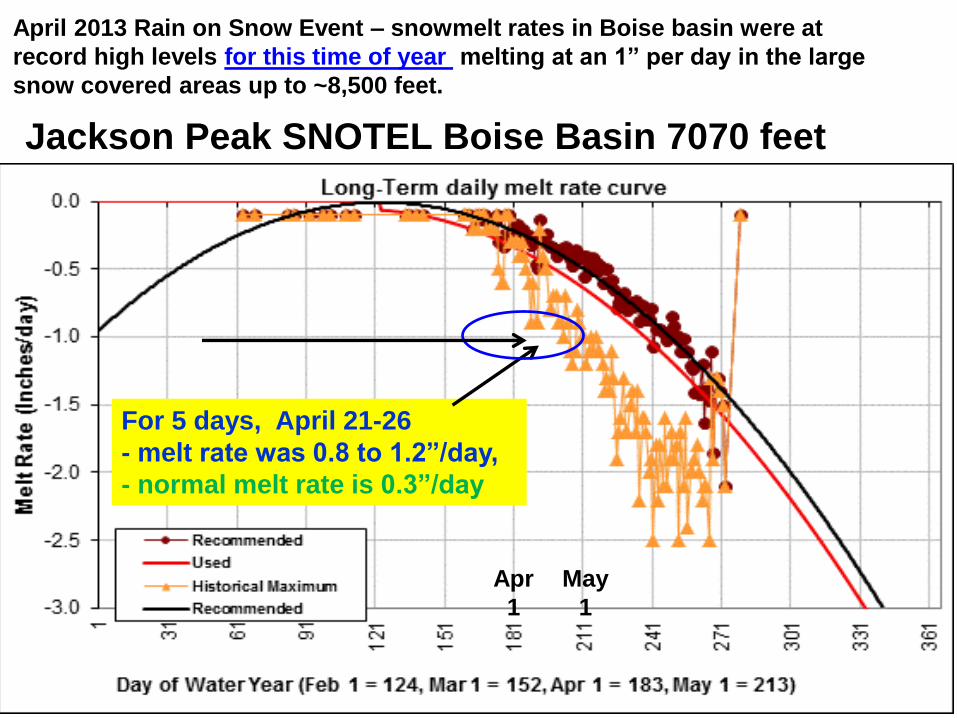
Jackson Peak SNOTEL Boise Basin 7070 feet
April 2013 Rain on Snow Event – snowmelt rates in Boise basin were at
record high levels for this time of year melting at an 1” per day in the large
snow covered areas up to ~8,500 feet.
For 5 days, April 21-26
- melt rate was 0.8 to 1.2”/day,
- normal melt rate is 0.3”/day
Apr
1
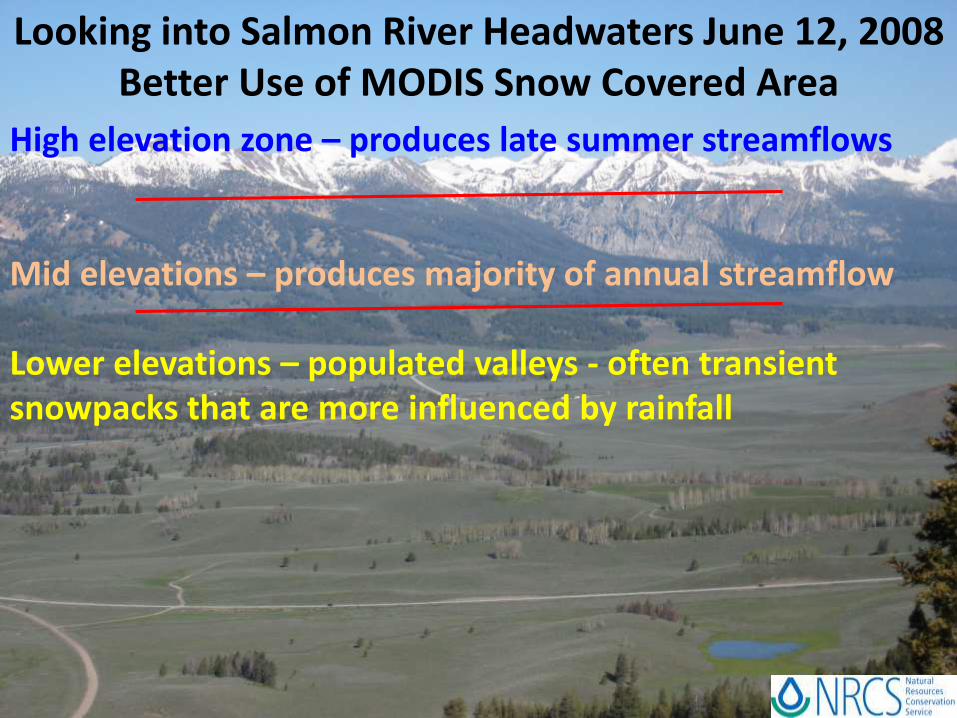
Looking into Salmon River Headwaters June 12, 2008Better Use of MODIS Snow Covered Area
High elevation zone – produces late summer streamflows
Mid elevations – produces majority of annual streamflow
Lower elevations – populated valleys - often transient snowpacks that are more influenced by rainfall
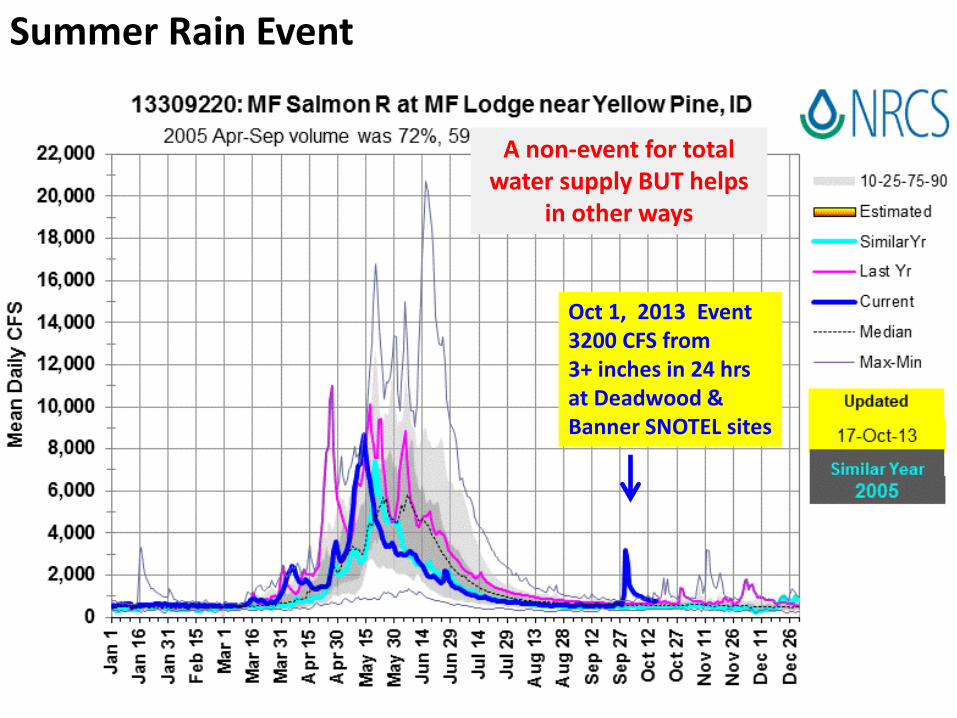
Oct 1, 2013 Event 3200 CFS from 3+ inches in 24 hrsat Deadwood & Banner SNOTEL sites
A non-event for total water supply BUT helps
in other ways
Summer Rain Event
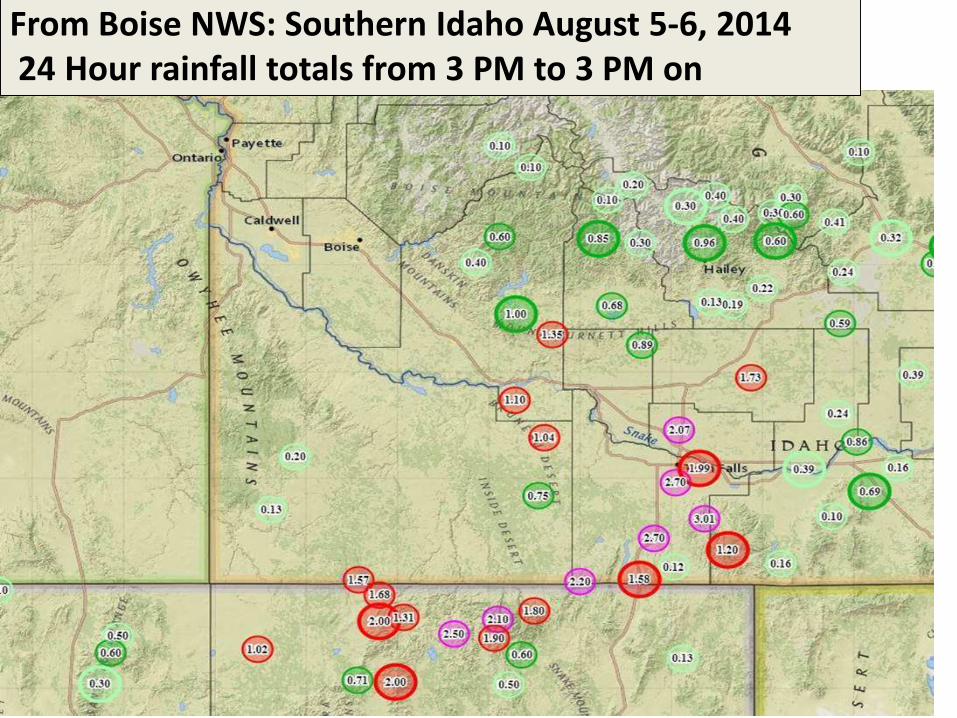
From Boise NWS: Southern Idaho August 5-6, 201424 Hour rainfall totals from 3 PM to 3 PM on
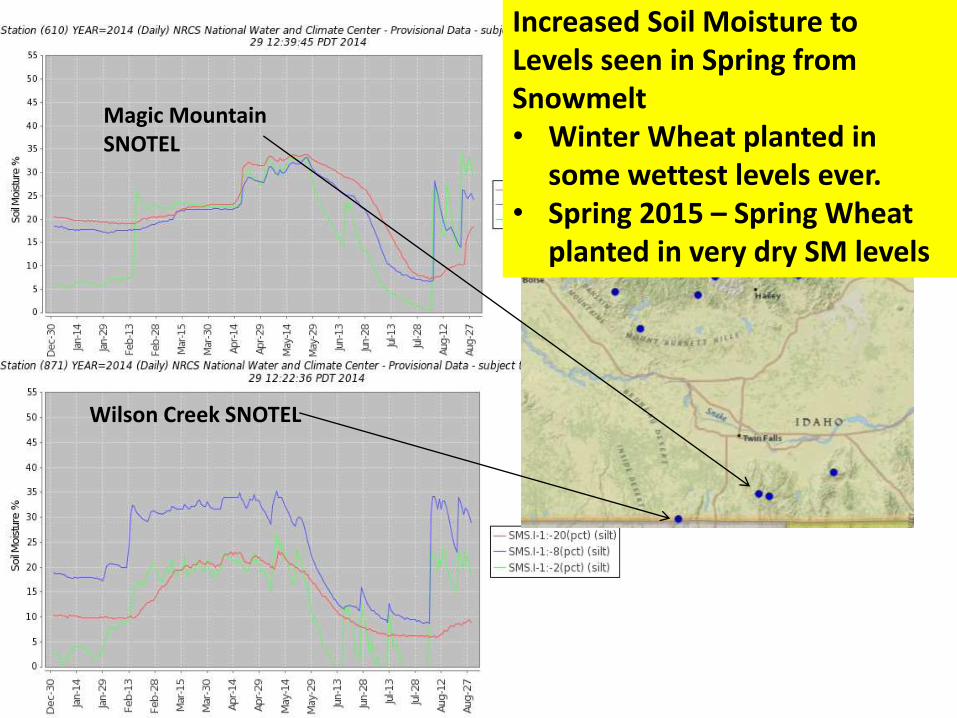
Wilson Creek SNOTEL
Magic Mountain SNOTEL
Increased Soil Moisture to Levels seen in Spring from Snowmelt • Winter Wheat planted in
some wettest levels ever.• Spring 2015 – Spring Wheat
planted in very dry SM levels
0
50
100
150
200
250
300
Jan Feb Mar Apr May Jun Jul Aug Sep Oct Nov Dec
[mm
]
Monthly Evapotranspiration at the Twin Falls Agriment Station
1991
1992
1993
1994
1995
1996
1997
1998
1999
2000
2001
2002
2003
2004
2005
2006
2007
2008
2009
2010
0
2,000
4,000
6,000
8,000
10,000
12,000
CFS
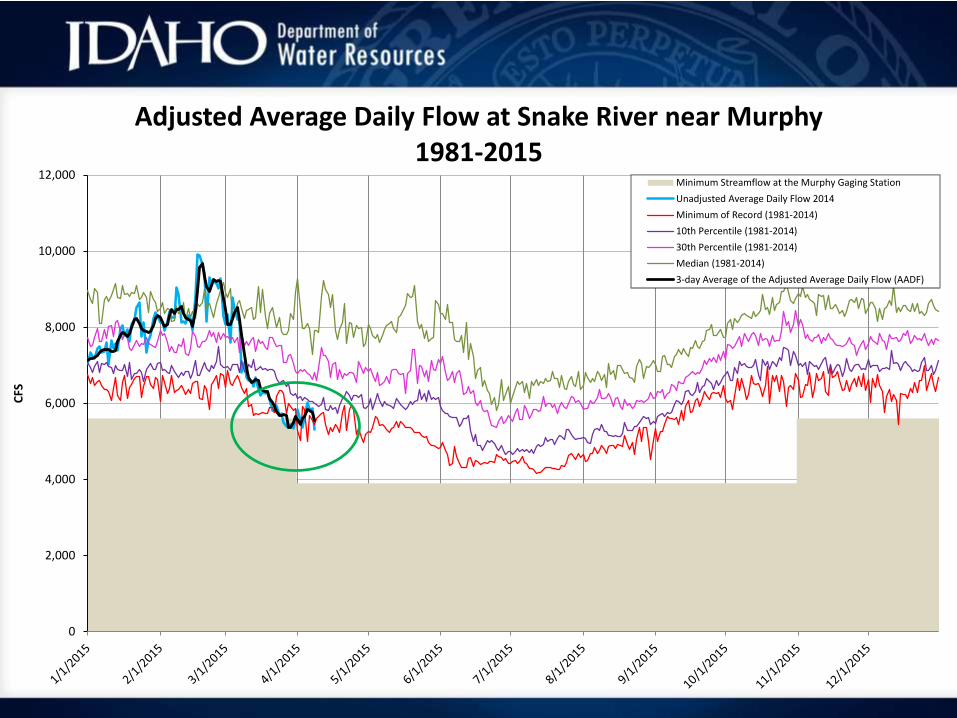
Adjusted Average Daily Flow at Snake River near Murphy 1981-2015
Minimum Streamflow at the Murphy Gaging Station
Unadjusted Average Daily Flow 2014
Minimum of Record (1981-2014)
10th Percentile (1981-2014)
30th Percentile (1981-2014)
Median (1981-2014)
3-day Average of the Adjusted Average Daily Flow (AADF)
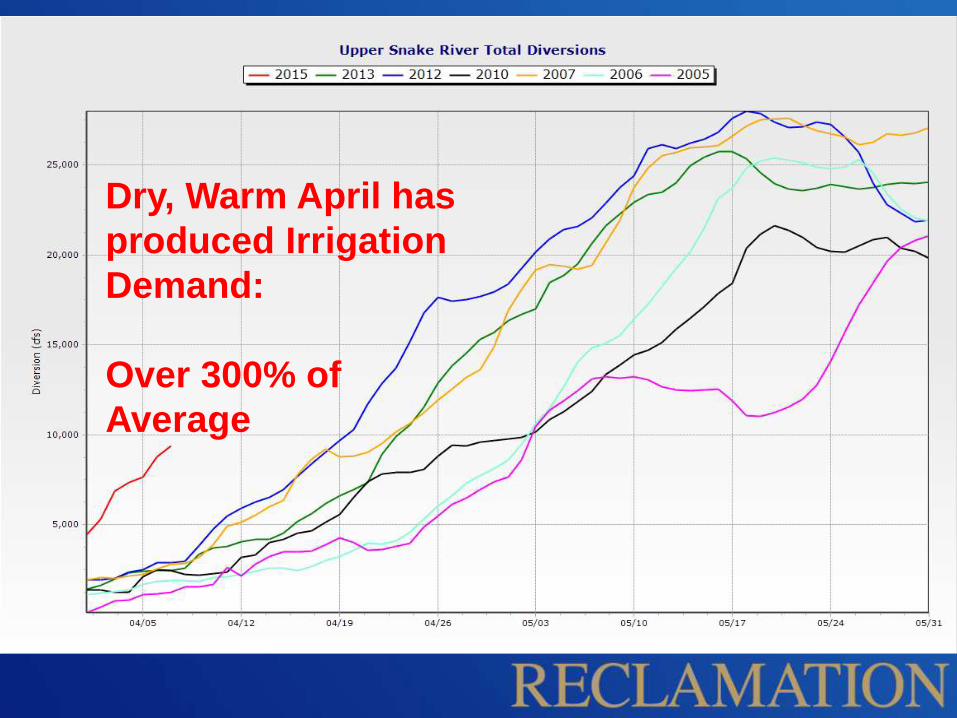
Dry, Warm April has
produced Irrigation
Demand:
Over 300% of
Average
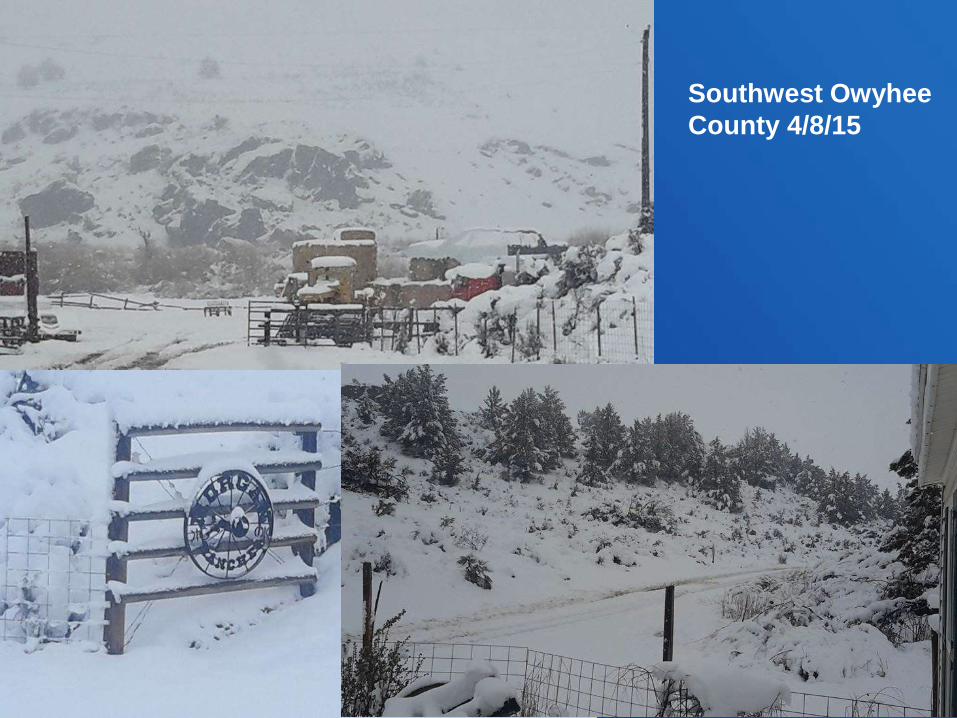
Southwest Owyhee
County 4/8/15
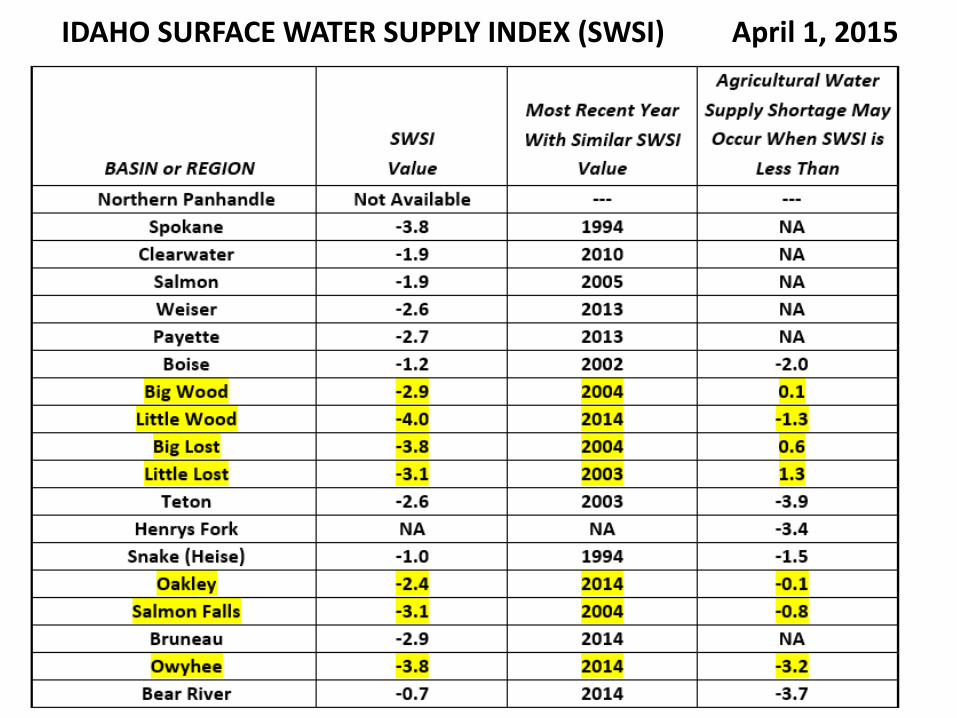
IDAHO SURFACE WATER SUPPLY INDEX (SWSI) April 1, 2015
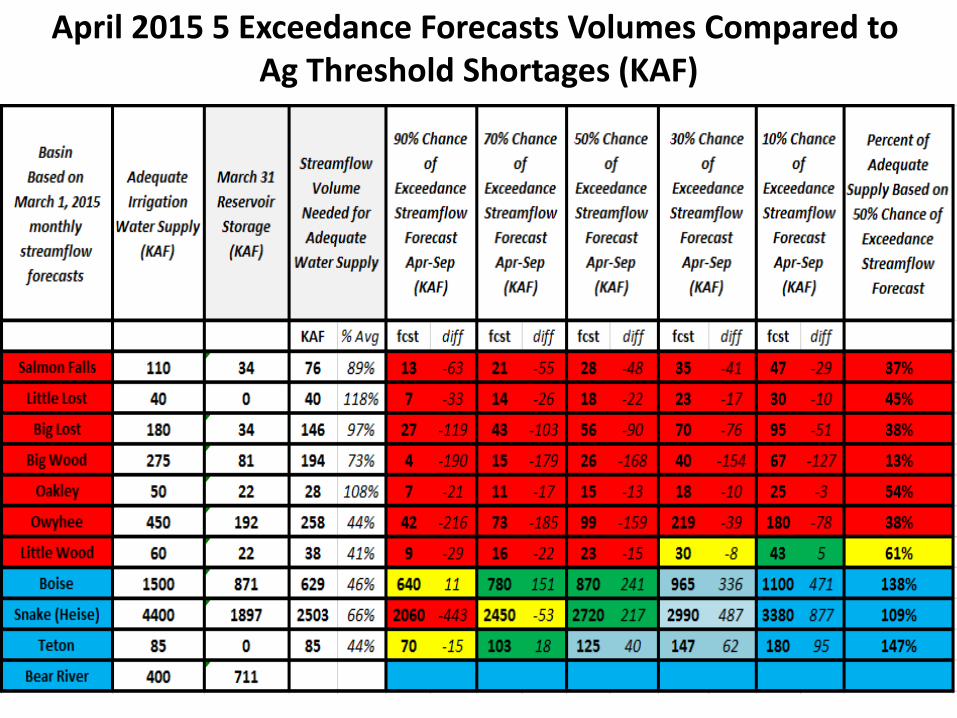
April 2015 5 Exceedance Forecasts Volumes Compared to Ag Threshold Shortages (KAF)
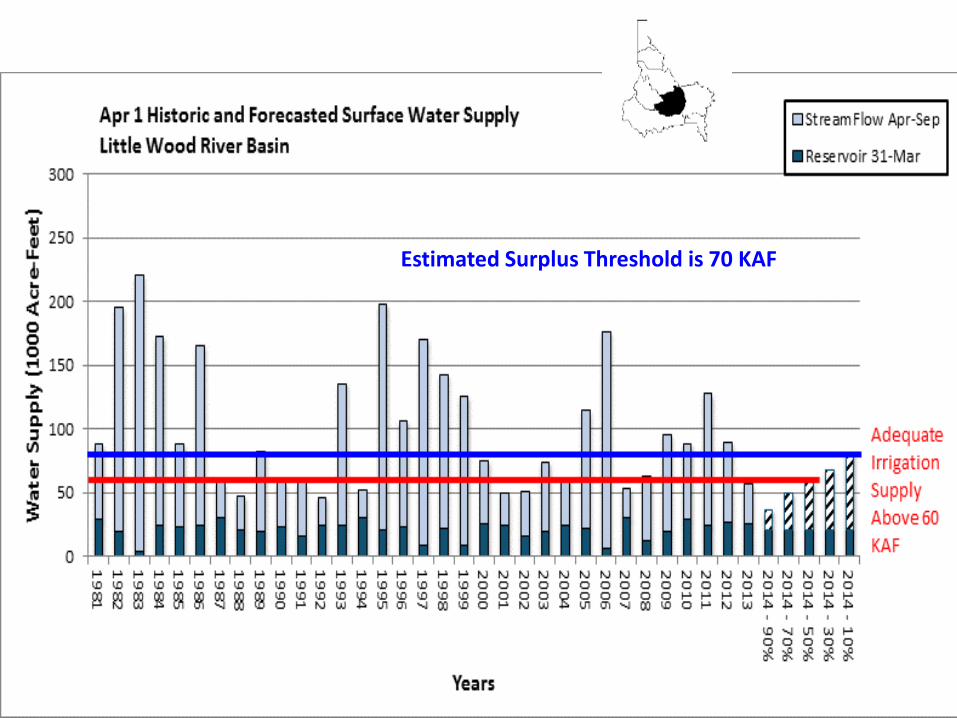
Estimated Surplus Threshold is 70 KAF
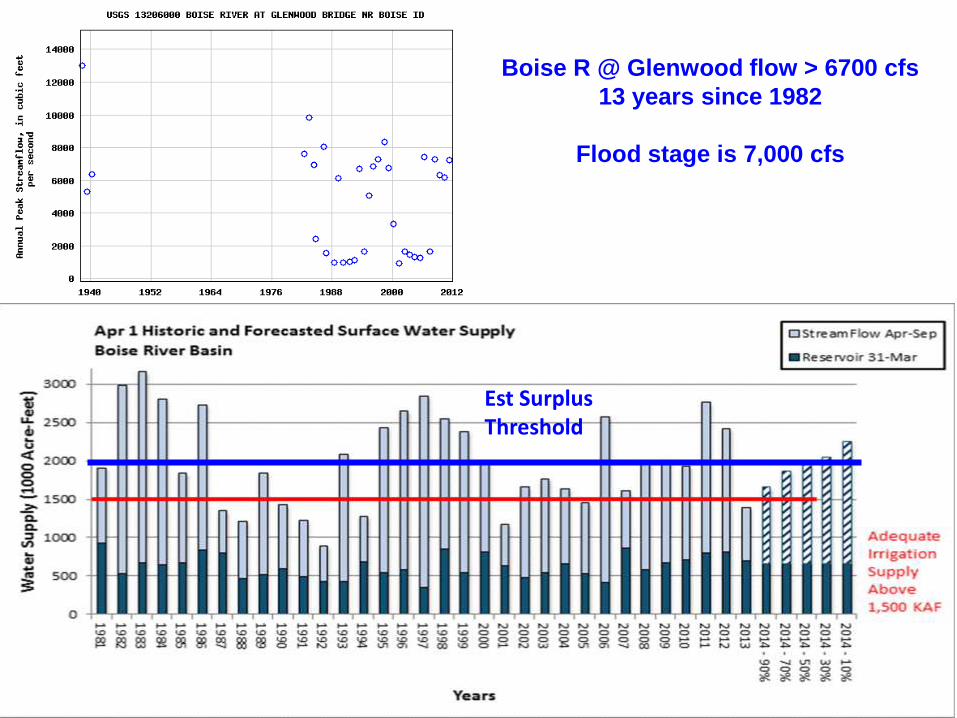
Boise R @ Glenwood flow > 6700 cfs
13 years since 1982
Flood stage is 7,000 cfs
Est Surplus Threshold
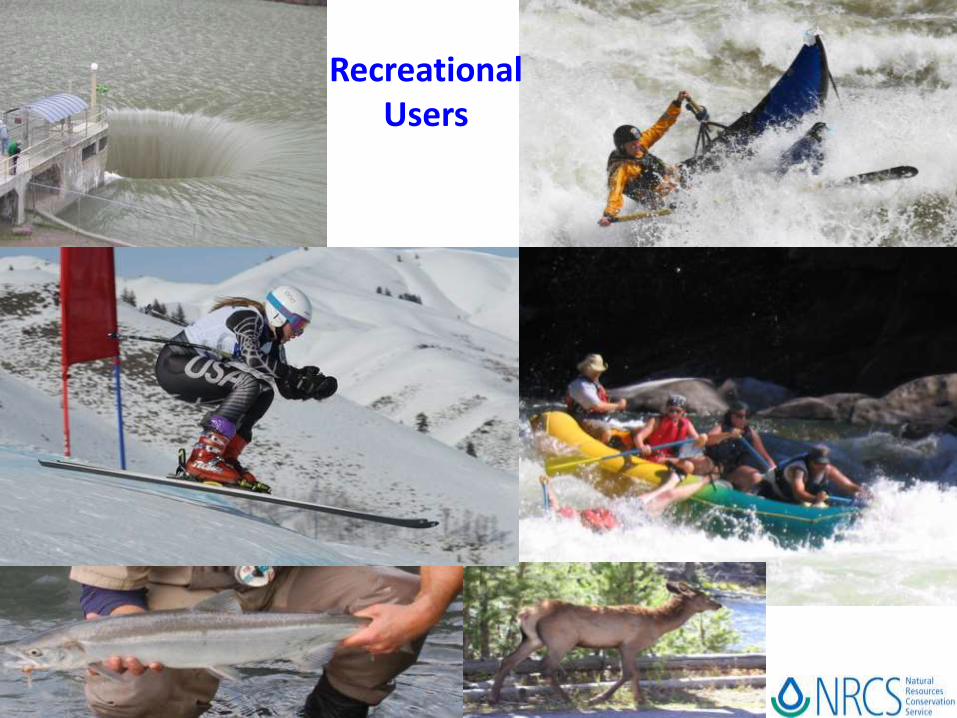
Recreational Users
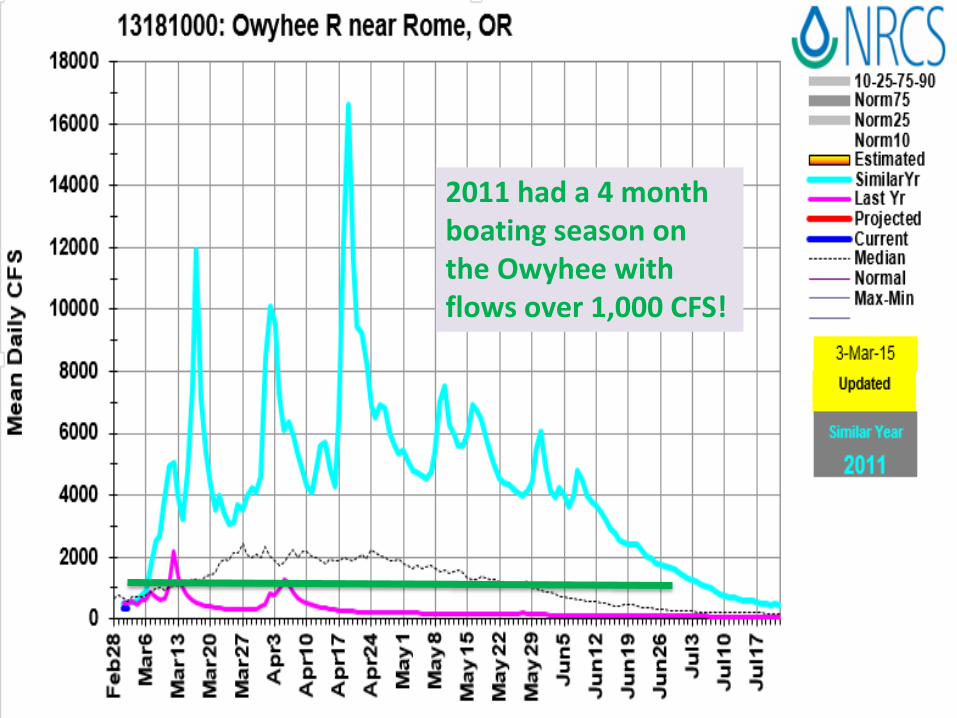
2011 had a 4 month boating season on the Owyhee with flows over 1,000 CFS!
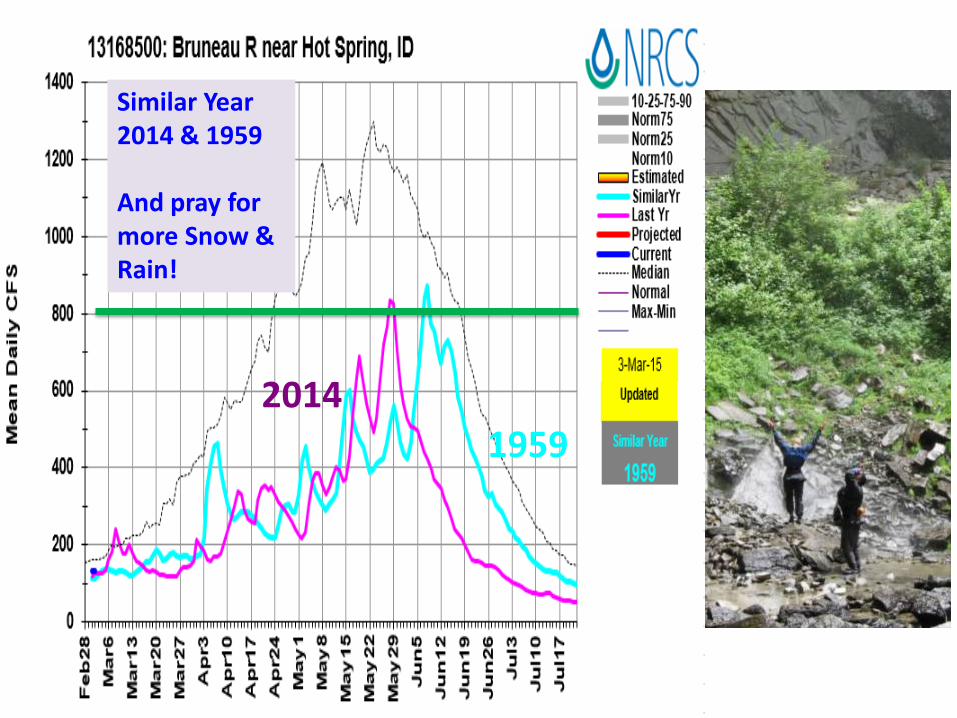
Similar Year 2014 & 1959
And pray for more Snow & Rain!
20141959
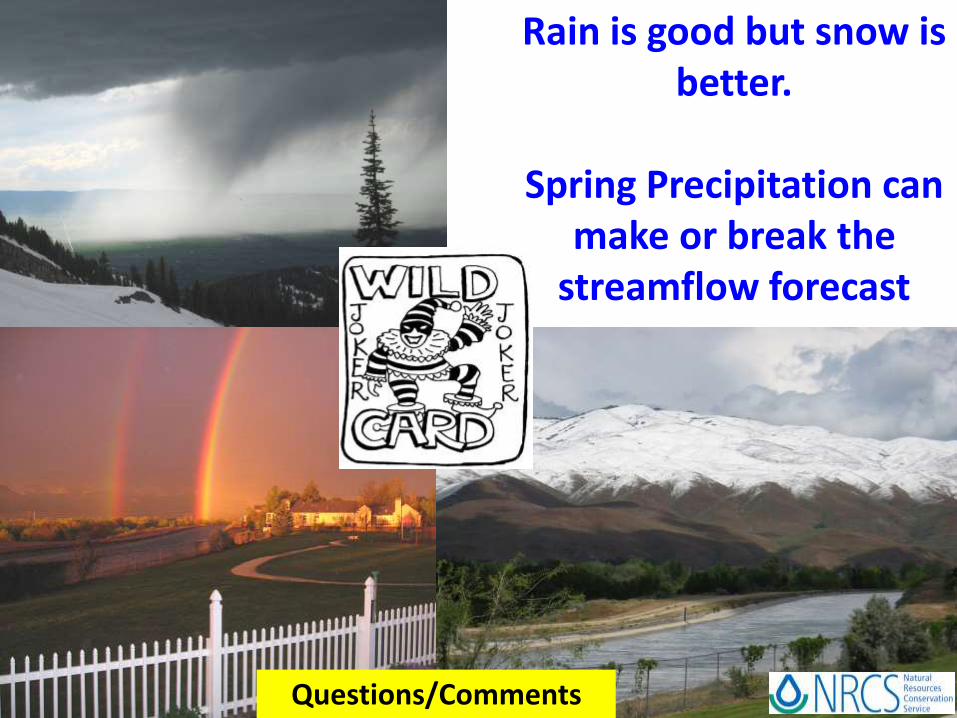
Rain is good but snow is better.
Spring Precipitation can make or break the
streamflow forecast
Questions/Comments