Embed Size (px)
Citation preview
One Health approaches to different problems: Work at the International Livestock Research Institute
Johanna Lindahl One Health Sweden
8 April 2015, Uppsala, Sweden
1
Today’s talk
1. What is ILRI?
2. Why an international livestock research institute?
3. One health, Ecohealth and health
4. One health projects at ILRI
A history of international livestock research
• International Laboratory for Research on Animal Diseases
• International Livestock Center in Africa• Merged in 1994 - ILRI
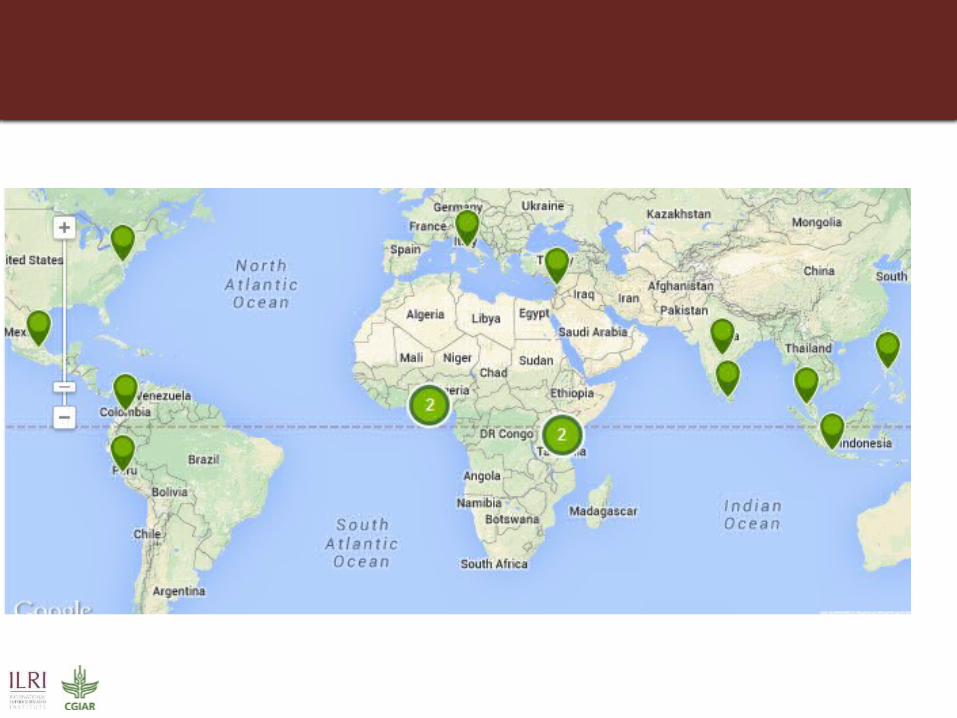
CGIAR
• Consultative Group for International Agricultural Research- 1971
• CGIAR Consortium of International Agricultural Research Centers- 2011
• Today 15 centers
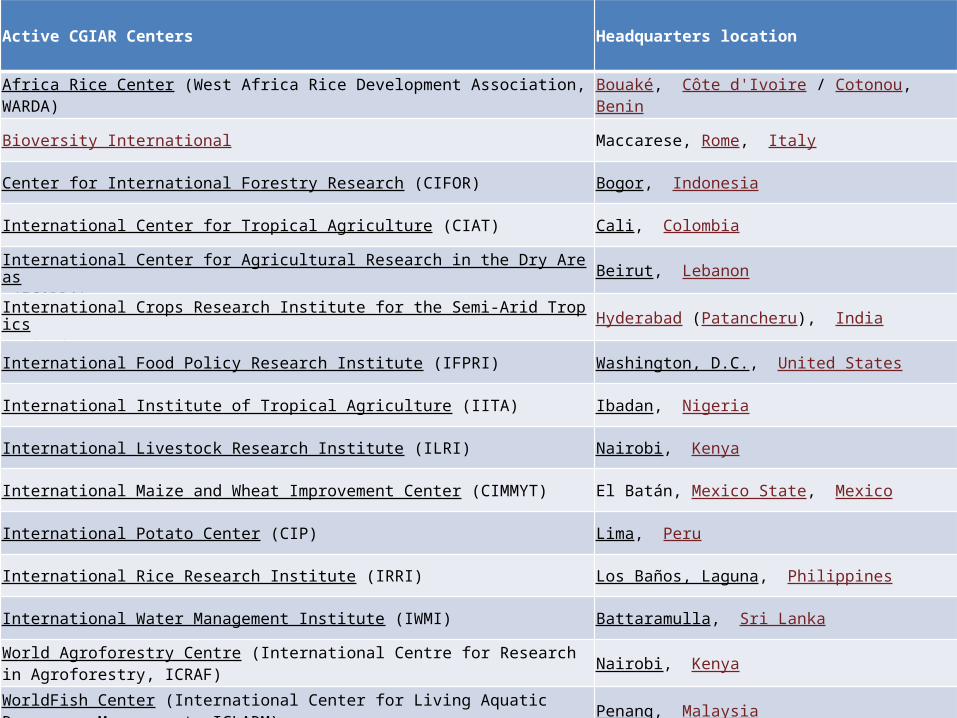
Active CGIAR Centers Headquarters location
Africa Rice Center (West Africa Rice Development Association, WARDA) Bouaké, Côte d'Ivoire / Cotonou, Benin
Bioversity International Maccarese, Rome, Italy
Center for International Forestry Research (CIFOR) Bogor, Indonesia
International Center for Tropical Agriculture (CIAT) Cali, Colombia
International Center for Agricultural Research in the Dry Areas (ICARDA) Beirut, Lebanon
International Crops Research Institute for the Semi-Arid Tropics (ICRISAT) Hyderabad (Patancheru), India
International Food Policy Research Institute (IFPRI) Washington, D.C., United States
International Institute of Tropical Agriculture (IITA) Ibadan, Nigeria
International Livestock Research Institute (ILRI) Nairobi, Kenya
International Maize and Wheat Improvement Center (CIMMYT) El Batán, Mexico State, Mexico
International Potato Center (CIP) Lima, Peru
International Rice Research Institute (IRRI) Los Baños, Laguna, Philippines
International Water Management Institute (IWMI) Battaramulla, Sri Lanka
World Agroforestry Centre (International Centre for Research in Agroforestry, ICRAF) Nairobi, Kenya
WorldFish Center (International Center for Living Aquatic Resources Management, ICLARM) Penang, Malaysia
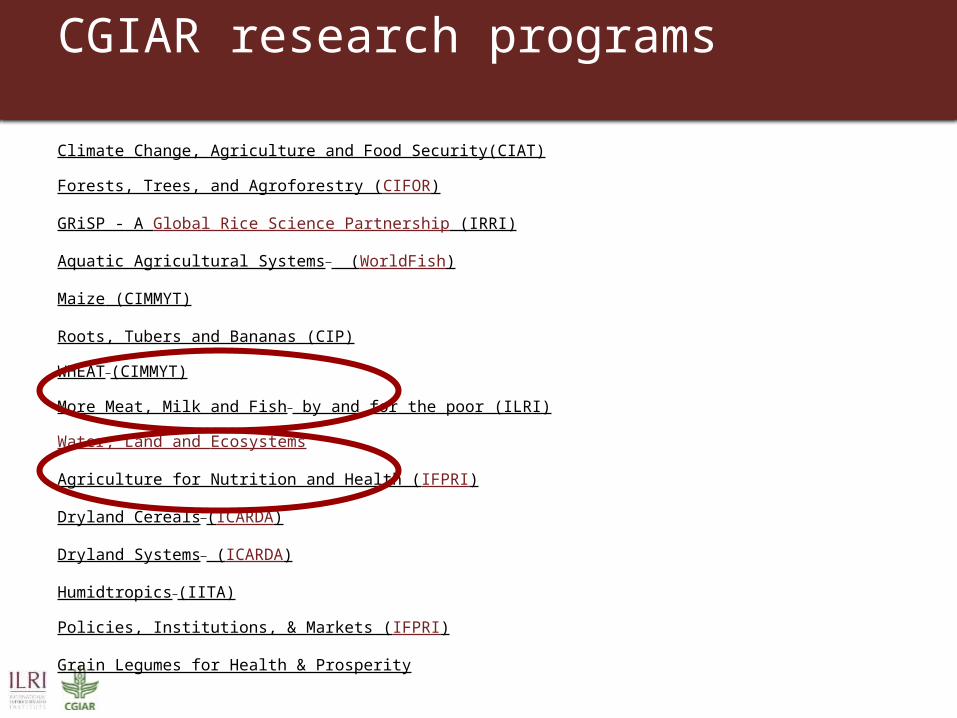
CGIAR research programs
Climate Change, Agriculture and Food Security(CIAT)
Forests, Trees, and Agroforestry (CIFOR)
GRiSP - A Global Rice Science Partnership (IRRI)
Aquatic Agricultural Systems (WorldFish)
Maize (CIMMYT)
Roots, Tubers and Bananas (CIP)
WHEAT (CIMMYT)
More Meat, Milk and Fish by and for the poor (ILRI)
Water, Land and Ecosystems
Agriculture for Nutrition and Health (IFPRI)
Dryland Cereals (ICARDA)
Dryland Systems (ICARDA)
Humidtropics (IITA)
Policies, Institutions, & Markets (IFPRI)
Grain Legumes for Health & Prosperity
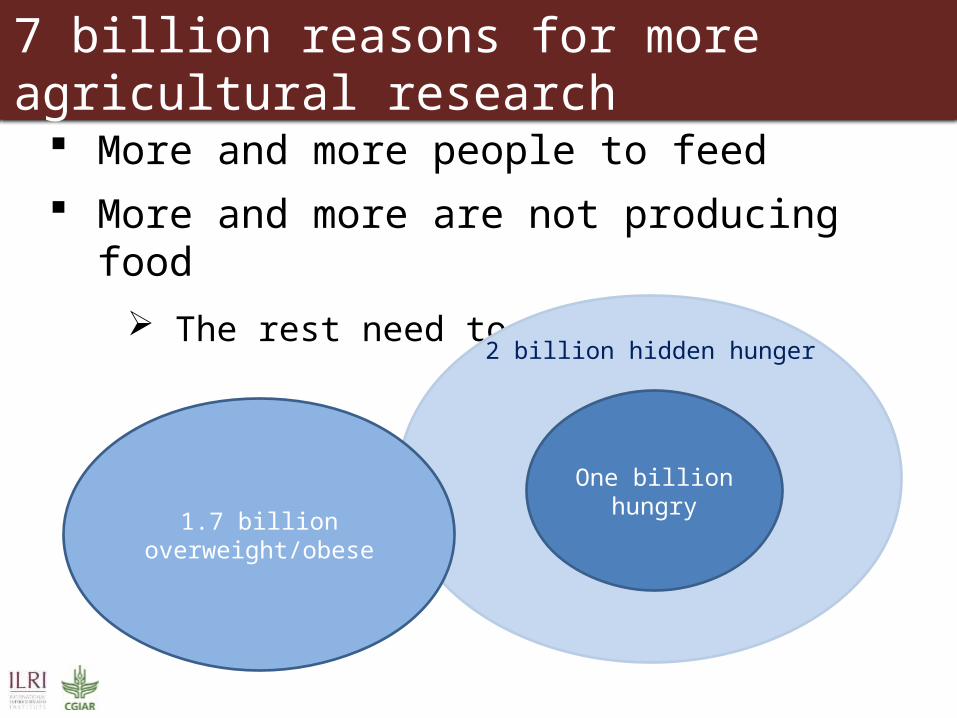
7 billion reasons for more agricultural research
More and more people to feed More and more are not producing food
The rest need to produce more
2 billion hidden hunger
One billion hungry1.7 billion
overweight/obese
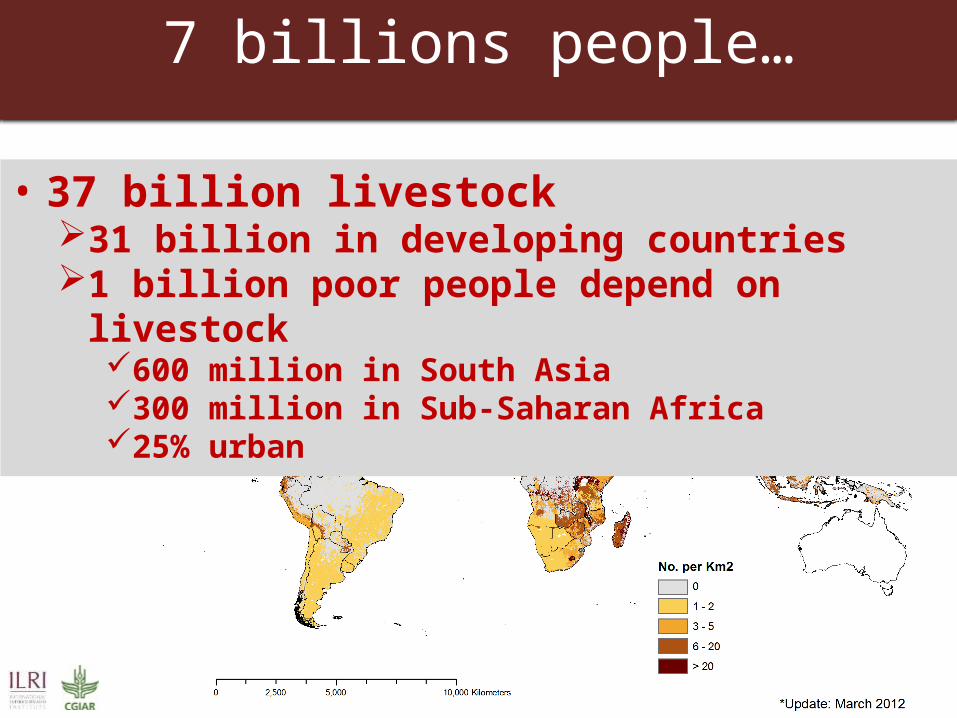
7 billions people…
• 37 billion livestock31 billion in developing countries1 billion poor people depend on livestock
600 million in South Asia300 million in Sub-Saharan Africa25% urban
Bridging the gaps between demand and supply – global level
• 60% more food than is produced now will be needed• 75% of this must come from producing more food from the same
amount of land• The higher production must be achieved while reducing poverty
and addressing environmental, social and health concerns• This greater production will have to be achieved with
temperatures that may be 2−4 degrees warmer than today’s
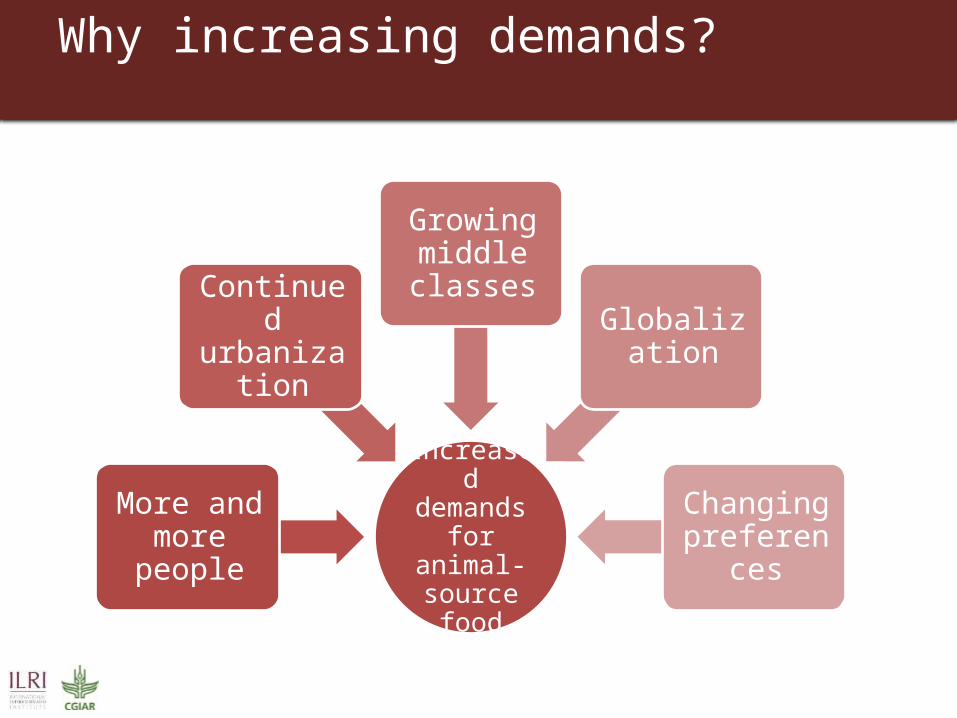
Why increasing demands?
Increased demands
for animal-source food
More and more people
Continued urbanization
Growing middle classes
Globalization
Changing preferences

The livestock revolution
• 1970-Mid 1990s • Demand-driven, unlike the
green revolution
1963 1973 1983 1993 2003 2025 20500
100200300400500600700800900
100011001200
Eggs
Meat -total
Fish
Vegetables
Milk (whole)
Fruits
Pulses
Figure 2: Increase in per capita consumption of perishables and pulses in developing countries with 1963 as index year (FAO, 2009).
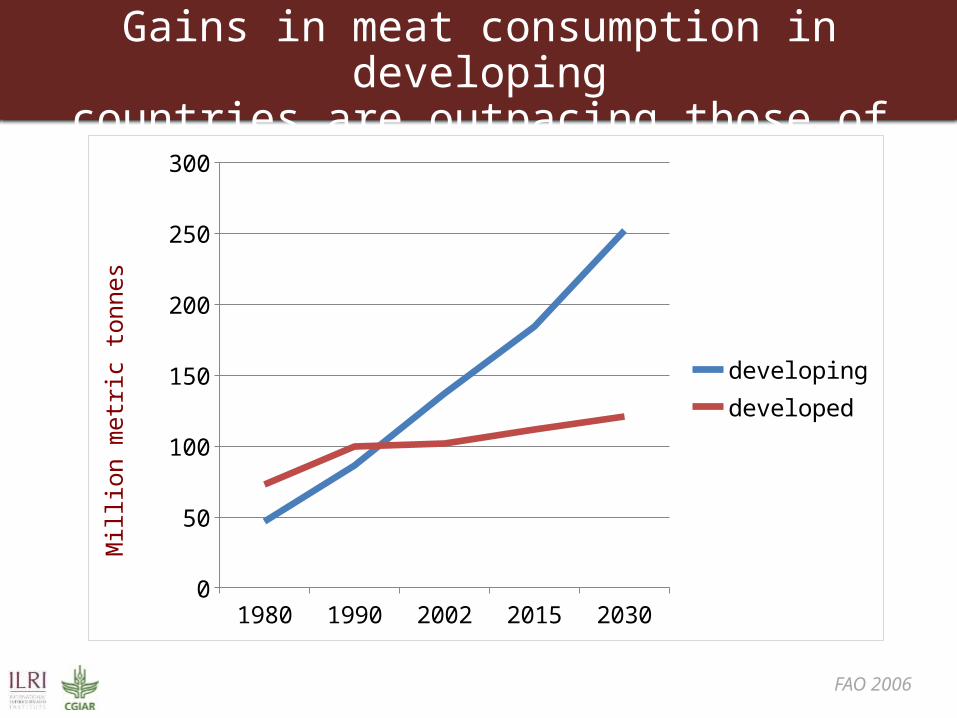
Gains in meat consumption in developingcountries are outpacing those of developed
1980 1990 2002 2015 20300
50
100
150
200
250
300
developingdeveloped
Milli
on m
etric
tonn
es
FAO 2006
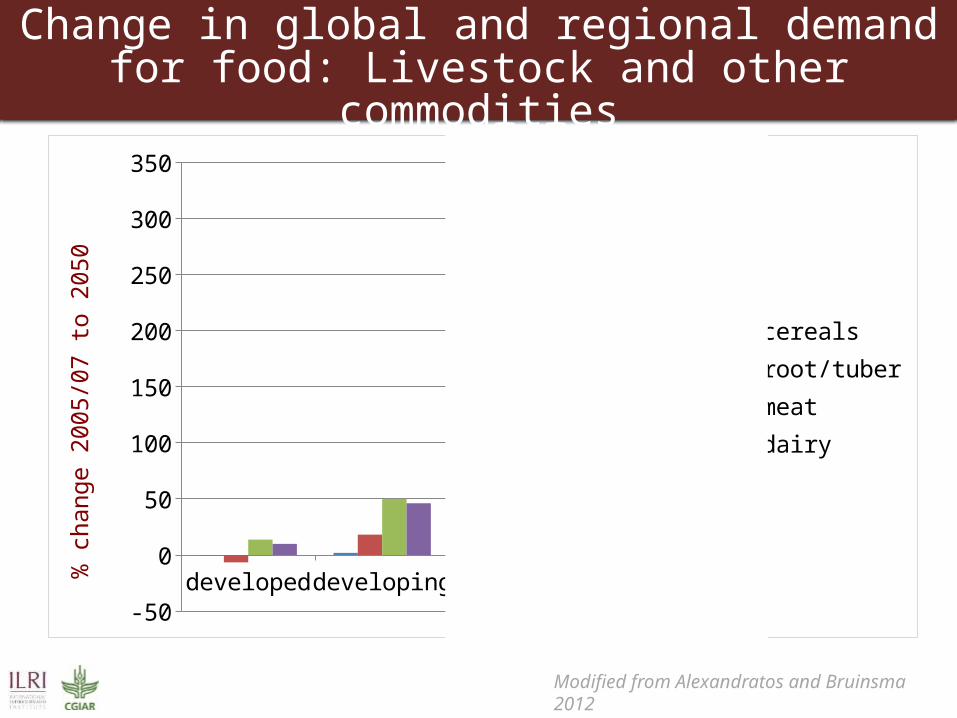
Change in global and regional demand for food: Livestock and other commodities
developed developing SSA SA-50
0
50
100
150
200
250
300
350
cerealsroot/tubermeatdairy
% ch
ange
200
5/07
to 2
050
Modified from Alexandratos and Bruinsma 2012
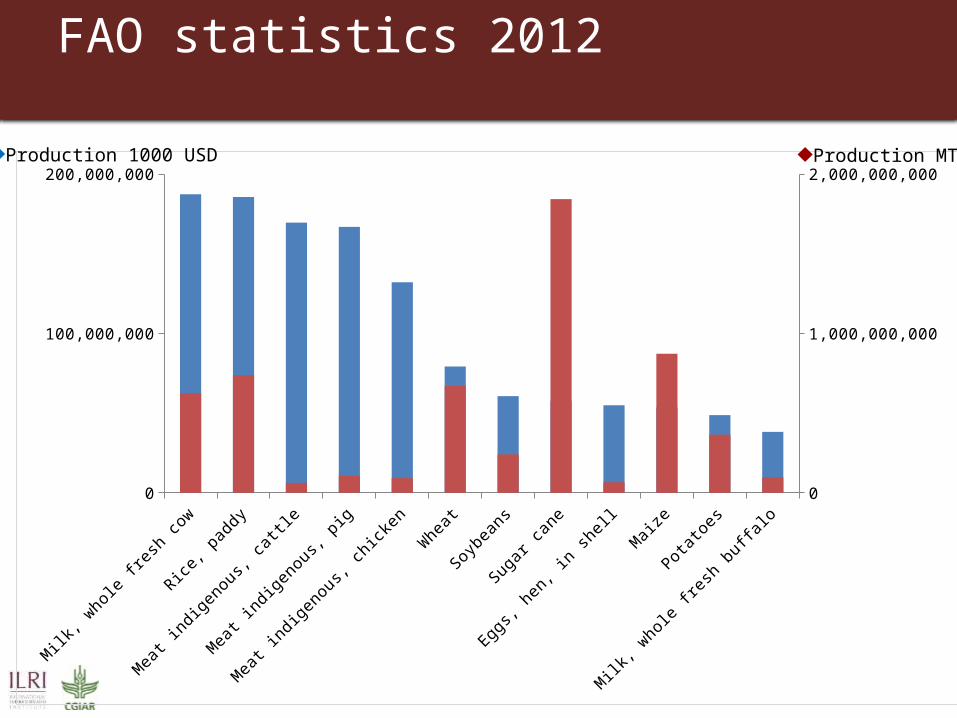
FAO statistics 2012
Milk, w
hole fresh co
w
Rice, p
addy
Meat indigenous, c
attle
Meat indigenous, p
ig
Meat indigenous, c
hicken
Wheat
Soyb
eans
Sugar c
ane
Eggs, hen, in
shell
Maize
Potatoes
Milk, w
hole fresh buffalo
0
100,000,000
200,000,000
0
1,000,000,000
2,000,000,000Production 1000 USD Production MT
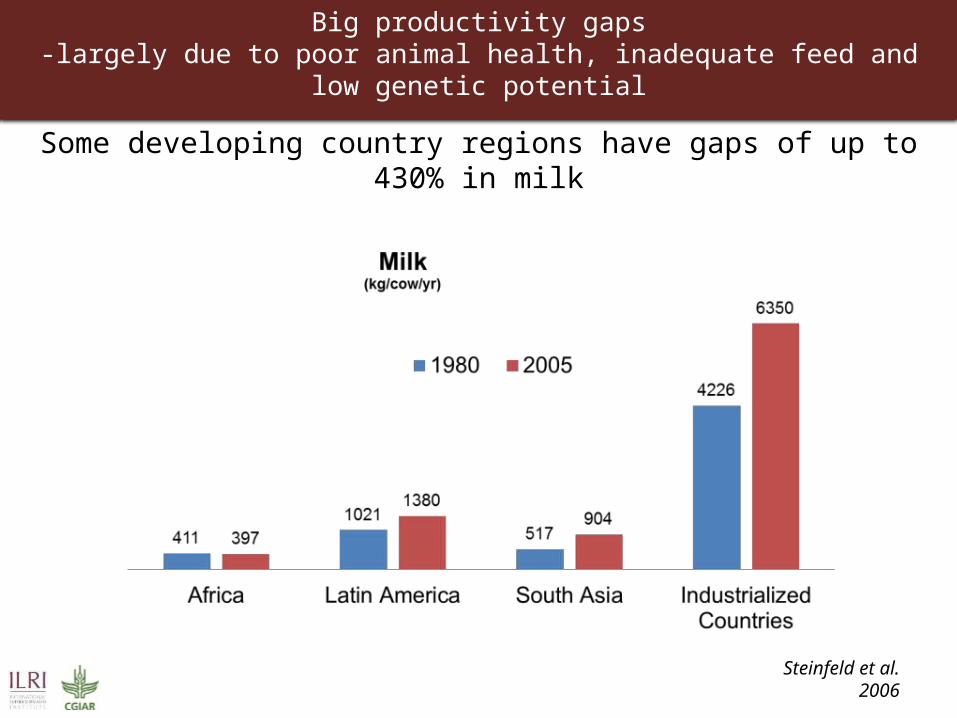
Steinfeld et al. 2006
Big productivity gaps-largely due to poor animal health, inadequate feed and low genetic potential
Some developing country regions have gaps of up to 430% in milk
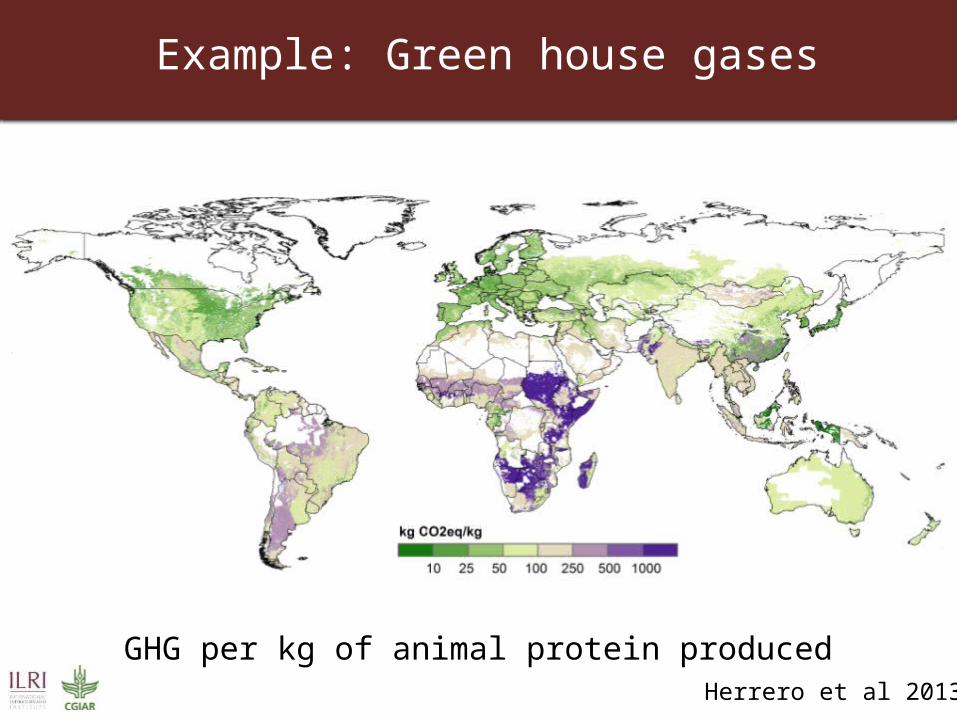
Example: Green house gases
Herrero et al 2013
GHG per kg of animal protein produced
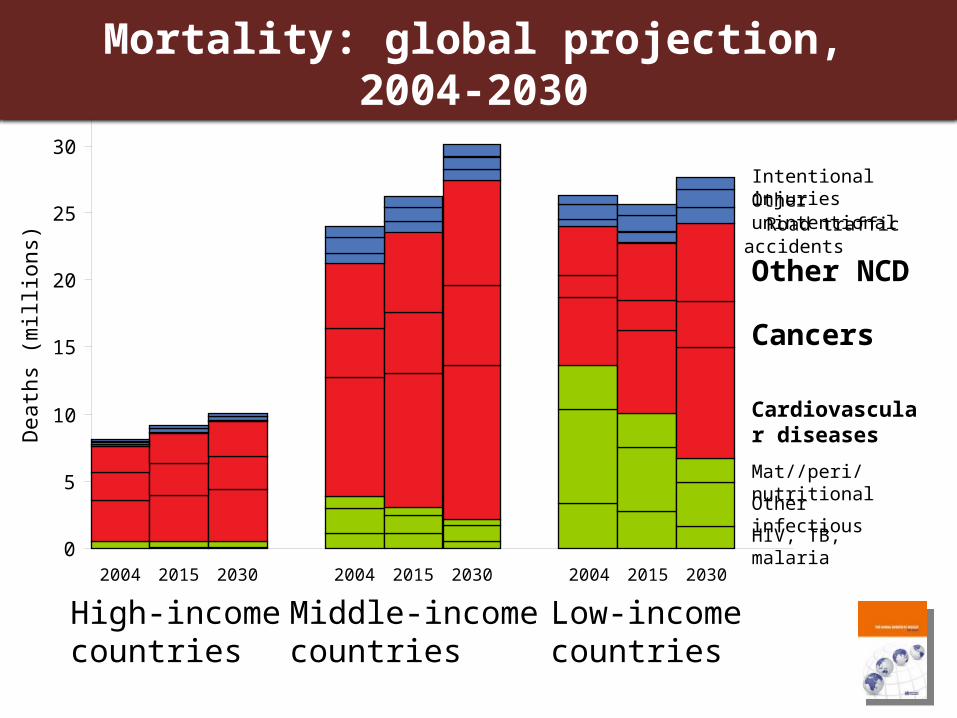
HIV, TB, malaria
Other infectious
Mat//peri/nutritional
Cardiovascular diseases
Cancers
Other NCD
Road traffic accidentsOther unintentionalIntentional injuries
0
5
10
15
20
25
30
2004 2015 2030 2004 2015 2030 2004 2015 2030
Deat
hs (m
illio
ns)
High-incomecountries
Middle-incomecountries
Low-incomecountries
Mortality: global projection, 2004-2030
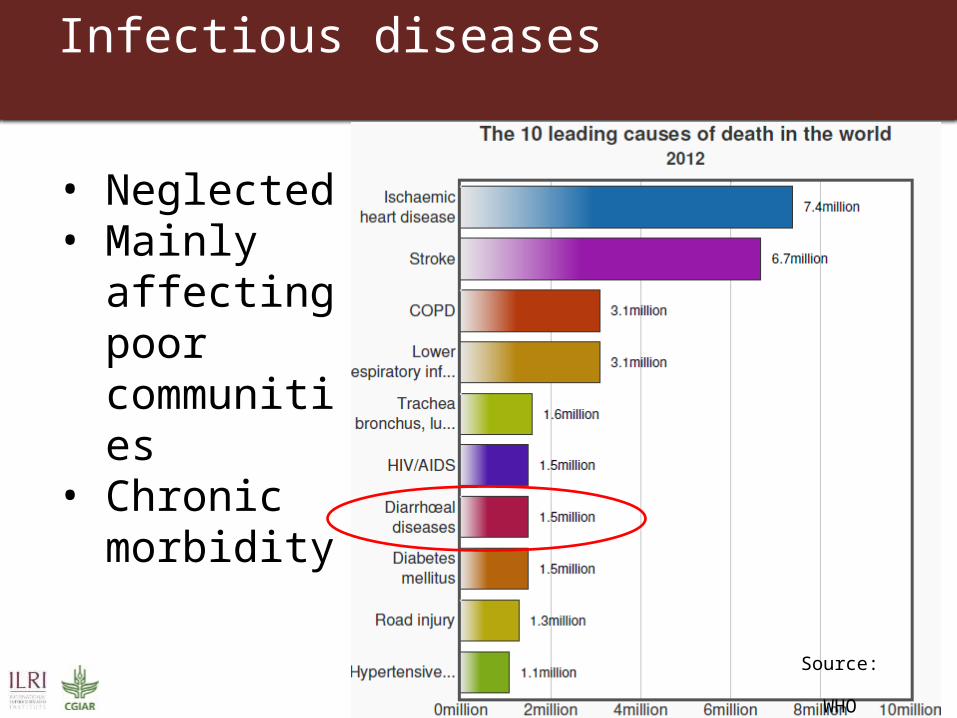
Infectious diseases
• Neglected • Mainly
affecting poor communities
• Chronic morbidity
Source: WHO
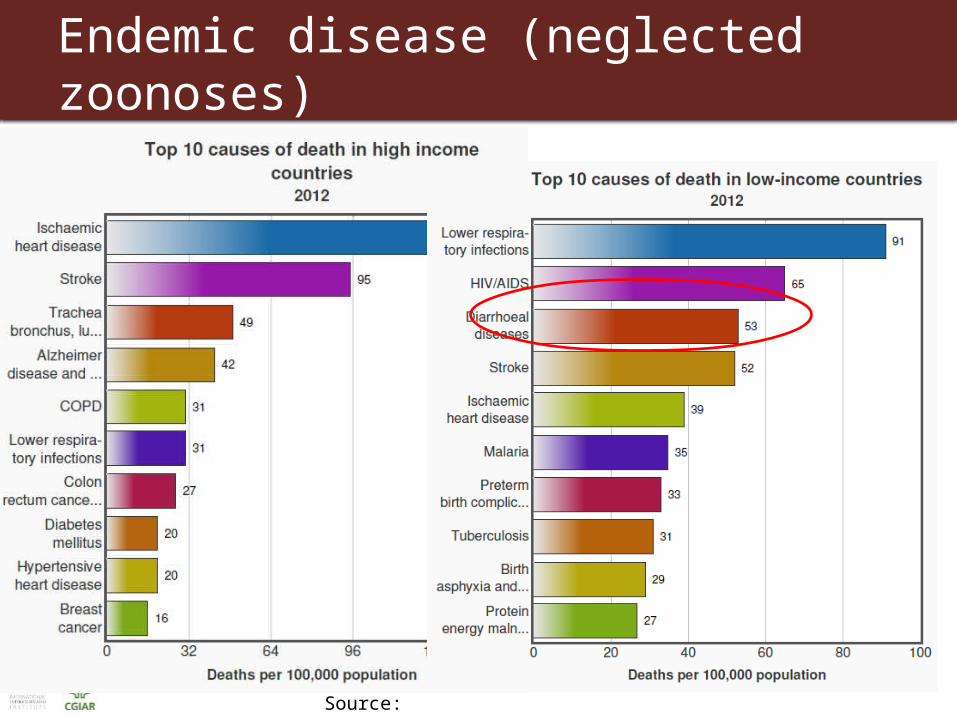
Endemic disease (neglected zoonoses)
Source: WHO
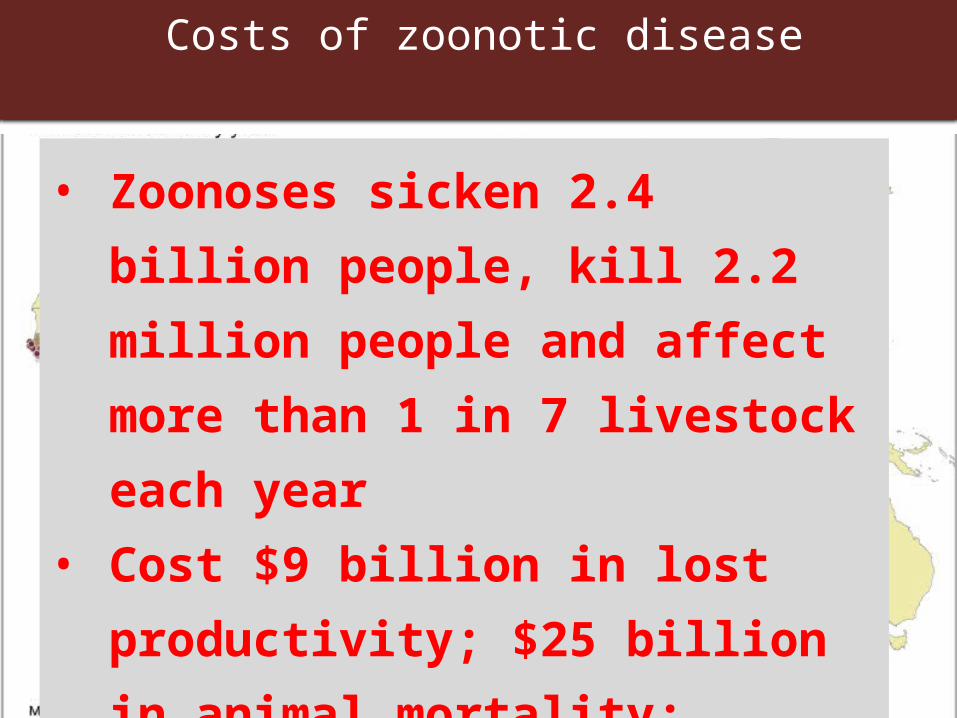
• Zoonoses sicken 2.4 billion people, kill 2.2 million people and affect more than 1 in 7 livestock each year
• Cost $9 billion in lost productivity; $25 billion in animal mortality; and$50 billion in human health
Costs of zoonotic disease
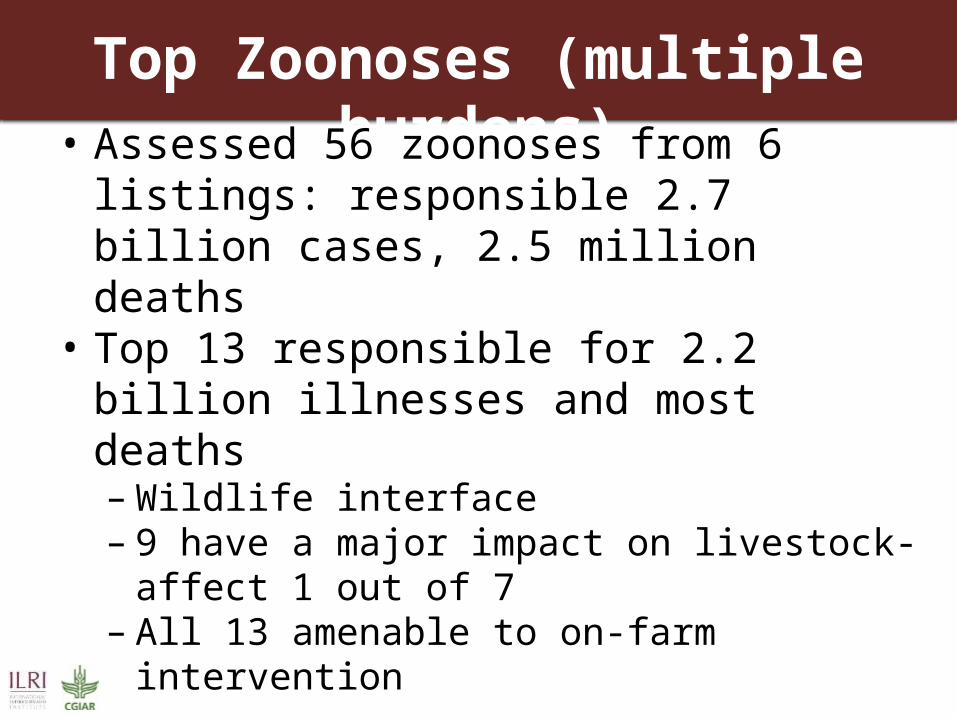
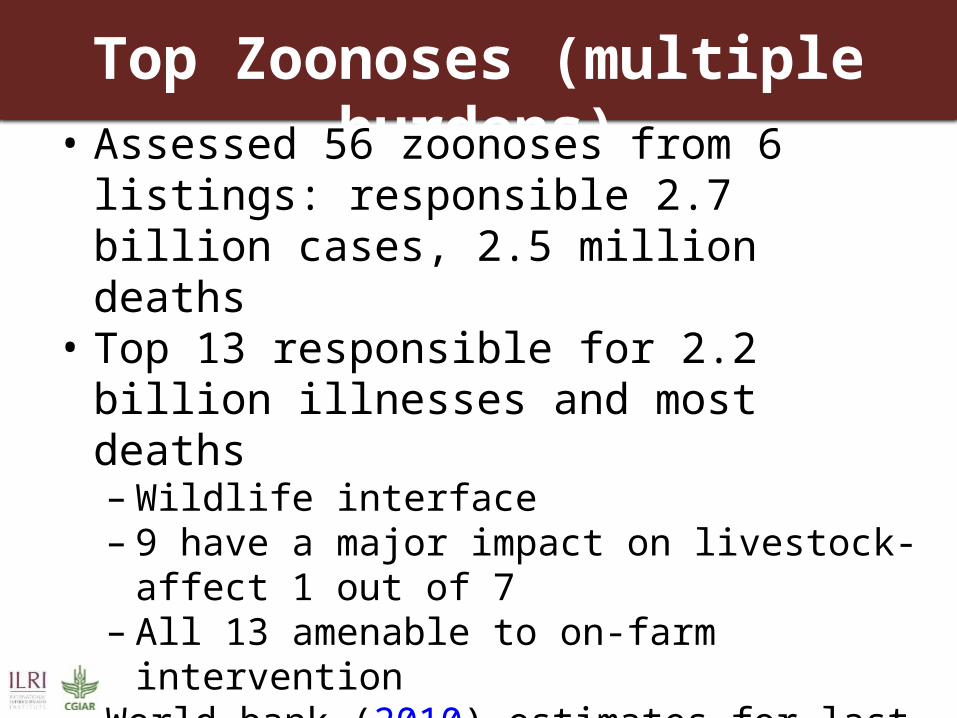
Top Zoonoses (multiple burdens)• Assessed 56 zoonoses from 6 listings:
responsible 2.7 billion cases, 2.5 million deaths • Top 13 responsible for 2.2 billion illnesses and
most deaths– Wildlife interface– 9 have a major impact on livestock- affect 1 out of 7– All 13 amenable to on-farm intervention
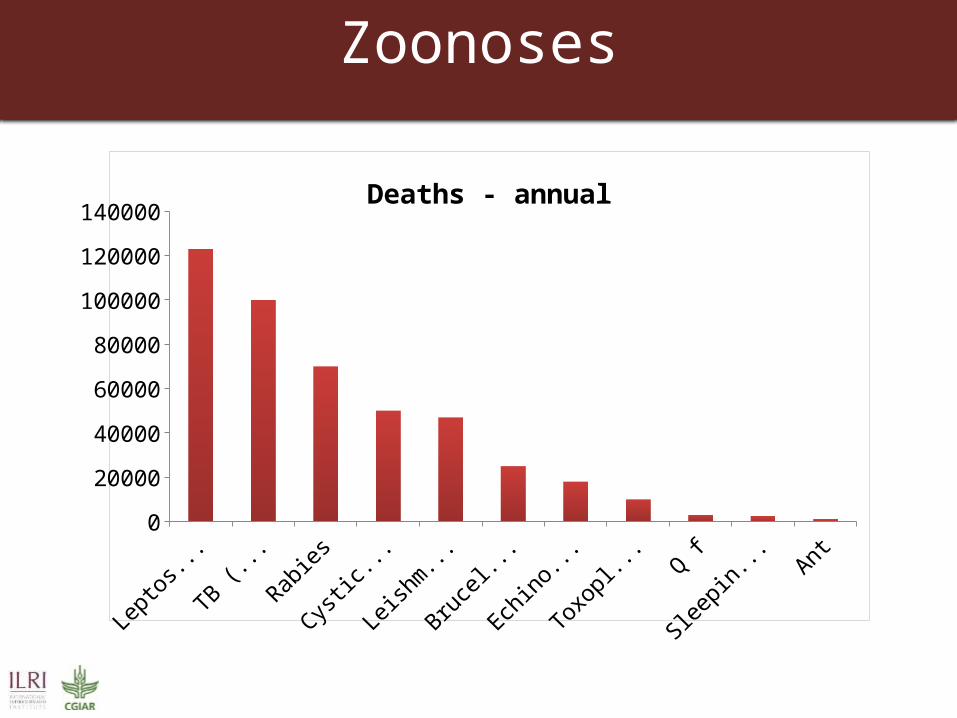
Zoonoses
0
20000
40000
60000
80000
100000
120000
140000Deaths - annual

Timely detection and response
25
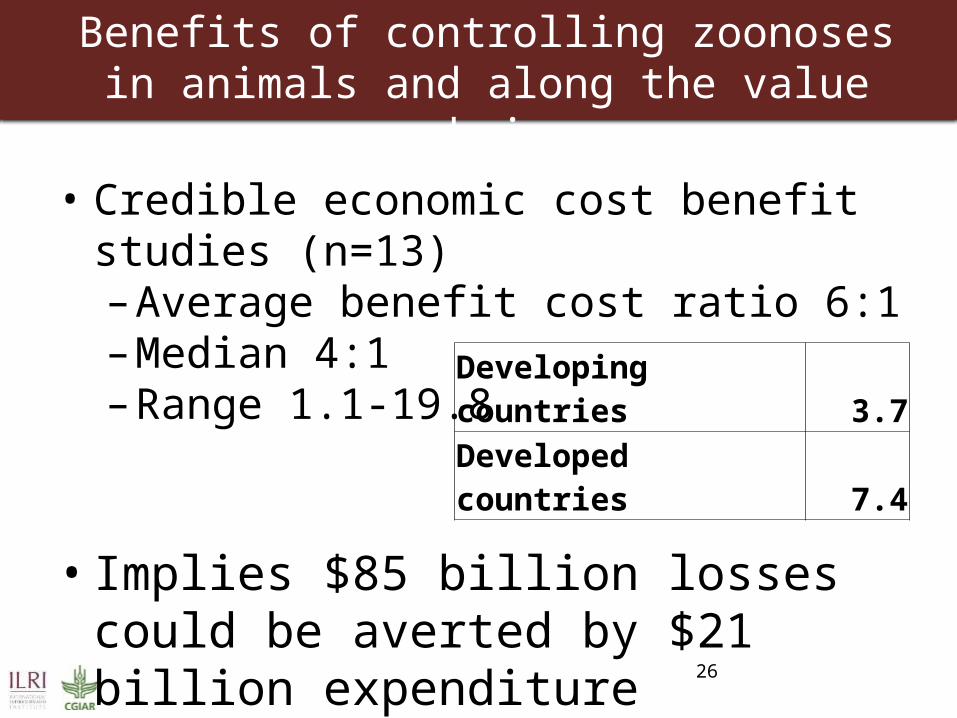
Benefits of controlling zoonoses in animals and along the value chain
• Credible economic cost benefit studies (n=13)– Average benefit cost ratio 6:1– Median 4:1– Range 1.1-19.8
• Implies $85 billion losses could be averted by $21 billion expenditure
26
Developing countries 3.7Developed countries 7.4
27
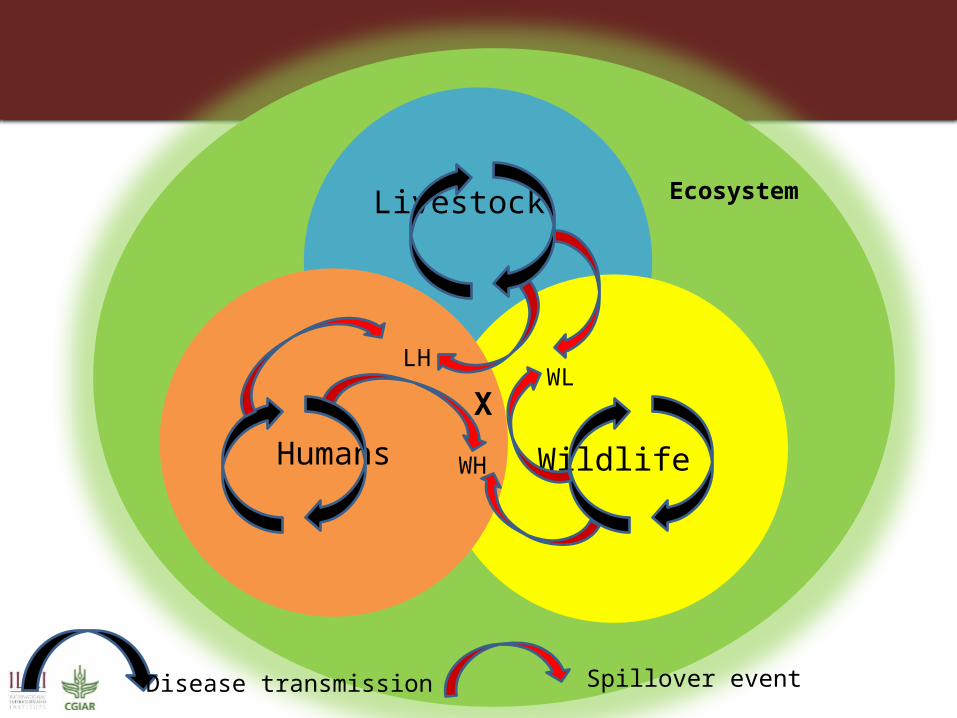
Livestock
WildlifeHumans
Ecosystem
LHWL
WH
X
Disease transmission Spillover event
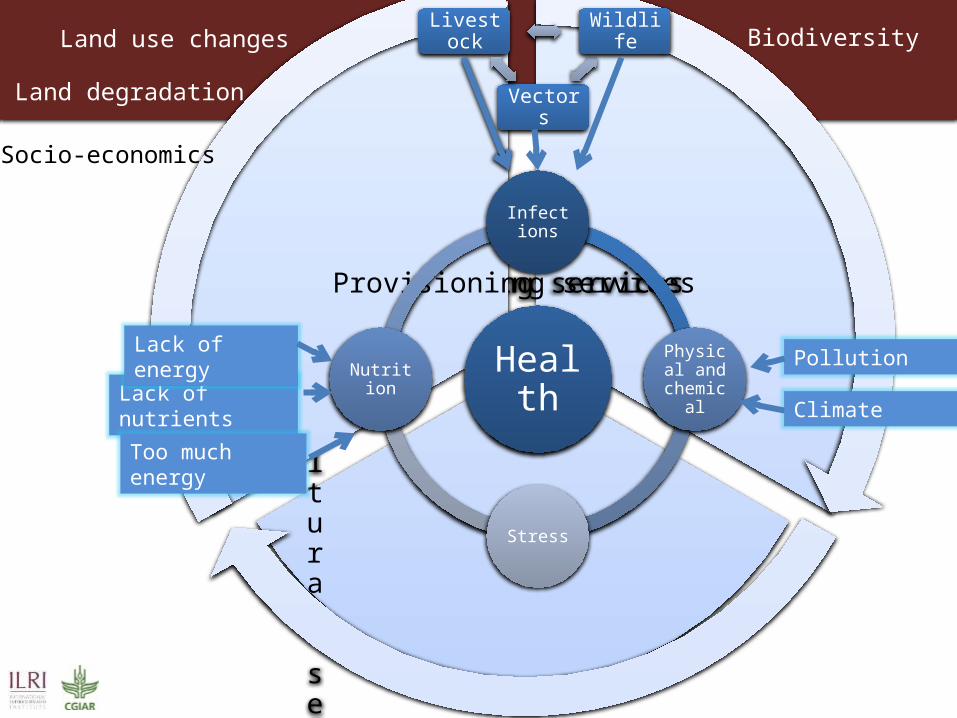
Regulating services
Cultural services
Provisioning services
Health
Infections
Physical and
chemical
Stress
Nutrition
Vectors
WildlifeLivestock
Lack of nutrients
Lack of energy
Too much energy
Climate
Pollution
Land use changes
Land degradation
Biodiversity
Socio-economics
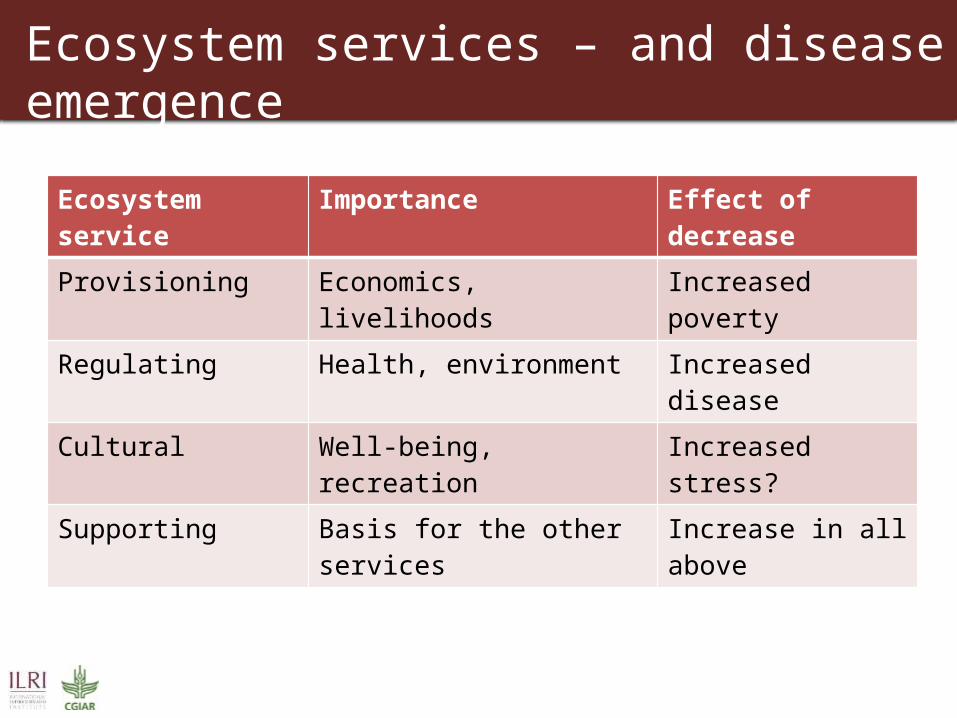
Ecosystem services – and disease emergence
Ecosystem service Importance Effect of decrease
Provisioning Economics, livelihoods Increased poverty
Regulating Health, environment Increased disease
Cultural Well-being, recreation Increased stress?
Supporting Basis for the other services Increase in all above
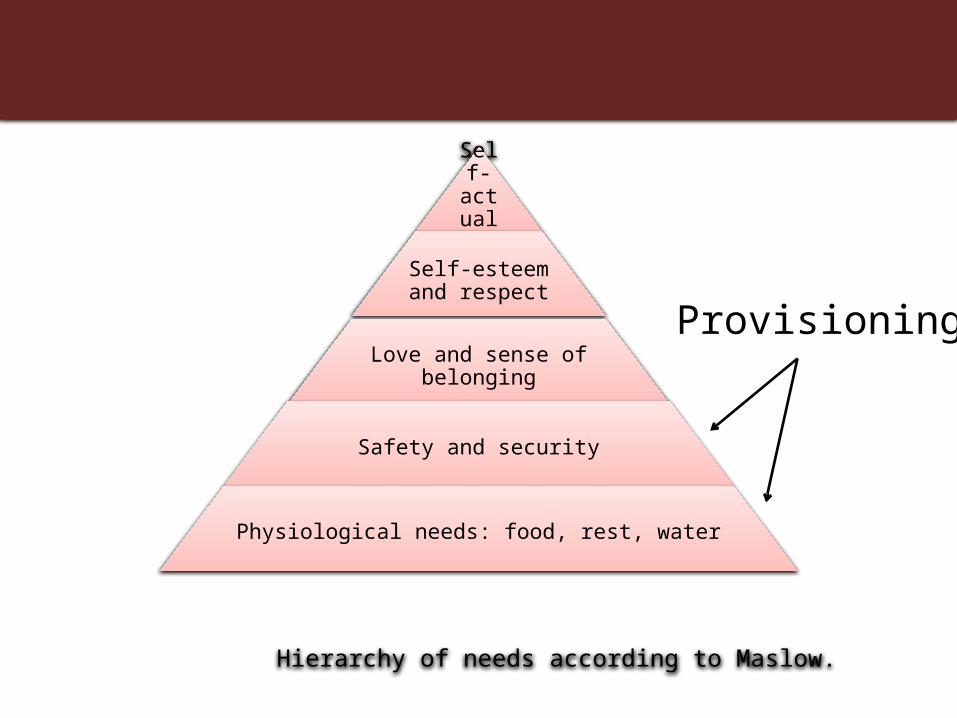
Self-actualization
Self-esteem and respect
Love and sense of belonging
Safety and security
Physiological needs: food, rest, water
Hierarchy of needs according to Maslow.
Provisioning
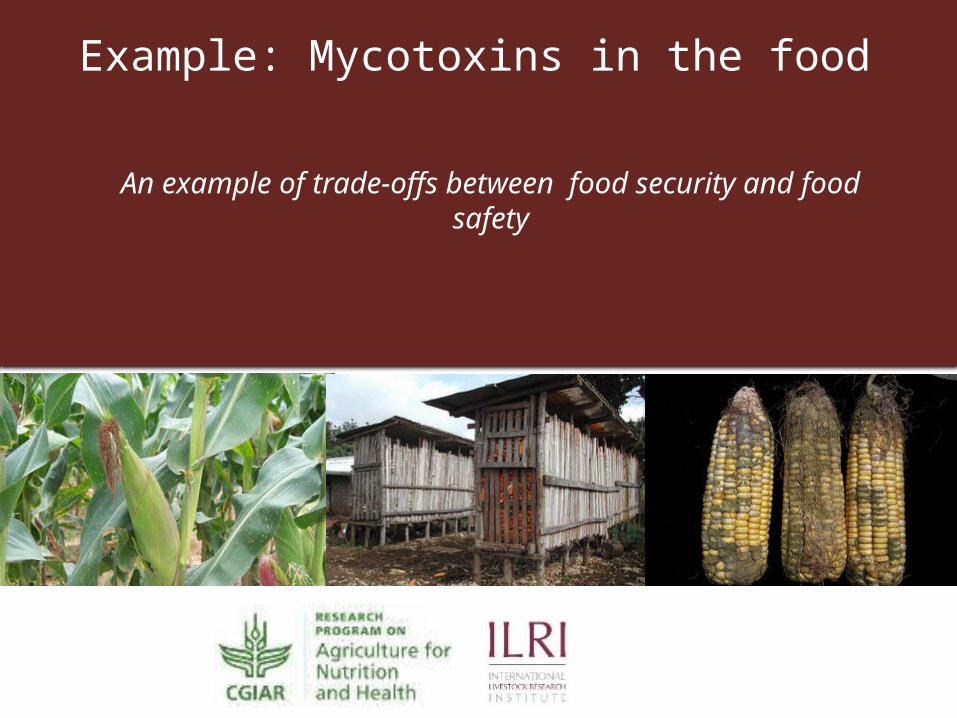
Example: Mycotoxins in the food
An example of trade-offs between food security and food safety
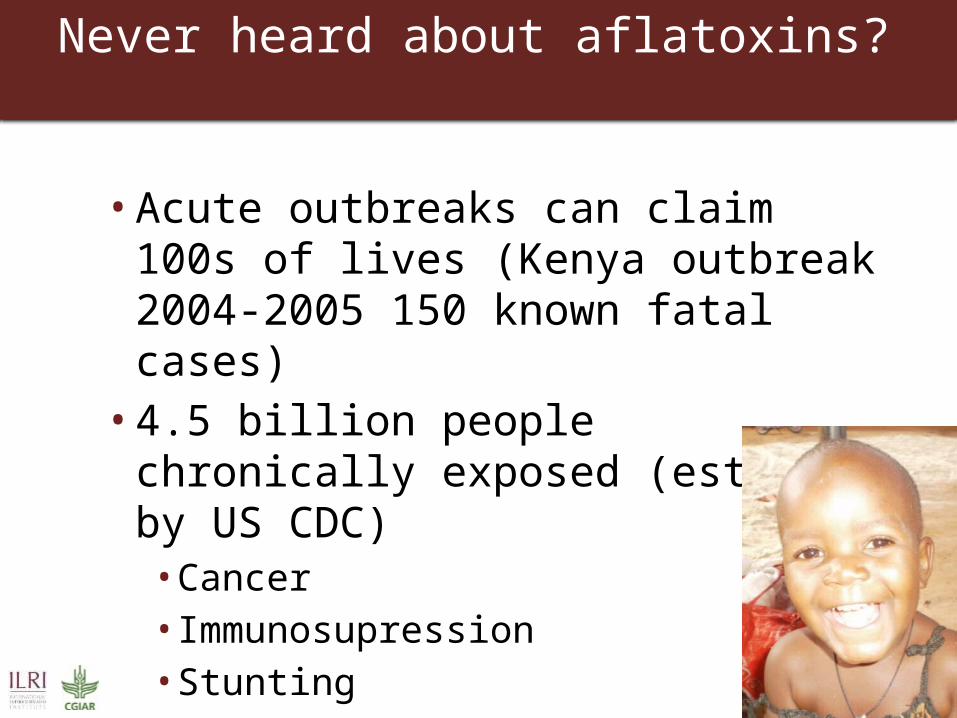
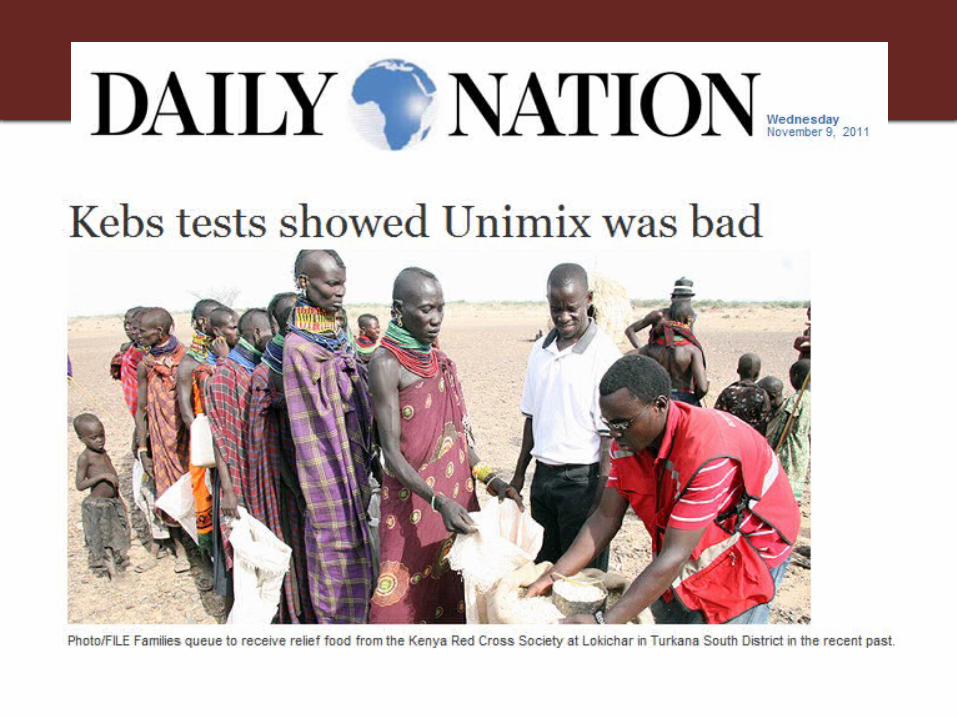
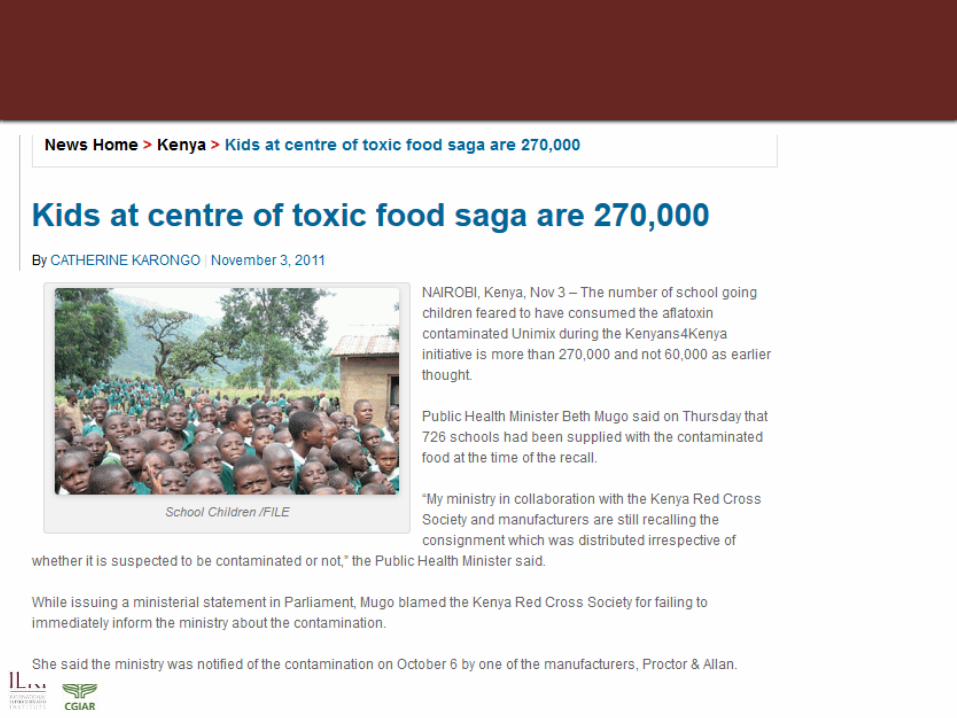
Never heard about aflatoxins?
• Acute outbreaks can claim 100s of lives (Kenya outbreak 2004-2005 150 known fatal cases)
• 4.5 billion people chronically exposed (estimate by US CDC)
• Cancer• Immunosupression• Stunting
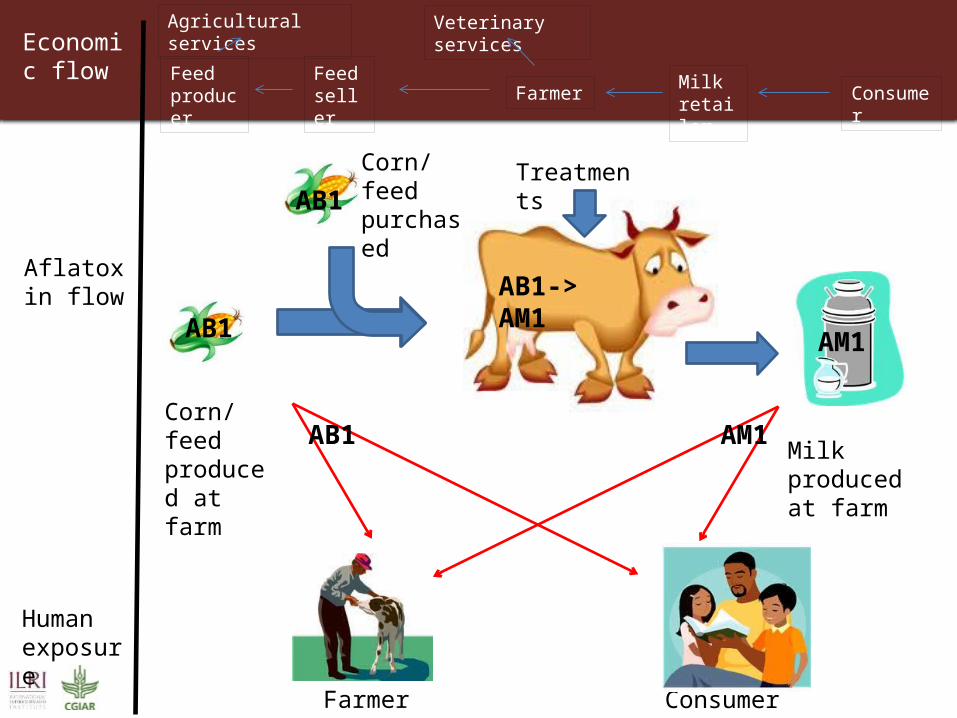
Farmer Consumer
Economic flow
Aflatoxin flow
Human exposure
Feed producer
AB1
AB1AB1-> AM1
AM1
Corn/feed produced at farm
Corn/feed purchased
Milk produced at farm
AB1 AM1
Treatments
Feed seller Farmer
Veterinary services
Milk retailer
Agricultural services
Consumer
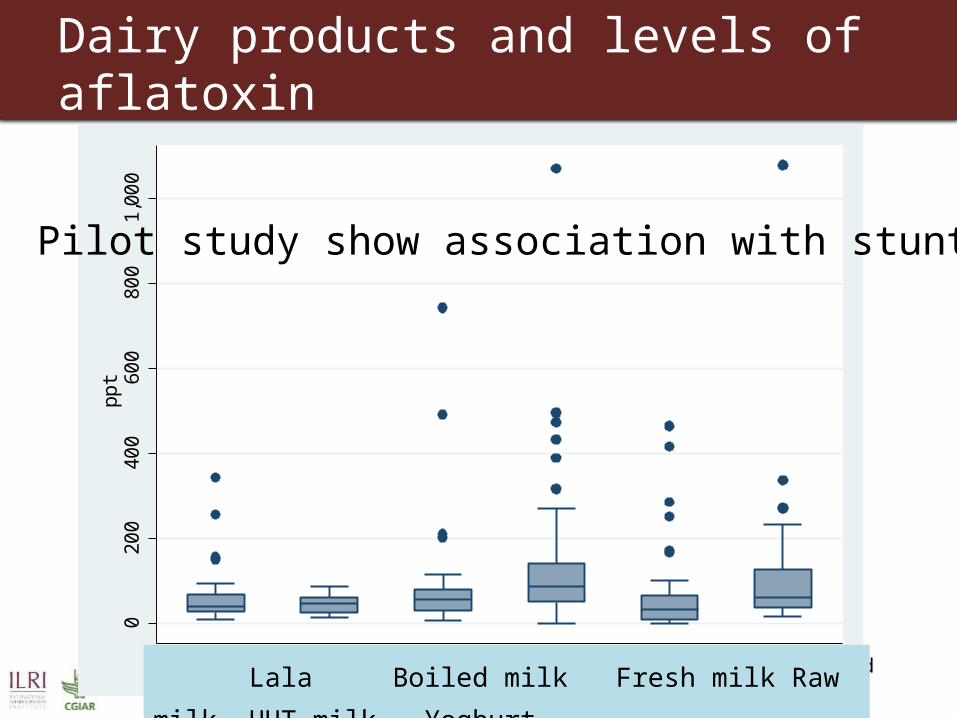
Dairy products and levels of aflatoxin
020
040
060
080
01,
000
ppt
Lala PasteurizedMilk BoiledMilk PasteurizedMilk Raw Milk UHTYoghurt Pasteurized Lala Boiled milk Fresh milk Raw milk UHT milk Yoghurt
Pilot study show association with stunting!
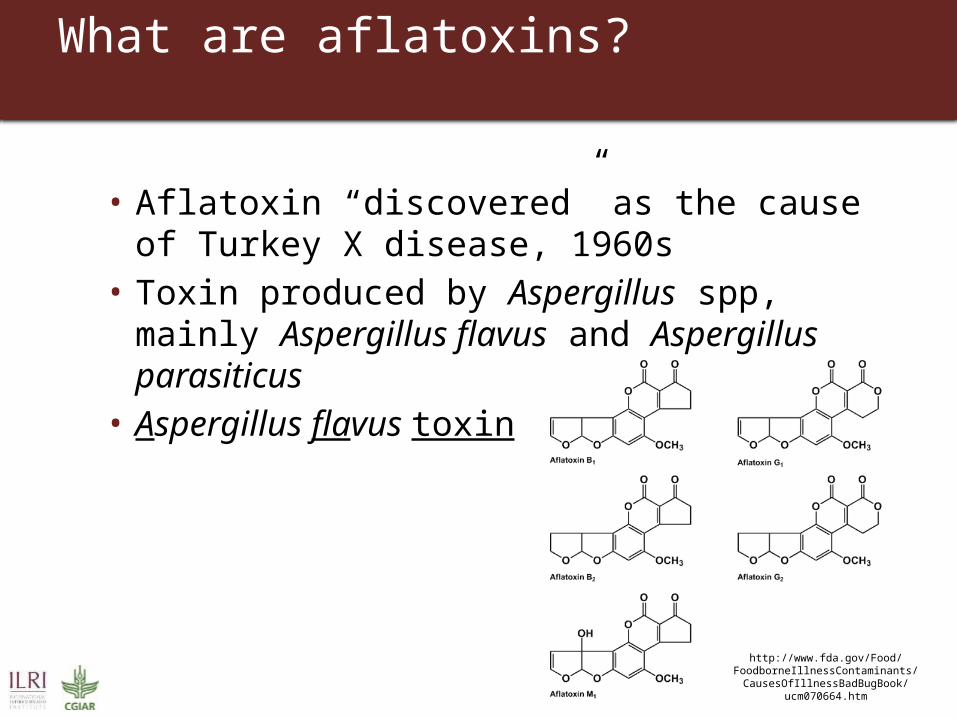
What are aflatoxins?
• Aflatoxin “discovered” as the cause of Turkey X disease, 1960s
• Toxin produced by Aspergillus spp, mainly Aspergillus flavus and Aspergillus parasiticus
• Aspergillus flavus toxin
http://www.fda.gov/Food/FoodborneIllnessContaminants/
CausesOfIllnessBadBugBook/ucm070664.htm
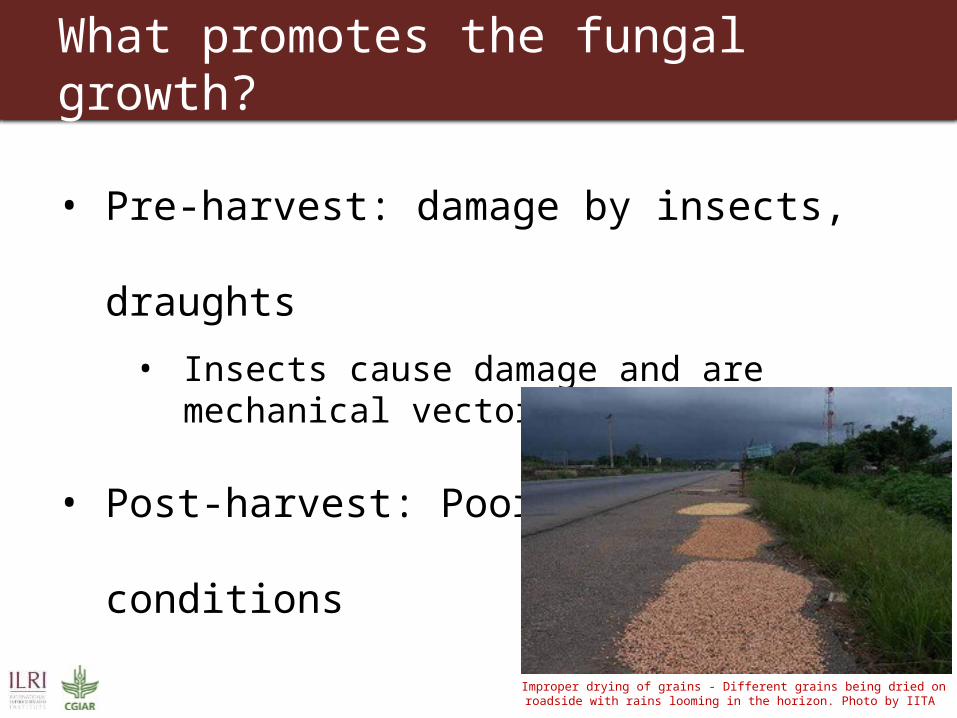
What promotes the fungal growth?
• Pre-harvest: damage by insects, draughts
• Insects cause damage and are mechanical vectors
• Post-harvest: Poor storage conditions
Improper drying of grains - Different grains being dried on roadside with rains looming in the horizon. Photo by IITA
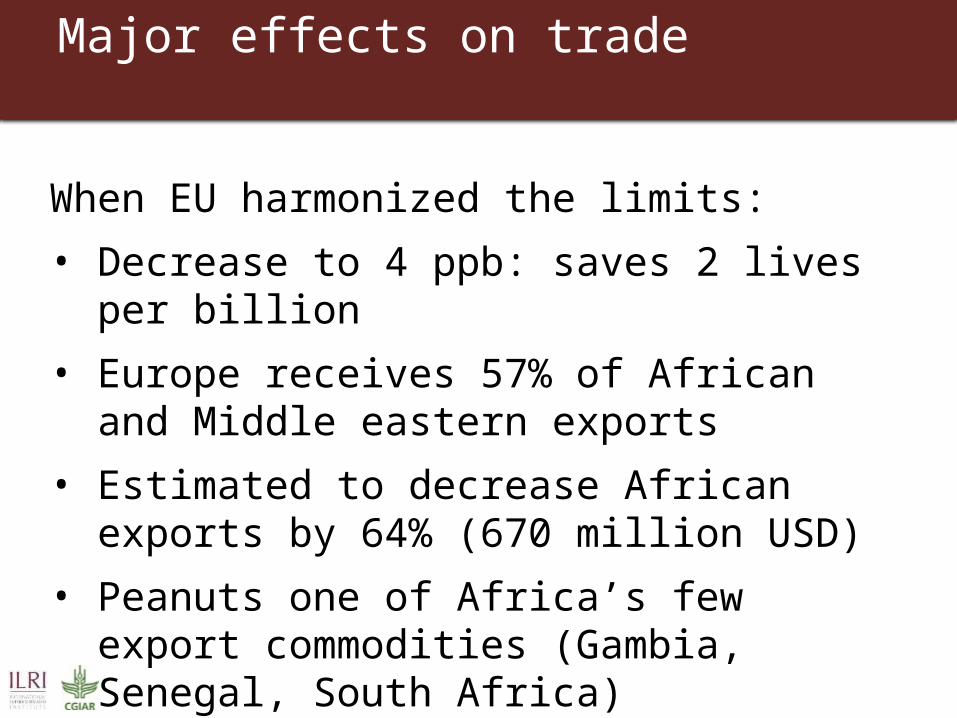
Major effects on trade
When EU harmonized the limits: • Decrease to 4 ppb: saves 2 lives per billion• Europe receives 57% of African and Middle
eastern exports• Estimated to decrease African exports by 64%
(670 million USD)• Peanuts one of Africa’s few export commodities
(Gambia, Senegal, South Africa)
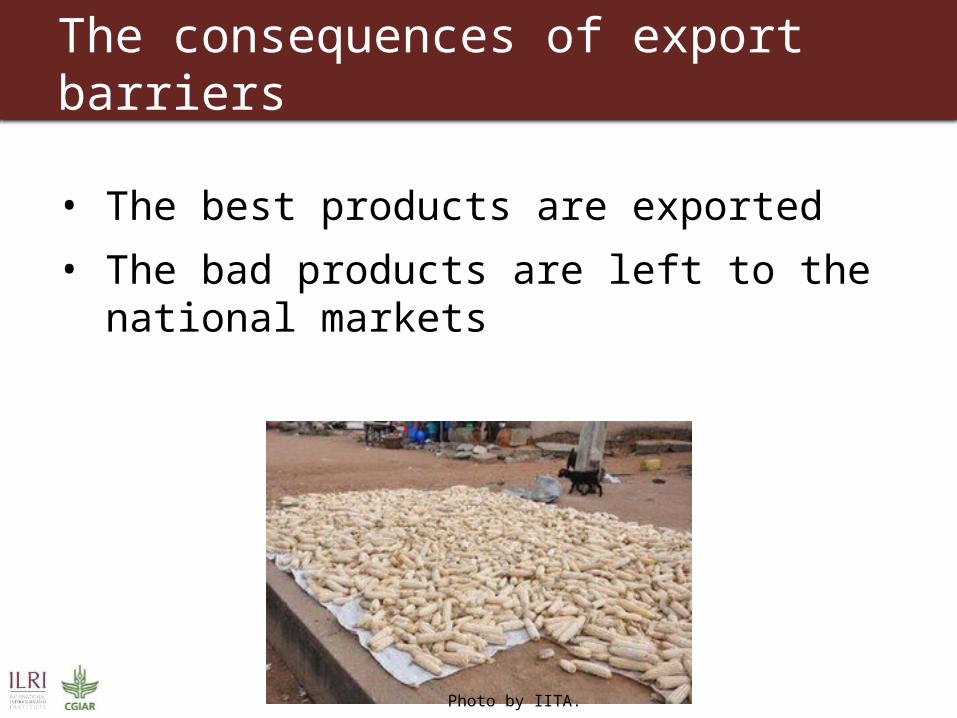
The consequences of export barriers
• The best products are exported• The bad products are left to the national markets
Photo by IITA.
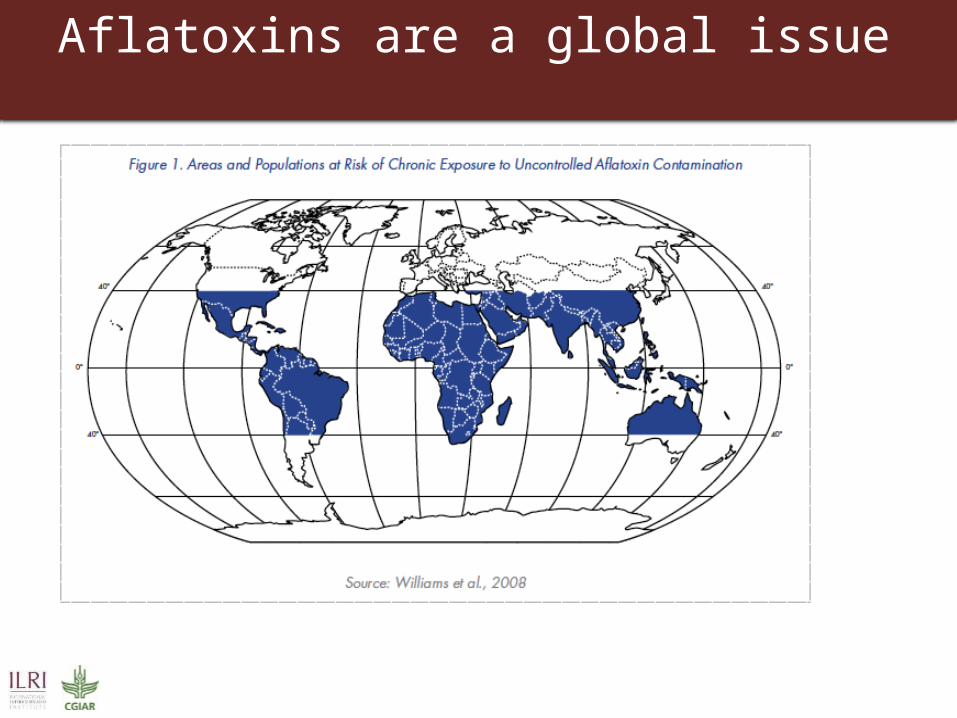
Aflatoxins are a global issue
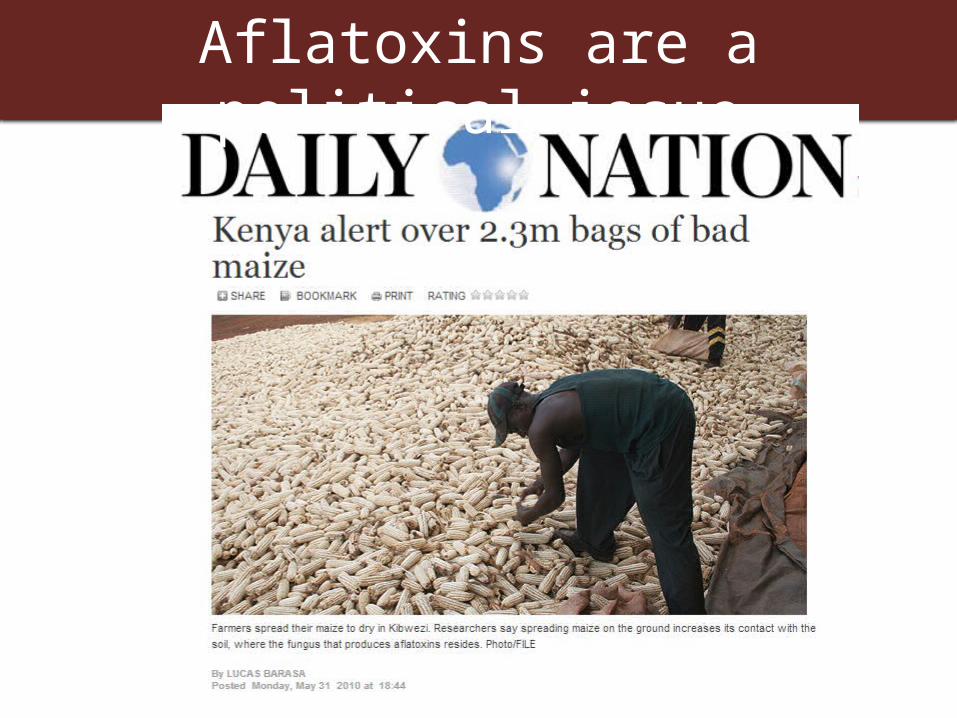
Aflatoxins are a political issue
How is ILRI working with this problem?
• Exposure of aflatoxin
• Levels of aflatoxin• Consumption of contaminated products
• Who are the consumers?
• Children• Pregnant and nursing mothers• The first 1000 days.
• Where is the problems?• Risk mapping
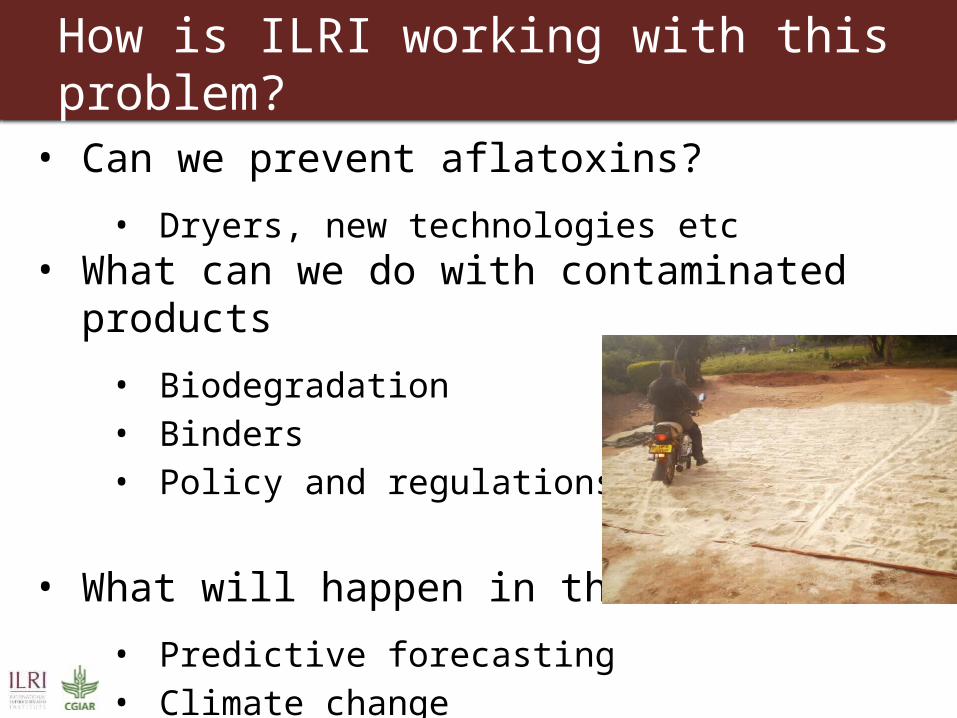
How is ILRI working with this problem?
• Can we prevent aflatoxins?
• Dryers, new technologies etc• What can we do with contaminated products
• Biodegradation• Binders• Policy and regulations
• What will happen in the future?
• Predictive forecasting• Climate change
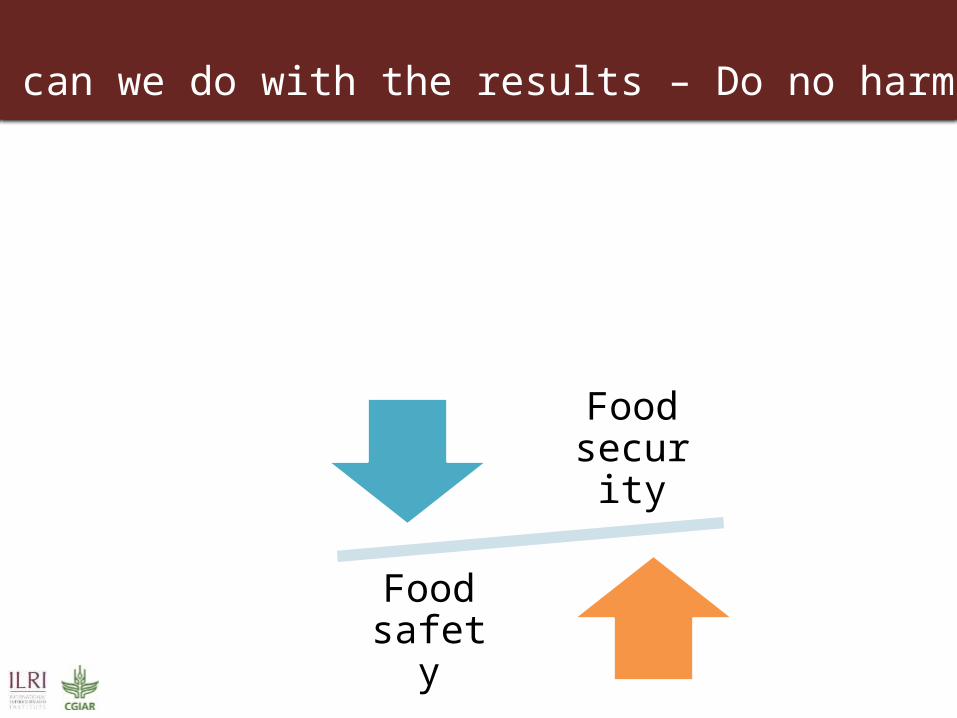
Food security
Food safety
What can we do with the results – Do no harm!
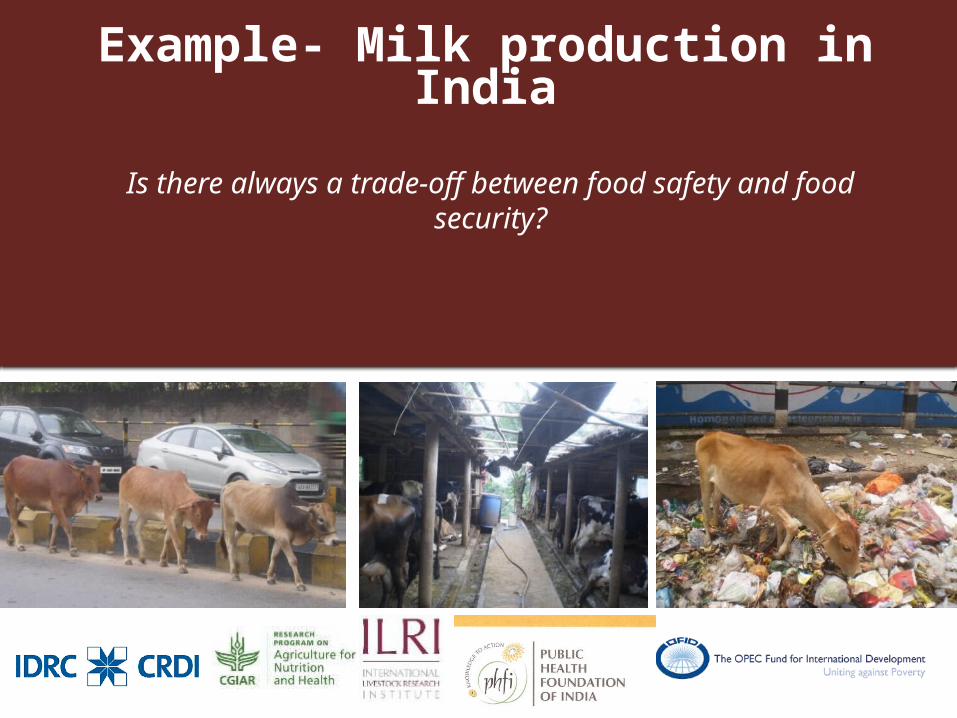
Example- Milk production in India
Is there always a trade-off between food safety and food security?
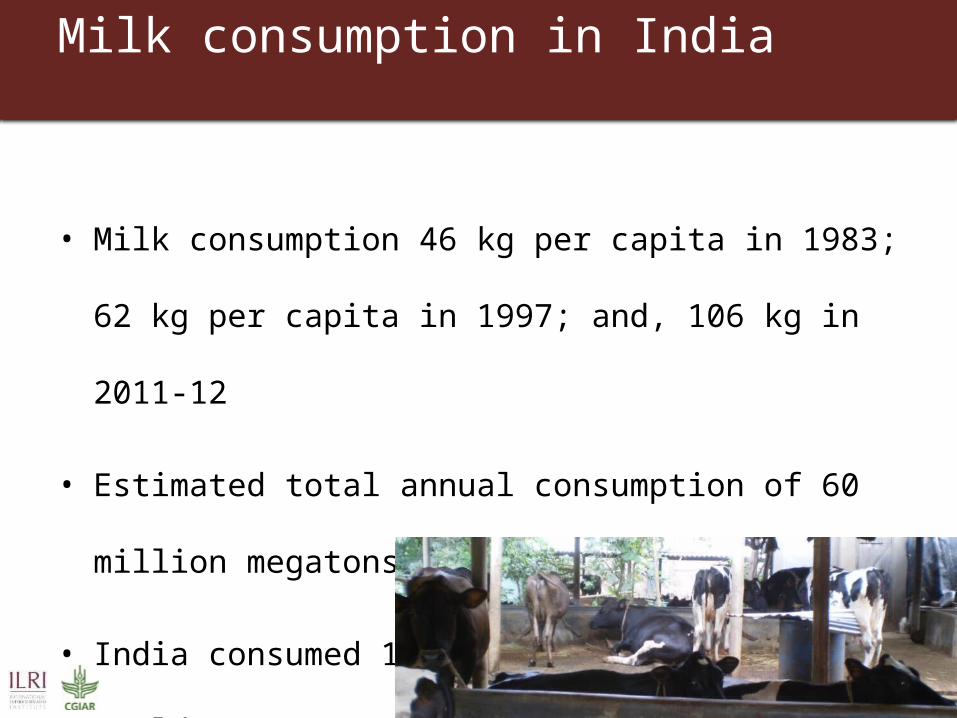
Milk consumption in India
• Milk consumption 46 kg per capita in 1983; 62 kg per capita in
1997; and, 106 kg in 2011-12
• Estimated total annual consumption of 60 million megatons
• India consumed 13% of the milk in the world
Food-borne diseases
• Food-borne diseases are very important• 1.4 million children die every year of diarrhea• The majority is food and water-associated • Animal-source food over-represented as a cause
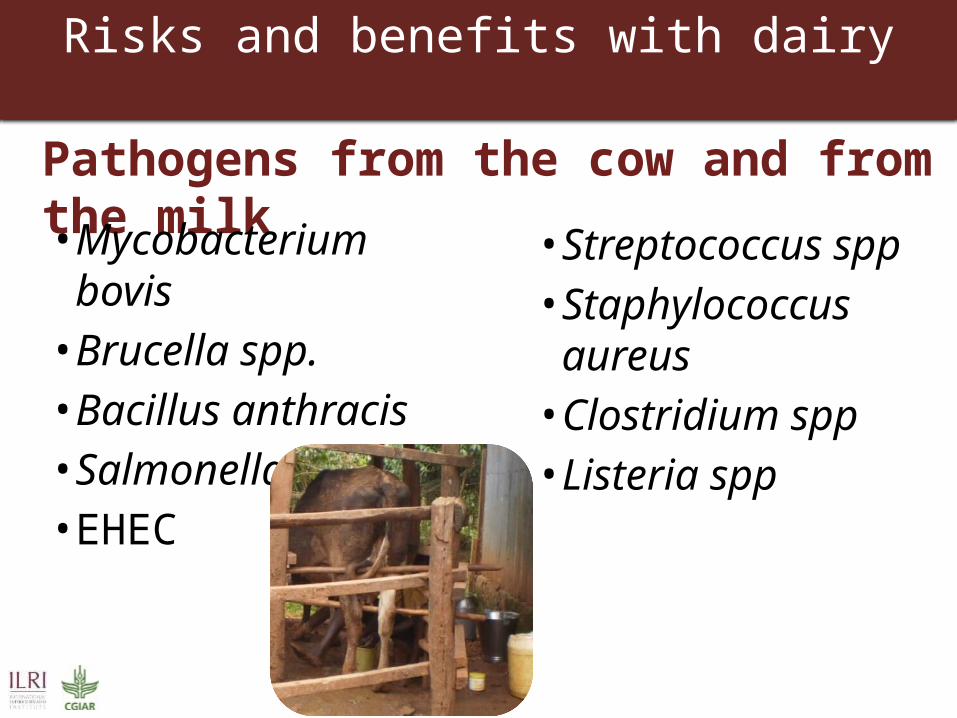
Risks and benefits with dairy
Pathogens from the cow and from the milk• Mycobacterium
bovis• Brucella spp.• Bacillus anthracis• Salmonella• EHEC
• Streptococcus spp• Staphylococcus
aureus• Clostridium spp• Listeria spp
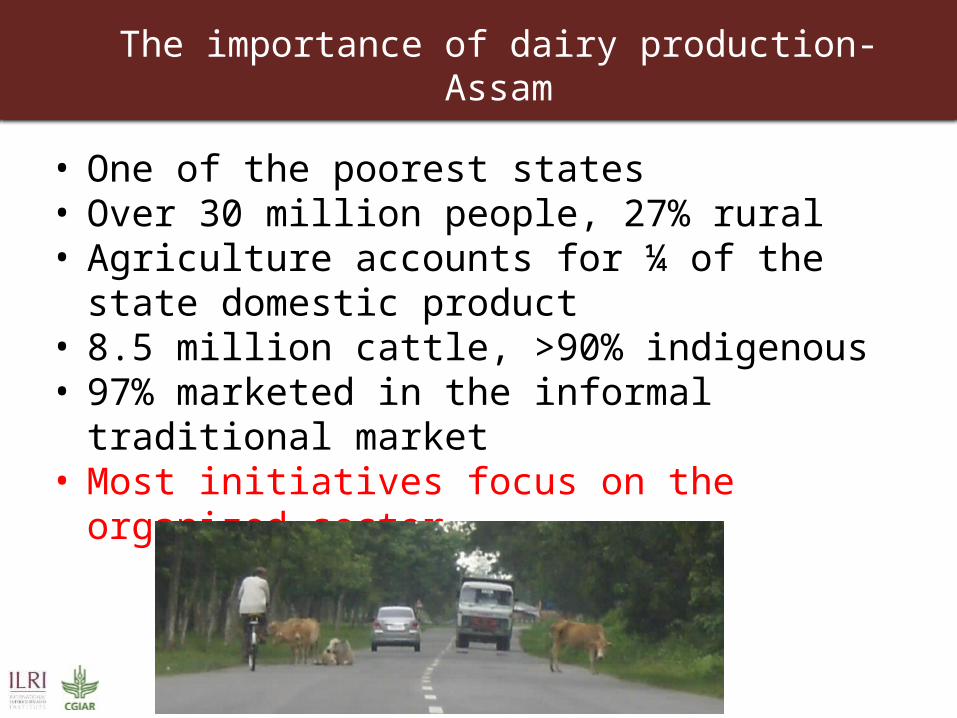
The importance of dairy production-Assam
• One of the poorest states• Over 30 million people, 27% rural• Agriculture accounts for ¼ of the state domestic
product• 8.5 million cattle, >90% indigenous• 97% marketed in the informal traditional market• Most initiatives focus on the organized sector
51
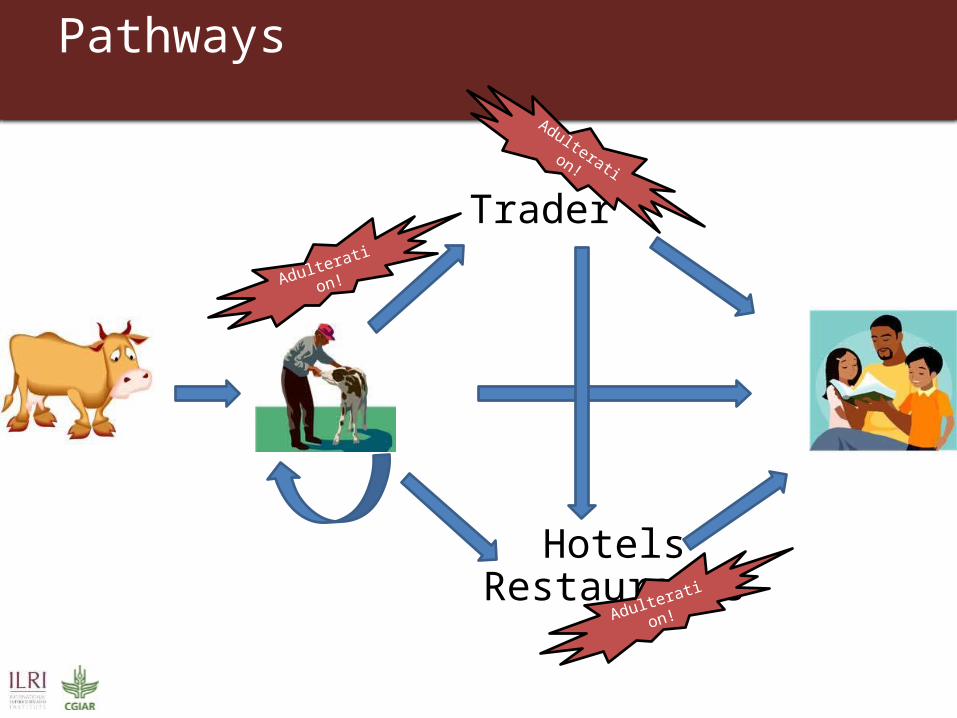
Pathways
Trader
HotelsRestaurants
Adulteration!
Adulteration!
Adulteration!

Adulteration- a problem?
1. Producers in 2009: 0-66% water added
2. Traders in 2009: 2-55% water added
3. Producers in 2012: between 0-28 % water added
4. Traders in 2012: 0-31 % water added
Adulteration occurs at every step!
Consumers can not tell the difference!
No clear association with bacterial count
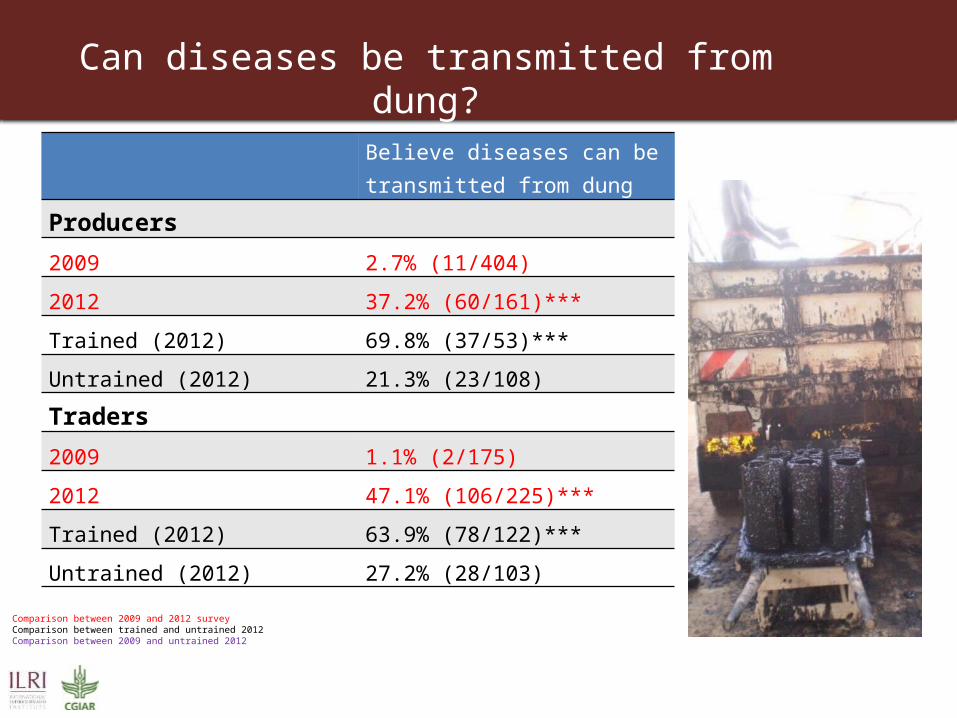
Can diseases be transmitted from dung?
54
Believe diseases can be transmitted from dung
Producers
2009 2.7% (11/404)
2012 37.2% (60/161)***
Trained (2012) 69.8% (37/53)***
Untrained (2012) 21.3% (23/108)
Traders
2009 1.1% (2/175)
2012 47.1% (106/225)***
Trained (2012) 63.9% (78/122)***
Untrained (2012) 27.2% (28/103)
Comparison between 2009 and 2012 surveyComparison between trained and untrained 2012Comparison between 2009 and untrained 2012
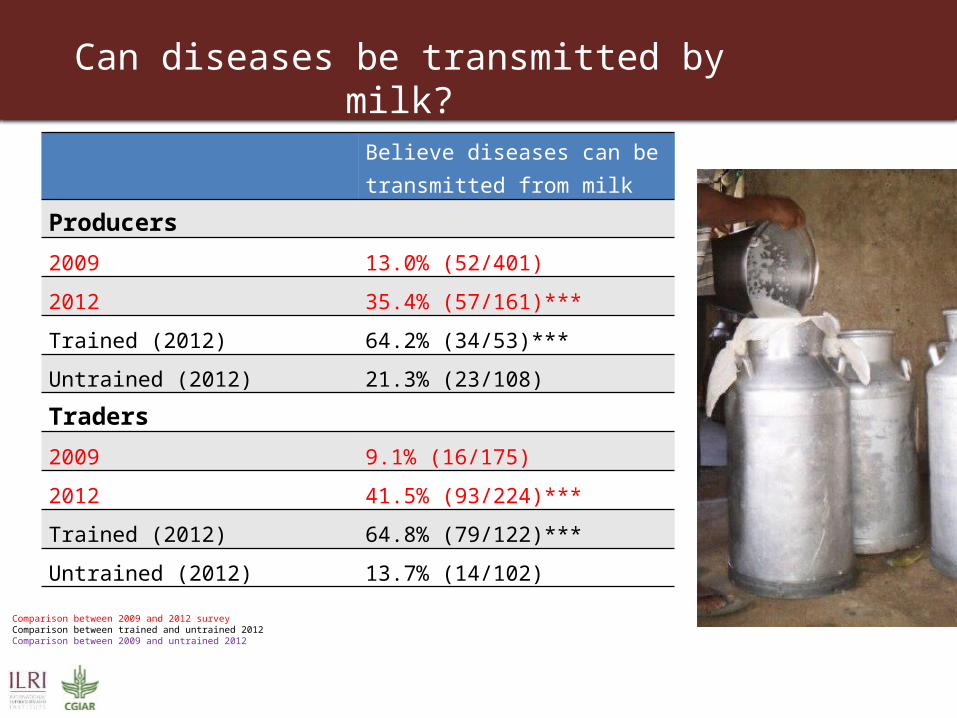
Can diseases be transmitted by milk?
55
Believe diseases can be transmitted from milk
Producers
2009 13.0% (52/401)
2012 35.4% (57/161)***
Trained (2012) 64.2% (34/53)***
Untrained (2012) 21.3% (23/108)
Traders
2009 9.1% (16/175)
2012 41.5% (93/224)***
Trained (2012) 64.8% (79/122)***
Untrained (2012) 13.7% (14/102)
Comparison between 2009 and 2012 surveyComparison between trained and untrained 2012Comparison between 2009 and untrained 2012
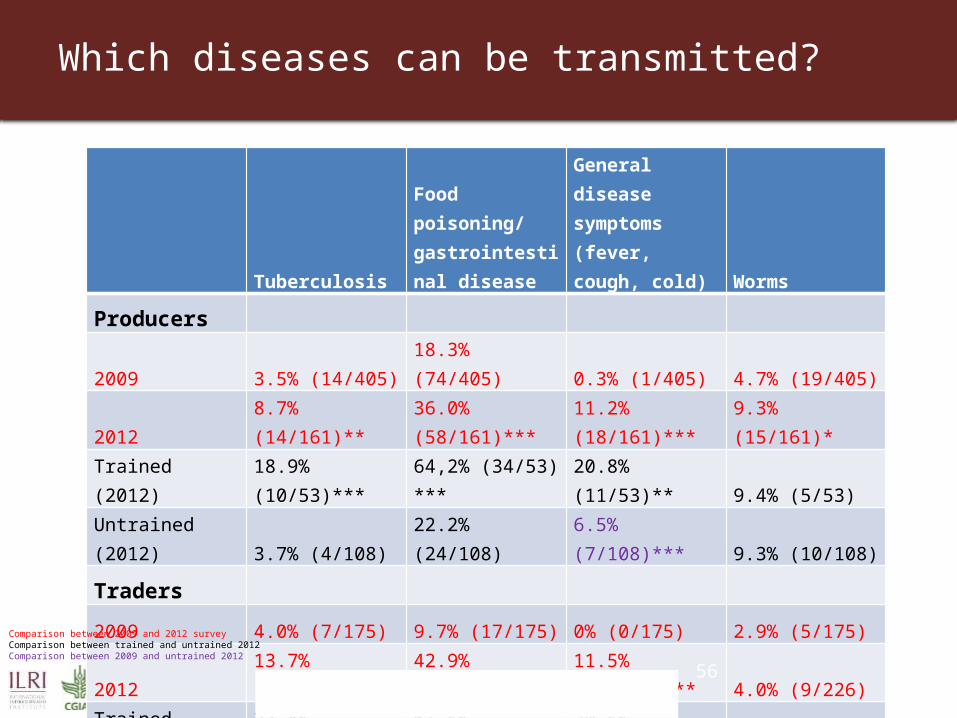
Which diseases can be transmitted?
Tuberculosis
Food poisoning/ gastrointestinal disease
General disease symptoms (fever, cough, cold) Worms
Producers
2009 3.5% (14/405) 18.3% (74/405) 0.3% (1/405) 4.7% (19/405)
2012 8.7% (14/161)** 36.0% (58/161)*** 11.2% (18/161)*** 9.3% (15/161)*
Trained (2012) 18.9% (10/53)*** 64,2% (34/53) *** 20.8% (11/53)** 9.4% (5/53)
Untrained (2012) 3.7% (4/108) 22.2% (24/108) 6.5% (7/108)*** 9.3% (10/108)
Traders
2009 4.0% (7/175) 9.7% (17/175) 0% (0/175) 2.9% (5/175)
2012 13.7% (31/226)*** 42.9% (97/226)*** 11.5% (26/226)*** 4.0% (9/226)
Trained (2012) 23.8% (29/122)*** 61.5% (75/122)*** 20.5% (25/122)*** 6.6% (8/122)*
Untrained (2012) 1.9% (2/104) 21.2% (22/104)** 1.0% (1/104) 1.0% (1/104)
56
Comparison between 2009 and 2012 surveyComparison between trained and untrained 2012Comparison between 2009 and untrained 2012
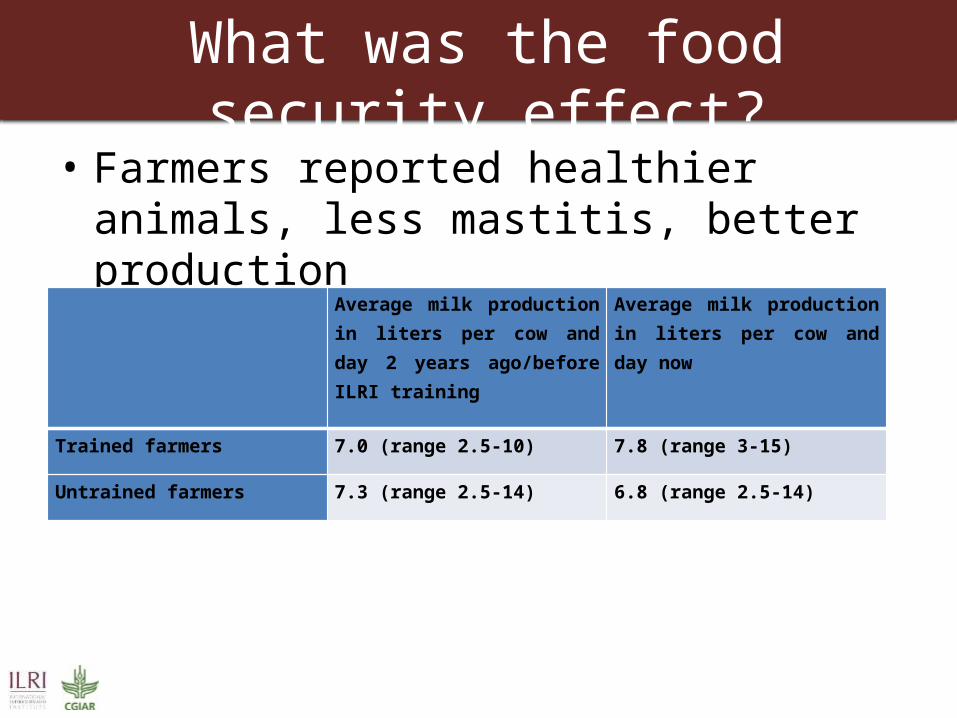
What was the food security effect?
• Farmers reported healthier animals, less mastitis, better production
Average milk production in liters per cow and day 2 years ago/before ILRI training
Average milk production in liters per cow and day now
Trained farmers 7.0 (range 2.5-10) 7.8 (range 3-15)
Untrained farmers 7.3 (range 2.5-14) 6.8 (range 2.5-14)
Why a veterinary public health question?
What is necessary for health?
Food security
Food safety Health
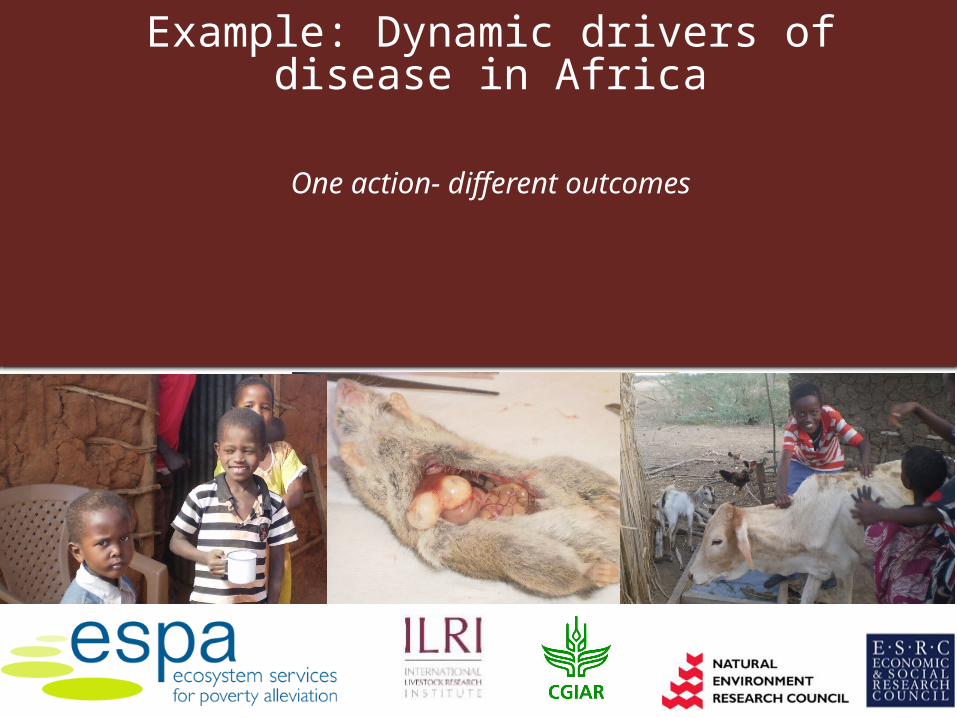
Example: Dynamic drivers of disease in Africa
One action- different outcomes
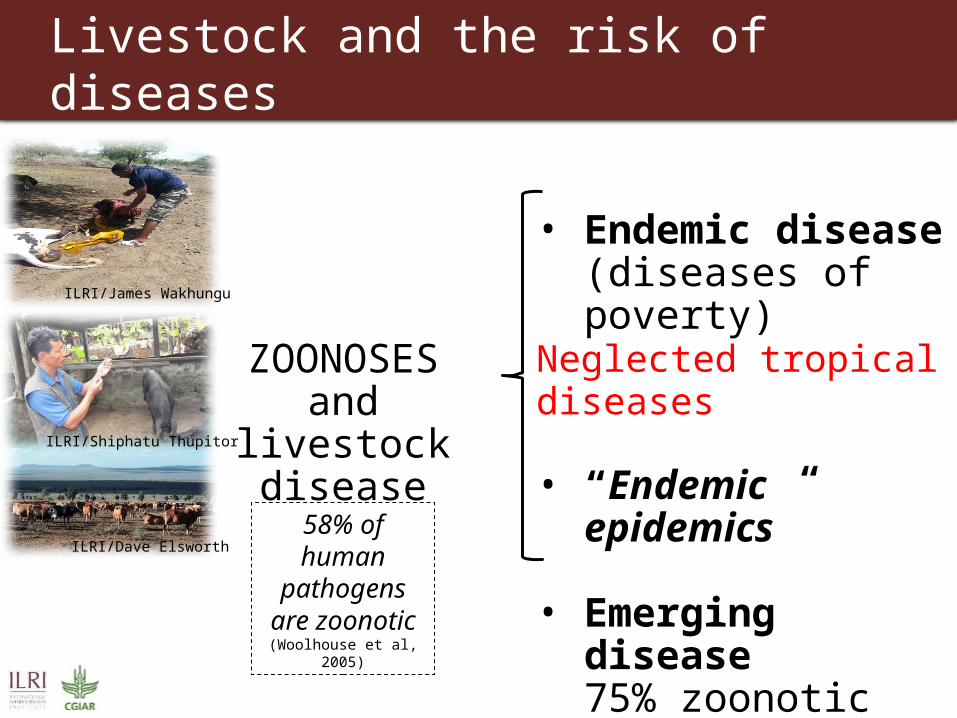
ZOONOSES and livestock
disease
• Endemic disease (diseases of poverty)
Neglected tropical diseases
• “Endemic epidemics”
• Emerging disease75% zoonotic58% of human
pathogens are zoonotic
(Woolhouse et al, 2005)
ILRI/James Wakhungu
ILRI/Shiphatu Thupitor
ILRI/Dave Elsworth
Livestock and the risk of diseases
Top Zoonoses (multiple burdens)• Assessed 56 zoonoses from 6 listings:
responsible 2.7 billion cases, 2.5 million deaths • Top 13 responsible for 2.2 billion illnesses and
most deaths– Wildlife interface– 9 have a major impact on livestock- affect 1 out of 7– All 13 amenable to on-farm interventionWorld bank (2010) estimates for last century : • direct costs of zoonotic outbreaks >20 billion USD• indirect costs 200 billion USD

Zoonoses
0
20000
40000
60000
80000
100000
120000
140000Deaths - annual
Anthropogenic action: Increased irrigation
Effect on ecosystem:Creates more larval habitats
Vector consequence:More infected vectors
Epidemiologic consequence:
More individuals exposed Increa
seddiseas
e
Case study- irrigation and disease
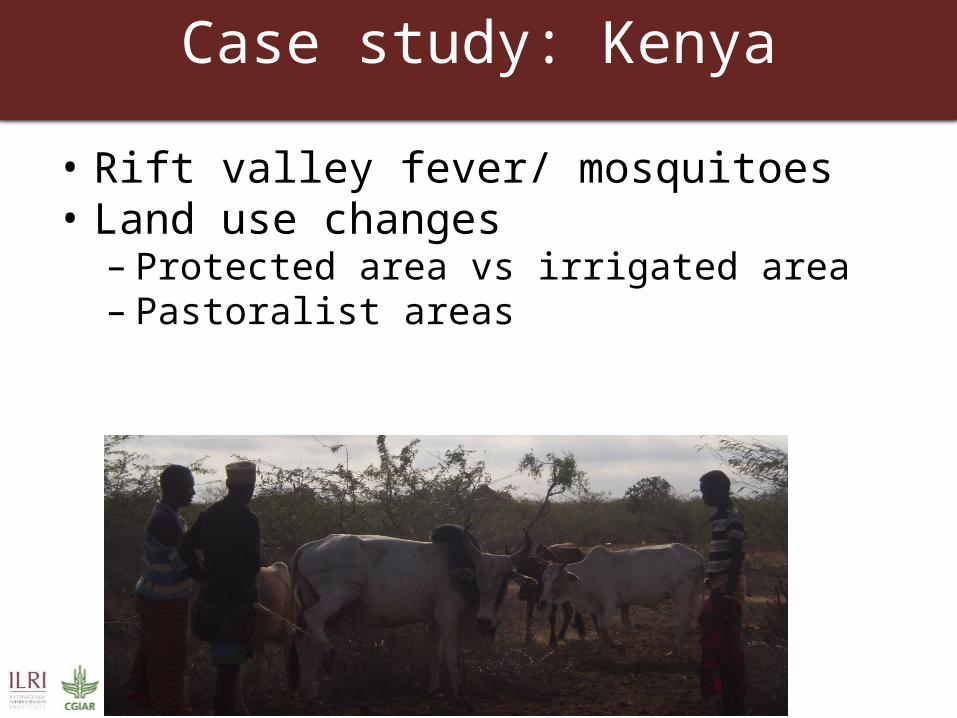
Case study: Kenya
• Rift valley fever/ mosquitoes• Land use changes
– Protected area vs irrigated area– Pastoralist areas
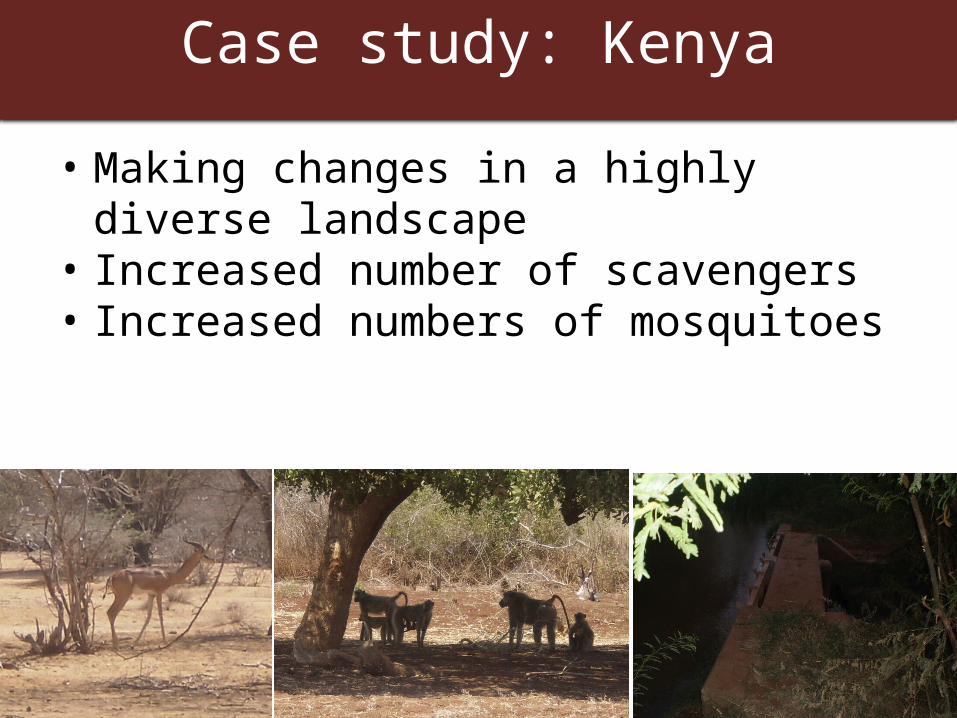
Case study: Kenya
• Making changes in a highly diverse landscape• Increased number of scavengers• Increased numbers of mosquitoes
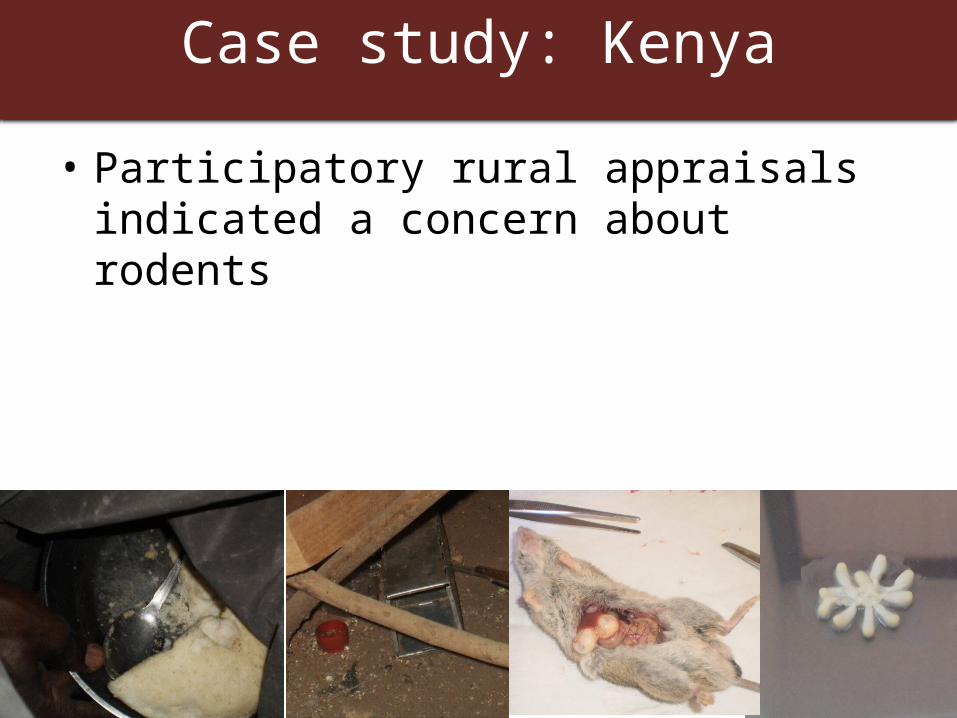
Case study: Kenya
• Participatory rural appraisals indicated a concern about rodents

Case study: Kenya
• What to study:– Can we trust hospital data?– Screen all febrile patients– Too many differentials: Malaria, RVF, Dengue, YF,
Brucella, Leptospira, Chikungunya, CCHF
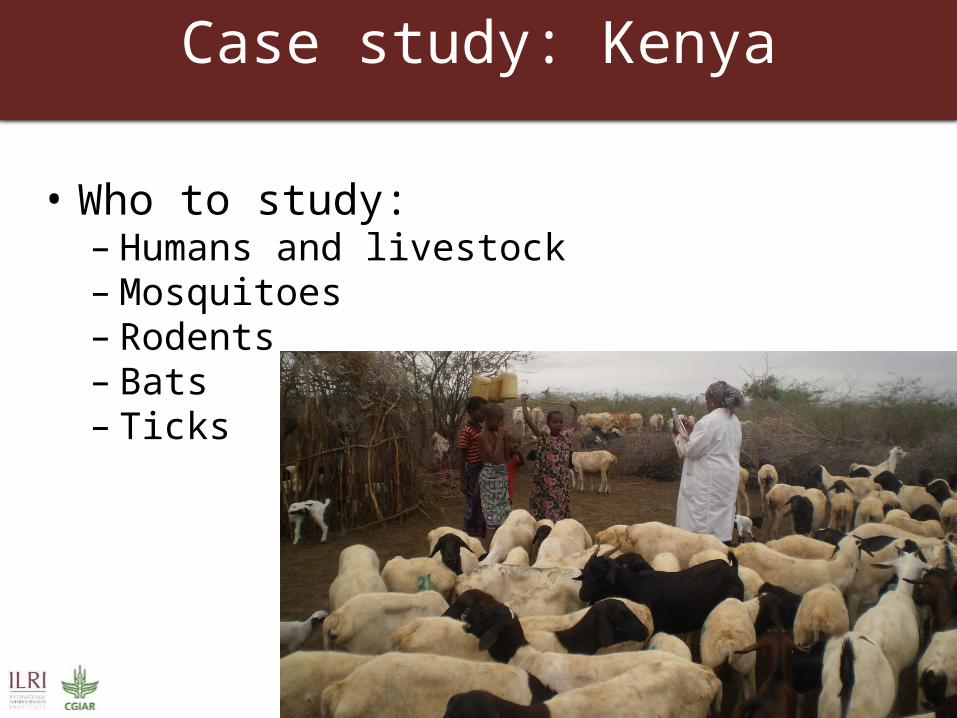
Case study: Kenya
• Who to study:– Humans and livestock– Mosquitoes– Rodents– Bats– Ticks
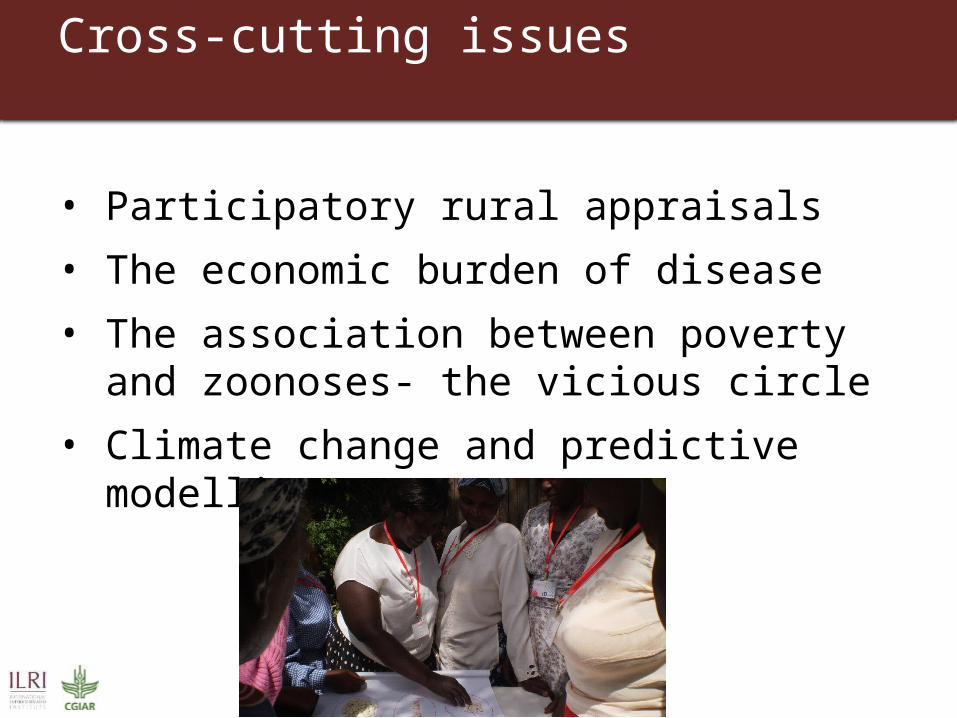
Cross-cutting issues
• Participatory rural appraisals• The economic burden of disease• The association between poverty and zoonoses-
the vicious circle• Climate change and predictive modelling
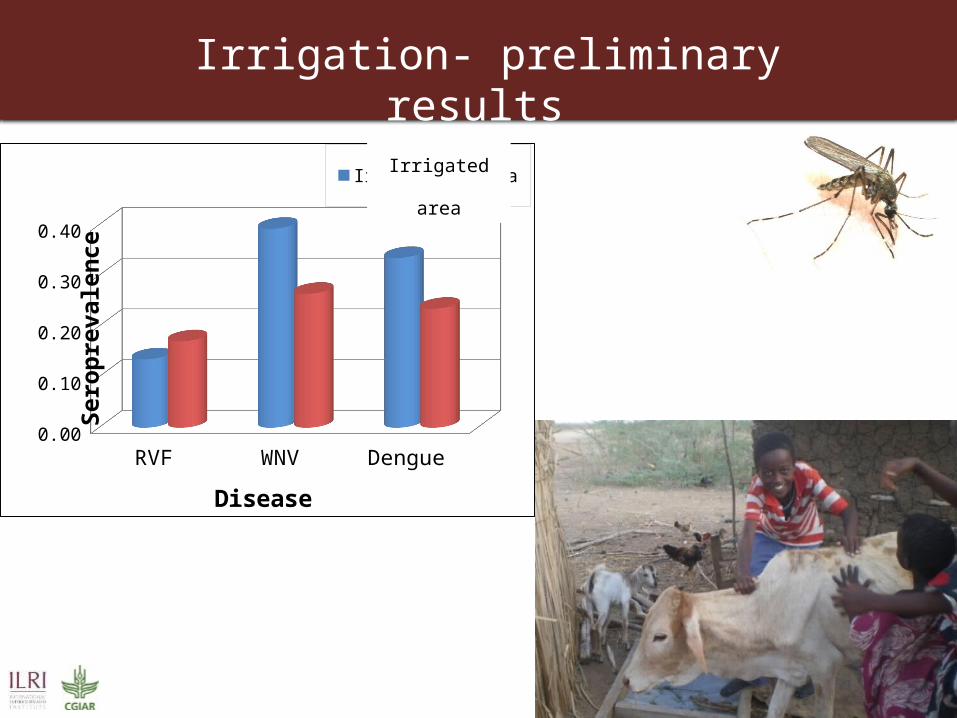
Irrigation- preliminary results
RVF WNV Dengue0.000.050.100.150.200.250.300.350.40
Irrigateed areaNon-irrigated area
Disease
Sero
prev
alen
ce
Irrigated area
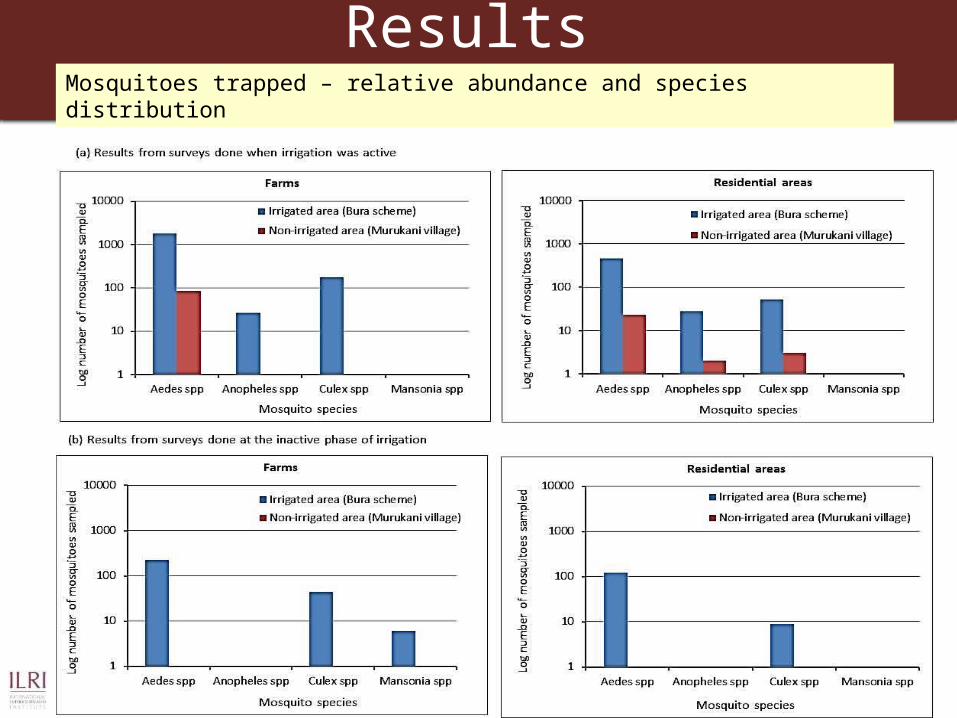
ResultsMosquitoes trapped – relative abundance and species distribution
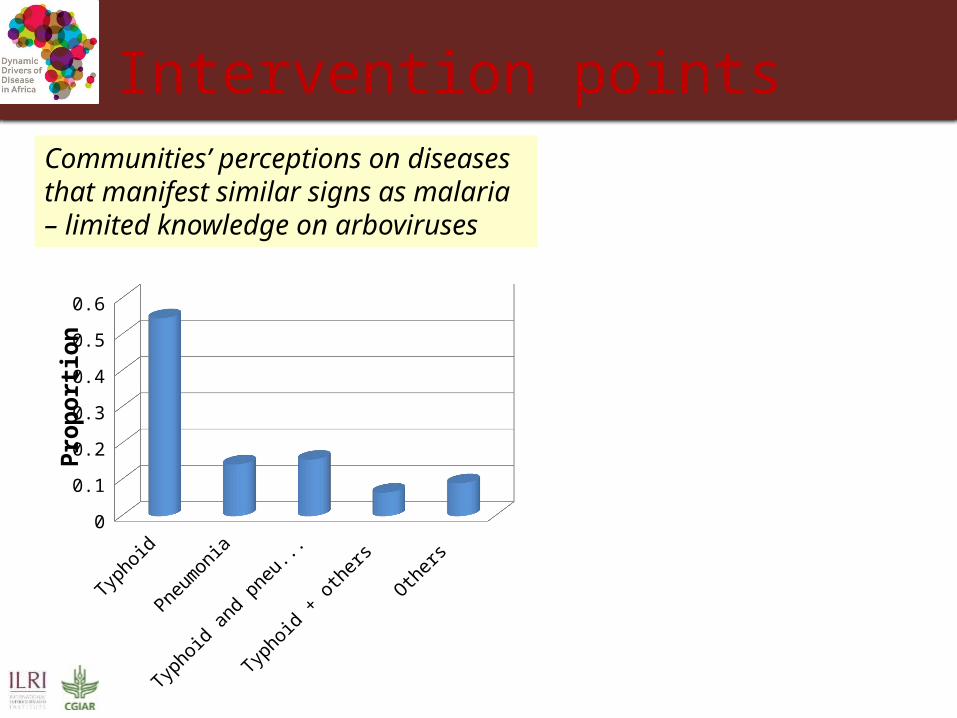
Intervention points
Typhoid
Pneumonia
Typhoid and pneumonia
Typhoid + others
Others 0
0.1
0.2
0.3
0.4
0.5
0.6
Prop
ortio
n
Communities’ perceptions on diseases that manifest similar signs as malaria – limited knowledge on arboviruses
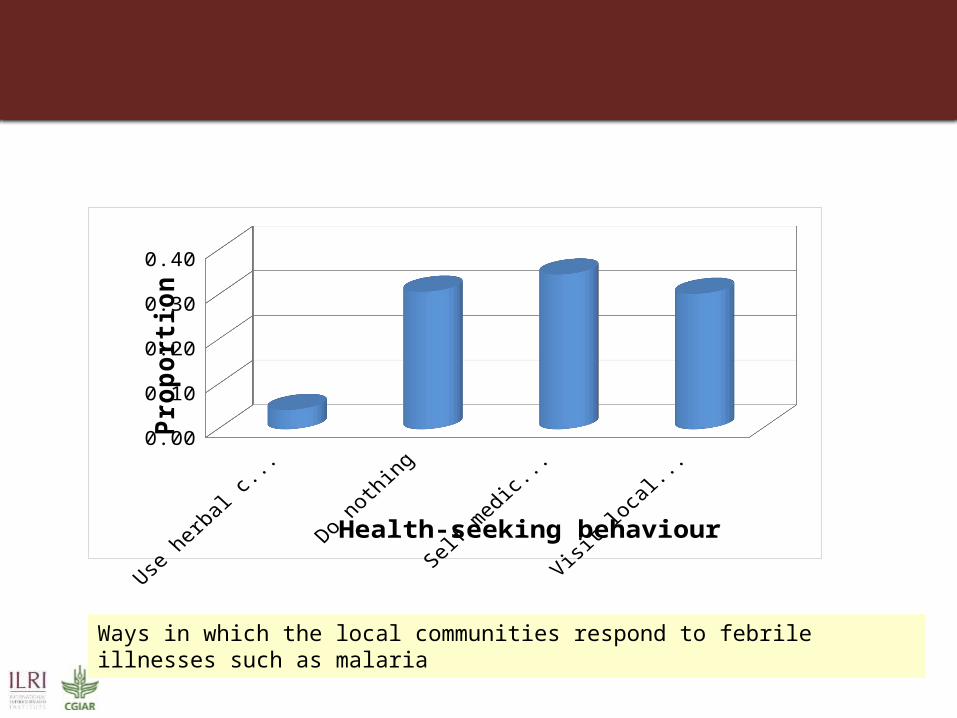
0.000.050.100.150.200.250.300.35
Health-seeking behaviour
Prop
ortio
n
Ways in which the local communities respond to febrile illnesses such as malaria

Unwillingness to pay for prevention
Mosquito nets
Vaccines & routine clinic visits for kids
Boiling or other water treatment
Insurance (annual fee)
Other health prevention
Mean 762 254 6.8 0.9 586Range 0-3150 0-5000 4 households paid
between 150-600 220 households paid nothing, one household paid 200
0-6000
How much did you spend last year on the following health protection (Kenyan shilling)?
Deworming Vaccinations (to prevent not to treat)
Tick and fly treatments
Insurance (annual fee)
Mean 928 437 599 0 Range 0-11000 0-5000 0-5000 Not existing
How much did you spend last year on the following health prevention for animals?
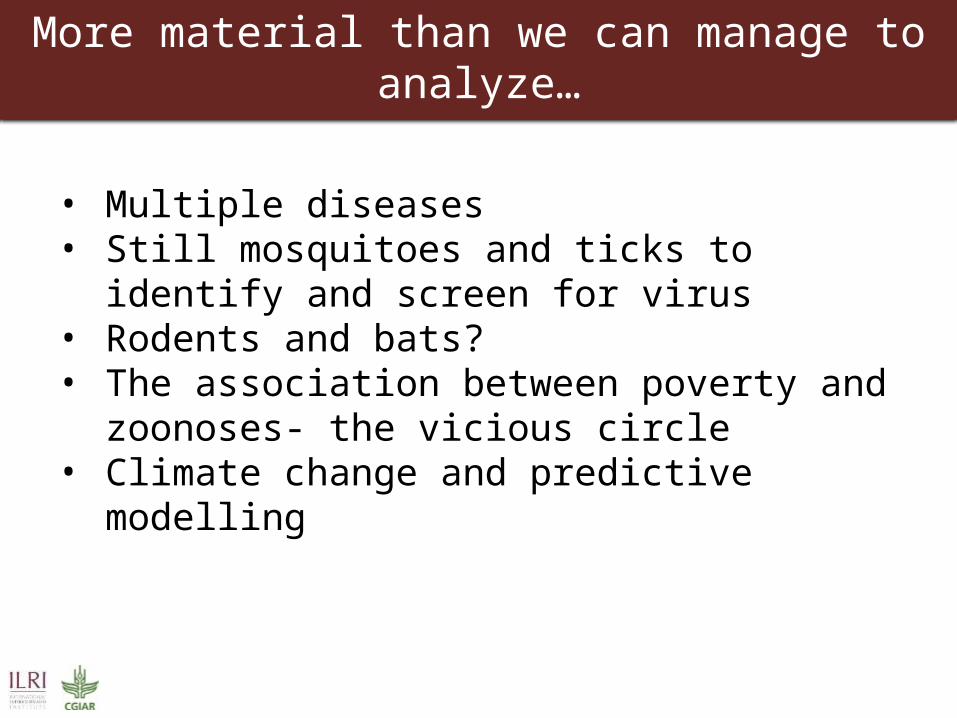
More material than we can manage to analyze…
• Multiple diseases• Still mosquitoes and ticks to identify and screen for
virus• Rodents and bats?• The association between poverty and zoonoses- the
vicious circle• Climate change and predictive modelling
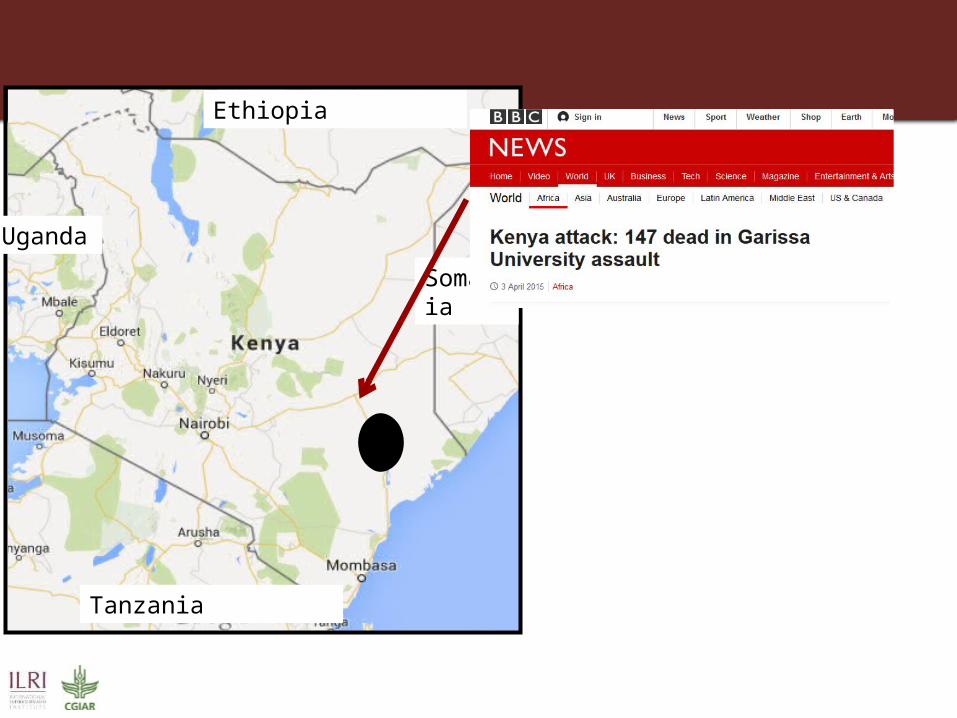
Tanzania
Ethiopia
Somalia
Uganda
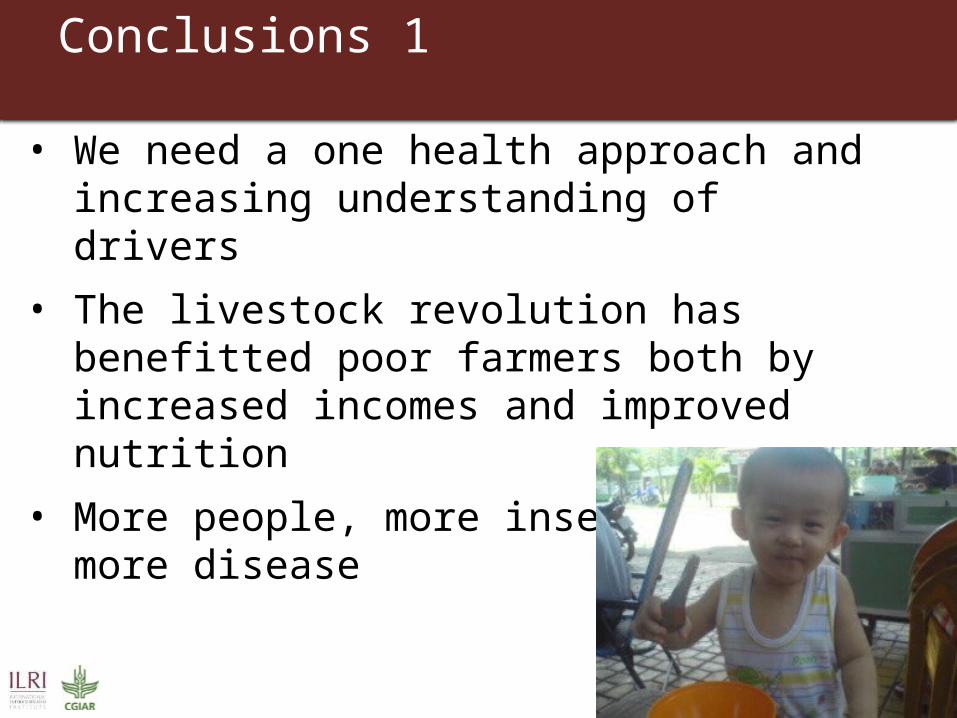
Conclusions 1
• We need a one health approach and increasing understanding of drivers
• The livestock revolution has benefitted poor farmers both by increased incomes and improved nutrition
• More people, more insecurity and more disease
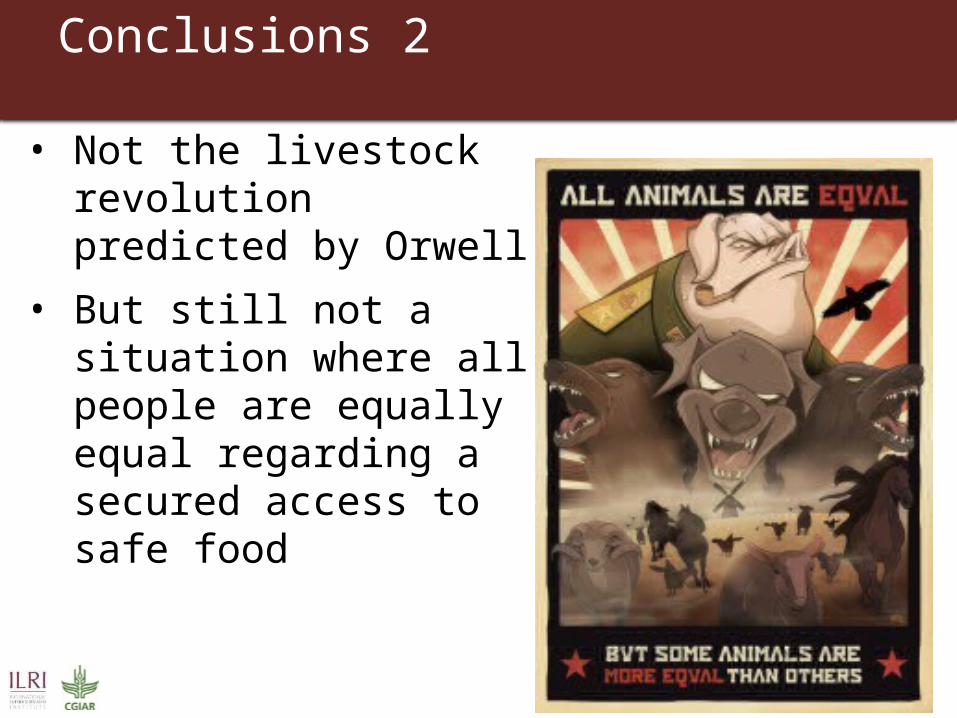
Conclusions 2
• Not the livestock revolution predicted by Orwell
• But still not a situation where all people are equally equal regarding a secured access to safe food
CGIAR Research Program on Agriculture for nutrition and health
Thanks to:Ram Deka and students in AssamBernard Bett and DDDAC team
Acknowledgements
The presentation has a Creative Commons licence. You are free to re-use or distribute this work, provided credit is given to ILRI.
better lives through livestock
ilri.org