Embed Size (px)
Citation preview

Oncology Oracle
Gregory Koytiger

Use cell line data to better match cancer patients and therapies
Cell lines are a rich source of drug sensitivity data,enables the training of 98 individual drug models
39, 571 Unique Drug - Cell line Sensitivity Values
Predict
675 Human cancer cell lines withRNA-seq Gene Expression

Linear models provide ease of interpretability andtransparency
Drug Sensitivity
Linear Model

Ridge regression keeps only a few significant genesin model
Drug Sensitivity
Linear Model
Ridge Regression

Automatic Relevance Determnation Regression tunesmodel sparsity from data
Drug Sensitivity
Linear Model
Ridge Regression
Automatic Relevance Determination Regression

Start with only the most highly varying genes
8000 of the highest varying genes in the Genentech data were chosen as features to reduce noise and for computational tractability
Drug Sensitivity
Linear Model
Ridge Regression
Automatic Relevance Determination Regression

Docetaxel model separates sensitive and resistantbreast cancer patients with 0.87 ROC AUC
False Positive Rate
True PositiveRate
Increasing Predicted Docetaxel Sensitivity
91% of sensitive patients treated85% of resistant patients avoid unnecessary treatment

Model predicts Cisplatin response in Lung SquamousCell Carcinoma

About Me
©20
14 N
atur
e A
mer
ica,
Inc.
All
right
s re
serv
ed.
T E C H N I C A L R E P O R T S
Functional interpretation of genomic variation is critical to understanding human disease, but it remains di�cult to predict the e�ects of speci�c mutations on protein interaction networks and the phenotypes they regulate. We describe an analytical framework based on multiscale statistical mechanics that integrates genomic and biophysical data to model the human SH2-phosphoprotein network in normal and cancer cells. We apply our approach to data in The Cancer Genome Atlas (TCGA) and test model predictions experimentally. We �nd that mutations mapping to phosphoproteins often create new interactions but that mutations altering SH2 domains result almost exclusively in loss of interactions. Some of these mutations eliminate all interactions, but many cause more selective loss, thereby rewiring speci�c edges in highly connected subnetworks. Moreover, idiosyncratic mutations appear to be as functionally consequential as recurrent mutations. By synthesizing genomic, structural and biochemical data, our framework represents a new approach to the interpretation of genetic variation.
TCGA and similar projects have generated extensive data on the muta -tional landscape of tumors1. To understand the functional consequences of these mutations, it is necessary to ascertain how they alter the pro-tein-protein interaction (PPI) networks involved in regulating cellular
Low-throughput methods such as �uorescence polarization spec-troscopy provide precise interaction data on a few dozen PIDs and ligands but cannot easily be scaled to the full proteome2, whereas high-throughput array-based methods provide greater scale but su�er from systematic artifacts and high false positive and false negative rates, resulting in data sets that only partly agree 2. An additional challenge is modeling the e�ects of mutations for pro-teins with multiple binding domains and/or multiple sites of phos-phorylation9, a reality for most signaling proteins (for example, the CRK oncoprotein). Existing methods are either limited to individual domains10–13 or are insu�ciently precise to discern the e�ects of single- residue changes14,15.
�e MSM framework we have developed combines genomic, bind-ing and structural data and reconciles inconsistencies within and among data sets to generate PID networks for normal and cancer cells. We develop a bottom-up �rst-principles approach, involving a single mathematical equation based on statistical mechanical ensem-bles, that models domains, proteins and networks, and we then apply this approach to the analysis of SH2 networks and mutations found in TCGA16. We validate newly predicted interactions experimentally and demonstrate the sensitivity of MSM to single-residue mutations that cause subtle changes in binding a�nity. Our analysis provides mechanistic insights into an important PID cancer network and vali-dates a computational approach to PID networks that can be applied
A multiscale statistical mechanical framework integrates biophysical and genomic data to assemble cancer networksMohammed AlQuraishi1–3, Grigoriy Koytiger1,3, Anne Jenney1, Gavin MacBeath2 & Peter K Sorger1
PTPN11 (SHP2)GRB2
STAT
5AST
AT6
STAT
1ST
AT4
STAT
2ST
AT3
STAP
1TE
NC1
TNS1
TNS3
TNS4
RIN1
SH2D5
SH2B1
SH2B2
SH2B3
SHC1
SHC3
PLCG1
PLCG2
BCAR3SH2D3CSH2D3AFERFES
CRKCRKLMATKHSH2DSH2D2ASHBSHFSHDSHEFGRYES1SRCHCKLCKLYNBLKSLA2
PTK6
PTPN6
PTPN11
ABL1G
RAPG
RB2N
CK
1N
CK
2PIK
3R1
PIK3R
3PIK
3R2
2N
HC
ITK
TXK
BTKTE
CBM
XSY
K
ZAP7
0
GRB
7
GRB1
4
GRB1
0
SH2D
1A
SH2D
1B
INPPL1BLNK
LCP2DAPP1VAV1VAV3VAV2RASA1SH3BP2
JAK2JAK3
SUPT6H
CBL
ANKS1A
ANKS1B
GULP1NUMB
NUMBL
DAB1
DAB2
APBA1
APBA2
APBA3
CCM2
DOK1
DOK2DOK4
DOK6DOK5
FRS3IRS1
IRS4APBB1
APBB2A
PBB
3SH
C2
APPL1
EPS8L2STAT
5AST
AT6
STAT
1ST
AT4
STAT
2ST
AT3
STAP
1TE
NC1
TNS1
TNS3
TNS4
RIN1
SH2D5
SH2B1
SH2B2
SH2B3
SHC1
SHC3
PLCG1
PLCG2
BCAR3SH2D3CSH2D3AFERFES
CRKCRKLMATKHSH2DSH2D2ASHBSHFSHDSHEFGRYES1SRCHCKLCKLYNBLKSLA2
PTK6
PTPN6
PTPN11
ABL1G
RAPG
RB2N
CK
1N
CK
2PIK
3R1
PIK3R
3PIK
3R2C
HN
2IT
KTX
KB
TKTEC
BMX
SYK
ZAP7
0
GRB
7
GRB1
4
GRB1
0
SH2D
1A
SH2D
1B
INPPL1BLNKLCP2
DAPP1VAV1VAV3VAV2RASA1SH3BP2JAK2
JAK3
SUPT6H
CBL
ANKS1A
ANKS1B
GULP1NUMB
NUMBL
DAB1
DAB2
APBA1
APBA2
APBA3
CCM2
DOK1
DOK2DOK4
DOK6DOK5
FRS3IRS1
IRS4APBB1
APBB2A
PBB
3SH
C2
APPL1
EPS8L2
Ph.D. Harvard UniversityDepartment of Chemistry and Chemical Biology
Postdoc Harvard Medical SchoolDepartment of Systems Biology
Management ConsultantDean & Co.
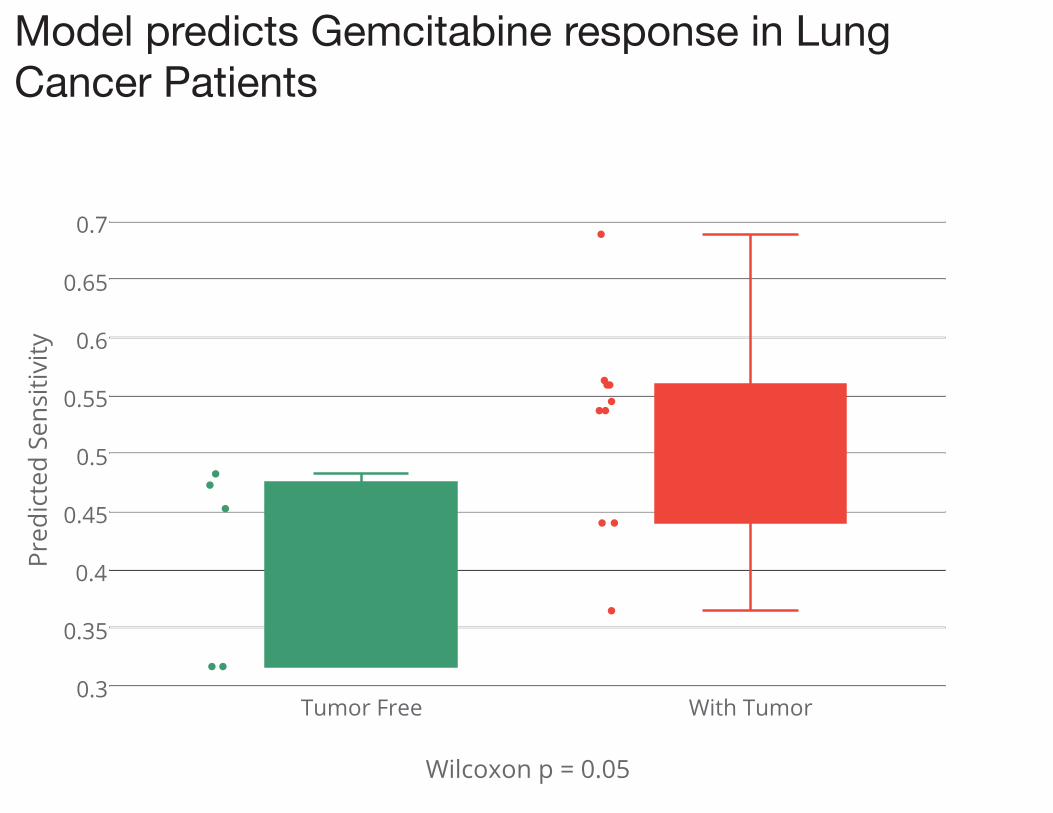
Model predicts Gemcitabine response in Lung Cancer Patients

Drug Train Size Spearman r Spearman p17-AAG 401 0.35 0.00681640 282 0.17 0.01A-443654 107 0.04 0.66A-770041 107 0.30 0.00ABT-263 294 0.15 0.01ABT-888 296 0.09 0.14AEW541 281 0.14 0.02AG-014699 293 0.27 0.00AICAR 296 0.29 0.00AKT inhibitor VIII 301 0.25 0.00AMG-706 294 0.20 0.00AP-24534 301 0.17 0.00AS601245 300 0.12 0.03ATRA 296 0.20 0.00AUY922 300 0.09 0.12AZ628 106 0.30 0.00AZD-0530 109 0.13 0.17AZD-2281 296 0.21 0.00AZD0530 282 0.27 0.00AZD6244 394 0.17 0.00AZD6482 283 0.21 0.00AZD7762 296 0.25 0.00AZD8055 292 0.24 0.00Afatinib 240 0.18 0.01Axitinib 296 0.18 0.00BAY 61-3606 300 0.22 0.00BI-2536 107 0.03 0.73BIBW2992 296 0.33 0.00BIRB 0796 294 0.14 0.02BMS-509744 107 0.17 0.09BMS-536924 107 0.41 0.00BMS-708163 294 0.19 0.00BMS-754807 300 0.12 0.04BX-795 293 0.37 0.00Bexarotene 303 0.11 0.06Bicalutamide 306 0.16 0.01Bleomycin 300 0.38 0.00Bortezomib 122 0.00 0.96Bosutinib 298 0.25 0.00
Drug Train Size Spearman rSpearman pBryostatin 1 300 0.13 0.02CCT007093 294 0.05 0.37CCT018159 287 0.21 0.00CEP-701 296 0.25 0.00CGP-082996 107 0.25 0.01CGP-60474 107 -0.07 0.49CHIR-99021 301 0.05 0.36CI-1040 294 0.49 0.00CMK 107 0.08 0.40Camptothecin 296 0.24 0.00Cisplatin 296 0.14 0.01Cyclopamine 106 0.13 0.18Cytarabine 299 0.28 0.00DMOG 301 0.27 0.00Dasatinib 117 0.33 0.00Docetaxel 305 0.46 0.00Doxorubicin 330 0.12 0.03EHT 1864 294 0.11 0.06Elesclomol 296 0.28 0.00Embelin 300 0.18 0.00Epothilone B 300 0.23 0.00Erlotinib 346 0.29 0.00Etoposide 323 0.15 0.01FH535 300 0.21 0.00FTI-277 301 0.03 0.60GDC-0449 296 -0.03 0.61GDC0941 291 0.12 0.04GNF-2 107 -0.04 0.71GSK-1904529A 300 0.14 0.01GSK-650394 300 0.23 0.00GSK269962A 106 -0.05 0.64GW 441756 296 0.18 0.00GW843682X 107 0.07 0.44Gefitinib 300 0.26 0.00Gemcitabine 316 0.12 0.04IPA-3 300 0.30 0.00Imatinib 128 0.18 0.04Irinotecan 165 0.13 0.09JNJ-26854165 293 0.34 0.00

Drug Train Size Spearman rSpearman pJNK Inhibitor VIII294 0.11 0.06JNK-9L 301 0.04 0.52JW-7-52-1 107 -0.03 0.77KIN001-135 107 0.09 0.38KU-55933 293 0.20 0.00L-685458 275 0.22 0.00LAQ824 300 -0.03 0.57LBW242 281 -0.04 0.48LFM-A13 300 0.03 0.58Lapatinib 354 0.32 0.00Lenalidomide 297 0.00 0.93MG-132 107 -0.23 0.02MK-2206 275 0.16 0.01MS-275 105 0.12 0.24Methotrexate 304 0.25 0.00Midostaurin 301 0.24 0.00Mitomycin C 316 0.12 0.03NSC-87877 301 0.19 0.00NU-7441 293 0.10 0.08NVP-BEZ235 292 0.14 0.01NVP-TAE684 109 0.20 0.03Nilotinib 383 0.07 0.15Nutlin-3 282 0.23 0.00Nutlin-3a 294 0.33 0.00OSI-906 300 0.25 0.00OSU-03012 300 0.23 0.00Obatoclax Mesylate300 0.35 0.00PAC-1 300 0.16 0.01PD-0325901 401 0.49 0.00PD-0332991 378 0.22 0.00PD-173074 294 -0.06 0.31PF-02341066 109 0.01 0.91PF-4708671 293 -0.03 0.62PF-562271 301 0.23 0.00PF2341066 282 0.24 0.00PHA-665752 348 0.21 0.00PLX4720 398 0.24 0.00Paclitaxel 369 0.17 0.00Panobinostat 278 0.44 0.00
Drug Train Size Spearman rSpearman pParthenolide 106 0.07 0.49Pazopanib 304 0.06 0.27Ponatinib 273 0.14 0.02Pyrimethamine 106 0.07 0.46QS11 300 0.11 0.06RAF265 258 -0.02 0.77RDEA119 292 0.51 0.00RO-3306 294 0.14 0.02Rapamycin 109 0.02 0.85Roscovitine 105 -0.06 0.54S-Trityl-L-cysteine107 0.05 0.62SB 216763 281 0.08 0.17SB590885 282 0.19 0.00SL 0101-1 291 0.00 0.99Salubrinal 106 -0.18 0.07Shikonin 301 0.21 0.00Sirolimus 106 0.05 0.63Sorafenib 353 0.02 0.73Sunitinib 125 0.31 0.00TAE684 282 0.14 0.02TGX221 107 0.11 0.25TKI258 282 0.09 0.13TW 37 293 0.24 0.00Temsirolimus 298 0.27 0.00Thapsigargin 300 0.30 0.00Tipifarnib 300 0.08 0.17Topotecan 295 0.28 0.00VX-680 107 -0.03 0.75VX-702 296 -0.08 0.18Vinblastine 306 0.29 0.00Vinorelbine 312 0.15 0.01Vorinostat 307 0.23 0.00WH-4-023 107 0.18 0.07WZ-1-84 107 0.19 0.05XMD8-85 106 0.36 0.00Z-LLNle-CHO 107 -0.17 0.07ZD-6474 277 0.13 0.04ZM-447439 283 0.02 0.77
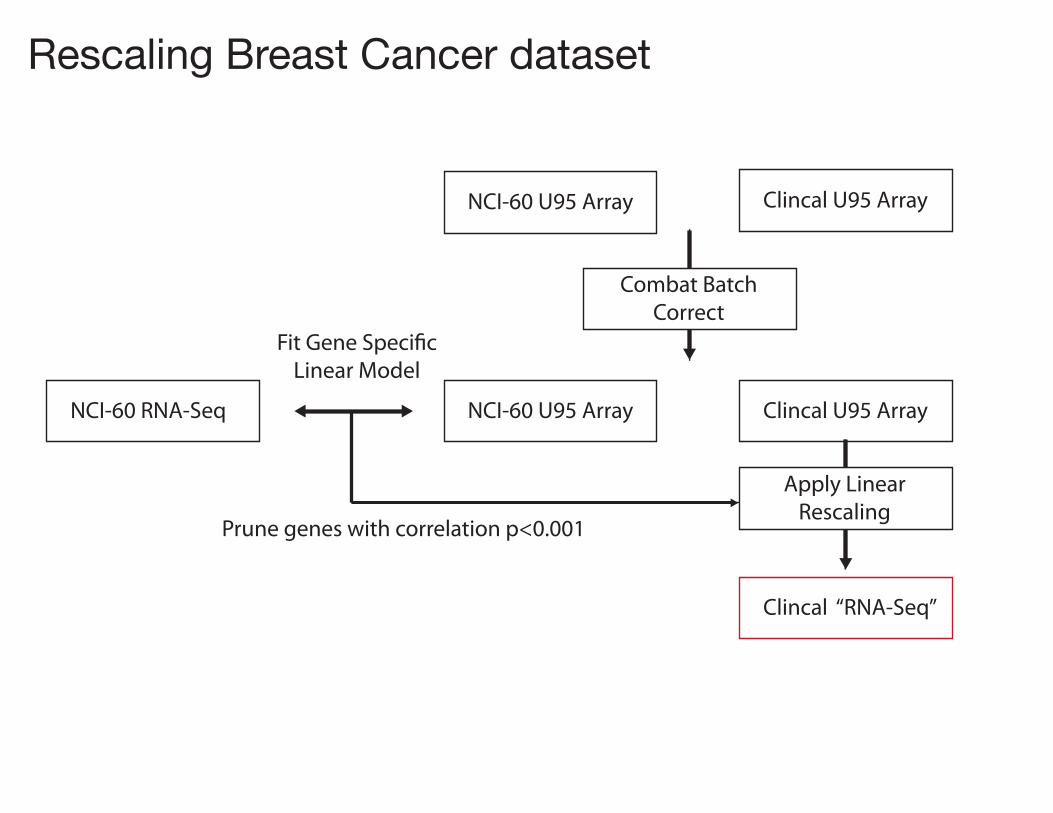
Rescaling Breast Cancer dataset
NCI-60 U95 Array Clincal U95 Array
Combat BatchCorrect
NCI-60 U95 Array Clincal U95 ArrayNCI-60 RNA-Seq
Fit Gene Speci�cLinear Model
Apply LinearRescaling
Clincal “RNA-Seq”
Prune genes with correlation p<0.001

ARD Regression
y
λ
~ N (0 , λ In)
w
w ~ N (0 , α )
α
X
y = Xw +
λ1 λ2
p(λ ) = Γ(λ1, λ2)
γ i1 γ i2
p(α i ) = Γ(γ i1, γi2)
Drug Sensitivity
Linear Model
Ridge Regression
Automatic Relevance Determination Regression