Embed Size (px)
Citation preview
Acta Scientiarum http://www.uem.br/acta ISSN printed: 1679-9275 ISSN on-line: 1807-8621 Doi: 10.4025/actasciagron.v39i1.30763
Acta Scientiarum. Agronomy Maringá, v. 39, n. 1, p. 99-108, Jan.-Mar., 2017
Multivariate technique for determination of soil pedoenvironmental indicators in Southern Amazonas
Ivanildo Amorim de Oliveira1*, José Marques Júnior1, Milton César Costa Campos2, Renato Eleotério de Aquino1, Ludmila de Freitas1 and Antônio Sérgio Ferraudo3 1Departamento de Solos e Adubos, Faculdade de Ciências Agrárias e Veterinárias, Universidade Estadual “Julio de Mesquita Filho”, Via de Acesso Prof. Paulo Donato Castellane, s/nº, 14884-900, Jaboticabal, São Paulo, Brazil. 2Departamento de Agronomia, Universidade Federal do Amazonas, Humaitá, Amazonas, Brazil. 3Departamento de Ciências Exatas, Faculdade de Ciências Agrárias e Veterinárias, Universidade Estadual Paulista "Júlio de Mesquita Filho", Jaboticabal, São Paulo, Brazil. *Author for correspondence. E-mail: [email protected]
ABSTRACT. The use of statistical techniques to evaluate soil attribute behaviour is an important tool for choosing the most adequate form of soil management. Thus, the aim of this study was to jointly assess the physical and chemical attributes and the magnetic susceptibility characteristics of three environments and to use multivariate statistics to define which attributes have the greatest potential as environmental change indicators. The study was conducted in three areas: one with archaeological black earth (and planted maize); one with pasture; and one of the forest. Sixty-four (64) deformed and non-deformed soil samples each were collected within these areas, with a 70 x 70 m grid spaced every 10 meters at depths of 0.0-0.2 and 0.4-0.6 m, to determine the chemical attributes (fertility), as well as the physical attributes (texture) and magnetic susceptibility. The data were analyzed through multivariate statistics. The archaeological dark earth areas have different behaviours between pastures and forests: chemical attributes have greater interaction in archaeological dark earth due to the high fertility of the anthropic horizons. The attributes that may indicate environmental changes are calcium, potential acidity and clay for archaeological dark earth, forest and pasture areas, respectively. Keywords: main component, Amazonian, archaeological dark earth.
Técnicas multivariadas na determinação de indicadores pedoambientais de solos na região Sul do Amazonas
RESUMO. O uso de técnicas estatísticas a fim de avaliar o comportamento de atributos do solo é uma importante ferramenta na determinação de manejo e uso adequado de solos. Sendo assim, o objetivo deste trabalho foi avaliar conjuntamente os atributos físicos, químicos e a suscetibilidade magnética do solo na caracterização de três ambientes e definir quais atributos apresenta potencial no estudo de indicadores de mudanças ambientais, por meio de estatísticas multivariadas. O estudo foi realizado em três áreas, sendo uma área com terra preta arqueológica (TPA) (cultivada com milho), uma com floresta e uma com pastagem. Nestas áreas foram coletadas 64 amostras de solos deformadas e indeformadas em malhas de 70 x 70m com espaçamento regular de 10m nas profundidades de 0,0-0,2 e 0,4–0,6 m para determinação dos atributos químicos (fertilidade), físicos (textura) e suscetibilidade magnética. Os dados foram analisados submetendo-os a técnicas de estatísticas multivariadas. A TPA apresenta comportamento diferenciado da pastagem e floresta, sendo que os atributos químicos apresentam maior interação para TPA em razão da alta fertilidade de horizontes antrópicos. Os atributos possíveis indicadores de mudanças ambientais são o cálcio para TPA, acidez potencial para a floresta e argila para a pastagem. Palavras-chave: componente principal, Amazônia, terra preta arqueológica.
Introduction
Soil behaviour can be studied by assessing several factors, such as the nutrient levels, which correspond to soil fertility (Silva, Lima, Xavier, & Teixeira, 2010a), and physical attributes that represent the soil structure’s organization and the microorganisms that are responsible for mineralization processes and thus represent a potential nutrient supply source for plants.
The evaluation of these soil factors, when performed using univariate methods, increases the scale of the problem and becomes an expensive process (Silva et al., 2010a). An alternative is the use of multivariate analysis, which is an important tool for the exploratory data analysis of soil because it allows the grouping of samples according to similarity while still enabling the selection of the most important variables to discriminate between
100 Oliveira et al.
Acta Scientiarum. Agronomy Maringá, v. 39, n. 1, p. 99-108, Jan.-Mar., 2017
pre-selected groups (Benites, Moutta, Coutinho, & Balieiro, 2010). However, current research has increasingly reported on the need to develop indicators of global impacts for land use and occupation (Rockström et al., 2009). Such studies are even more necessary for areas with high environmental sensitivity, such as those found in the landscape of the Amazonian deforestation arc located in Southern Amazonas State.
Some multivariate statistical techniques can be applied to soil properties to establish the use of pedoenvironmental indicators; these techniques include principal component analysis (PCA), which aims to reduce the problem dimensionally and ease data interpretation. According to Barroso and Artes (2003), this analysis of factors is a statistical technique that aims to describe the dependence structure of a set of changeable variables and measure commonalities.
The goal of discriminant analysis (DA) is to identify the variables that discriminate groups and choose the most appropriate group to which they should belong based on their characteristics (Hair, Anderson, Tatham, & Black, 2005). Some researchers have used Quality Control Charts to evaluate the behaviour of attributes. This chart is one of the main tools used in statistical quality control and may be indicative of how variables behave in each studied management (Kume, 1993). The combined use of these techniques based on soil attribute behaviours can aid in decision-making, ideal land use and handling and may further indicate possible attributes that are undergoing major changes due to human interference.
The aim of this study was to jointly assess the soil’s physical and chemical attributes and its magnetic susceptibility in three different environments and to use these data, by means of multivariate statistics, to define which attributes have great potential as indicators of environmental changes in Southern Amazonas.
Material and methods
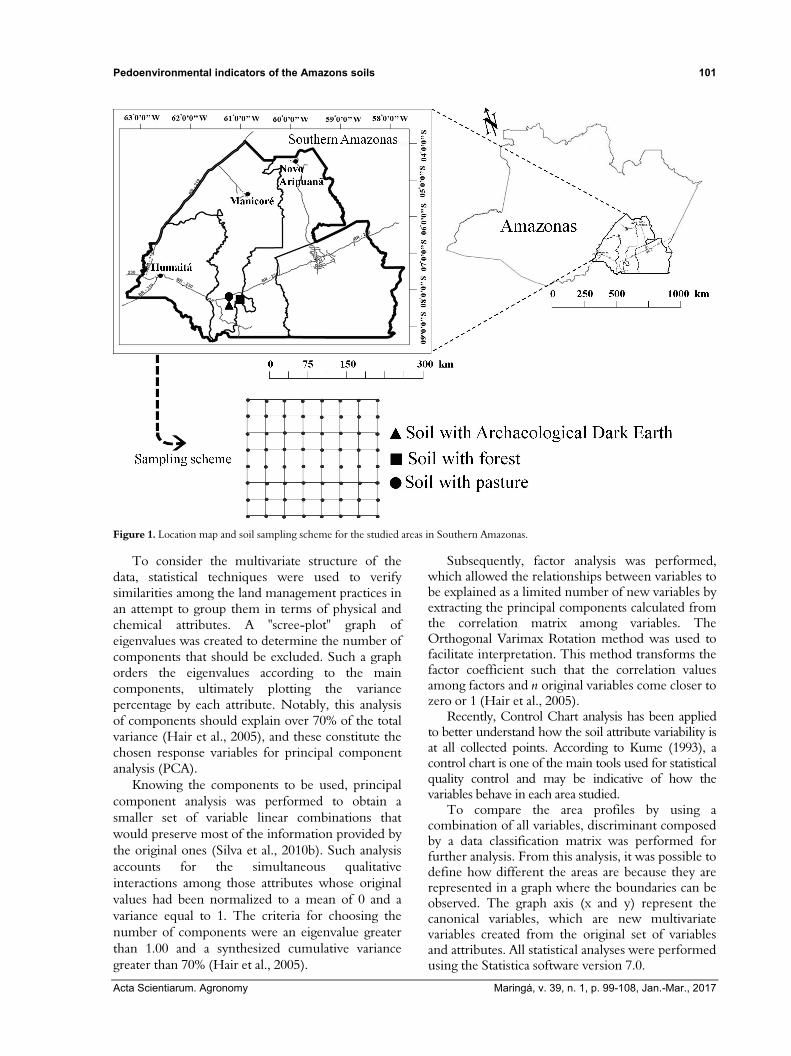
The study was performed in farms located around road BR 230, in Manicoré City, Transamazônica, Amazonas State, Brazil. Soil sampling was conducted in areas with three different uses. One was forest, located at 7º 54' 44.5" S and 61º 31' 44.7" W, at an average altitude of 140 m (Figure 1); it is characterized as a Tropical Dense Rainforest that contains by 20- to 50-m-tall trees.
Another was on soil with an anthropic horizon, i.e., archaeological dark earth (ADE) sited at 7º 55’ 02.1” S and 61º 31’ 45.2” W, which is 102 m in altitude and had been under corn cultivation for 120 days. The last one was a pasture area at 07º 54’ 42” S, 61º 31’ 50” W and a 135 m mean altitude that had been under intensive pasturing with brachiaria (Brachiaria brizanta) at 1 animal unit per hectare capacity. Moreover, the soils were classified as Alitic Plinthic Red Argisols (Ultisols), except for the area with ADE, which was rated as Dystrophic Abrupt Red-Yellow Argisol (Ultisol) (Empresa Brasileira de Pesquisa Agropecuária [Embrapa], 2013).
These soils were derived from Rondonian granites from the Upper Precambrian. The Köppen classification for the region’s climate is a rainy tropical type with a short dry period (Am), temperatures ranging between 25 and 27°C, and rainfall between 2,250 and 2,750 mm per year, with the greatest concentration of rainfall from October to June (Oliveira, Campos, Freitas, & Soares, 2015).
Seventy-square-meter grids were established in these areas surrounded by 0.49 ha. Soil samples were collected at the cross-points, which were at 10-metre intervals, for a total of 64 sampling points within each grid (Figure 1). Then, at each point, the collection of soil samples from 0.0 to 0.2 m and 0.4 to 0.6 m depths was performed.
Disturbed soil samples were collected for particle size analysis by the pipette melthod, which used a 0.1 mol L-1 NaOH solution as a chemical dispersant and mechanical stirring in a high-rotation apparatus for 15 minutes, according to the methodology proposed by Empresa Brasileira de Pesquisa Agropecuária (Embrapa, 2011). Using the ion exchange resin method, the exchangeable calcium (Ca2+), magnesium (Mg2+), potassium (K+), available phosphorus (P), and potential acidity (H+Al) were determined (Raij, Andrade, Cantarella, & Quaggio, 2001). The pH was measured potentiometrically using a 1:2.5 ratio of soil and water (Empresa Brasileira de Pesquisa Agropecuária [Embrapa], 2011). The total carbon was quantified by Walkley-Black’s method, and organic matter was estimated from the organic carbon content.
A Bartington MS2 coupled to a Bartington MS2B sensor was used to determine the magnetic susceptibility (MS) in fine air-dried soil samples (FADS). The evaluation was made at a low frequency (0.47 kHz) to obtain more accurate results because it was a single reading (Bartington Instruments [Bartington], 2013).
Pedoenvironmental indicators of the Amazons soils 101
Acta Scientiarum. Agronomy Maringá, v. 39, n. 1, p. 99-108, Jan.-Mar., 2017
Figure 1. Location map and soil sampling scheme for the studied areas in Southern Amazonas.
To consider the multivariate structure of the data, statistical techniques were used to verify similarities among the land management practices in an attempt to group them in terms of physical and chemical attributes. A "scree-plot" graph of eigenvalues was created to determine the number of components that should be excluded. Such a graph orders the eigenvalues according to the main components, ultimately plotting the variance percentage by each attribute. Notably, this analysis of components should explain over 70% of the total variance (Hair et al., 2005), and these constitute the chosen response variables for principal component analysis (PCA).
Knowing the components to be used, principal component analysis was performed to obtain a smaller set of variable linear combinations that would preserve most of the information provided by the original ones (Silva et al., 2010b). Such analysis accounts for the simultaneous qualitative interactions among those attributes whose original values had been normalized to a mean of 0 and a variance equal to 1. The criteria for choosing the number of components were an eigenvalue greater than 1.00 and a synthesized cumulative variance greater than 70% (Hair et al., 2005).
Subsequently, factor analysis was performed, which allowed the relationships between variables to be explained as a limited number of new variables by extracting the principal components calculated from the correlation matrix among variables. The Orthogonal Varimax Rotation method was used to facilitate interpretation. This method transforms the factor coefficient such that the correlation values among factors and n original variables come closer to zero or 1 (Hair et al., 2005).
Recently, Control Chart analysis has been applied to better understand how the soil attribute variability is at all collected points. According to Kume (1993), a control chart is one of the main tools used for statistical quality control and may be indicative of how the variables behave in each area studied.
To compare the area profiles by using a combination of all variables, discriminant composed by a data classification matrix was performed for further analysis. From this analysis, it was possible to define how different the areas are because they are represented in a graph where the boundaries can be observed. The graph axis (x and y) represent the canonical variables, which are new multivariate variables created from the original set of variables and attributes. All statistical analyses were performed using the Statistica software version 7.0.
102 Oliveira et al.
Acta Scientiarum. Agronomy Maringá, v. 39, n. 1, p. 99-108, Jan.-Mar., 2017
Results and discussion
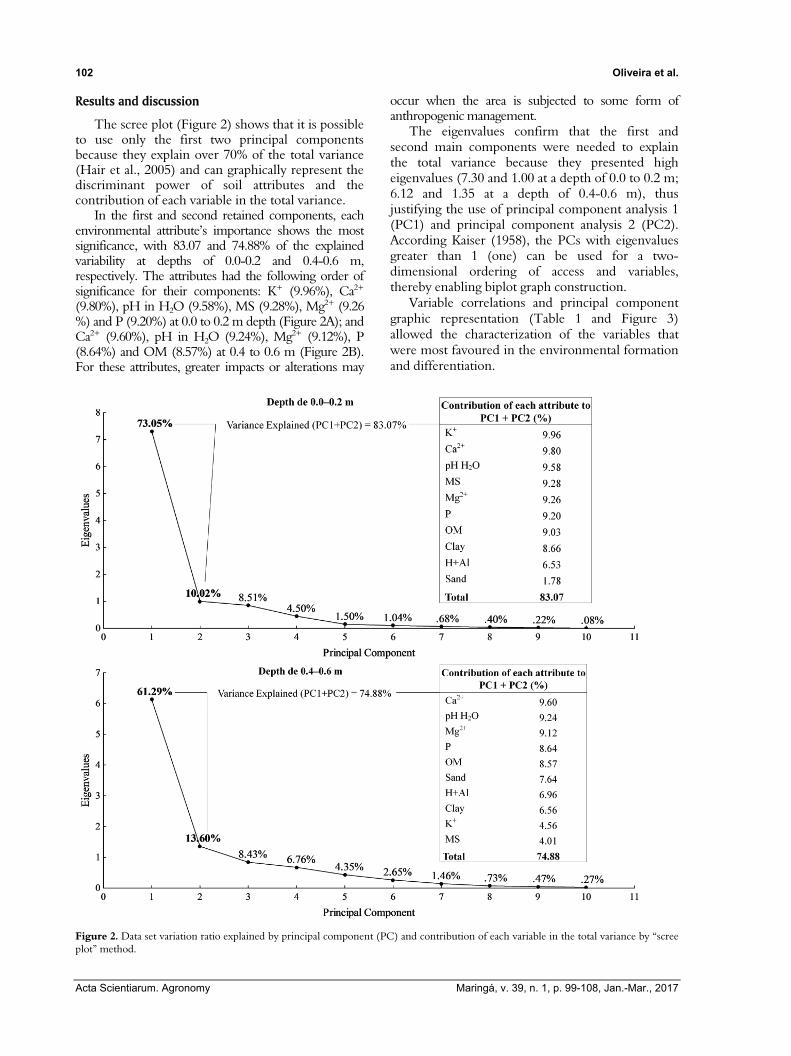
The scree plot (Figure 2) shows that it is possible to use only the first two principal components because they explain over 70% of the total variance (Hair et al., 2005) and can graphically represent the discriminant power of soil attributes and the contribution of each variable in the total variance.
In the first and second retained components, each environmental attribute’s importance shows the most significance, with 83.07 and 74.88% of the explained variability at depths of 0.0-0.2 and 0.4-0.6 m, respectively. The attributes had the following order of significance for their components: K+ (9.96%), Ca2+ (9.80%), pH in H2O (9.58%), MS (9.28%), Mg2+ (9.26 %) and P (9.20%) at 0.0 to 0.2 m depth (Figure 2A); and Ca2+ (9.60%), pH in H2O (9.24%), Mg2+ (9.12%), P (8.64%) and OM (8.57%) at 0.4 to 0.6 m (Figure 2B). For these attributes, greater impacts or alterations may
occur when the area is subjected to some form of anthropogenic management.
The eigenvalues confirm that the first and second main components were needed to explain the total variance because they presented high eigenvalues (7.30 and 1.00 at a depth of 0.0 to 0.2 m; 6.12 and 1.35 at a depth of 0.4-0.6 m), thus justifying the use of principal component analysis 1 (PC1) and principal component analysis 2 (PC2). According Kaiser (1958), the PCs with eigenvalues greater than 1 (one) can be used for a two-dimensional ordering of access and variables, thereby enabling biplot graph construction.
Variable correlations and principal component graphic representation (Table 1 and Figure 3) allowed the characterization of the variables that were most favoured in the environmental formation and differentiation.
Figure 2. Data set variation ratio explained by principal component (PC) and contribution of each variable in the total variance by “scree plot” method.
Pedoenvironmental indicators of the Amazons soils 103
Acta Scientiarum. Agronomy Maringá, v. 39, n. 1, p. 99-108, Jan.-Mar., 2017
Table 1. Correlation among each principal component and the studied variables.
Variables Principal component
--Depth 0.0 – 0.2 m--- --Depth 0.4 – 0.6 m-- PC1 PC2 PC1 PC2
Sand -0.420577 0.034579 -0.850816* 0.199056 Clay 0.930401* -0.016233 0.747539* 0.311334 pH H2O -0.978538* 0.019005 -0.960924* -0.015644Potential acidity 0.804035* -0.079144 0.798272* 0.241429 Organic matter -0.948272* -0.057533 -0.329314 0.865057*Phosphorus -0.958909* 0.012626 -0.928323* -0.047597Potassium -0.080809 -0.994790* 0.293114 0.608593 Calcium -0.989511* 0.026008 -0.977922* 0.058434 Magnesium -0.962230* -0.016517 -0.934860* 0.194632 MS -0.963315* 0.001161 -0.631510* -0.047930*Most significant values; PC1: principal component 1; PC2: principal component 2; PC3: principal component 3. MS: magnetic susceptibility
The variables that were most strongly correlated with the ADE area at a depth of 0.0 to 0.2 m were pH in H2O, OM, Ca2+, Mg2+, P and MS (Table 1 and Figure 3A), which appeared in the third and fourth quadrants with a small angle to the abscissa. The ADE soils have higher OM contents, which gives them greater fertility. High levels of P are also a striking feature of the ADEs. Cunha et al. (2009) reported P contents of 116 mg kg-1 in ADE areas under the forests of archaeological sites in Amazonas State; 290.5 mg kg-1 under ADE cropped areas; and 4.7 mg kg-1 in non-anthropogenic areas. The incorporation of organic waste, especially fish bones, turtle shells, animal or even human bones, which are rich in P, contributed to the high content in ADEs (Lima, Schaefer, Mello, Gilkes, & Ker, 2002).
The Ca2+ and Mg2+ values are also high in ADEs as observed by Barros, Lima, Canellas, and Kern (2012), which justifies their connection to this environment. This behaviour is due to either the incorporation of calcium-rich bones from the Pre-Columbian period or a higher Ca2+ from exchange surfaces, which results in less leaching. Campos, Santos, Mantovanelli, and Soares (2012a) found Ca2+ and Mg2+ higher values in ADEs for non-anthropogenic soils, thus affirming a strong correlation of these attributes to ADE (Table 1).
MS is also highly related to ADE area at 0.0 to 0.2 m of depth (Table 1 and Figure 3A). The OM presence favours the conditions that are required for iron reduction, which promotes increased susceptibility.
Pasture and forest areas are featured by greater bond to clay and potential acidity (H+Al) (Table 1 and Figure 3A). The potential acidity values of forest areas were greater across the environments, probably
due to the higher leaching from intense rainfall with drainage systems (Campos, Ribeiro, Souza Júnior, Ribeiro Filho, & Oliveira, 2010; Campos, Ribeiro, Souza Júnior, Ribeiro Filho, & Almeida, 2012b).
In the subsurface layer (0.40-0.6 m), a behaviour similar to the surface layer (0.0 to 0.2 m) can be observed. The subsurface variables that were strongly correlated with ADE were sand pH in H2O, OM, Ca2+, Mg2+, P and MS (Table 1 and Figure 3B). In contrast, the pasture area was characterized by a closer link to clay (Figure 5B), in accordance with the smallest angle relative to the abscissa’s axis, probably due to the presence of a clay-like soil. The forest has a strong connection with the H+Al (Figure 3B), as stated by Campos et al. (2012b); this condition is due to the increased leaching promoted by the intense rainfall associated with better drainage conditions in the Amazonian environment.
Based on these results, it can be stated that the forest and pasture environments are more similar or that they have more physical, chemical and MS homogeneous behaviours (Table 1 and Figure 3). However, the ADE presents as a unique environment that has peculiar chemical, physical and MSs for this type of environment (Figure 3A and B).
The factor analysis (Table 2) indicates that 73.69% of the data variability is explained by the first factor and that 10.24% is explained by the second factor; thus, 83.93% of the data variability is explained by the first two factors. This shows that of the 10 variables, two factors needed to be used, with 64 observations in the original set, resulting in a dimensional reduction of the original variables with an explanation loss lower than 20% (16.07%).
Table 2. Factorial analysis of soil attributes at the evaluated depths with factors (Factors 1 and 2) corresponding to the studied environments in Southern Amazonas.
Attributes ---Depth 0.0-0.2 m--- --Depth 0.4-0.6 m-- Factor 1 Factor 2 Factor 1 Factor 2
Sand 0.526836* 0.205837 0.830345* 0.267486Clay -0.927258* 0.031663 -0.764111* 0.266531pH H2O 0.978019* -0.021800 0.959871* 0.048330Potential acidity -0.798974* 0.084820 -0.811210* 0.200701Organic matter 0.947510* 0.094369 0.248974 0.918742*Phosphorus 0.955780* -0.002876 0.927550* 0.036452Potassium -0.027139 0.981456* -0.478394 0.514503*Calcium 0.989056* -0.013465 0.969478* 0.139332Magnesium 0.961184* -0.020344 0.915273* 0.265287MS 0.960728* 0.008044 0.632019* 0.046771Relative variance 73.69% 10.24% 61.81% 13.87%
*Most discriminant values; MS: Magnetic susceptibility.

104 Oliveira et al.
Acta Scientiarum. Agronomy Maringá, v. 39, n. 1, p. 99-108, Jan.-Mar., 2017
ADEADE
ADEADE
ADE
ADEADEADE
ADEADEADEADE ADEADEADE ADEADEADE
ADEADEADEADEADE ADEADE ADEADEADE
ADE
ADE
ADEADE ADEADEADEADE
ADE
ADEADE ADE
ADEADE ADE ADE
ADEADE ADE
ADEADE ADEADEADE ADEADE
ADEADE
ADEADEADE ADEADEADEADE
ADE
FFF
FF F
F FFF
F
F
F
FF FFF
FF
FFF
FF
FF FFF
F FF
F FFF
F FFFFF
F
FFF FFF
FFFF FF
F
F
FF F
F
FFPP P
P PPP
PP
PP
P PP
P
P
P
PPP
P
P
PP
P
P
P
PP P
PP P
P P
P
P
PPPP
PP
P
P P
P
P
P
P PP P PPP
P
P
PPPP
PP
-6 -5 -4 -3 -2 -1 0 1 2 3 4 5 6-8
-6
-4
-2
0
2
4
6
8
PC1: 73.05%
PC2:
10 .
02%
H+AlClayMg2+
MSpH H2O
A
K+
Sand
Ca2+P
OM
ADEADEADEADE
ADE
ADEADEADE
ADE
ADEADEADE
ADEADE
ADE
ADE
ADEADEADE ADEADEADE
ADE ADEADE
ADEADE
ADE
ADEADE
ADEADE
ADEADE
ADE
ADEADE
ADE
ADE
ADE
ADE
ADE
ADEADE
ADEADE
ADEADEADE
ADE
ADEADE
ADE
ADE
ADEADE
ADE
ADE
ADE
ADEADE
ADE
ADE
ADE
F FFF
F FF
F FF
F
F
FFF
F
FF
F
F
FFF
FF FF
F
FF
F
F
FF
FFF
FF
FF
F
FF
FF
F
F FF
F
F
F
FFF
F
F
F
FF
F F
F
P
PP
P
P
PP
PP
PP
P
P
P
P
P
P
P
P
P
PP
PP
PP
P
PPP
P
P
PP
PP
P
P
P
PP
P P
P
PP
P
P
P
P
P
PPP P
PP
P
P PP
P
PP
-7 -6 -5 -4 -3 -2 -1 0 1 2 3 4 5 6 7-5
-4
-3
-2
-1
0
1
2
3
4
5
PC1: 61.29%
PC2:
13.
60%
K+
MS
Ca2+
SandMg2+
pH H2OP
H+Al
Clay
OMB
Figure 3. Principal component analysis of soil attributes in the studied environments. A = 0.0 – 0.2 m depth; B = 0.4 – 0.6 m depth; ADE= archaeological dark earth; P= pasture; F= forest.
In factor analysis, the weighting that defines which variables are the most important indicate that the variables that form factor 1 have high factor loadings (Table 2). These variables explain the higher percentage of variation and are the highest contributors to changes in soil characteristics as a function of land use. However, only potassium has a low discriminatory power among the studied attributes, which indicates that there is no difference in this attribute among the three environments in the first layer, as shown for Factor 2.
Clay and H+Al are directly proportional to the other attributes, which means that when the clay and H+Al contents increase, the other attributes decrease and vice-versa. Barreto, Lima, Freire, Araújo, and Freire (2006) observed a relation between potential acidity and soil pH. These authors observed that the higher the pH is, the lower the potential acidity is in
the forest. At the 0.4–0.6 m depth, it can be noted that there is a very similar behaviour among the attributes, in which the OM had a lower discriminating power and was expressed in Factor 2 together with K+. Thus, the higher the OM content is, the lower the K+ discriminant power is.
A Control Chart of attribute variability was designed for each environment to evaluate each attribute’s performance in the variability of all attributes together (Figure 4). The analysis enables clearly visualizing the boundaries between environments, showing their specific variability. However, ADE differs from pasture and forest at depths in the subsurface layer, where the variability in MS is smaller or where the attributes are more homogeneous. This analysis facilitates the interpretation of human interference on surface horizons, which differs from that observed for adjacent soils.

Pedoenvironmental indicators of the Amazons soils 105
Acta Scientiarum. Agronomy Maringá, v. 39, n. 1, p. 99-108, Jan.-Mar., 2017
0
2
4
6
8
10
12
14
16
18
20
22
T²
7,924
9,687
95,000% 90,000%
ADE ADEFOREST FORESTPASTURE PASTURE
0.0-0.2 m 0.4-0.6 m
Figure 4. Control Chart of attribute variability in each studied environment in Southern Amazonas.
It should be noted that ADE has the highest data variability, followed by forest and pasture. This finding demonstrates the influence of anthropogenic transformation in soils with anthropic horizons (ADEs). Archaeological evidence indicates that ancient human activities in Amazonian habitats significantly transformed the landscape within neighbouring settlements, especially in the late prehistoric period. A remarkable record of this is the soil areas altered by prehistoric men, which feature a dark colour, archaeological material remains (ceramic fragments and lithic artefacts) and high Ca2+, Mg2+, Zn, Mn, P and C contents (Kern et al., 2009).
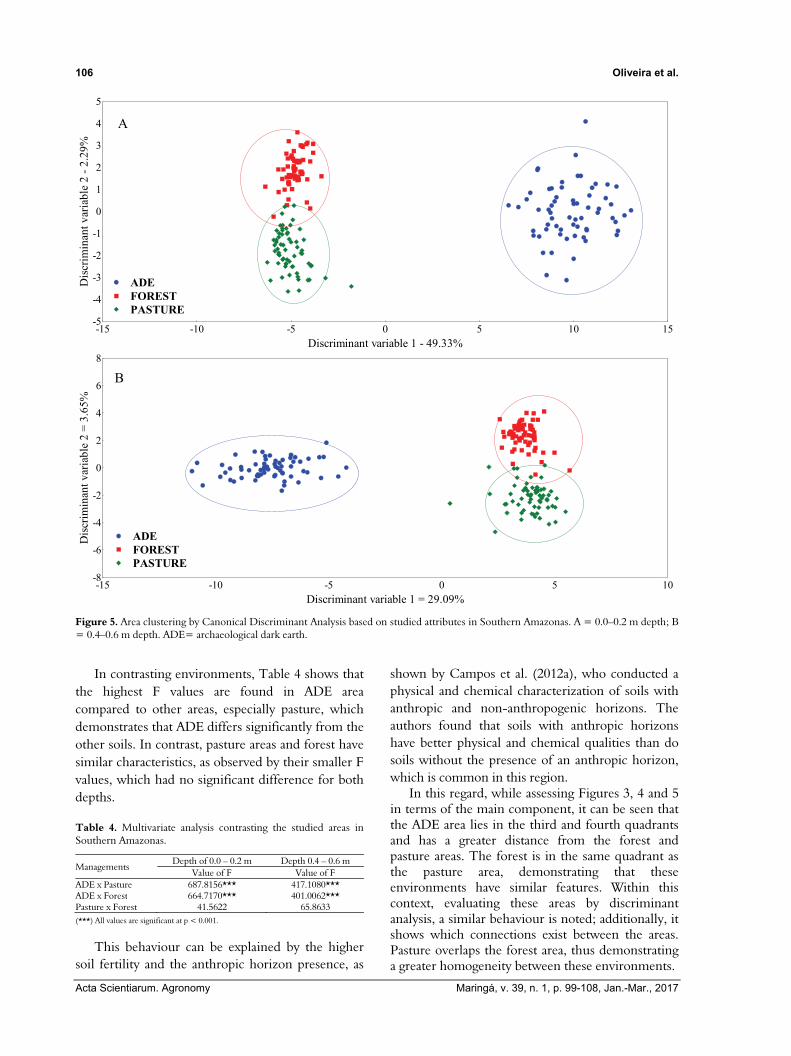
As mentioned above, ADE differs in that it is highly fertile. This behaviour is directly linked to greater data variability. In this sense, to verify the relationship between the existing variability among environments and their chemical, physical and MS, we applied a complementary technique using discriminant analysis, which has efficiently matched the results for all areas (Figure 5). By discriminant analysis, it was found that 51.62% of the studied relationship variability was explained in the first two roots (Figure 5) at the 0.0-0.20 m depth. The first canonical root (1 Can) explained 49.33%, and the second (Can 2) explained 2.29%. At the depth of 0.40-0.60 m, the first two roots explained 32.74% of the variance, with 29.09% in the first canonical root (Can 1) and 3.64% in the second (Can 2), totalling 32.73% of the variability among studied relationships.
The discriminant analysis results show that Can 1 is responsible for separating ADE from the other areas because ADE has soil with better physical and chemical qualities and has more distant characteristics of other environments. This separation is in accordance with the results of both the principal component analysis (Figure 5) and clustering analysis (Figures 3 and 4). Because the soil with anthropic horizon presents a higher fertility and higher OM content in relation to forest and pasture, this may have been the factor that most influenced the attribute characterization and MS of each area.
Through discriminant analysis, the most powerful attributes to discriminate between environments are pH in H2O, H+Al, OM and Ca2+ at both depths (Table 3). These results demonstrate that these chemical properties may be the most important and contribute the most to area discrimination.
Table 3. Canonical Discriminant Analysis values, highlighting each studied variable weight in Southern Amazonas.
Attributes --Depth of 0.0-0.2 m-- -Depth of 0.4-0.6 m- Can 1 Can 2 Can 1 Can 2
Sand 0.06287 -0.49534 -0.34401 -0.64447 Clay -0.19757 -0.50629 -0.22099 -0.46587 pH H2O 0.80518* -0.85966* -1.14584* -0.21075 Potential acidity 0.92197* 0.55627 -1.15091* 0.61098 Organic matter -1.01512* -1.89896* 0.96410* -1.32450* Phosphorus 0.01017 -0.46156 0.01965 -0.16534 Potassium -0.23310 0.37203 0.19983 0.23770 Calcium 1.02901* 1.86653* -1.02969* 0.83193 Magnesium 0.39721 0.09631 0.11768 0.06386 MS 0.25995 -0.04610 -0.05913 0.00575
* Main characterization of canonical relationships; MS: Magnetic susceptibility.
106 Oliveira et al.
Acta Scientiarum. Agronomy Maringá, v. 39, n. 1, p. 99-108, Jan.-Mar., 2017
-15 -10 -5 0 5 10 15Discriminant variable 1 - 49.33%
-5
-4
-3
-2
-1
0
1
2
3
4
5
Dis
crim
inan
t var
iabl
e 2
- 2.
29%
ADE FOREST PASTURE
A
-15 -10 -5 0 5 10Discriminant variable 1 = 29.09%
-8
-6
-4
-2
0
2
4
6
8
Dis
crim
inan
t var
iabl
e 2
= 3
.65%
ADE FOREST PASTURE
B
Figure 5. Area clustering by Canonical Discriminant Analysis based on studied attributes in Southern Amazonas. A = 0.0–0.2 m depth; B = 0.4–0.6 m depth. ADE= archaeological dark earth.
In contrasting environments, Table 4 shows that the highest F values are found in ADE area compared to other areas, especially pasture, which demonstrates that ADE differs significantly from the other soils. In contrast, pasture areas and forest have similar characteristics, as observed by their smaller F values, which had no significant difference for both depths.
Table 4. Multivariate analysis contrasting the studied areas in Southern Amazonas.
Managements Depth of 0.0 – 0.2 m Depth 0.4 – 0.6 m
Value of F Value of F ADE x Pasture 687.8156*** 417.1080*** ADE x Forest 664.7170*** 401.0062*** Pasture x Forest 41.5622 65.8633 (***) All values are significant at p < 0.001.
This behaviour can be explained by the higher soil fertility and the anthropic horizon presence, as
shown by Campos et al. (2012a), who conducted a physical and chemical characterization of soils with anthropic and non-anthropogenic horizons. The authors found that soils with anthropic horizons have better physical and chemical qualities than do soils without the presence of an anthropic horizon, which is common in this region.
In this regard, while assessing Figures 3, 4 and 5 in terms of the main component, it can be seen that the ADE area lies in the third and fourth quadrants and has a greater distance from the forest and pasture areas. The forest is in the same quadrant as the pasture area, demonstrating that these environments have similar features. Within this context, evaluating these areas by discriminant analysis, a similar behaviour is noted; additionally, it shows which connections exist between the areas. Pasture overlaps the forest area, thus demonstrating a greater homogeneity between these environments.
Pedoenvironmental indicators of the Amazons soils 107
Acta Scientiarum. Agronomy Maringá, v. 39, n. 1, p. 99-108, Jan.-Mar., 2017
Therefore, in this sense, we can highlight that Ca2+, clay and H+Al are closely linked to ADE, pasture and forest areas, respectively. These attributes may undergo major alterations when the areas are subjected to human actions; thus, the attributes may be possible indicators of environmental changes. An attribute that has been related to a particular environment can provide a measure of environmental change or impact if the components or attributes in the soil are found to have been switched. The use of soil attribute identifiers from different environments is a key tool for driving the practices that reduce depletion to acceptable levels because the pH in H2O, H+Al, OM and Ca2+ contribute greatly to distinguishing the environments, which demonstrates the chemical attributes that are responsible for differentiation among the three environment.
Conclusion
Forest and pasture areas present similar behaviours and attributes, which differ from those of archaeological dark earth areas (ADE) that have greater fertility from anthropic horizons in Amazonian soils.
The soil attributes that are most suitable to use as pedoenvironmental indicators are calcium, potential acidity and clay for dark archaeological, forest and pasture soils, respectively.
Acknowledgements
We would like to thank the Foundation of Research Support of the Amazonas State – FAPEAM (Proc.1270/2012-FAPEAM) and Foundation of Research Support of the São Paulo State - FAPESP and the Amazonian State Registrar’s Office of Science, Technology and Innovation – SECT/AM by financial support to the research.
References
Barreto, A. C., Lima, F. H. S., Freire, M. B. G. S., Araújo, Q. R., & Freire, F. J. (2006). Características químicas e físicas de um solo sob floresta, sistema agroflorestal e pastagem no Sul da Bahia. Revista Caatinga, 19(4), 415-425.
Barros, K. R. M., Lima, H. V., Canellas, L. P., & Kern, D. C. (2012). Fracionamento químico da matéria orgânica e caracterização física de Terra Preta de Índio. Revista de Ciências Agrárias, 55(1), 44-51.
Barroso, L. P., & Artes, R. (2003). Análise multivariada. Lavras, MG: UFLA.
Bartington Instruments [Bartington]. (2013). Operation Manual for MS2 Magnetic Susceptibility System. Oxford, England: Bartington Instruments. Retrieved from www.bartington.com/Literaturepdf/Operation%20 Manuals/om0408%20MS2.pdf
Benites, V. M., Moutta, R. O., Coutinho, H. L. C., & Balieiro, F. C. (2010). Análise discriminante de solos sob diferentes usos em área de mata atlântica a partir de atributos da matéria orgânica. Revista Árvore, 34(4), 685-690.
Campos, M. C. C., Ribeiro, M. R., Souza Junior, V. S., Ribeiro Filho, M. R., & Almeida, M. C. (2012b). Topossequência de solos na transição Campos Naturais-Floresta na região de Humaitá, Amazonas. Acta Amazonica, 42(3), 387-397.
Campos, M. C. C., Ribeiro, M. R., Souza Júnior, V. S., Ribeiro Filho, M. R., & Oliveira, I. A. (2010). Interferências dos pedoambientes nos atributos do solo em uma topossequência de transição Campos/Floresta. Revista Ciência Agronômica, 41(4), 527-535.
Campos, M. C. C., Santos, L. A. C., Silva, D. M. P., Mantovanelli, B. C., & Soares, M. D. R. (2012a). Caracterização física e química de terras pretas arqueológicas e de solos não antropogênicos na região de Manicoré, Amazonas. Revista Agro@mbiente On-line, 6(2), 102-109.
Cunha, T. J. F., Madari, B. E., Canellas, L. P., Ribeiro, L. P., Benites, V. M., & Santos, G. A. (2009). Soil organic matter and fertility of anthropogenic dark earths (terra preta de índio) in the brazilian amazon basin. Revista Brasileira de Ciência do Solo, 33(1), 85-93.
Empresa Brasileira de Pesquisa Agropecuária [Embrapa]. (2011). Manual de métodos de análises de solo (2a. ed.). Rio de Janeiro, RJ: Embrapa Solos.
Empresa Brasileira de Pesquisa Agropecuária [Embrapa]. (2013). Sistema Brasileiro de Classificação de Solos (3a. ed., revisada e ampliada). Rio de Janeiro, RJ: Embrapa Solos.
Hair, J. R., Anderson, R. E., Tatham, R. L., & Black, W. C. (2005). Análise multivariada de dados. Porto Alegre, RS: Bookman.
Kaiser, H. F. (1958). The varimax criterion for analytic rotation in factor analysis. Psychometrika, 23(3), 187-200.
Kern, D. C., Kämpf, N., Woods, W. I., Denevan, W. M., Costa, M. L., Frazão, F. J. L., & Sombroek, W. (2009). As Terras Pretas de Índio na Amazônia: Evolução do Conhecimento em Terra Preta de Índio. In W. G., Teixeira, D. C., Kern, B. E., Madari, & H. N. Lima, (Eds.). As Terras Pretas de Índio da Amazônia: sua caracterização e uso deste conhecimento na criação de novas áreas (p. 72-81), Manaus, AM: Embrapa Amazônica Ocidental.
Kume, H. (1993). Métodos estatísticos para melhoria da qualidade (4a. ed.). São Paulo, SP: Gente.
Lima, H. N., Schaefer, C. E. R., Mello, J. W. V., Gilkes, R. J., & Ker, J. C. (2002). Pedogenesis and pre-Columbian land use of “Terra Preta Anthrosols” (Indian black earth”) of Western Amazonia. Geoderma, 110(1-2), 1-17.
Oliveira, I. A., Campos, M. C. C., Freitas, L., & Soares, M. D. R. (2015). Caracterização de solos sob diferentes usos na região sul do Amazonas. Acta Amazonica, 45(1), 1-12.
108 Oliveira et al.
Acta Scientiarum. Agronomy Maringá, v. 39, n. 1, p. 99-108, Jan.-Mar., 2017
Raij, B. V., Andrade, J. C, Cantarella, H., & Quaggio, J. A. (2001). Análise química para avaliação da fertilidade do solo. Campinas, SP: Instituto Agronômico.
Rockström, J., Steffen, W., Noone, K., Persson, A., Chapin, F. S., Lambin, E. F., … Foley, J. A. (2009). A safe operating space for humanity. Nature, 461(7263), 472-475.
Silva, M. O., Freire, M. B. G. S., Mendes, M. A. S., Freire, F. J., Campos, M. C. C., & Amorim, L. B. (2010b). Discriminação de diferentes classes de solos irrigados com águas salinas, na região de Mossoró, RN, com o uso de análise multivariada. Ambiência, 6(2), 261-270.
Silva, A. S., Lima, J. S. S., Xavier, A. C., & Teixeira, M. M. (2010a). Variabilidade espacial de atributos químicos de um Latossolo Vermelho-Amarelo húmico cultivado com café. Revista Brasileira de Ciência do Solo, 34(1), 15-22.
Received on January 27, 2016. Accepted on June 28, 2016
License information: This is an open-access article distributed under the terms of the Creative Commons Attribution License, which permits unrestricted use, distribution, and reproduction in any medium, provided the original work is properly cited.