Embed Size (px)
Citation preview

Metrics for Monitoring Climate-Smart Agriculture
23 June 2016, Montpellier
Lini Wollenberg, CCAFS, Low Emissions Development Flagship
ccafs.cgiar.org
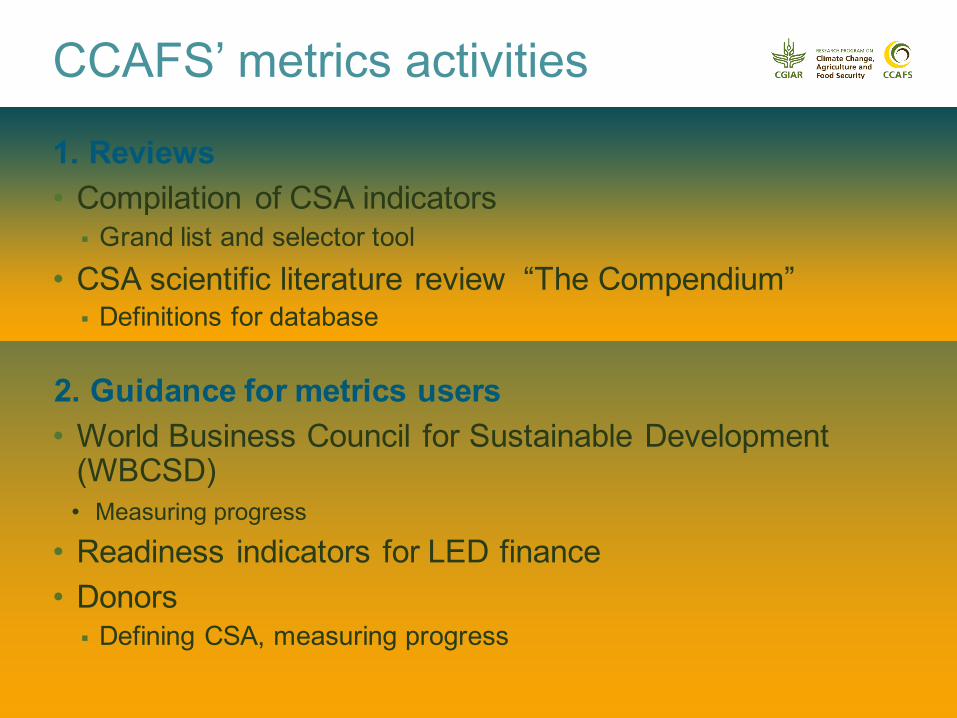
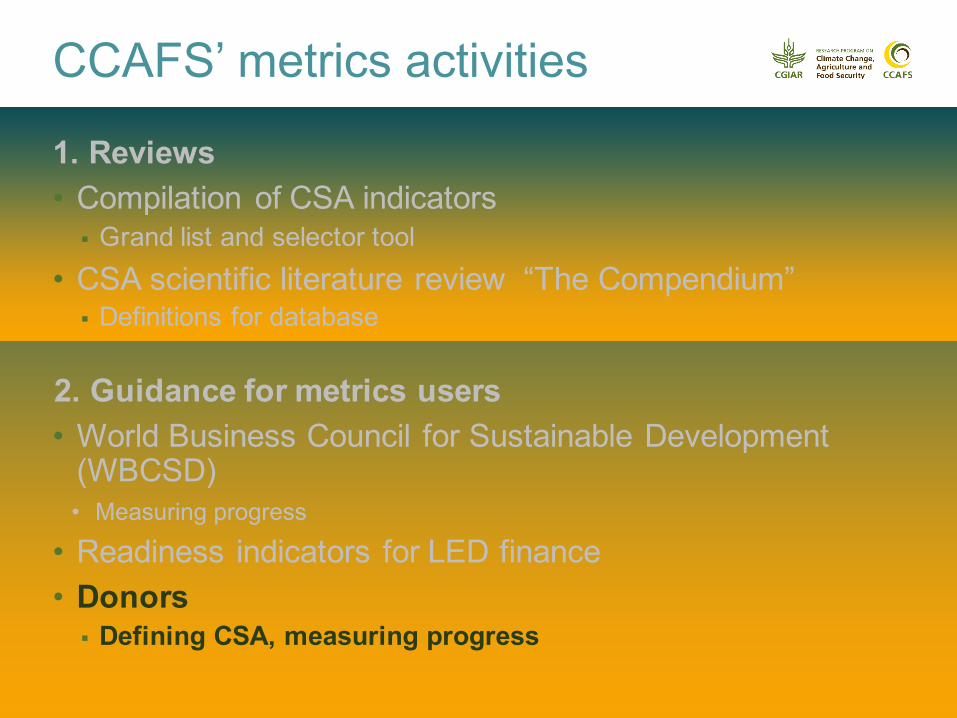
CCAFS’ metrics activities
1. Reviews• Compilation of CSA indicators
§ Grand list and selector tool• CSA scientific literature review “The Compendium”
§ Definitions for database
2. Guidance for metrics users• World Business Council for Sustainable Development
(WBCSD) • Measuring progress
• Readiness indicators for LED finance• Donors
§ Defining CSA, measuring progress
CCAFS’ metrics activities
3. Measurement issues• Proxies for GHG measurement• MRV• Network modeling to reduce indicators

Food security/ productivity
Reduced emissionsAdaptation/
resilience
CSA specifies multiple goals (not practices)
Balance among goals is stakeholder-specific
Interactions among pillars: synergies, co-benefits, trade-offs
Goals can be absolute (e.g. % SOM) v. relative (e.g. % change) improvement; or minimum thresholds
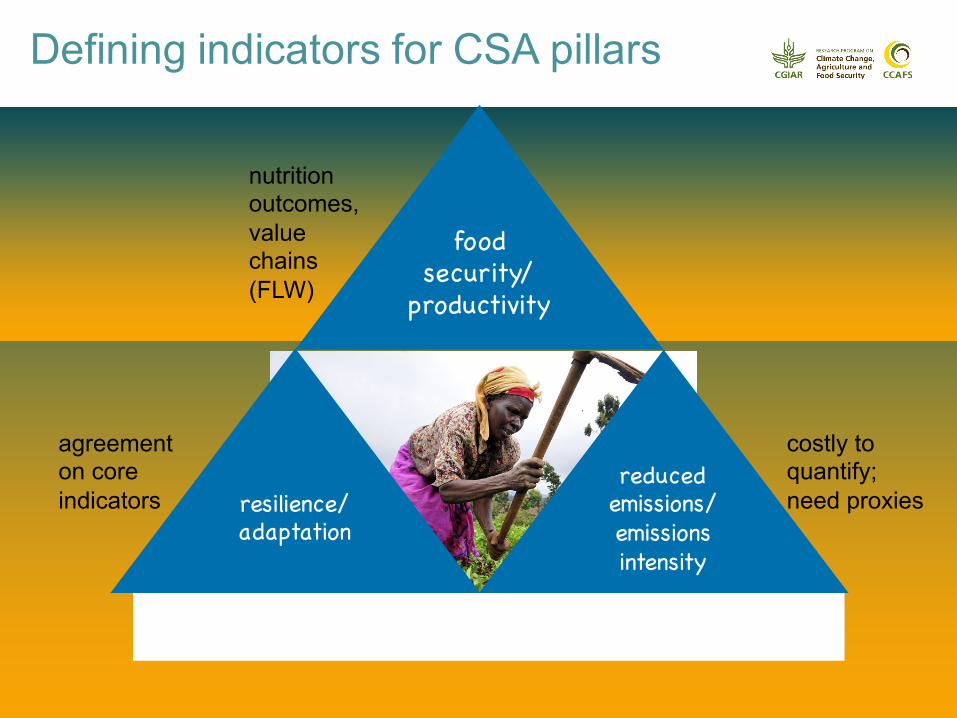
Defining indicators for CSA pillars
reduced emissions/emissions intensity
resilience/adaptation
food security/
productivity
nutrition outcomes,value chains (FLW)
costly to quantify; need proxies
agreement on core indicators
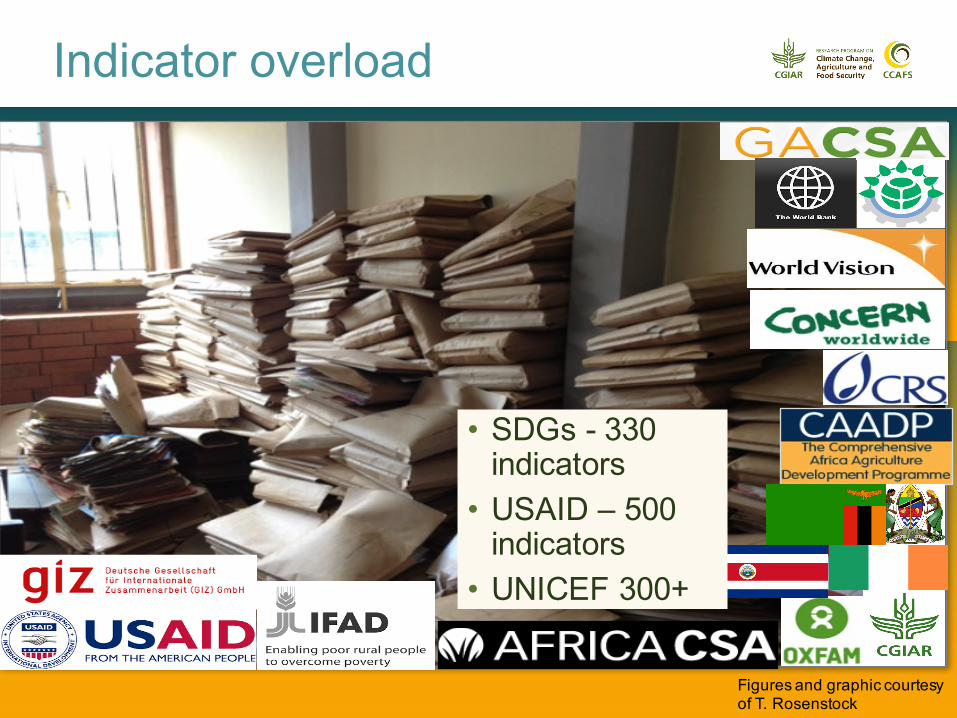
Indicator overload
• SDGs - 330 indicators
• USAID – 500 indicators
• UNICEF 300+
Figures and graphic courtesy of T. Rosenstock
CCAFS’ metrics activities
1. Reviews• Compilation of CSA indicators
§ Grand list and selector tool• CSA scientific literature review “The Compendium”
§ Definitions for database
2. Supporting metrics users• World Business Council for Sustainable Development
(WBCSD) • Measuring progress
• Readiness indicators for LED finance• Donors
§ Defining CSA, measuring progress
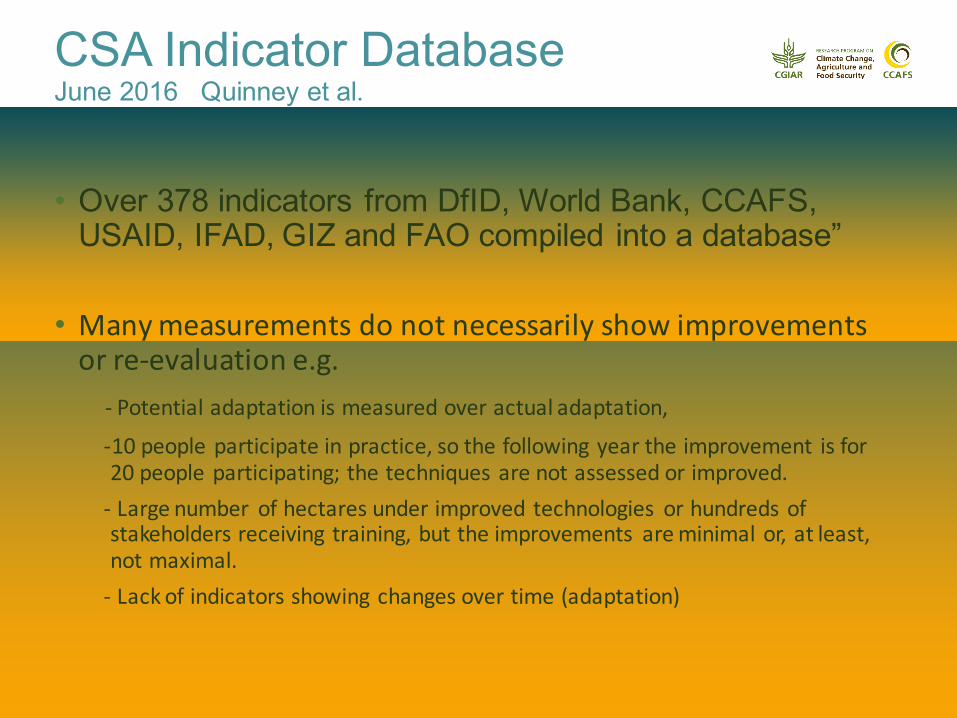
CSA Indicator Database June 2016 Quinney et al.
• Over 378 indicators from DfID, World Bank, CCAFS, USAID, IFAD, GIZ and FAO compiled into a database”
• Manymeasurementsdonotnecessarilyshowimprovementsorre-evaluatione.g.
- Potentialadaptationismeasuredoveractualadaptation,
-10peopleparticipateinpractice,sothefollowingyeartheimprovement isfor20peopleparticipating;thetechniquesarenotassessedorimproved.- Largenumber ofhectaresunderimproved technologies orhundredsofstakeholdersreceiving training,buttheimprovements areminimalor,atleast,notmaximal.- Lackofindicatorsshowingchangesovertime(adaptation)
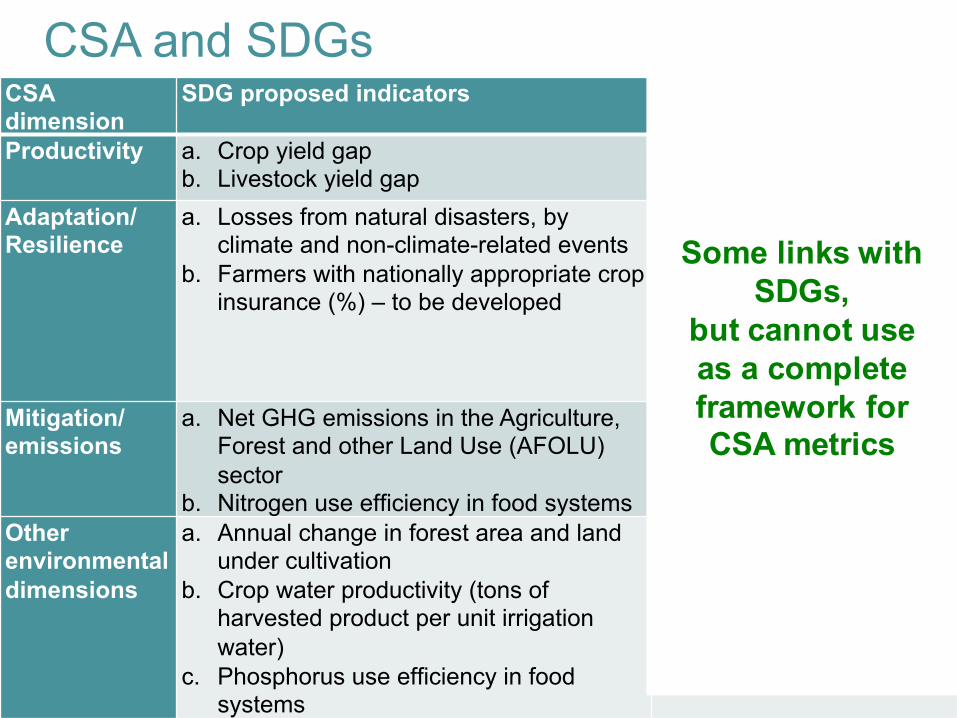
CSA dimension
SDG proposed indicators Comments
Productivity a. Crop yield gapb. Livestock yield gap
Adaptation/ Resilience
a. Losses from natural disasters, by climate and non-climate-related events
b. Farmers with nationally appropriate crop insurance (%) – to be developed
• (a) could be applied to losses in agriculture
• “Resilience” in SDGs applies to extreme events
• CSA resilience pillar not well covered
Mitigation/ emissions
a. Net GHG emissions in the Agriculture, Forest and other Land Use (AFOLU) sector
b. Nitrogen use efficiency in food systems
• (a) is the definitive indicator;
• (b) would relate to focusing on N2O
Other environmental dimensions
a. Annual change in forest area and land under cultivation
b. Crop water productivity (tons of harvested product per unit irrigation water)
c. Phosphorus use efficiency in food systems
• (a) important for role of agric. in driving deforestation
• Other CSA environ.
Some links with SDGs,
but cannot useas a complete framework for CSA metrics
CSA and SDGs

CCAFS Indicator Selection Tool
A. Jarvis and O. Bonilla, CIAT

Resulting pool of indicators

CCAFS’ metrics activities
1. Reviews• Compilation of CSA indicators
§ Grand list and selector tool• CSA scientific literature review “The Compendium”
§ Definitions for database
2. Guidance for metrics users• Donors
§ Defining CSA, measuring progress• World Business Council for Sustainable Development
(WBCSD)• Readiness indicators for LED finance

The Compendium
Rosenstock et al. 2016
Contact: Todd Rosenstock, Meryl Richards
Systematic review• 100,000+ comparisons, • 1,200 peer reviewed
studies• 70 practices• 55 outcome indicators
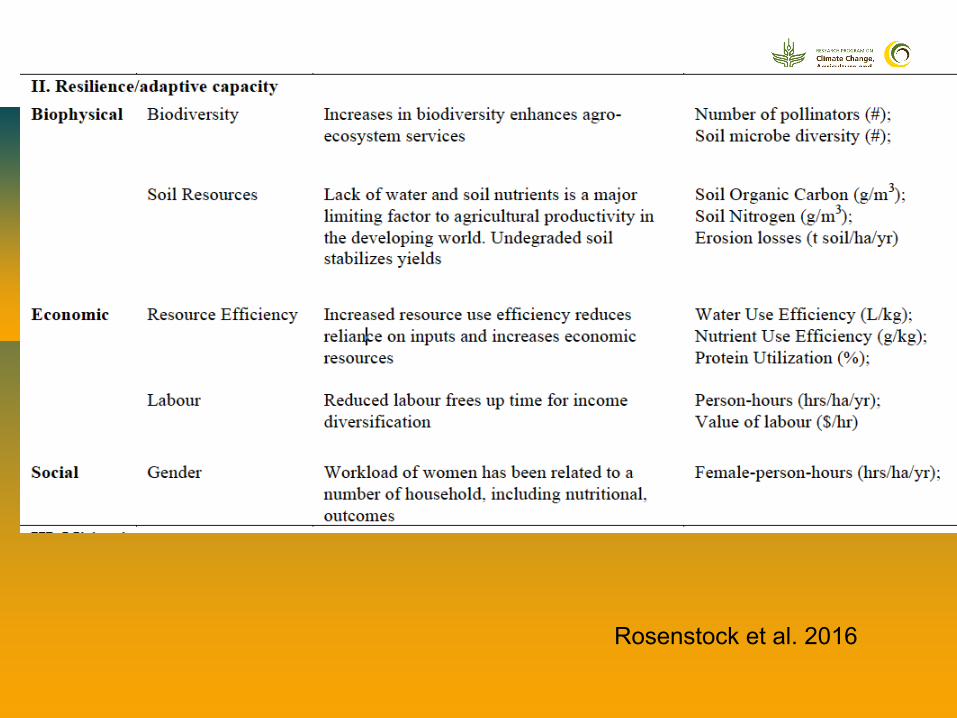
Rosenstock et al. 2016
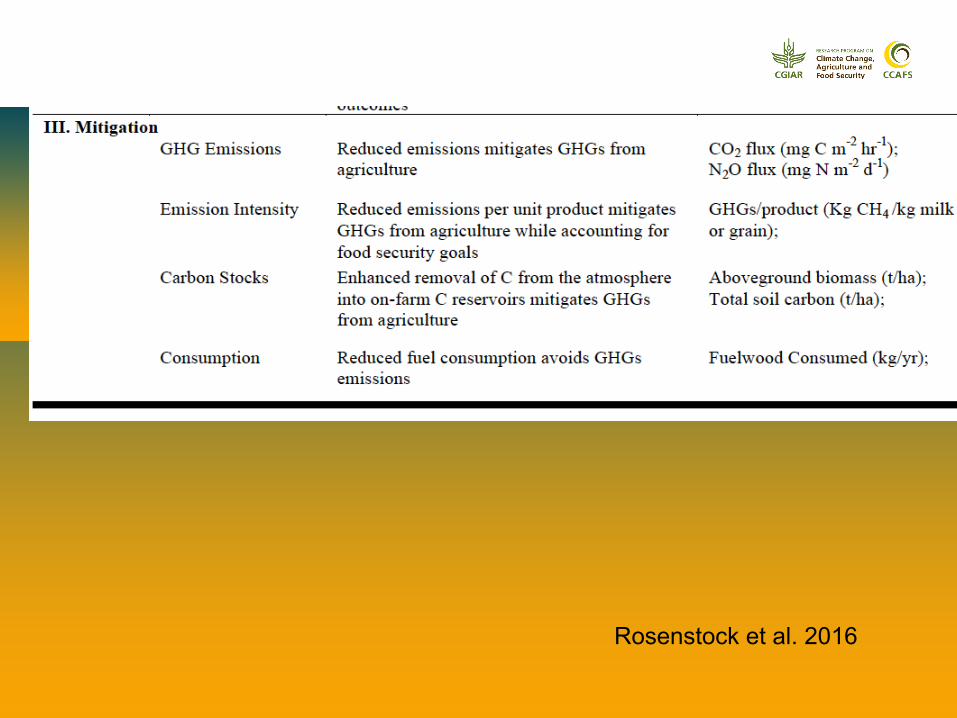
Rosenstock et al. 2016
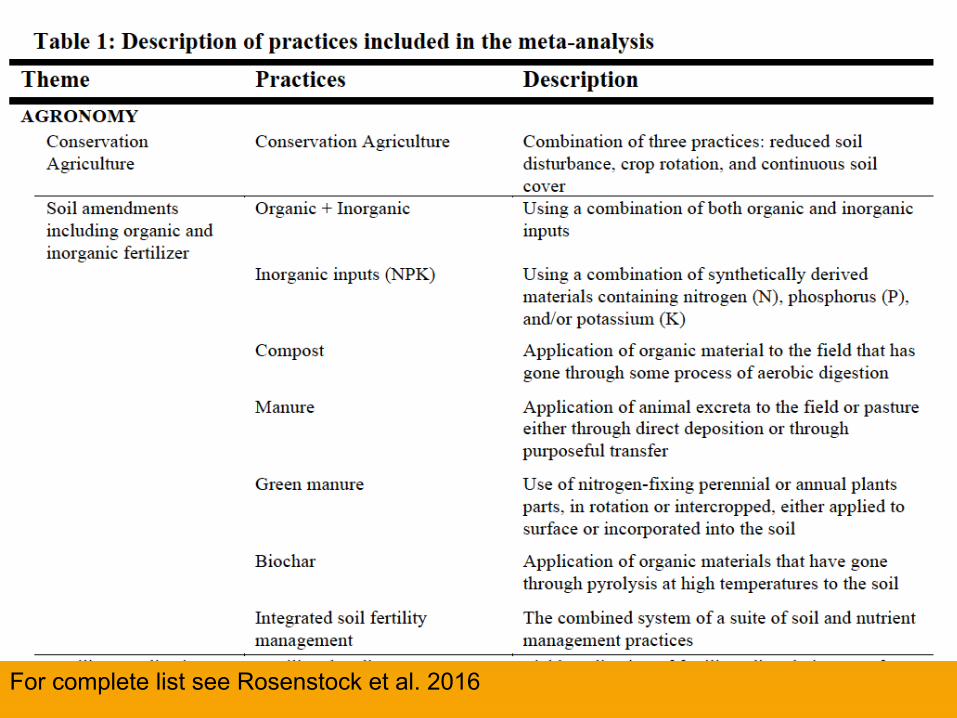
For complete list see Rosenstock et al. 2016

CCAFS’ metrics activities
1. Reviews• Compilation of CSA indicators
§ Grand list and selector tool• CSA scientific literature review “The Compendium”
§ Definitions for database
2. Guidance for metrics users• Donors
§ Defining CSA, measuring progress• World Business Council for Sustainable
Development (WBCSD)§ Measuring progress
• Readiness indicators for LED finance
World Business Council for Sustainable Development (WBCSD) metrics
• Estimate progress towards stated goals of WBCSD
• Based on what member companies are already measuring.
Contact: Danush Dhinesh and Sonja Vermeulen

Readiness Indicators for NAMAsZurek et al. 2014 and Wollenberg et al. 2015
Readiness is the capacity to manage plan, implement and monitor climate finance and activities related to climate change.5 work areas1. Governance and stakeholder engagement, 2. Knowledge and information services, 3. CSA strategy and implementation frameworks, 4. National and subnational capabilities, and 5. National information and accounting systems.
Contact: Monika Zurek, Oxford U
CCAFS’ metrics activities
1. Reviews• Compilation of CSA indicators
§ Grand list and selector tool• CSA scientific literature review “The Compendium”
§ Definitions for database
2. Guidance for metrics users• World Business Council for Sustainable Development
(WBCSD) • Measuring progress
• Readiness indicators for LED finance• Donors
§ Defining CSA, measuring progress

Outcome, activity and program indicators
Outcomes: % SOC $$$
Activity-based: use of cover crops $$
Program-based: access to locally relevant options $
ExampleRelevance
Ease
• Program indicators also help to measure implementation processes.
• Can test outcomes against program indicators

Visualization of results
http://dapa.ciat.cgiar.org/csa-profiles/
Example: CCAFS Climate Smart Country Profile for Mexico (and other Latin American countries)
CO2e
Accounting for mitigation: global
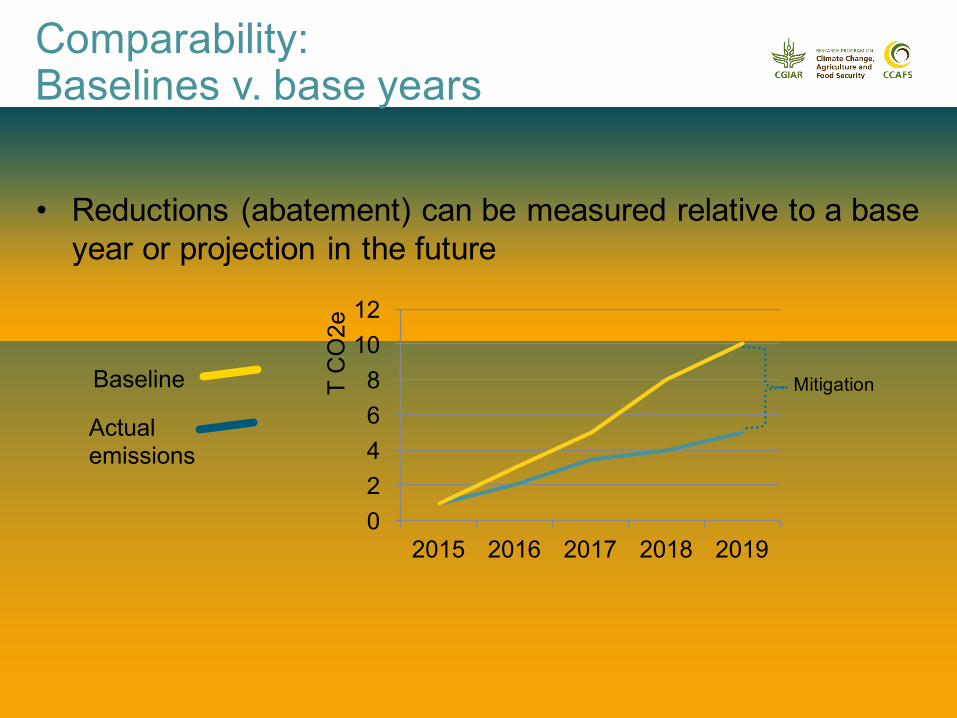
Comparability: Baselines v. base years
• Reductions (abatement) can be measured relative to a base year or projection in the future
02468
1012
2015 2016 2017 2018 2019
Baseline
Actual emissions
T C
O2e
Mitigation

CSA is linked to larger landscapes, supply chains and time horizons that influence CSA outcomes
• farm
• territory
• landscape
supply chain
Thank youccafs.cgiar.org
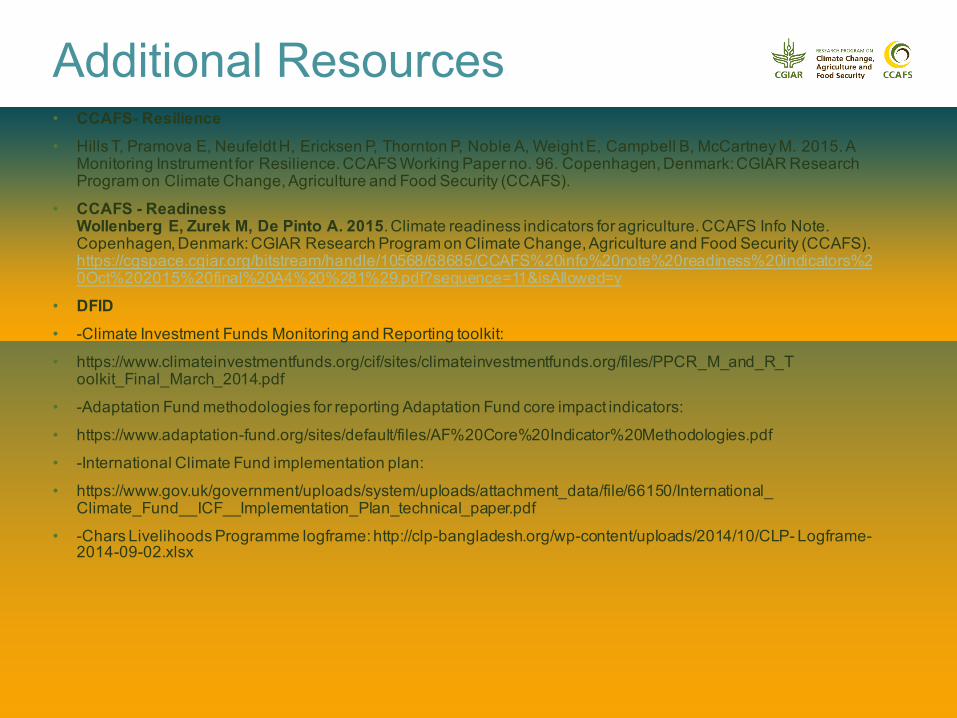
Additional Resources• CCAFS- Resilience • Hills T, Pramova E, Neufeldt H, Ericksen P, Thornton P, Noble A, Weight E, Campbell B, McCartney M. 2015. A
Monitoring Instrument for Resilience. CCAFS Working Paper no. 96. Copenhagen, Denmark: CGIAR Research Program on Climate Change, Agriculture and Food Security (CCAFS).
• CCAFS - ReadinessWollenberg E, Zurek M, De Pinto A. 2015. Climate readiness indicators for agriculture. CCAFS Info Note. Copenhagen, Denmark: CGIAR Research Program on Climate Change, Agriculture and Food Security (CCAFS). https://cgspace.cgiar.org/bitstream/handle/10568/68685/CCAFS%20info%20note%20readiness%20indicators%20Oct%202015%20final%20A4%20%281%29.pdf?sequence=11&isAllowed=y
• DFID • -Climate Investment Funds Monitoring and Reporting toolkit:
• https://www.climateinvestmentfunds.org/cif/sites/climateinvestmentfunds.org/files/PPCR_M_and_R_Toolkit_Final_March_2014.pdf
• -Adaptation Fund methodologies for reporting Adaptation Fund core impact indicators:
• https://www.adaptation-fund.org/sites/default/files/AF%20Core%20Indicator%20Methodologies.pdf
• -International Climate Fund implementation plan:
• https://www.gov.uk/government/uploads/system/uploads/attachment_data/file/66150/International_ Climate_Fund__ICF__Implementation_Plan_technical_paper.pdf
• -Chars Livelihoods Programme logframe: http://clp-bangladesh.org/wp-content/uploads/2014/10/CLP- Logframe-2014-09-02.xlsx
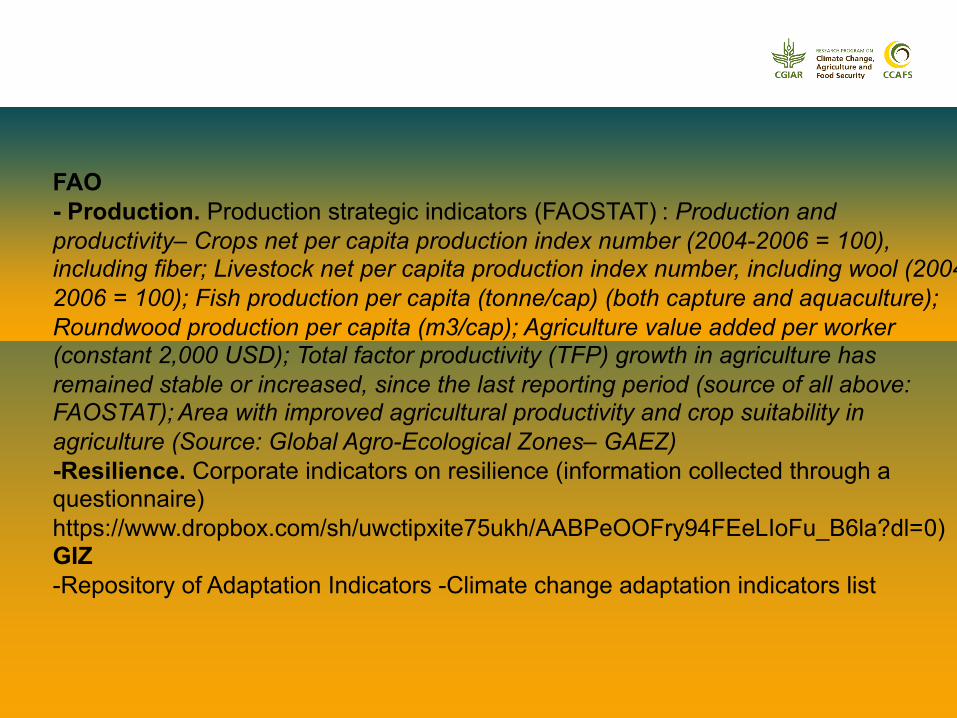
FAO- Production. Production strategic indicators (FAOSTAT) : Production and productivity– Crops net per capita production index number (2004-2006 = 100), including fiber; Livestock net per capita production index number, including wool (2004-2006 = 100); Fish production per capita (tonne/cap) (both capture and aquaculture); Roundwood production per capita (m3/cap); Agriculture value added per worker (constant 2,000 USD); Total factor productivity (TFP) growth in agriculture has remained stable or increased, since the last reporting period (source of all above: FAOSTAT); Area with improved agricultural productivity and crop suitability in agriculture (Source: Global Agro-Ecological Zones– GAEZ) -Resilience. Corporate indicators on resilience (information collected through a questionnaire) https://www.dropbox.com/sh/uwctipxite75ukh/AABPeOOFry94FEeLIoFu_B6la?dl=0) GIZ -Repository of Adaptation Indicators -Climate change adaptation indicators list
IFAD-ASAP Adaptation for Smallholder Agriculture Programme (ASAP) results and indicator framework: 9|Page USAID -FTF. Summary of indicators chart-Indicator handbook and definitions-USAID Standard Foreign Assistance Indicators (under 4.8: Environment; Capacity Building, Gender, and Science (STIR) indicators) World Bank -CSA-Result Indicators
Definitions
• Adaptation:§ “adjustment in natural or human systems in response to actual or expected
climatic stimuli or their effects, which moderates harm or exploits beneficial opportunities” IPCC
• Adaptive capacity:§ “ability of a system to adjust to climate change (including climate variability
and extremes) to moderate potential damages, to take advantage of opportunities, or to cope with the consequences” IPCC
• Resilience:§ “the capacity that ensures adverse stressors and shocks do not have long-
lasting adverse development consequences” FSIN§ “the ability of people, households, communities, countries and systems to
mitigate, adapt to and recover from shocks and stresses in a manner that reduces chronic vulnerability and facilitates inclusive growth” USAID