Embed Size (px)
Citation preview

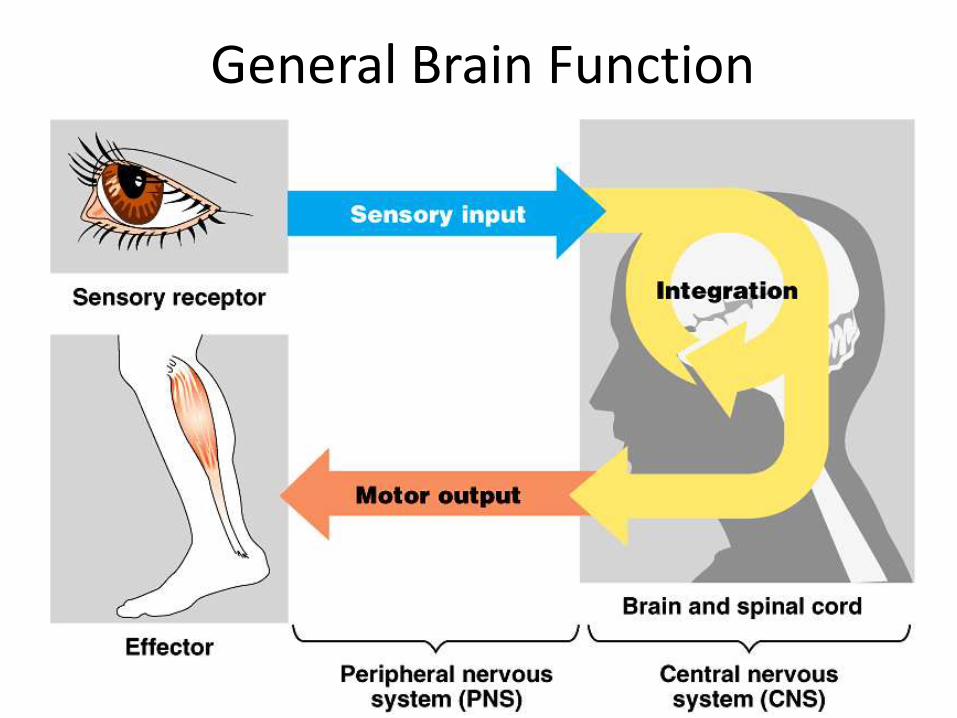
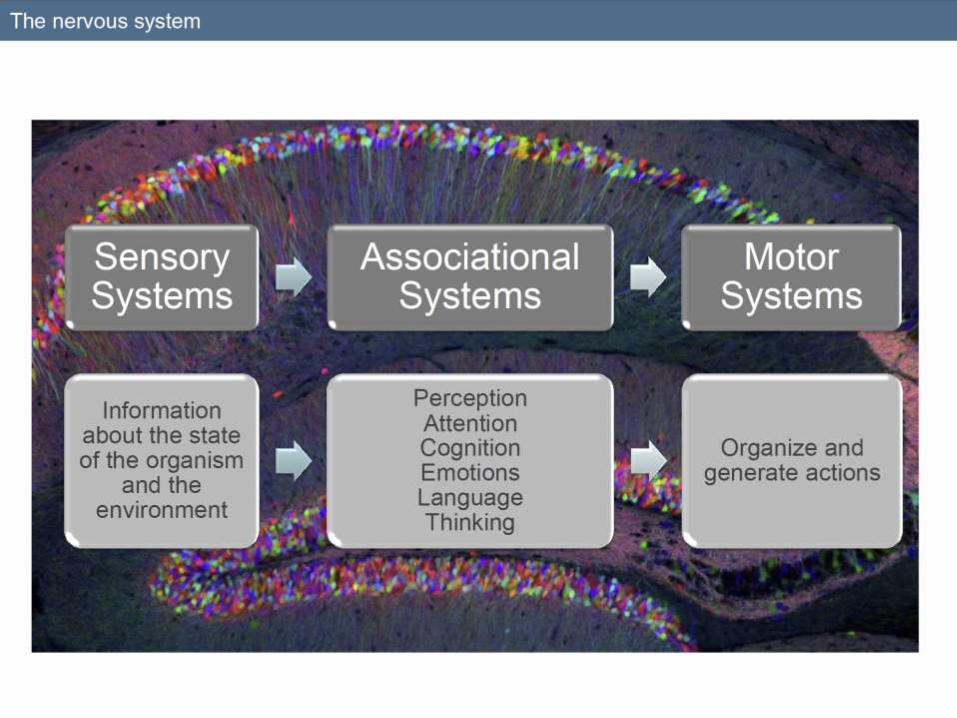
General Brain Function
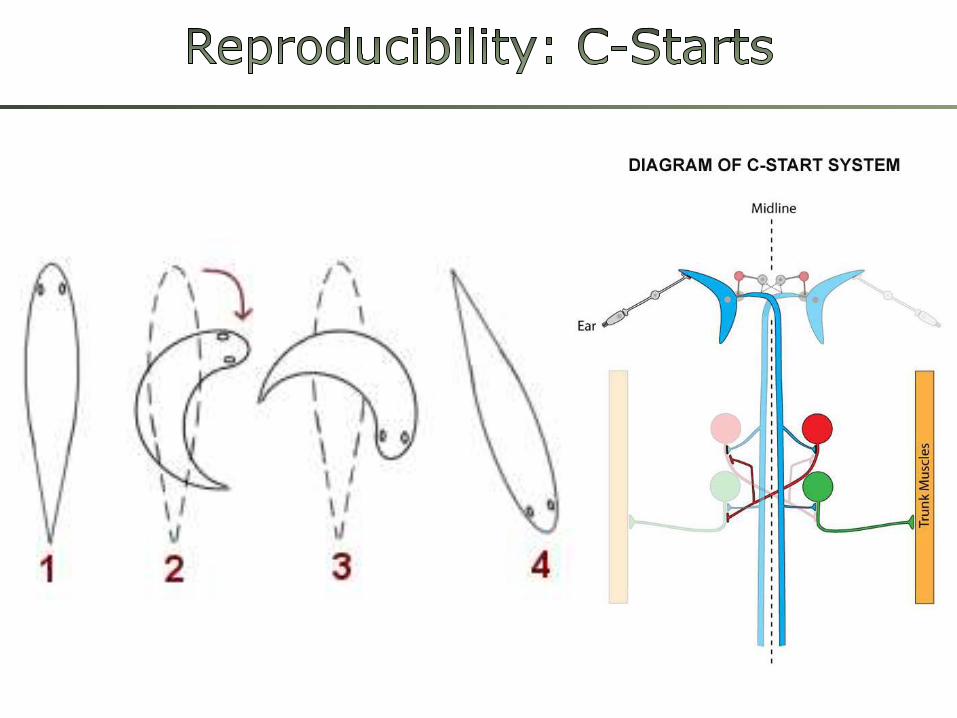

Being predictable is not evolutionary stable
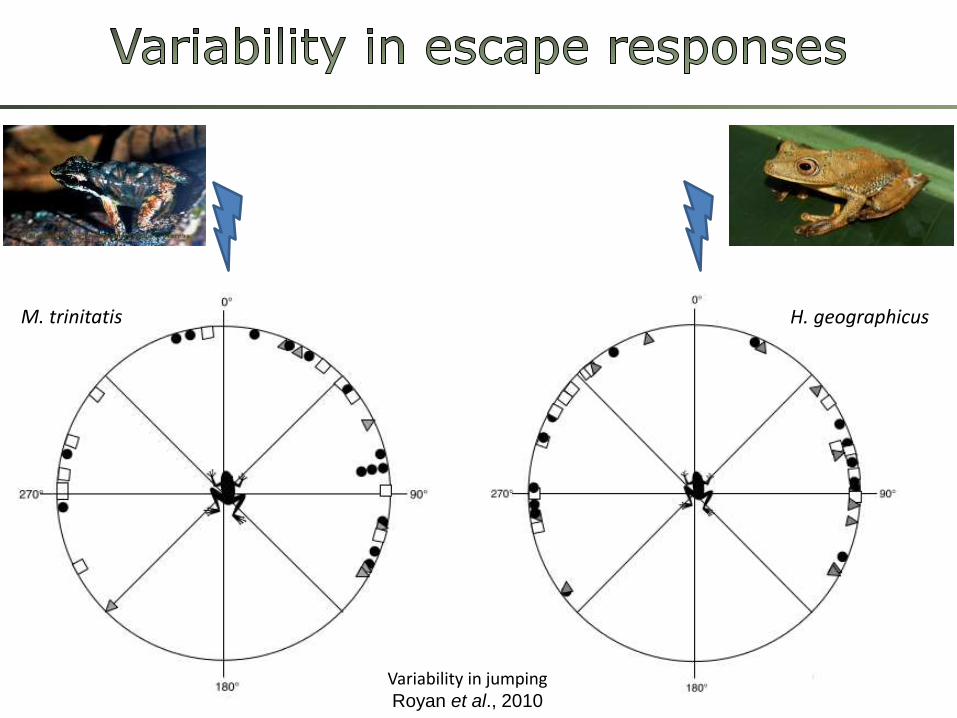
H. geographicus
Variability in jumpingRoyan et al., 2010
M. trinitatis
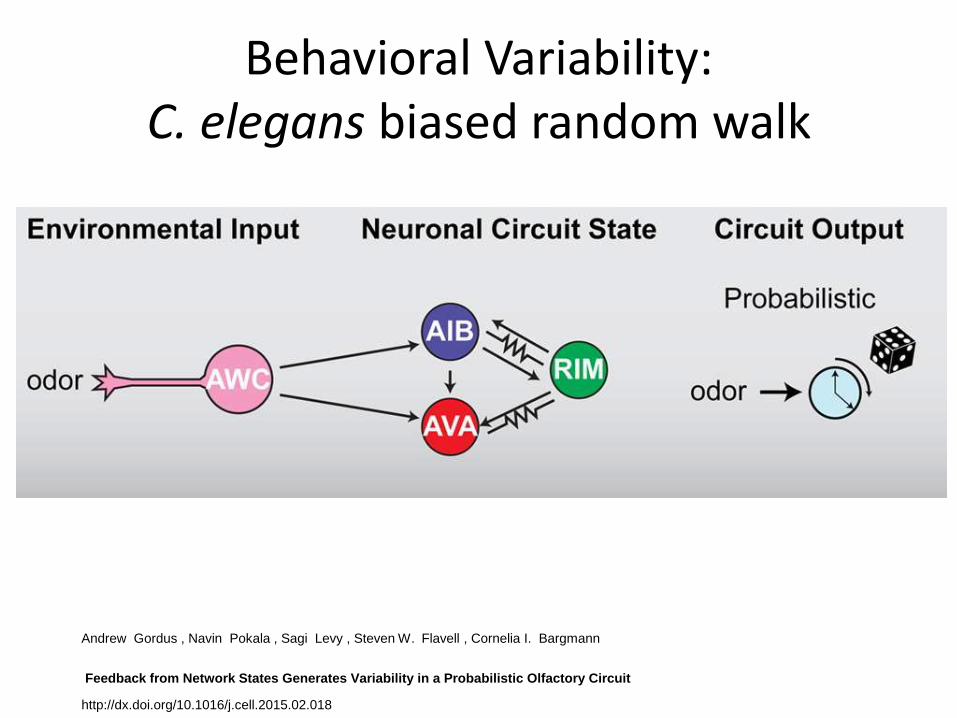
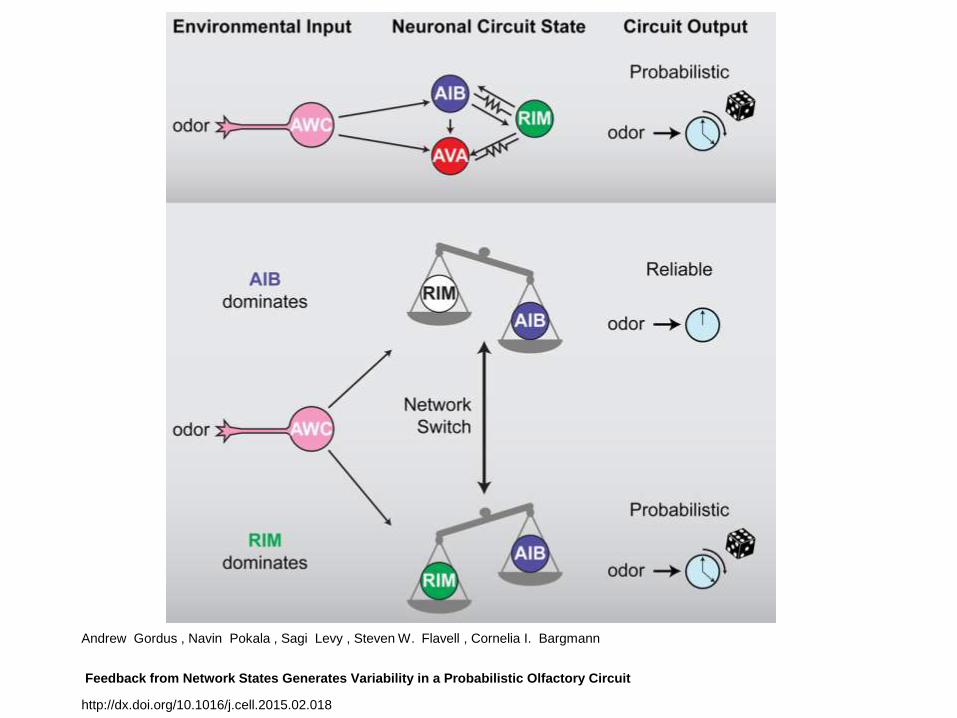
Andrew Gordus , Navin Pokala , Sagi Levy , Steven W. Flavell , Cornelia I. Bargmann
Feedback from Network States Generates Variability in a Probabilistic Olfactory Circuit
http://dx.doi.org/10.1016/j.cell.2015.02.018
Behavioral Variability:C. elegans biased random walk
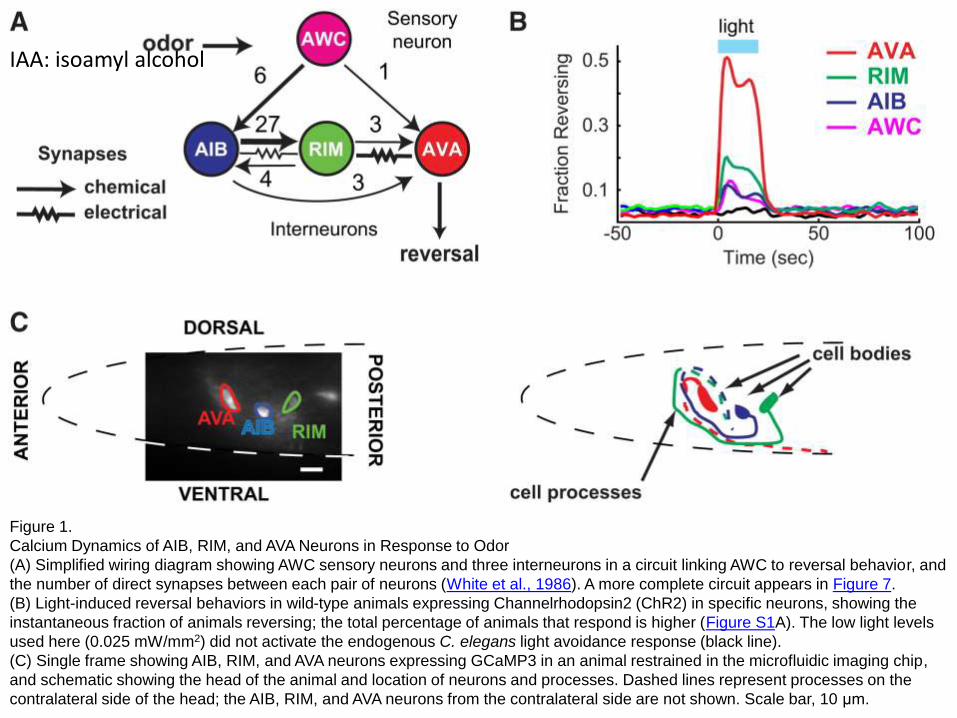
Figure 1.
Calcium Dynamics of AIB, RIM, and AVA Neurons in Response to Odor
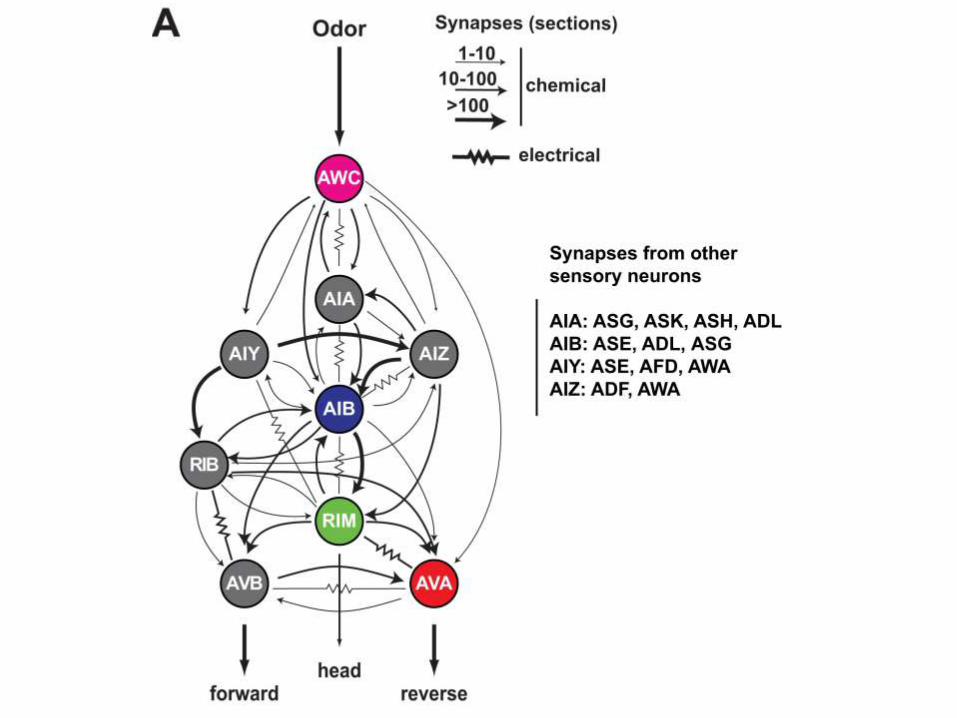
(A) Simplified wiring diagram showing AWC sensory neurons and three interneurons in a circuit linking AWC to reversal behavior, and
the number of direct synapses between each pair of neurons (White et al., 1986). A more complete circuit appears in Figure 7.
(B) Light-induced reversal behaviors in wild-type animals expressing Channelrhodopsin2 (ChR2) in specific neurons, showing the
instantaneous fraction of animals reversing; the total percentage of animals that respond is higher (Figure S1A). The low light levels
used here (0.025 mW/mm2) did not activate the endogenous C. elegans light avoidance response (black line).
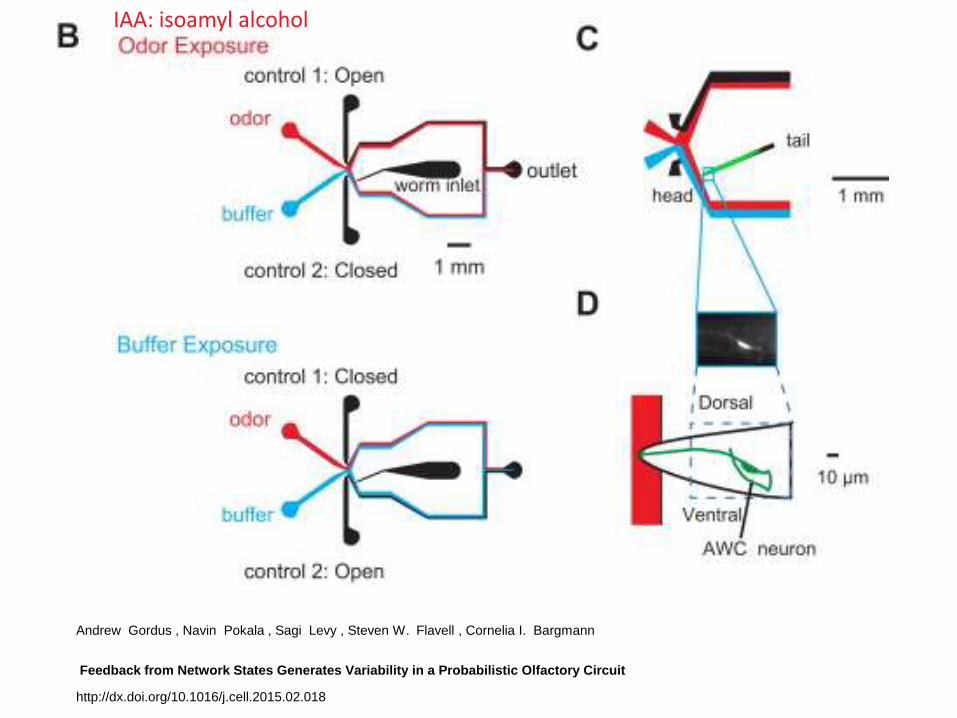
(C) Single frame showing AIB, RIM, and AVA neurons expressing GCaMP3 in an animal restrained in the microfluidic imaging chip,
and schematic showing the head of the animal and location of neurons and processes. Dashed lines represent processes on the
contralateral side of the head; the AIB, RIM, and AVA neurons from the contralateral side are not shown. Scale bar, 10 μm.
IAA: isoamyl alcohol
Andrew Gordus , Navin Pokala , Sagi Levy , Steven W. Flavell , Cornelia I. Bargmann
Feedback from Network States Generates Variability in a Probabilistic Olfactory Circuit
http://dx.doi.org/10.1016/j.cell.2015.02.018
IAA: isoamyl alcohol
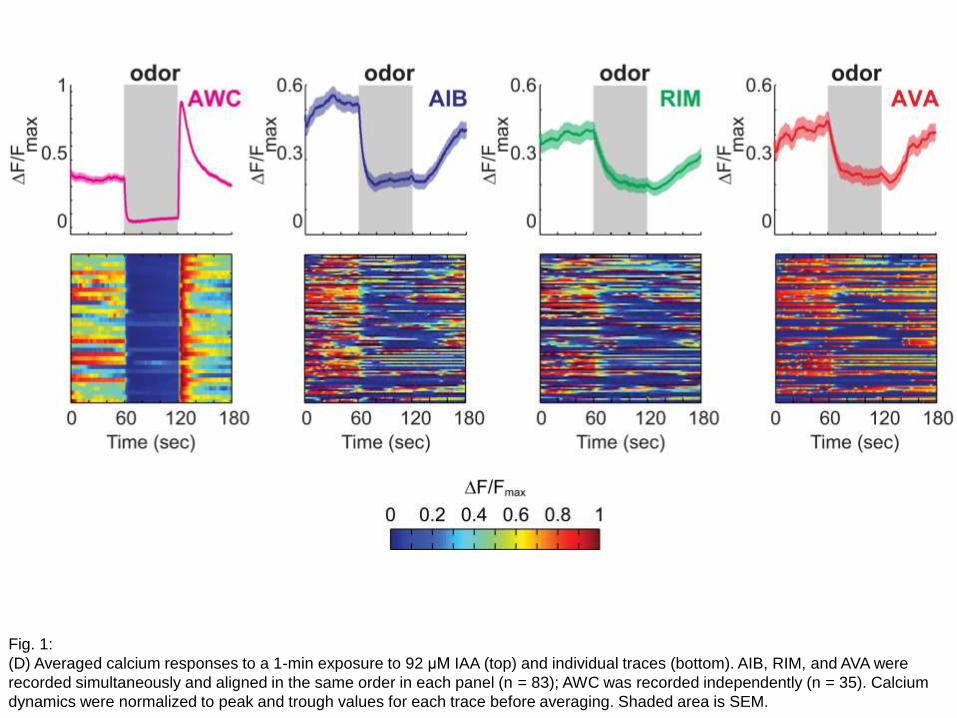
Fig. 1:
(D) Averaged calcium responses to a 1-min exposure to 92 μM IAA (top) and individual traces (bottom). AIB, RIM, and AVA were
recorded simultaneously and aligned in the same order in each panel (n = 83); AWC was recorded independently (n = 35). Calcium
dynamics were normalized to peak and trough values for each trace before averaging. Shaded area is SEM.
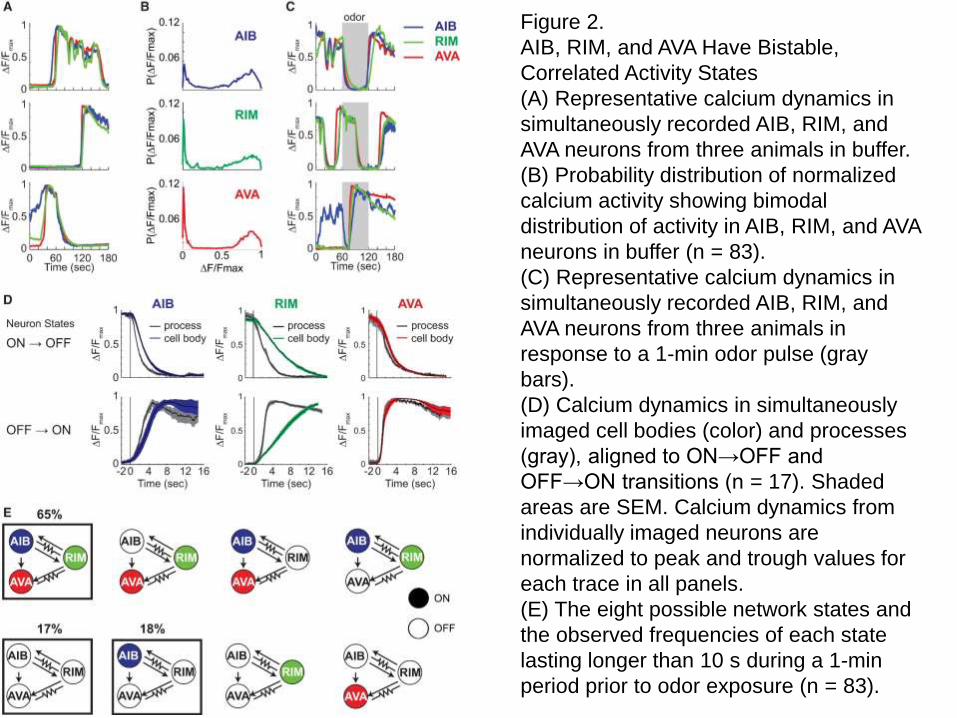
Figure 2.
AIB, RIM, and AVA Have Bistable,
Correlated Activity States
(A) Representative calcium dynamics in
simultaneously recorded AIB, RIM, and
AVA neurons from three animals in buffer.
(B) Probability distribution of normalized
calcium activity showing bimodal
distribution of activity in AIB, RIM, and AVA
neurons in buffer (n = 83).
(C) Representative calcium dynamics in
simultaneously recorded AIB, RIM, and
AVA neurons from three animals in
response to a 1-min odor pulse (gray
bars).
(D) Calcium dynamics in simultaneously
imaged cell bodies (color) and processes
(gray), aligned to ON→OFF and
OFF→ON transitions (n = 17). Shaded
areas are SEM. Calcium dynamics from
individually imaged neurons are
normalized to peak and trough values for
each trace in all panels.
(E) The eight possible network states and
the observed frequencies of each state
lasting longer than 10 s during a 1-min
period prior to odor exposure (n = 83).
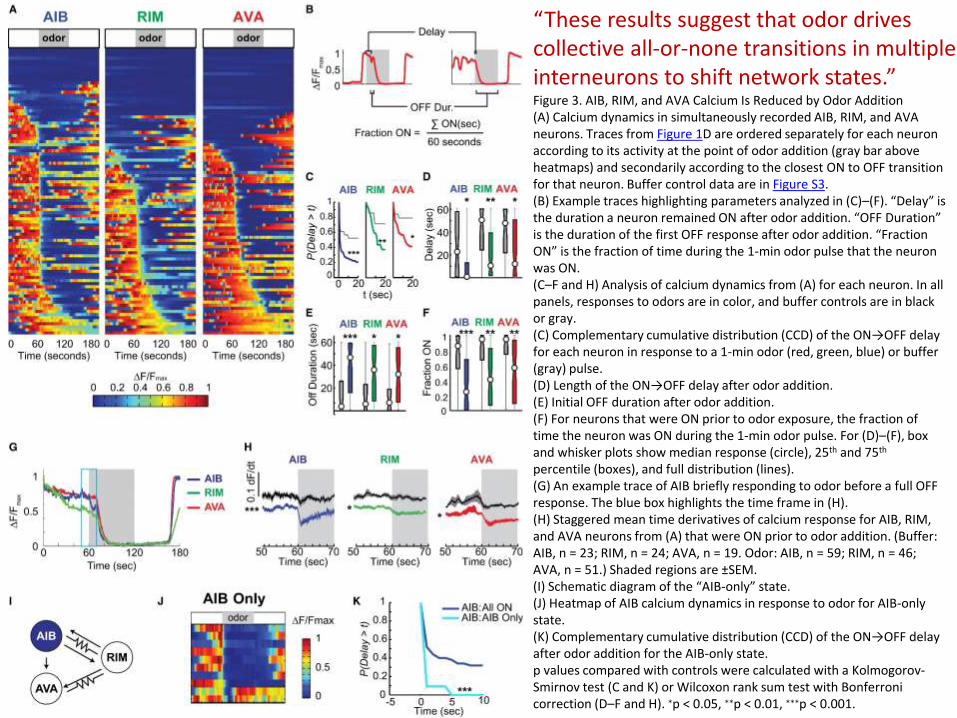
Figure 3. AIB, RIM, and AVA Calcium Is Reduced by Odor Addition(A) Calcium dynamics in simultaneously recorded AIB, RIM, and AVA neurons. Traces from Figure 1D are ordered separately for each neuron according to its activity at the point of odor addition (gray bar above heatmaps) and secondarily according to the closest ON to OFF transition for that neuron. Buffer control data are in Figure S3.(B) Example traces highlighting parameters analyzed in (C)–(F). “Delay” is the duration a neuron remained ON after odor addition. “OFF Duration” is the duration of the first OFF response after odor addition. “Fraction ON” is the fraction of time during the 1-min odor pulse that the neuron was ON.(C–F and H) Analysis of calcium dynamics from (A) for each neuron. In all panels, responses to odors are in color, and buffer controls are in black or gray.(C) Complementary cumulative distribution (CCD) of the ON→OFF delay for each neuron in response to a 1-min odor (red, green, blue) or buffer (gray) pulse.(D) Length of the ON→OFF delay after odor addition.(E) Initial OFF duration after odor addition.(F) For neurons that were ON prior to odor exposure, the fraction of time the neuron was ON during the 1-min odor pulse. For (D)–(F), box and whisker plots show median response (circle), 25th and 75th
percentile (boxes), and full distribution (lines).(G) An example trace of AIB briefly responding to odor before a full OFF response. The blue box highlights the time frame in (H).(H) Staggered mean time derivatives of calcium response for AIB, RIM, and AVA neurons from (A) that were ON prior to odor addition. (Buffer: AIB, n = 23; RIM, n = 24; AVA, n = 19. Odor: AIB, n = 59; RIM, n = 46; AVA, n = 51.) Shaded regions are ±SEM.(I) Schematic diagram of the “AIB-only” state.(J) Heatmap of AIB calcium dynamics in response to odor for AIB-only state.(K) Complementary cumulative distribution (CCD) of the ON→OFF delay after odor addition for the AIB-only state.p values compared with controls were calculated with a Kolmogorov-Smirnov test (C and K) or Wilcoxon rank sum test with Bonferronicorrection (D–F and H). ∗p < 0.05, ∗∗p < 0.01, ∗∗∗p < 0.001.
“These results suggest that odor drives collective all-or-none transitions in multiple interneurons to shift network states.”
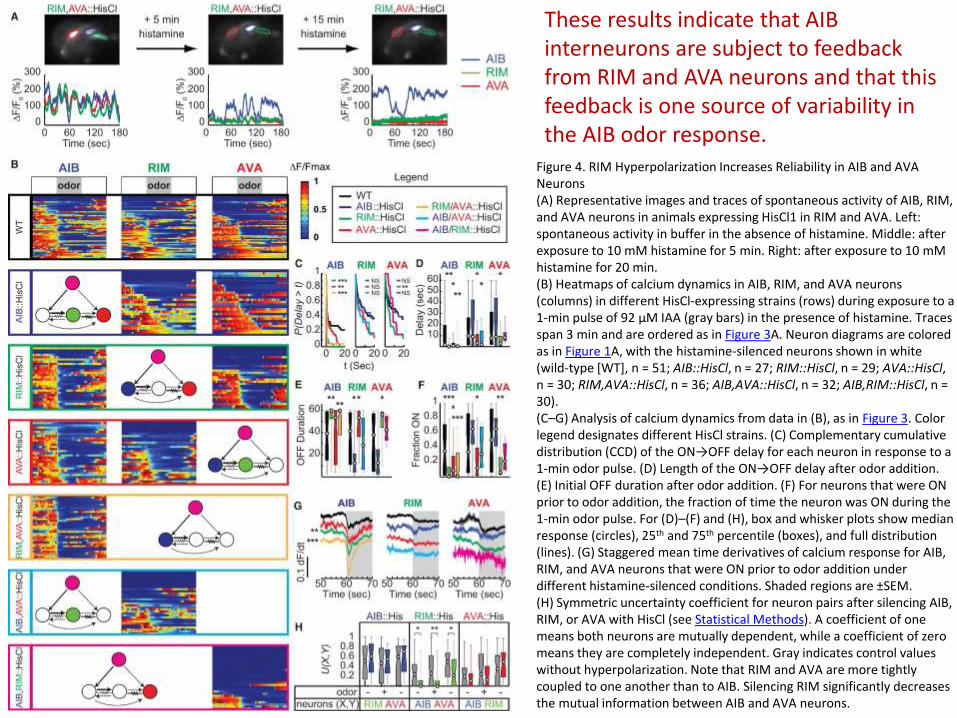
Figure 4. RIM Hyperpolarization Increases Reliability in AIB and AVA Neurons(A) Representative images and traces of spontaneous activity of AIB, RIM, and AVA neurons in animals expressing HisCl1 in RIM and AVA. Left: spontaneous activity in buffer in the absence of histamine. Middle: after exposure to 10 mM histamine for 5 min. Right: after exposure to 10 mMhistamine for 20 min.(B) Heatmaps of calcium dynamics in AIB, RIM, and AVA neurons (columns) in different HisCl-expressing strains (rows) during exposure to a 1-min pulse of 92 μM IAA (gray bars) in the presence of histamine. Traces span 3 min and are ordered as in Figure 3A. Neuron diagrams are colored as in Figure 1A, with the histamine-silenced neurons shown in white (wild-type [WT], n = 51; AIB::HisCl, n = 27; RIM::HisCl, n = 29; AVA::HisCl, n = 30; RIM,AVA::HisCl, n = 36; AIB,AVA::HisCl, n = 32; AIB,RIM::HisCl, n = 30).(C–G) Analysis of calcium dynamics from data in (B), as in Figure 3. Color legend designates different HisCl strains. (C) Complementary cumulative distribution (CCD) of the ON→OFF delay for each neuron in response to a 1-min odor pulse. (D) Length of the ON→OFF delay after odor addition. (E) Initial OFF duration after odor addition. (F) For neurons that were ON prior to odor addition, the fraction of time the neuron was ON during the 1-min odor pulse. For (D)–(F) and (H), box and whisker plots show median response (circles), 25th and 75th percentile (boxes), and full distribution (lines). (G) Staggered mean time derivatives of calcium response for AIB, RIM, and AVA neurons that were ON prior to odor addition under different histamine-silenced conditions. Shaded regions are ±SEM.(H) Symmetric uncertainty coefficient for neuron pairs after silencing AIB, RIM, or AVA with HisCl (see Statistical Methods). A coefficient of one means both neurons are mutually dependent, while a coefficient of zero means they are completely independent. Gray indicates control values without hyperpolarization. Note that RIM and AVA are more tightly coupled to one another than to AIB. Silencing RIM significantly decreases the mutual information between AIB and AVA neurons.
These results indicate that AIB interneurons are subject to feedback from RIM and AVA neurons and that this feedback is one source of variability in the AIB odor response.
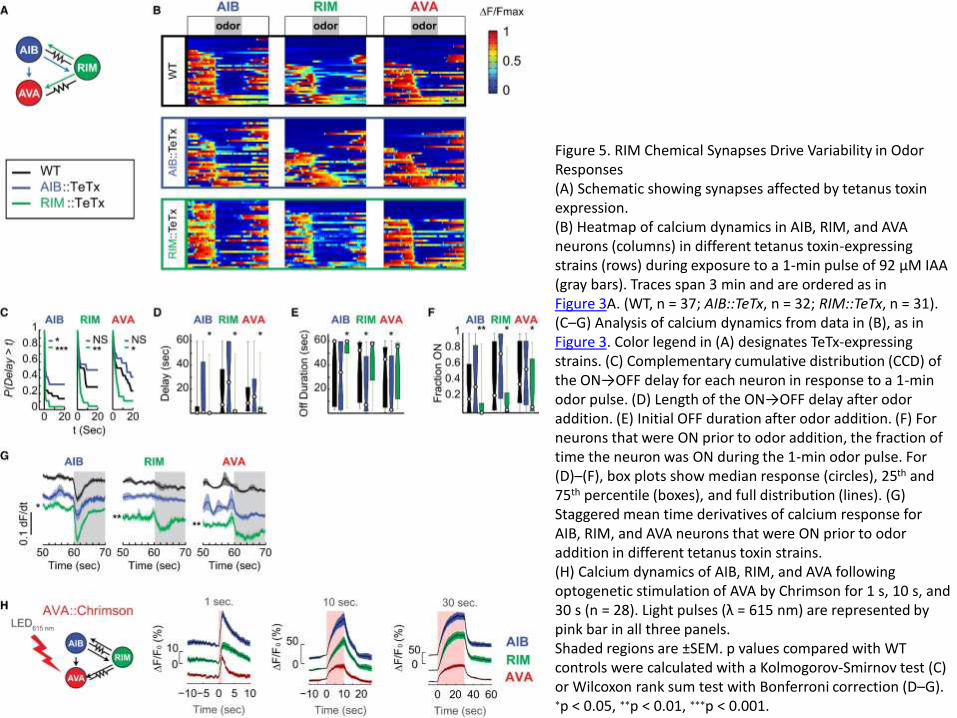
Figure 5. RIM Chemical Synapses Drive Variability in Odor Responses(A) Schematic showing synapses affected by tetanus toxin expression.(B) Heatmap of calcium dynamics in AIB, RIM, and AVA neurons (columns) in different tetanus toxin-expressing strains (rows) during exposure to a 1-min pulse of 92 μM IAA (gray bars). Traces span 3 min and are ordered as in Figure 3A. (WT, n = 37; AIB::TeTx, n = 32; RIM::TeTx, n = 31).(C–G) Analysis of calcium dynamics from data in (B), as in Figure 3. Color legend in (A) designates TeTx-expressing strains. (C) Complementary cumulative distribution (CCD) of the ON→OFF delay for each neuron in response to a 1-min odor pulse. (D) Length of the ON→OFF delay after odor addition. (E) Initial OFF duration after odor addition. (F) For neurons that were ON prior to odor addition, the fraction of time the neuron was ON during the 1-min odor pulse. For (D)–(F), box plots show median response (circles), 25th and 75th percentile (boxes), and full distribution (lines). (G) Staggered mean time derivatives of calcium response for AIB, RIM, and AVA neurons that were ON prior to odor addition in different tetanus toxin strains.(H) Calcium dynamics of AIB, RIM, and AVA following optogenetic stimulation of AVA by Chrimson for 1 s, 10 s, and 30 s (n = 28). Light pulses (λ = 615 nm) are represented by pink bar in all three panels.Shaded regions are ±SEM. p values compared with WT controls were calculated with a Kolmogorov-Smirnov test (C) or Wilcoxon rank sum test with Bonferroni correction (D–G). ∗p < 0.05, ∗∗p < 0.01, ∗∗∗p < 0.001.
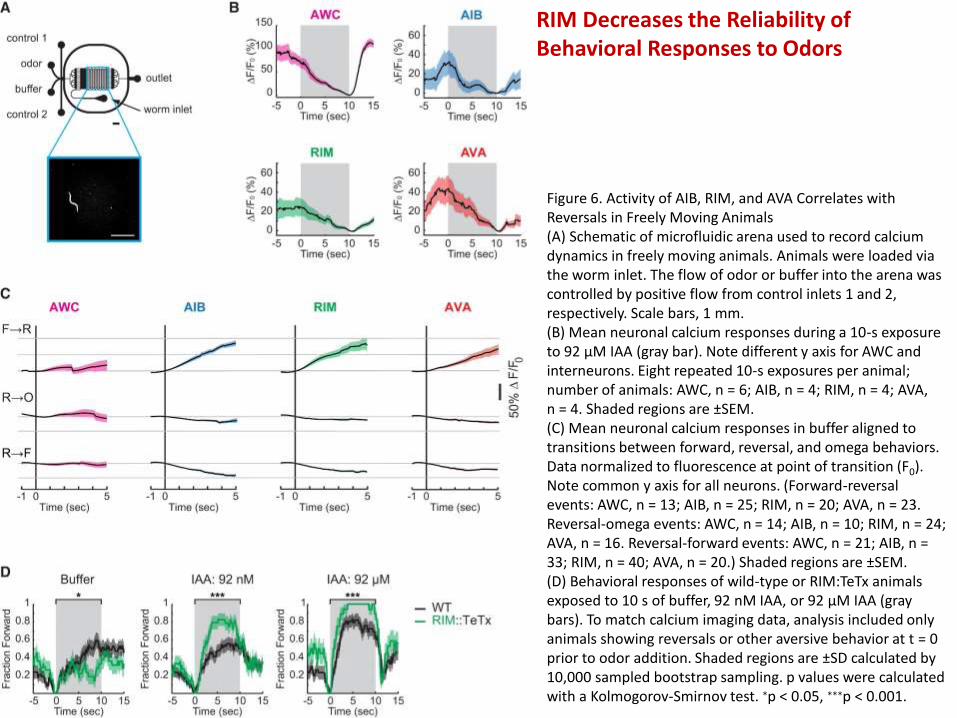
RIM Decreases the Reliability of Behavioral Responses to Odors
Figure 6. Activity of AIB, RIM, and AVA Correlates with Reversals in Freely Moving Animals(A) Schematic of microfluidic arena used to record calcium dynamics in freely moving animals. Animals were loaded via the worm inlet. The flow of odor or buffer into the arena was controlled by positive flow from control inlets 1 and 2, respectively. Scale bars, 1 mm.(B) Mean neuronal calcium responses during a 10-s exposure to 92 μM IAA (gray bar). Note different y axis for AWC and interneurons. Eight repeated 10-s exposures per animal; number of animals: AWC, n = 6; AIB, n = 4; RIM, n = 4; AVA, n = 4. Shaded regions are ±SEM.(C) Mean neuronal calcium responses in buffer aligned to transitions between forward, reversal, and omega behaviors. Data normalized to fluorescence at point of transition (F0). Note common y axis for all neurons. (Forward-reversal events: AWC, n = 13; AIB, n = 25; RIM, n = 20; AVA, n = 23. Reversal-omega events: AWC, n = 14; AIB, n = 10; RIM, n = 24; AVA, n = 16. Reversal-forward events: AWC, n = 21; AIB, n = 33; RIM, n = 40; AVA, n = 20.) Shaded regions are ±SEM.(D) Behavioral responses of wild-type or RIM:TeTx animals exposed to 10 s of buffer, 92 nM IAA, or 92 μM IAA (gray bars). To match calcium imaging data, analysis included only animals showing reversals or other aversive behavior at t = 0 prior to odor addition. Shaded regions are ±SD calculated by 10,000 sampled bootstrap sampling. p values were calculated with a Kolmogorov-Smirnov test. ∗p < 0.05, ∗∗∗p < 0.001.
Andrew Gordus , Navin Pokala , Sagi Levy , Steven W. Flavell , Cornelia I. Bargmann
Feedback from Network States Generates Variability in a Probabilistic Olfactory Circuit
http://dx.doi.org/10.1016/j.cell.2015.02.018