Embed Size (px)
Citation preview
Insights into the world of GPCRs (Adrenergic Receptors)Speaker: Bundit Boonyarit 5814400587
Dept. Biochemistry, Fac. Science, Kasetsart University
2 May, 2016 (11.15 - 12.00 a.m.)
Advanced Protein Biochemistry (01402542)
TOPICS
�2
Protein structure Protein function Protein interaction Protein engineering Peptide De novo design
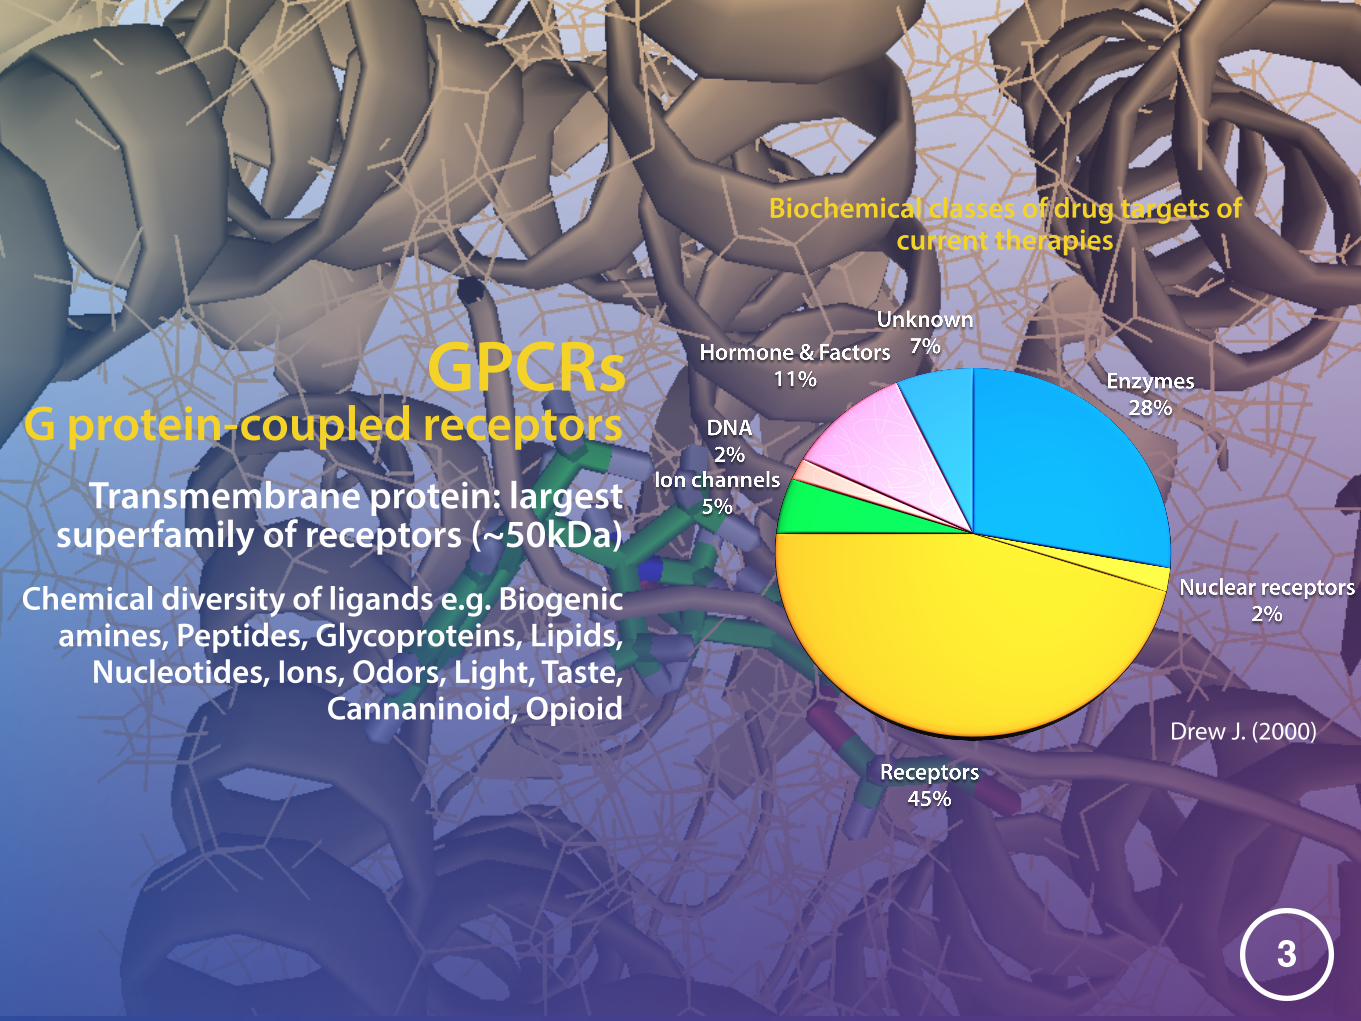
GPCRs
Transmembrane protein: largest superfamily of receptors (~50kDa)
�3
Drew J. (2000)
Biochemical classes of drug targets of current therapies
Chemical diversity of ligands e.g. Biogenic amines, Peptides, Glycoproteins, Lipids,
Nucleotides, Ions, Odors, Light, Taste, Cannaninoid, Opioid
G protein-coupled receptors
�4
HISTORY
shortcomings, the wide variety of techniques is likely to ensure a steadyincrease in the number of GPCR structures in the future.
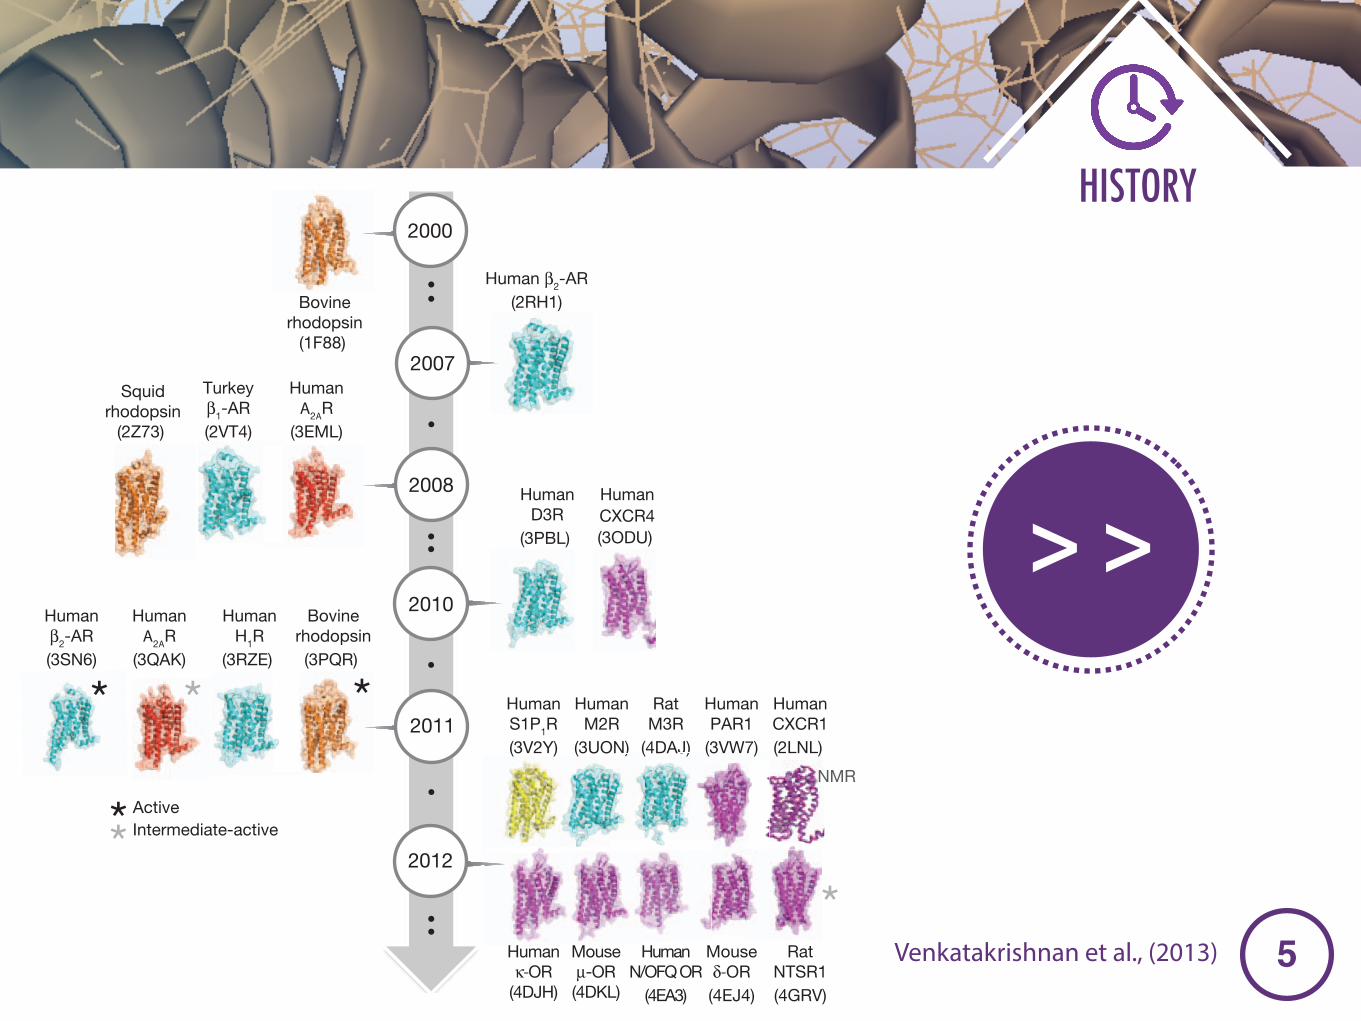
Solved structures of GPCRsSo far, high-resolution structures have been solved for the followingclass A GPCRs (Supplementary Table 1): (1) rhodopsin (bovine rho-dopsin18 and squid rhodopsin19); (2) several members of aminergicGPCRs: b-adrenoceptors (avian b1-AR (ref. 10) and human b2-AR (refs3, 6)), muscarinic acetylcholine receptors (human M2R (ref. 20) and ratM3R (ref. 21)), human H1 histamine receptor22, and human D3 dopa-mine receptor23; (3) a nucleoside-binding GPCR: human adenosine A2A
receptor (A2AR)24; (4) several members of the peptide-binding GPCRs:human CXCR4 chemokine receptor25, opioid receptors (human noci-ceptin receptor5 and k-OR26 and mouse m-OR27 and d-OR28), rat neu-rotensin receptor (NTSR1)29 and human protease-activated receptor(PAR1)30; and (5) a lipid-binding GPCR: human sphingosine-1 phos-phate (S1P1) receptor31. The human CXCR1 chemokine receptor is thefirst GPCR structure that was determined using NMR spectroscopy32.
The crystal structures of all of the above-mentioned class A GPCRs(except NTSR1) have been obtained in inactive conformations bound toeither inverse agonists that reduce basal activity or neutral antagoniststhat maintain basal activity. Rat NTSR1 (ref. 29), bovine rhodopsin13,14,33,human b2-AR (refs 8, 9, 34), avian b1-AR (refs 35, 36) and human A2AR
(refs 11, 37) were crystallized with agonists that induce an increase inbiological activity. Of these, only bovine rhodopsin13,14,33,38, humanb2-AR(refs 8, 9), human A2AR (refs 11, 37) and rat NTSR1 (ref. 29) wereobtained in active (or intermediate-active) states. An important land-mark in GPCR biology was the determination of the active-state ternarycomplex of b2-AR in complex with the heterotrimeric G protein9.
Molecular signatures of the GPCR foldThe structure of a GPCR can be divided into three parts: (1) the extra-cellular region, consisting of the N terminus and three extracellularloops (ECL1–ECL3); (2) the TM region, consisting of seven a-helices(TM1–TM7); and (3) the intracellular region, consisting of three intra-cellular loops (ICL1–ICL3), an intracellular amphipathic helix (H8), andthe C terminus (Fig. 2a). In a broad sense, the extracellular regionmodulates ligand access; the TM region forms the structural core, bindsligands and transduces this information to the intracellular regionthrough conformational changes, and the intracellular region interfaceswith cytosolic signalling proteins.
Extracellular region and ligand-binding pocket accessibilitySequence analysis shows that there is a large diversity in the lengths andsequence compositions of the N terminus39 and the extracellular loops40.The class A GPCR structures reveal two distinct types of extracellularregion: those that either occlude the ligand-binding pocket or leave theligand-binding pocket water-accessible (Fig. 2b). Rhodopsin18 and theS1P1 receptor31 have occluded binding pockets, presumably becausethey both bind hydrophobic ligands that may enter the receptor fromthe lipid bilayer41. The N terminus and ECL2 of rhodopsin fold intob-hairpin loops, and together they form a ‘lid’ for the ligand-bindingpocket. Similarly, the S1P1 receptor contains a three-turn a-helix thatpacks against ECL2 and ECL3 (ref. 31). In the receptors that bind water-soluble ligands, ECL2 can differ structurally between receptors, but thestructures are likely to be conserved in a subfamily-specific manner.ECL2 can contain helices (for example, certain aminergic or adenosinereceptors) or sheets (for example, peptide-binding receptors) (Fig. 2a).Even in the absence of defined secondary structural elements in ECL2(for example, in muscarinic receptors), it still partially folds over theextracellular region and shapes the route for ligand entry into the bind-ing pocket. Indeed, molecular dynamics simulations suggest that ECL2could be involved in the first steps of ligand recognition and selectivity inthe b-ARs21,42,43. Furthermore, pharmacological studies have shown thatthis region is important for ligand-binding kinetics27. In contrast toECL2, ECL1 and ECL3 are relatively short and tend to lack distinctsecondary structural elements40.
A unique feature of the extracellular region is the presence of disul-phide bridges that contribute to receptor stability. Although there areseveral subfamily-specific disulphide bridges, the one between a crucialresidue in TM3, Cys3.25 (in which the superscript denotes Ballesteros–Weinstein numbering44), and ECL2 seems to be highly conserved in mostGPCR structures (except S1P1). This TM3–ECL2 disulphide bridgeanchors the extracellular side of the helix near the binding site, and limitsthe extent of the conformational changes of this region during receptoractivation. Indeed, reducing the disulphide bridges can influence receptorstability and activity. Furthermore, in several GPCRs, ECL3 contains anadditional intra-loop disulphide bridge within a CXnC motif that possiblyinfluences receptor function by limiting the conformational freedomavailable to the loop. For instance, a missense mutation (Cys271Arg)in this disulphide bridge in the melanocortin-4 receptor results in recep-tor malfunction and is linked to obesity.
Conserved structural scaffold in the TM regionThe TM helix bundle serves as the communication link between theligand-binding pocket and the G-protein-coupling region. AlthoughGPCRs share a similar architecture of seven TM helices held togetherby tertiary contacts, their sequences are diverse. An objective comparisonof the structures of diverse GPCRs using a network representation permits
2000
2007
2008
2010
2011
2012
Bovinerhodopsin
(1F88)
Human β2-AR(2RH1)
Turkeyβ1-AR(2VT4)
Squidrhodopsin
(2Z73)
HumanΑ2ΑR
(3EML)
HumanD3R
(3PBL)
HumanCXCR4(3ODU)
HumanΑ2ΑR
(3QAK)
Bovinerhodopsin(3PQR)
HumanH1R
(3RZE)
Humanκ-OR
(4DJH)
Mouseμ-OR(4DKL)
HumanN/OFQ OR
(4EA3)
Mouseδ-OR(4EJ4)
HumanM2R
(3UON)N))
RatM3R
(4DAJ)J)J)
RatNTSR1(4GRV)
ActiveIntermediate-active
0
10
20
30
40
50
60
70
80
‘93 ‘941995
‘96 ‘97 ‘98 ‘992000
‘01 ‘02 ‘03 ‘042005
‘06 ‘07 ‘08 ‘09 ‘11 ‘12
First projectionmap
First electondensity map
Low-resolution structures
High-resolution structures
First high-resolutionstructure
First active-statestructure
First receptor–G proteincomplex structure
First NMRstructure
2010
Num
ber o
f str
uctu
res
Light-activated Aminergic Nucleoside binding Peptide binding Lipid binding
HumanS1P1R(3V2Y)
HumanPAR1
(3VW7)
HumanCXCR1(2LNL)
NMR
a
b
Humanβ2-AR(3SN6)
**
* **
*
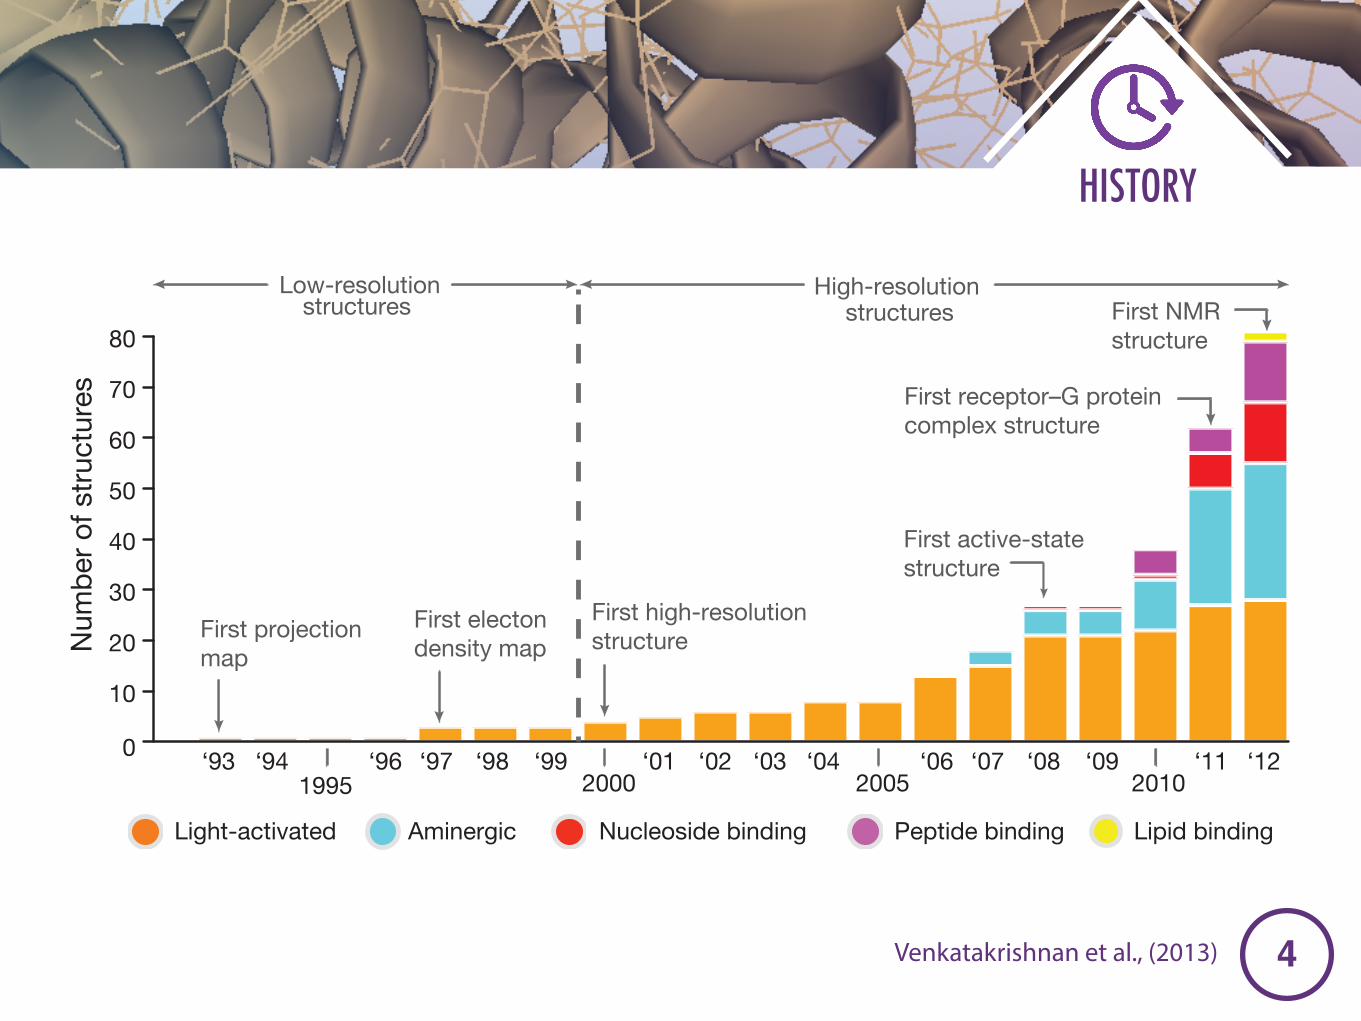
Figure 1 | Time-line of GPCR structures. a, Bar chart showing the increase inthe number of GPCR structures with time. b, Time-line showing representativecrystal structures of GPCRs and the year of publication. Active conformationsare marked with a black asterisk, and an intermediate-active conformation ismarked with a grey asterisk. Protein Data Bank accession numbers are shown inparentheses.
RESEARCH REVIEW
1 8 6 | N A T U R E | V O L 4 9 4 | 1 4 F E B R U A R Y 2 0 1 3
Macmillan Publishers Limited. All rights reserved©2013
Venkatakrishnan et al., (2013)
�5
HISTORY
Venkatakrishnan et al., (2013)
shortcomings, the wide variety of techniques is likely to ensure a steadyincrease in the number of GPCR structures in the future.
Solved structures of GPCRsSo far, high-resolution structures have been solved for the followingclass A GPCRs (Supplementary Table 1): (1) rhodopsin (bovine rho-dopsin18 and squid rhodopsin19); (2) several members of aminergicGPCRs: b-adrenoceptors (avian b1-AR (ref. 10) and human b2-AR (refs3, 6)), muscarinic acetylcholine receptors (human M2R (ref. 20) and ratM3R (ref. 21)), human H1 histamine receptor22, and human D3 dopa-mine receptor23; (3) a nucleoside-binding GPCR: human adenosine A2A
receptor (A2AR)24; (4) several members of the peptide-binding GPCRs:human CXCR4 chemokine receptor25, opioid receptors (human noci-ceptin receptor5 and k-OR26 and mouse m-OR27 and d-OR28), rat neu-rotensin receptor (NTSR1)29 and human protease-activated receptor(PAR1)30; and (5) a lipid-binding GPCR: human sphingosine-1 phos-phate (S1P1) receptor31. The human CXCR1 chemokine receptor is thefirst GPCR structure that was determined using NMR spectroscopy32.
The crystal structures of all of the above-mentioned class A GPCRs(except NTSR1) have been obtained in inactive conformations bound toeither inverse agonists that reduce basal activity or neutral antagoniststhat maintain basal activity. Rat NTSR1 (ref. 29), bovine rhodopsin13,14,33,human b2-AR (refs 8, 9, 34), avian b1-AR (refs 35, 36) and human A2AR
(refs 11, 37) were crystallized with agonists that induce an increase inbiological activity. Of these, only bovine rhodopsin13,14,33,38, humanb2-AR(refs 8, 9), human A2AR (refs 11, 37) and rat NTSR1 (ref. 29) wereobtained in active (or intermediate-active) states. An important land-mark in GPCR biology was the determination of the active-state ternarycomplex of b2-AR in complex with the heterotrimeric G protein9.
Molecular signatures of the GPCR foldThe structure of a GPCR can be divided into three parts: (1) the extra-cellular region, consisting of the N terminus and three extracellularloops (ECL1–ECL3); (2) the TM region, consisting of seven a-helices(TM1–TM7); and (3) the intracellular region, consisting of three intra-cellular loops (ICL1–ICL3), an intracellular amphipathic helix (H8), andthe C terminus (Fig. 2a). In a broad sense, the extracellular regionmodulates ligand access; the TM region forms the structural core, bindsligands and transduces this information to the intracellular regionthrough conformational changes, and the intracellular region interfaceswith cytosolic signalling proteins.
Extracellular region and ligand-binding pocket accessibilitySequence analysis shows that there is a large diversity in the lengths andsequence compositions of the N terminus39 and the extracellular loops40.The class A GPCR structures reveal two distinct types of extracellularregion: those that either occlude the ligand-binding pocket or leave theligand-binding pocket water-accessible (Fig. 2b). Rhodopsin18 and theS1P1 receptor31 have occluded binding pockets, presumably becausethey both bind hydrophobic ligands that may enter the receptor fromthe lipid bilayer41. The N terminus and ECL2 of rhodopsin fold intob-hairpin loops, and together they form a ‘lid’ for the ligand-bindingpocket. Similarly, the S1P1 receptor contains a three-turn a-helix thatpacks against ECL2 and ECL3 (ref. 31). In the receptors that bind water-soluble ligands, ECL2 can differ structurally between receptors, but thestructures are likely to be conserved in a subfamily-specific manner.ECL2 can contain helices (for example, certain aminergic or adenosinereceptors) or sheets (for example, peptide-binding receptors) (Fig. 2a).Even in the absence of defined secondary structural elements in ECL2(for example, in muscarinic receptors), it still partially folds over theextracellular region and shapes the route for ligand entry into the bind-ing pocket. Indeed, molecular dynamics simulations suggest that ECL2could be involved in the first steps of ligand recognition and selectivity inthe b-ARs21,42,43. Furthermore, pharmacological studies have shown thatthis region is important for ligand-binding kinetics27. In contrast toECL2, ECL1 and ECL3 are relatively short and tend to lack distinctsecondary structural elements40.
A unique feature of the extracellular region is the presence of disul-phide bridges that contribute to receptor stability. Although there areseveral subfamily-specific disulphide bridges, the one between a crucialresidue in TM3, Cys3.25 (in which the superscript denotes Ballesteros–Weinstein numbering44), and ECL2 seems to be highly conserved in mostGPCR structures (except S1P1). This TM3–ECL2 disulphide bridgeanchors the extracellular side of the helix near the binding site, and limitsthe extent of the conformational changes of this region during receptoractivation. Indeed, reducing the disulphide bridges can influence receptorstability and activity. Furthermore, in several GPCRs, ECL3 contains anadditional intra-loop disulphide bridge within a CXnC motif that possiblyinfluences receptor function by limiting the conformational freedomavailable to the loop. For instance, a missense mutation (Cys271Arg)in this disulphide bridge in the melanocortin-4 receptor results in recep-tor malfunction and is linked to obesity.
Conserved structural scaffold in the TM regionThe TM helix bundle serves as the communication link between theligand-binding pocket and the G-protein-coupling region. AlthoughGPCRs share a similar architecture of seven TM helices held togetherby tertiary contacts, their sequences are diverse. An objective comparisonof the structures of diverse GPCRs using a network representation permits
2000
2007
2008
2010
2011
2012
Bovinerhodopsin
(1F88)
Human β2-AR(2RH1)
Turkeyβ1-AR(2VT4)
Squidrhodopsin
(2Z73)
HumanΑ2ΑR
(3EML)
HumanD3R
(3PBL)
HumanCXCR4(3ODU)
HumanΑ2ΑR
(3QAK)
Bovinerhodopsin(3PQR)
HumanH1R
(3RZE)
Humanκ-OR
(4DJH)
Mouseμ-OR(4DKL)
HumanN/OFQ OR
(4EA3)
Mouseδ-OR(4EJ4)
HumanM2R
(3UON)N))
RatM3R
(4DAJ)J)J)
RatNTSR1(4GRV)
ActiveIntermediate-active
0
10
20
30
40
50
60
70
80
‘93 ‘941995
‘96 ‘97 ‘98 ‘992000
‘01 ‘02 ‘03 ‘042005
‘06 ‘07 ‘08 ‘09 ‘11 ‘12
First projectionmap
First electondensity map
Low-resolution structures
High-resolution structures
First high-resolutionstructure
First active-statestructure
First receptor–G proteincomplex structure
First NMRstructure
2010
Num
ber o
f str
uctu
res
Light-activated Aminergic Nucleoside binding Peptide binding Lipid binding
HumanS1P1R(3V2Y)
HumanPAR1
(3VW7)
HumanCXCR1(2LNL)
NMR
a
b
Humanβ2-AR(3SN6)
**
* **
*
Figure 1 | Time-line of GPCR structures. a, Bar chart showing the increase inthe number of GPCR structures with time. b, Time-line showing representativecrystal structures of GPCRs and the year of publication. Active conformationsare marked with a black asterisk, and an intermediate-active conformation ismarked with a grey asterisk. Protein Data Bank accession numbers are shown inparentheses.
RESEARCH REVIEW
1 8 6 | N A T U R E | V O L 4 9 4 | 1 4 F E B R U A R Y 2 0 1 3
Macmillan Publishers Limited. All rights reserved©2013
> >
�6
HISTORY
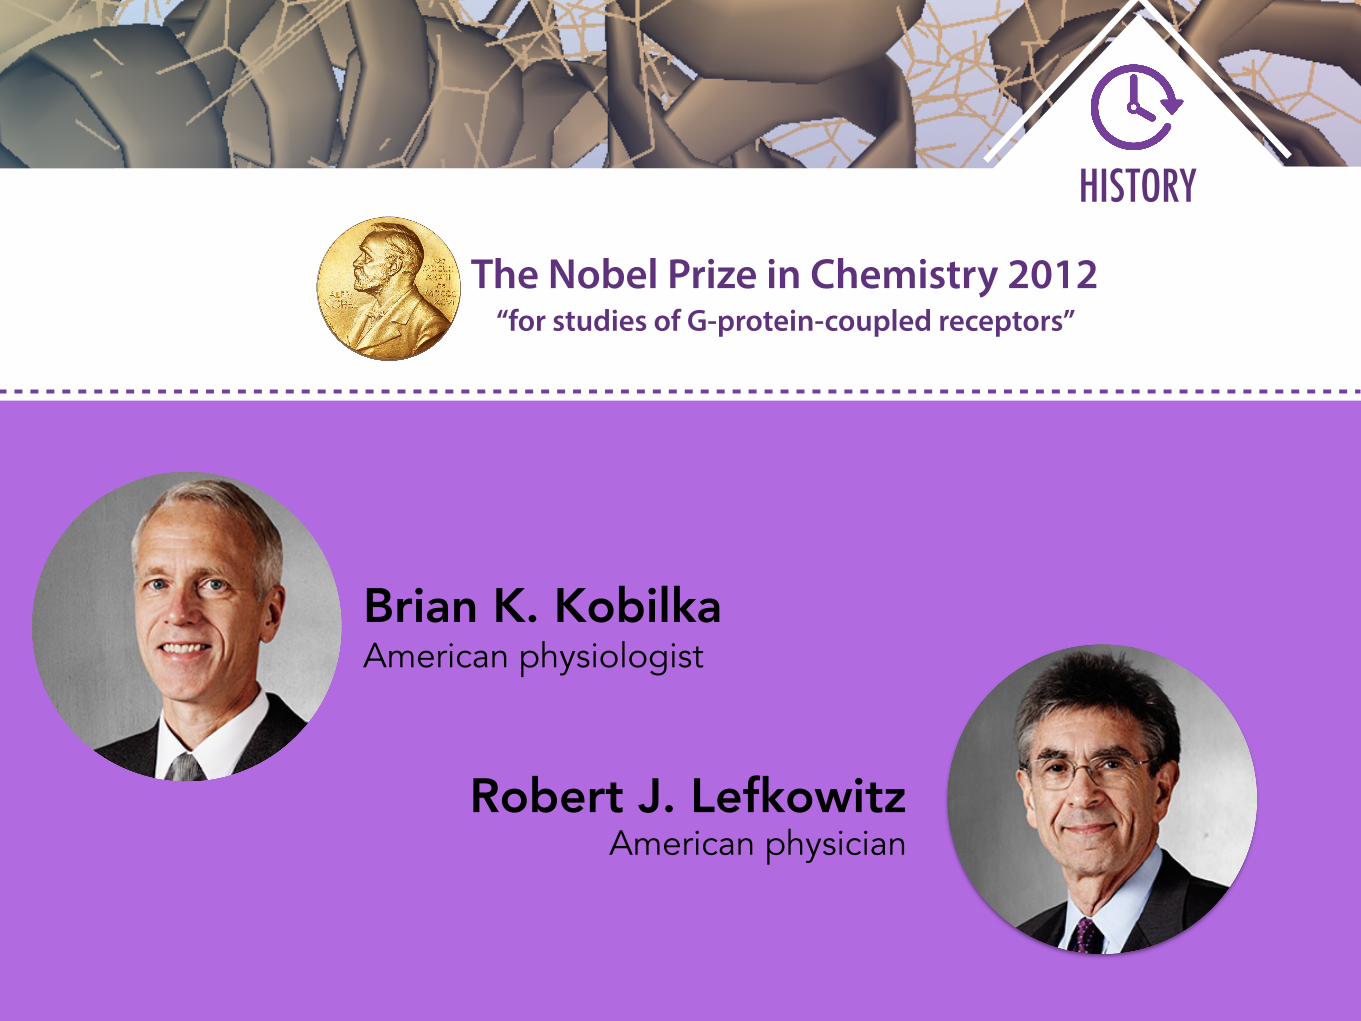
The Nobel Prize in Chemistry 2012 “for studies of G-protein-coupled receptors”
Brian K. KobilkaAmerican physiologist
Robert J. LefkowitzAmerican physician
�7
GPCRs
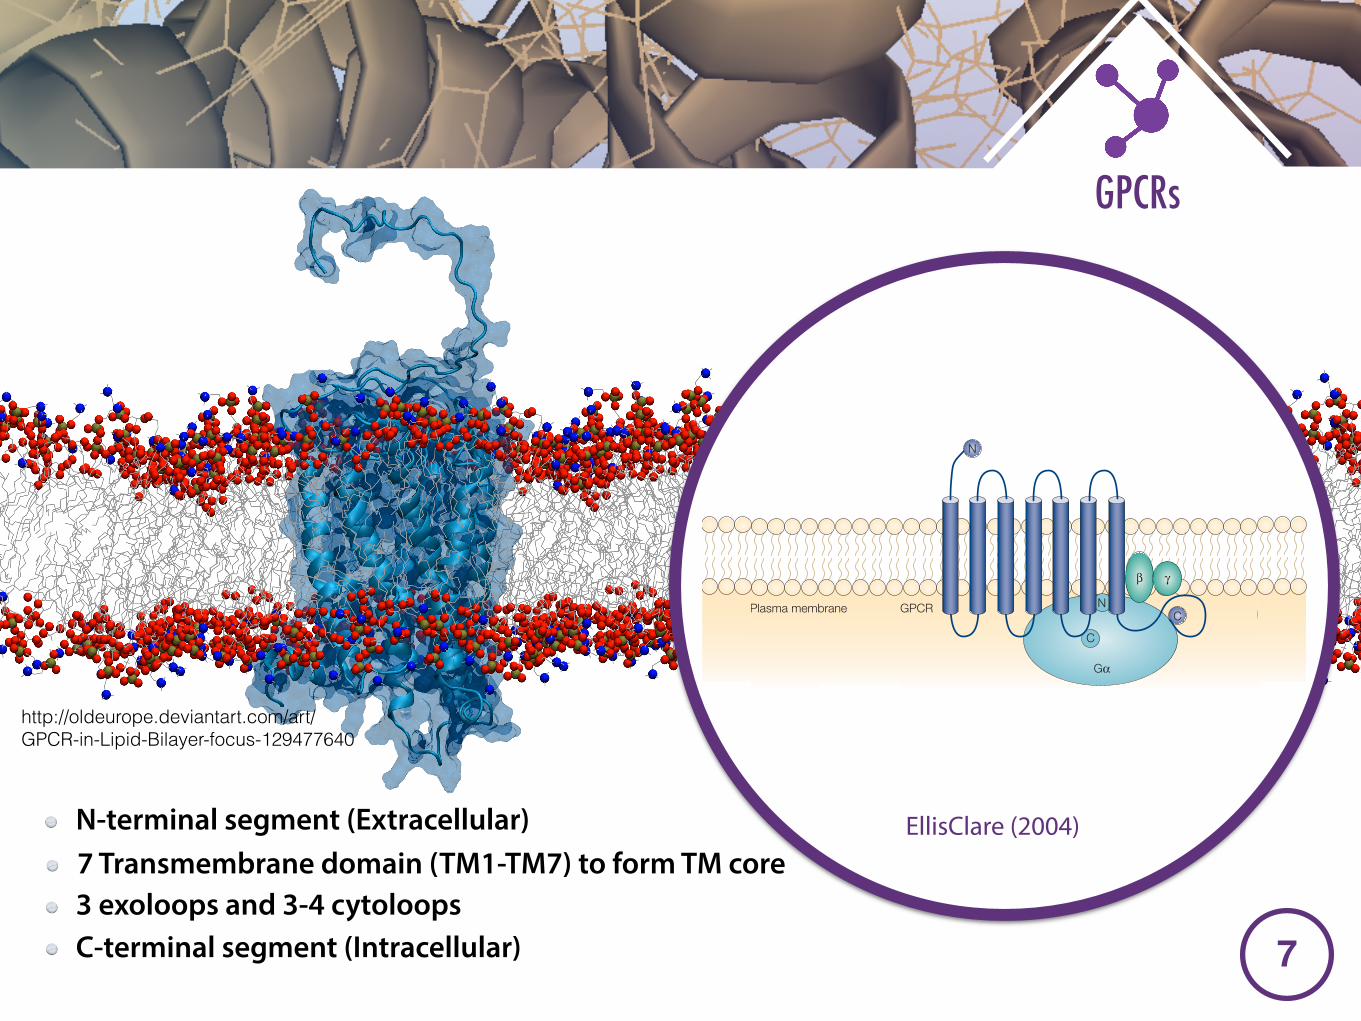
http://oldeurope.deviantart.com/art/GPCR-in-Lipid-Bilayer-focus-129477640
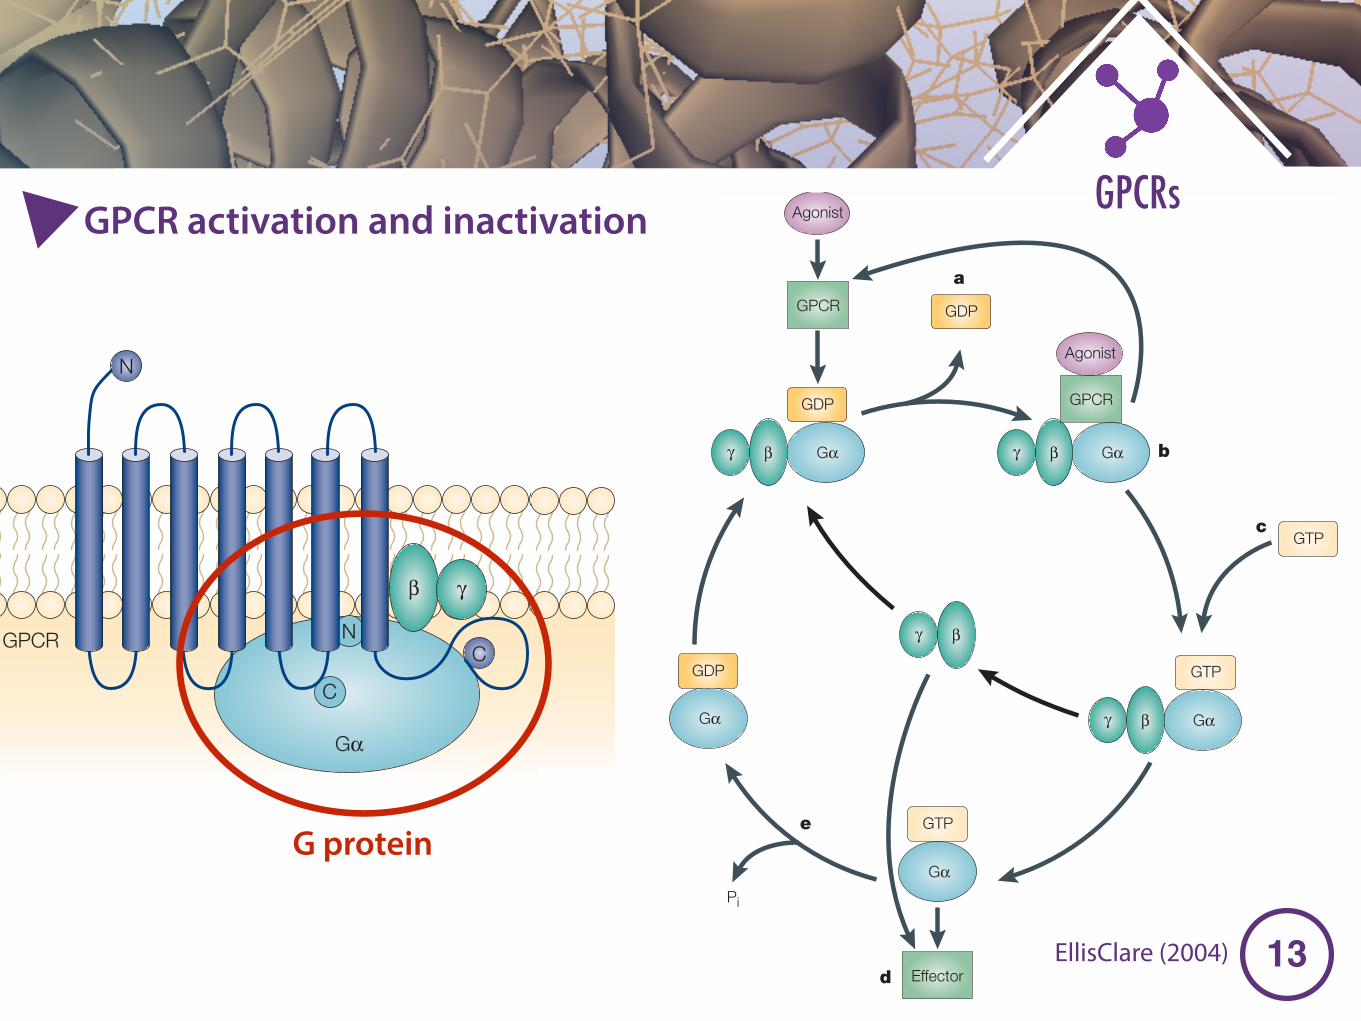
N-terminal segment (Extracellular)7 Transmembrane domain (TM1-TM7) to form TM core3 exoloops and 3-4 cytoloopsC-terminal segment (Intracellular)
EllisClare (2004)
NATURE REVIEWS | DRUG DISCOVERY VOLUME 3 | JULY 2004 | 593
T W E N T Y Q U E S T I O N S
Tamas Bartfai. Both inside and outside the pharmaceu-tical industry, the rhodopsin model has been combinedwith what we know about PHARMACOPHORES — which is aknowledge-rich area for several monoamine receptors— to cobble together models. However, such modelshave often been of post factum value; explaining ratherthan predicting results.
Joël Bockaert. The predictions have generally been‘correct’, but the rhodopsin crystal was obtained in thepresence of retinal, which is an inverse agonist. So far, thestructure of an ‘active’ rhodopsin molecule is still lacking.
Arthur Christopoulos. The determination of thecrystal structure of bovine rhodopsin at high resolution59
has certainly been a boon to the GPCR field. One mustbear in mind, however, that rhodopsin has low sequencesimilarity to most other GPCRs, has an inverse agonistincorporated into its structure, and the crystals obtainedwere of the receptor in its inactive state, so we should notnecessarily expect to find high degrees of concordancebetween this structure and other GPCRs. Nevertheless, agood starting point is better than none, and there havebeen very successful predictions for the structures ofsome of the receptors for bioamines and related smallmolecules based on the rhodopsin model; for example,muscarinic M1, dopamine D2, α1-adrenoceptor, hista-mine H3 and adenosine A1 receptors4,63,64. Of course, thisonly refers to the transmembrane domains of the GPCRs;we are still some way off determining the intra- andextracellular loop structures.
Jean-Philippe Pin. The structural predictions havebeen good enough for the general analysis of homo-logous protein structures, even for distantly relatedGPCRs, such as the heptahelical domain of class III(family 3/C) GPCRs, which include metabotropic glutamate, GABAB (γ-amino butyric acid, type B), Ca2+
and some taste and pheromone receptors (see, forexample, REF. 65). However, one should take into con-sideration that the rhodopsin structure corresponds toa fully inactive state of a GPCR (stabilized by an inverseagonist), such that the various active states cannot yetbe predicted with accuracy. Accordingly, such modelsare more useful for the characterization of the bindingsites of inverse agonists. I am still not convinced thatsuch models are accurate enough for a detailed analysisof ligand-binding sites and drug design. Recently,Didier Rognan and collaborators have used such arhodopsin-based model of the vasopressin V2 receptorfor in silico screening of possible new agonists andantagonists66. This approach allowed them to identifyknown agonists and antagonists hidden in the chemicaldatabase, which suggests that it is a promising technique.However, whether new leads can be identified in thisway remains to be shown.
Bernard P. Roques. Few breakthroughs in the field ofGPCR structural determination have emerged from mol-ecular modelling using the rhodopsin structure, exceptsome data about the intra-cytoplasmic loops involved in
Gα
N
C
CPlasma membrane GPCR
β γ
A N
GPCR
Gα Gα
Gα
Gα
Gα
βγ
βγ
GDP
βγ
GTP
GTP
GDP
GTP
GDP
Effector
Pi
βγ
a
b
c
d
e
GPCR
B Agonist
Agonist
Figure 3 | GPCR–Gαα fusion proteins as a model system for the analysis of receptor–G-protein coupling. A | Schematic of a G-protein-coupled receptor (GPCR)–Gα fusion protein.The GPCR carboxyl terminus (C) is fused to the amino terminus (N) of Gα22, ensuring closeproximity and defined stoichiometry of the two coupling partners. GPCRs can activate G proteinslinearly (that is, one GPCR molecule activates one G protein) rather than catalytically (that is, oneGPCR molecule activates several G proteins), which substantiates the relevance of the fusionprotein technique26,85. Fusion proteins also enable the study of coupling between GPCR speciesisoforms58 or intra-species polymorphic forms185 and a particular Gα isoform. Correspondingly,the coupling of a particular receptor to various Gα isoforms can also be analysed26,85. Crosstalkbetween fusion proteins to non-fused Gα and between different fusion protein molecules199,200
must be taken into consideration. B | G-protein cycling. Rate-limiting receptor-promoted GDPdissociation (a) is followed by ternary complex formation (b). The GPCR then catalyses the bindingof GTP to Gα (c), which disrupts the ternary complex, causing dissociation of the G-proteinheterotrimer into Gα and βγ. Both entities regulate the activity of effector systems (d; see alsoTABLES 1, 2 and 3). G-protein activation is terminated by hydrolysis of the Gα-bound GTP to GDPand Pi (e). GPCR–Gα fusions are useful for studying steps b, c, d and e of the G-protein cycle(to our knowledge, GDP dissociation (a) has not been directly studied with this system). Figure prepared by Roland Seifert.
�8
GPCRs
NATURE REVIEWS | DRUG DISCOVERY VOLUME 3 | JULY 2004 | 593
T W E N T Y Q U E S T I O N S
Tamas Bartfai. Both inside and outside the pharmaceu-tical industry, the rhodopsin model has been combinedwith what we know about PHARMACOPHORES — which is aknowledge-rich area for several monoamine receptors— to cobble together models. However, such modelshave often been of post factum value; explaining ratherthan predicting results.
Joël Bockaert. The predictions have generally been‘correct’, but the rhodopsin crystal was obtained in thepresence of retinal, which is an inverse agonist. So far, thestructure of an ‘active’ rhodopsin molecule is still lacking.
Arthur Christopoulos. The determination of thecrystal structure of bovine rhodopsin at high resolution59
has certainly been a boon to the GPCR field. One mustbear in mind, however, that rhodopsin has low sequencesimilarity to most other GPCRs, has an inverse agonistincorporated into its structure, and the crystals obtainedwere of the receptor in its inactive state, so we should notnecessarily expect to find high degrees of concordancebetween this structure and other GPCRs. Nevertheless, agood starting point is better than none, and there havebeen very successful predictions for the structures ofsome of the receptors for bioamines and related smallmolecules based on the rhodopsin model; for example,muscarinic M1, dopamine D2, α1-adrenoceptor, hista-mine H3 and adenosine A1 receptors4,63,64. Of course, thisonly refers to the transmembrane domains of the GPCRs;we are still some way off determining the intra- andextracellular loop structures.
Jean-Philippe Pin. The structural predictions havebeen good enough for the general analysis of homo-logous protein structures, even for distantly relatedGPCRs, such as the heptahelical domain of class III(family 3/C) GPCRs, which include metabotropic glutamate, GABAB (γ-amino butyric acid, type B), Ca2+
and some taste and pheromone receptors (see, forexample, REF. 65). However, one should take into con-sideration that the rhodopsin structure corresponds toa fully inactive state of a GPCR (stabilized by an inverseagonist), such that the various active states cannot yetbe predicted with accuracy. Accordingly, such modelsare more useful for the characterization of the bindingsites of inverse agonists. I am still not convinced thatsuch models are accurate enough for a detailed analysisof ligand-binding sites and drug design. Recently,Didier Rognan and collaborators have used such arhodopsin-based model of the vasopressin V2 receptorfor in silico screening of possible new agonists andantagonists66. This approach allowed them to identifyknown agonists and antagonists hidden in the chemicaldatabase, which suggests that it is a promising technique.However, whether new leads can be identified in thisway remains to be shown.
Bernard P. Roques. Few breakthroughs in the field ofGPCR structural determination have emerged from mol-ecular modelling using the rhodopsin structure, exceptsome data about the intra-cytoplasmic loops involved in
Gα
N
C
CPlasma membrane GPCR
β γ
A N
GPCR
Gα Gα
Gα
Gα
Gα
βγ
βγ
GDP
βγ
GTP
GTP
GDP
GTP
GDP
Effector
Pi
βγ
a
b
c
d
e
GPCR
B Agonist
Agonist
Figure 3 | GPCR–Gαα fusion proteins as a model system for the analysis of receptor–G-protein coupling. A | Schematic of a G-protein-coupled receptor (GPCR)–Gα fusion protein.The GPCR carboxyl terminus (C) is fused to the amino terminus (N) of Gα22, ensuring closeproximity and defined stoichiometry of the two coupling partners. GPCRs can activate G proteinslinearly (that is, one GPCR molecule activates one G protein) rather than catalytically (that is, oneGPCR molecule activates several G proteins), which substantiates the relevance of the fusionprotein technique26,85. Fusion proteins also enable the study of coupling between GPCR speciesisoforms58 or intra-species polymorphic forms185 and a particular Gα isoform. Correspondingly,the coupling of a particular receptor to various Gα isoforms can also be analysed26,85. Crosstalkbetween fusion proteins to non-fused Gα and between different fusion protein molecules199,200
must be taken into consideration. B | G-protein cycling. Rate-limiting receptor-promoted GDPdissociation (a) is followed by ternary complex formation (b). The GPCR then catalyses the bindingof GTP to Gα (c), which disrupts the ternary complex, causing dissociation of the G-proteinheterotrimer into Gα and βγ. Both entities regulate the activity of effector systems (d; see alsoTABLES 1, 2 and 3). G-protein activation is terminated by hydrolysis of the Gα-bound GTP to GDPand Pi (e). GPCR–Gα fusions are useful for studying steps b, c, d and e of the G-protein cycle(to our knowledge, GDP dissociation (a) has not been directly studied with this system). Figure prepared by Roland Seifert.
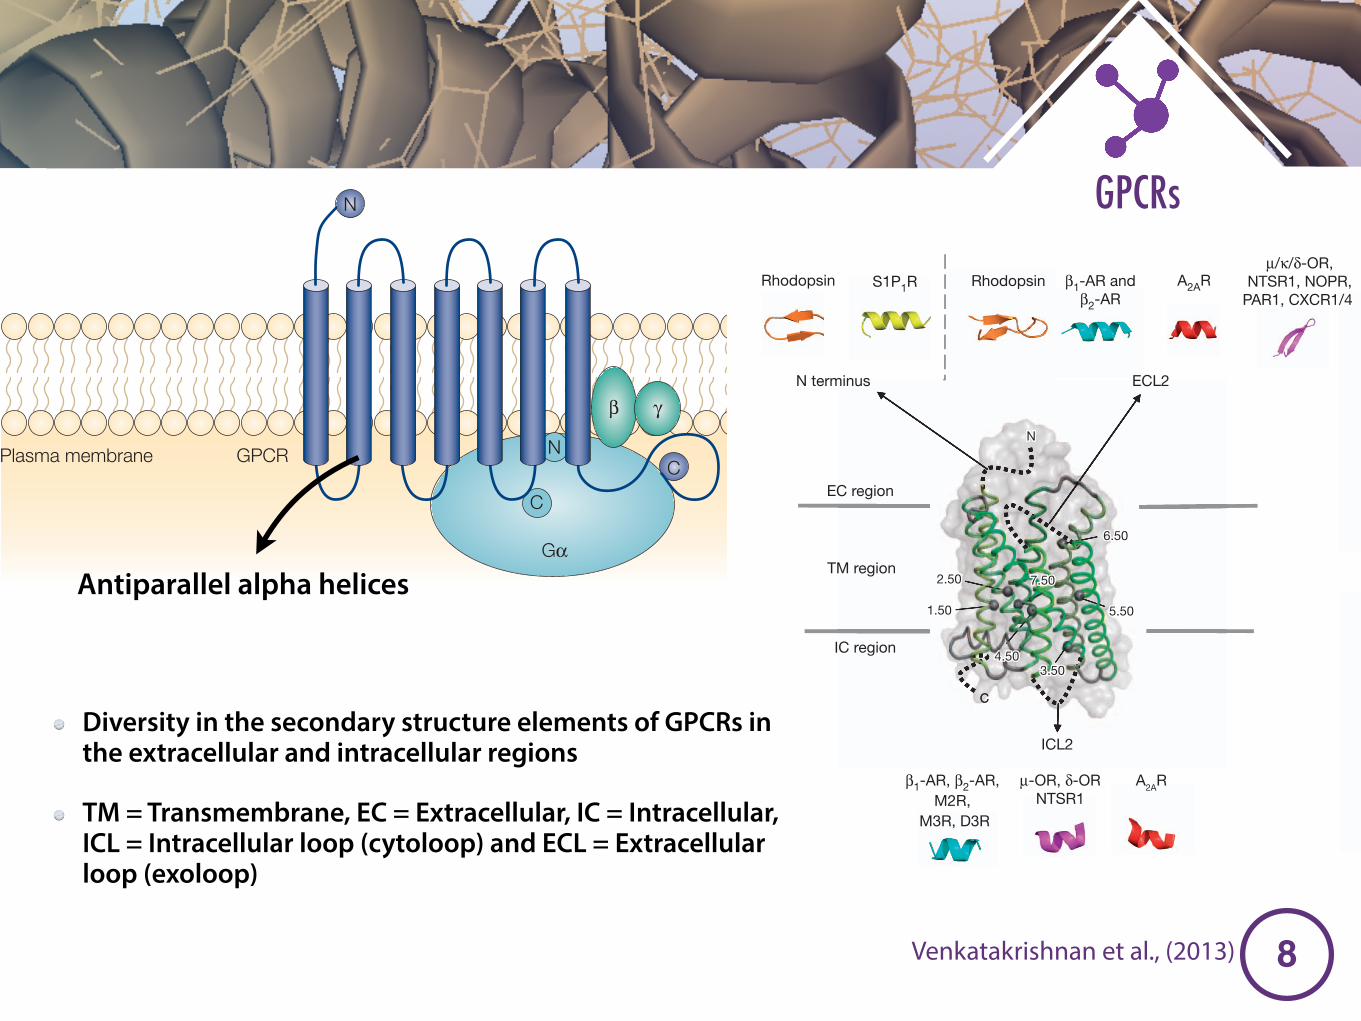
Antiparallel alpha helices
Venkatakrishnan et al., (2013)
us to investigate whether any tertiary contacts between TM helices areconserved, independent of sequence diversity. A systematic analysis of thedifferent GPCR structures, which includes both active and inactive states,reveals a consensus network of 24 inter-TM contacts mediated by 36topologically equivalent amino acids (Supplementary Table 2). The topo-logically equivalent positions are identified through structure-basedsequence alignment and are referred to by the Ballesteros–Weinsteinnumbering scheme (Supplementary Table 3). In this consensus network,the contacts are present in all (or all but one) of the structures, irrespectiveof their conformational state, and thus are likely to represent structurallyimportant positions in the receptor (Fig. 3). The importance of thesepositions is highlighted by the fact that mutations in 14 out of 36 positionshave been noted to result in either an increase or a loss of receptor activ-ity45. With the availability of more high-resolution structures of otherGPCRs, one may converge on a unified subset of inter-helical contactsthat is maintained in all GPCRs.
The 36 topologically equivalent residues of the structural scaffoldinclude highly conserved residues such as Asn1.50, Asp2.50, Trp4.50 andPro7.50. Nevertheless, we also observe that many topologically equivalentpositions can tolerate variability in amino acid substitutions. The identityof some of these 36 positions may be variable, but they all neverthelesspredominantly maintain the non-covalent contacts between them. Forinstance, although a contact between 2.42 and 3.46 is seen in all struc-tures, these residues are different among different receptors: for example,Ile 75 and Leu 131 in bovine rhodopsin and Tyr 97 and Met 152 in thehuman k-OR. Thus, the consensus inter-TM contact network seems toprovide an evolutionarily conserved structural scaffold of non-covalentcontacts for the GPCR fold. It is likely that the tolerance of sequencevariability in some of these positions permits diverse sequences to adopt asimilar structure, thereby contributing to the evolutionary success ofthe GPCR fold. These conformation-independent consensus contactsmay constitute a rigid platform on which distinct conformation-specific
structural changes take place. Importantly, the network approach usedhere and the consensus set of inter-TM tertiary contacts identifiedshould be valuable for GPCR engineering, de novo GPCR modellingand to increase the accuracy of GPCR homology models for variousapplications46.
In terms of spatial positioning within the receptor, the consensusinter-TM tertiary contacts are largely localized to the central and cyto-plasmic side of the TM bundle and primarily clustered at the interfacesof TM1–TM2, TM3–TM4, TM3–TM5 and TM3–TM6–TM7.Conservation of these contacts across diverse GPCRs may be due tothe requirement for receptor biogenesis, protein stability or functional-ity. For instance, TM1 and TM2 do not undergo any major movementafter receptor activation. Because they are the first two TM regions to betranslated by the ribosome, the consensus contacts observed here mighthave an important role in membrane insertion, folding and topogenesisof GPCRs. Indeed, mutagenesis experiments of the neurotensin recep-tor47 provide support for this possibility. Similarly, TM3 shares con-sensus helical packing interfaces with all other TM helices exceptTM1 and TM7, suggesting a role in maintaining the fold (Fig. 3b).This does not mean that TM3 makes no contacts with TM1 or TM7but that the contacts between equivalent residues are not maintainedacross different receptors. Whereas the middle portion of TM3 makesconsensus contacts with TM4 and TM6, the portion towards the cyto-plasm makes contacts with TM5 and TM2. Thus, TM3 seems to have akey role of ‘structural hub’ in maintaining the scaffold in all GPCRstructures, both in the inactive and active conformational states(Fig. 3b). Intriguingly, TM3 adopts an extreme tilt-angle (,35u), andthis unusual geometry may facilitate its role as a structural hub.
Consensus scaffold of class A GPCR ligand-binding pocketA remarkable feature of the GPCR family is its ability to bind ligands ofdiverse shapes, sizes and chemical properties. Although all ligands have
TM region
EC region
IC region
β1-AR andβ2-AR
ICL2
ECL2N terminus
S1P1RRhodopsin Rhodopsin
β1-AR, β2-AR, M2R,
M3R, D3R
μ-OR, δ-ORNTSR1
A2AR
a bOccluded
ligand-binding pocket
Bovine rhodopsin
Exposedligand-binding pocket
Human A2AR
μ/κ/δ-OR,NTSR1, NOPR,
PAR1, CXCR1/4 A2AR
NN
4.504.503.503.50
5.505.50
6.506.50
7.507.50
1.501.50
2.502.50
C
N
4.503.50
5.50
6.50
7.50
1.50
2.50
C
Figure 2 | Diversity in the secondary structure elements of GPCRs in theextracellular and intracellular regions. a, TM helices (TM1–TM7) are shownas cartoon (coloured in a spectrum of green) and surface representation.Numbers denote Ballesteros–Weinstein numbering. In this receptor-independent notation, each residue is identified by two numbers that areseparated by a dot (for example, 1.50): the first number ranges from 1 to 7 andcorresponds to the TM helix where the residue is located; the second numberindicates its position relative to the most conserved residue of the helix, which isassigned the number 50. Residues in the same TM helix that are N- orC-terminal to the ‘50’ residue are assigned a number that decreases or increases
sequentially, respectively. For example, a residue just before or after the mosthighly conserved residue in TM1 will be assigned 1.49 or 1.51, respectively. Nand C termini and the segments containing defined secondary structure in theextracellular (EC) and intracellular (IC) region are shown as dotted lines; thetype of secondary structure element for the different representative GPCRs areshown in the grey panels. The loop regions lacking an a-helix or a b-sheet inany of the structures are not shown. See Fig. 1 for receptor colour code.b, Extracellular region that occludes or exposes the ligand-binding pocket asseen from the extracellular side (top view).
REVIEW RESEARCH
1 4 F E B R U A R Y 2 0 1 3 | V O L 4 9 4 | N A T U R E | 1 8 7
Macmillan Publishers Limited. All rights reserved©2013
Diversity in the secondary structure elements of GPCRs in the extracellular and intracellular regions
TM = Transmembrane, EC = Extracellular, IC = Intracellular, ICL = Intracellular loop (cytoloop) and ECL = Extracellular loop (exoloop)
�9
GPCRs
Venkatakrishnan et al., (2013)
us to investigate whether any tertiary contacts between TM helices areconserved, independent of sequence diversity. A systematic analysis of thedifferent GPCR structures, which includes both active and inactive states,reveals a consensus network of 24 inter-TM contacts mediated by 36topologically equivalent amino acids (Supplementary Table 2). The topo-logically equivalent positions are identified through structure-basedsequence alignment and are referred to by the Ballesteros–Weinsteinnumbering scheme (Supplementary Table 3). In this consensus network,the contacts are present in all (or all but one) of the structures, irrespectiveof their conformational state, and thus are likely to represent structurallyimportant positions in the receptor (Fig. 3). The importance of thesepositions is highlighted by the fact that mutations in 14 out of 36 positionshave been noted to result in either an increase or a loss of receptor activ-ity45. With the availability of more high-resolution structures of otherGPCRs, one may converge on a unified subset of inter-helical contactsthat is maintained in all GPCRs.
The 36 topologically equivalent residues of the structural scaffoldinclude highly conserved residues such as Asn1.50, Asp2.50, Trp4.50 andPro7.50. Nevertheless, we also observe that many topologically equivalentpositions can tolerate variability in amino acid substitutions. The identityof some of these 36 positions may be variable, but they all neverthelesspredominantly maintain the non-covalent contacts between them. Forinstance, although a contact between 2.42 and 3.46 is seen in all struc-tures, these residues are different among different receptors: for example,Ile 75 and Leu 131 in bovine rhodopsin and Tyr 97 and Met 152 in thehuman k-OR. Thus, the consensus inter-TM contact network seems toprovide an evolutionarily conserved structural scaffold of non-covalentcontacts for the GPCR fold. It is likely that the tolerance of sequencevariability in some of these positions permits diverse sequences to adopt asimilar structure, thereby contributing to the evolutionary success ofthe GPCR fold. These conformation-independent consensus contactsmay constitute a rigid platform on which distinct conformation-specific
structural changes take place. Importantly, the network approach usedhere and the consensus set of inter-TM tertiary contacts identifiedshould be valuable for GPCR engineering, de novo GPCR modellingand to increase the accuracy of GPCR homology models for variousapplications46.
In terms of spatial positioning within the receptor, the consensusinter-TM tertiary contacts are largely localized to the central and cyto-plasmic side of the TM bundle and primarily clustered at the interfacesof TM1–TM2, TM3–TM4, TM3–TM5 and TM3–TM6–TM7.Conservation of these contacts across diverse GPCRs may be due tothe requirement for receptor biogenesis, protein stability or functional-ity. For instance, TM1 and TM2 do not undergo any major movementafter receptor activation. Because they are the first two TM regions to betranslated by the ribosome, the consensus contacts observed here mighthave an important role in membrane insertion, folding and topogenesisof GPCRs. Indeed, mutagenesis experiments of the neurotensin recep-tor47 provide support for this possibility. Similarly, TM3 shares con-sensus helical packing interfaces with all other TM helices exceptTM1 and TM7, suggesting a role in maintaining the fold (Fig. 3b).This does not mean that TM3 makes no contacts with TM1 or TM7but that the contacts between equivalent residues are not maintainedacross different receptors. Whereas the middle portion of TM3 makesconsensus contacts with TM4 and TM6, the portion towards the cyto-plasm makes contacts with TM5 and TM2. Thus, TM3 seems to have akey role of ‘structural hub’ in maintaining the scaffold in all GPCRstructures, both in the inactive and active conformational states(Fig. 3b). Intriguingly, TM3 adopts an extreme tilt-angle (,35u), andthis unusual geometry may facilitate its role as a structural hub.
Consensus scaffold of class A GPCR ligand-binding pocketA remarkable feature of the GPCR family is its ability to bind ligands ofdiverse shapes, sizes and chemical properties. Although all ligands have
TM region
EC region
IC region
β1-AR andβ2-AR
ICL2
ECL2N terminus
S1P1RRhodopsin Rhodopsin
β1-AR, β2-AR, M2R,
M3R, D3R
μ-OR, δ-ORNTSR1
A2AR
a bOccluded
ligand-binding pocket
Bovine rhodopsin
Exposedligand-binding pocket
Human A2AR
μ/κ/δ-OR,NTSR1, NOPR,
PAR1, CXCR1/4 A2AR
NN
4.504.503.503.50
5.505.50
6.506.50
7.507.50
1.501.50
2.502.50
C
N
4.503.50
5.50
6.50
7.50
1.50
2.50
C
Figure 2 | Diversity in the secondary structure elements of GPCRs in theextracellular and intracellular regions. a, TM helices (TM1–TM7) are shownas cartoon (coloured in a spectrum of green) and surface representation.Numbers denote Ballesteros–Weinstein numbering. In this receptor-independent notation, each residue is identified by two numbers that areseparated by a dot (for example, 1.50): the first number ranges from 1 to 7 andcorresponds to the TM helix where the residue is located; the second numberindicates its position relative to the most conserved residue of the helix, which isassigned the number 50. Residues in the same TM helix that are N- orC-terminal to the ‘50’ residue are assigned a number that decreases or increases
sequentially, respectively. For example, a residue just before or after the mosthighly conserved residue in TM1 will be assigned 1.49 or 1.51, respectively. Nand C termini and the segments containing defined secondary structure in theextracellular (EC) and intracellular (IC) region are shown as dotted lines; thetype of secondary structure element for the different representative GPCRs areshown in the grey panels. The loop regions lacking an a-helix or a b-sheet inany of the structures are not shown. See Fig. 1 for receptor colour code.b, Extracellular region that occludes or exposes the ligand-binding pocket asseen from the extracellular side (top view).
REVIEW RESEARCH
1 4 F E B R U A R Y 2 0 1 3 | V O L 4 9 4 | N A T U R E | 1 8 7
Macmillan Publishers Limited. All rights reserved©2013
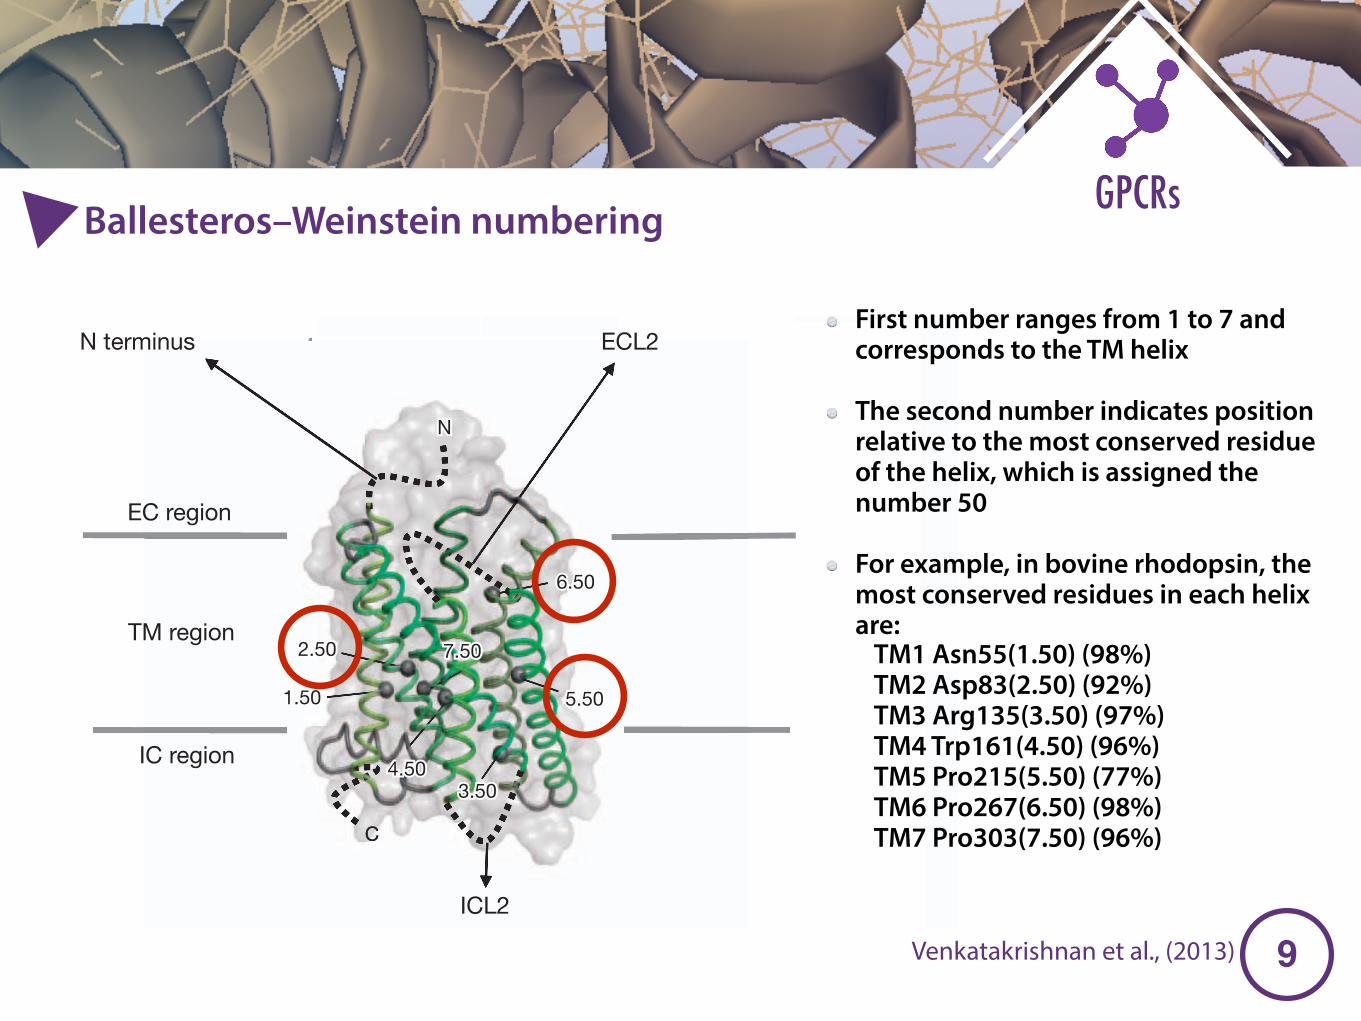
Ballesteros–Weinstein numbering
First number ranges from 1 to 7 and corresponds to the TM helix
The second number indicates position relative to the most conserved residue of the helix, which is assigned the number 50
For example, in bovine rhodopsin, the most conserved residues in each helix are:
TM1 Asn55(1.50) (98%) TM2 Asp83(2.50) (92%) TM3 Arg135(3.50) (97%) TM4 Trp161(4.50) (96%) TM5 Pro215(5.50) (77%) TM6 Pro267(6.50) (98%) TM7 Pro303(7.50) (96%)
�10
GPCRsTypes of GPCR
NATURE REVIEWS | DRUG DISCOVERY VOLUME 3 | JULY 2004 | 581
T W E N T Y Q U E S T I O N S
different types of mammalian cell has been useful.Using these preparations, a great number of pharmaco-logically useful probes have been created (includingtheir radiolabelled counterparts when necessary), whichhas allowed the determination of receptor distribution,their principal functions and agonist versus antagonistactivity. Expression in cells of both human GPCRs andtheir corresponding rodent proteins is an importantstep towards a rapid physiopharmacological, and puta-tively clinical, study of the target. At this time, there are
Bernard P. Roques. GPCR gene knockouts haveallowed, in many cases, the determination of the maineffects resulting from the TONIC or PHASIC stimulationof the target. A typical example is the knockout of theµ-opioid receptor14, which demonstrated definitivelythe major role of this receptor in analgesia and opioidaddiction, and the putative clinical interest of selectiveδ-opioid receptor stimulation15–17.
In addition, the development of HTS methods byexpressing GPCRs (including orphan receptors) in
Box 1 | G-protein-coupled-receptor families
G-protein-coupled receptors (GPCRs) are the largestfamily of cell-surface receptors, and transduce the signalsmediated by a diverse range of signalling molecules,including ions, biogenic amines, peptides and lipids, as wellas photons, to mediate alterations of intracellular function.GPCRs can be divided into different families on the basisof their structural and genetic characteristics (see GPCRDatabase online). GPCRs in the different families do notshare significant sequence similarity, although they all havethe characteristic seven transmembrane (TM) domains.The figure shows schematic representations of receptormonomers (GPCRs have been shown to exist as dimers oroligomers), and illustrates some key structural aspects ofthe three main GPCR families known at present. Family 1(panel a; also referred to as family A or the rhodopsin-likefamily) is by far the largest subgroup and containsreceptors for odorants, important neurotransmitters, suchas dopamine and serotonin, as well as neuropeptides andglycoprotein hormones. Receptors of family 1 arecharacterized by several highly conserved amino acids(some of which are indicated in the diagram by red circles)and a disulphide bridge that connects the first and secondextracellular loops (ECLs). Most of these receptors alsohave a PALMITOYLATED cysteine in the carboxy-terminal tail,which serves as an anchor to the membrane (orange zig-zag). The recent determination of the crystal structure ofrhodopsin59 has indicated that the transmembranedomains of family 1 receptors are ‘tilted’ and ‘kinked’ asshown, due to the presence of amino acids such as prolinethat distort the helical transmembrane domain. Family 2 orfamily B GPCRs (panel b) are characterized by a relativelylong amino terminus, which contains several cysteines thatform a network of disulphide bridges. Their morphology issimilar to some family 1 receptors, but the palmitoylationsite is missing and the conserved residues and motifs aredifferent from the conserved residues in the family 1receptors. Little is known about the orientation of the TMdomains, but given the divergence in amino-acid sequence,they are likely to be different from family 1 receptors.Ligands for family 2 GPCRs include hormones, such asglucagon, secretin and parathyroid hormone. Family 3(panel c) contains the metabotropic glutamate, the Ca2+-sensing and the GABAB (γ-aminobutyric acid, type B)receptors. These receptors are characterized by a long amino terminus and carboxyl tail. The ligand-bindingdomain (shown in yellow) is located in the amino terminus, which has been shown by the crystal structure of themetabotropic glutamate receptor to form a disulphide-linked dimer103. It is thought to resemble a Venus fly trap,which can open and close with the agonist bound inside. Except for two cysteines in ECL1 and ECL2 that form aputative disulphide bridge, the family 3 receptors do not have any of the features that characterize family 1 and 2receptors. A unique characteristic of these receptors is that the third intracellular loop is short and highlyconserved. At present, little is known about the orientation of the TM domains. Box adapted with permission fromREF. 40 © 2002 Macmillan Magazines Limited. Susan R. George
b Family 2NH2
1 23
45
67
COOH
C
C
C
C CC
C C
C
P
K
5
6
4
2
c Family 3
NH2
13
COOH
NEA
C
7
C
P
W
COOH
a Family 1
P
NH2
CC
DPN
DR Y
C
7
6 5
1
23
4
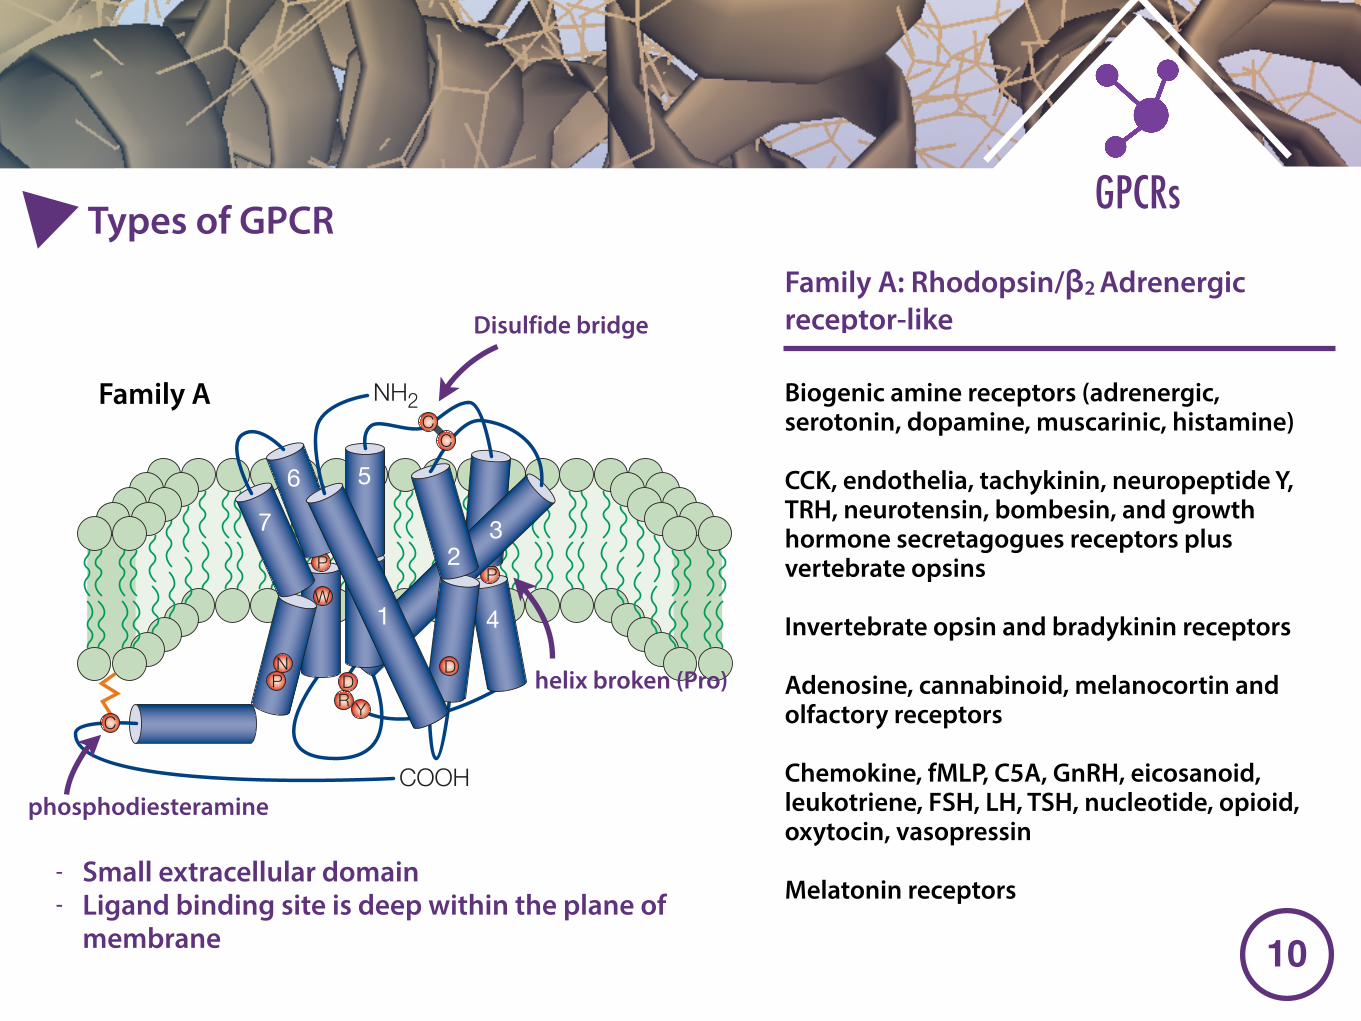
Family A Biogenic amine receptors (adrenergic, serotonin, dopamine, muscarinic, histamine)
CCK, endothelia, tachykinin, neuropeptide Y, TRH, neurotensin, bombesin, and growth hormone secretagogues receptors plus vertebrate opsins
Invertebrate opsin and bradykinin receptors
Adenosine, cannabinoid, melanocortin and olfactory receptors
Chemokine, fMLP, C5A, GnRH, eicosanoid, leukotriene, FSH, LH, TSH, nucleotide, opioid, oxytocin, vasopressin
Melatonin receptors
Disulfide bridge
phosphodiesteramine
helix broken (Pro)
- Small extracellular domain - Ligand binding site is deep within the plane of
membrane
Family A: Rhodopsin/β2 Adrenergic receptor-like
�11
GPCRsTypes of GPCR
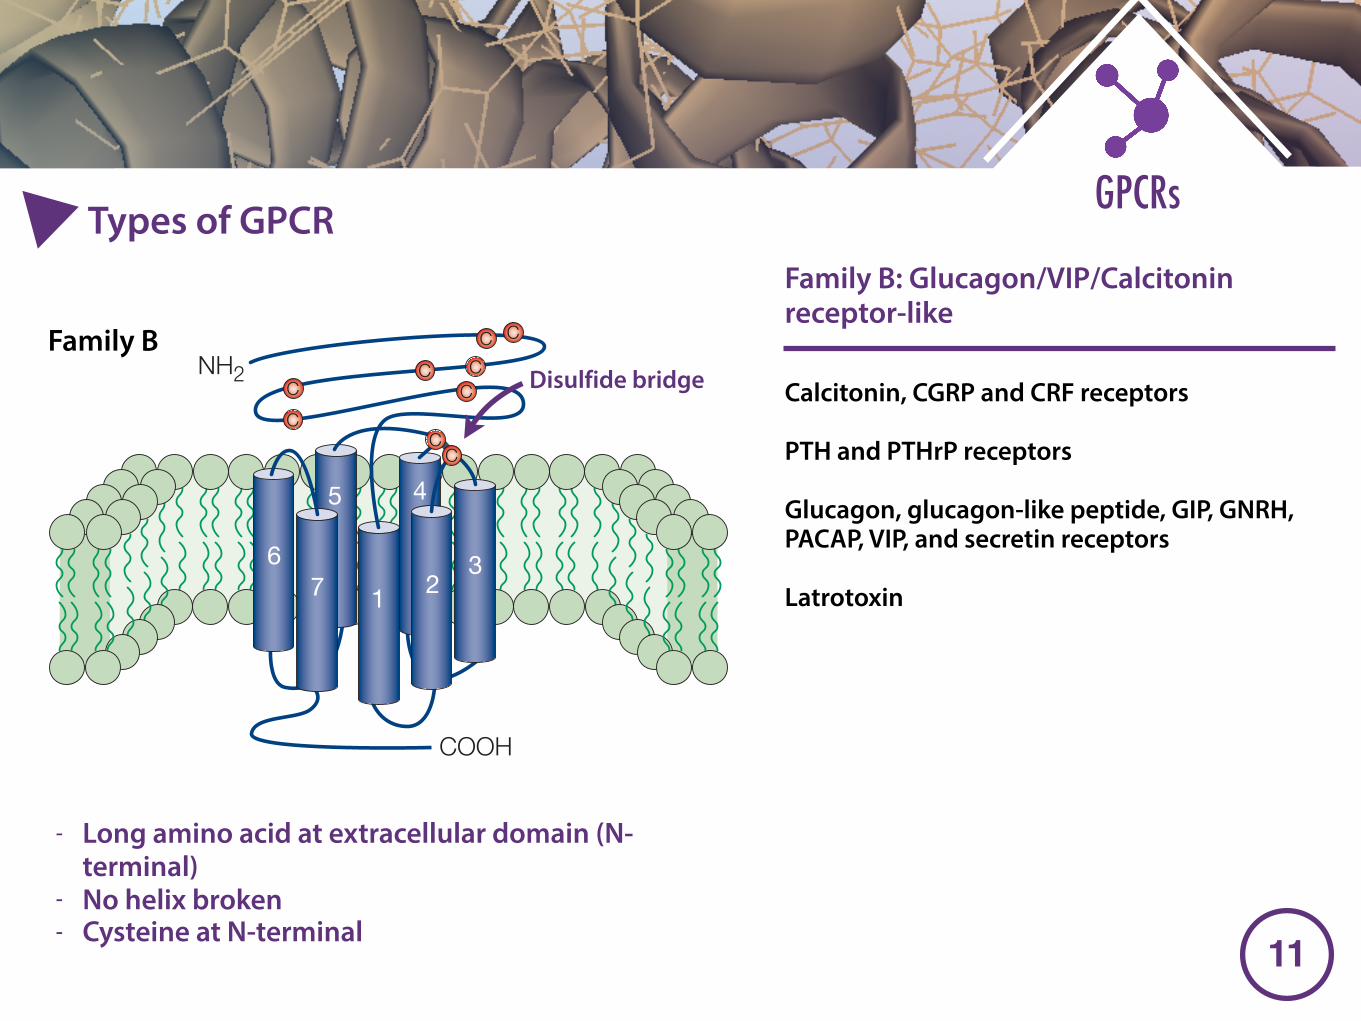
Calcitonin, CGRP and CRF receptors
PTH and PTHrP receptors
Glucagon, glucagon-like peptide, GIP, GNRH, PACAP, VIP, and secretin receptors
Latrotoxin
- Long amino acid at extracellular domain (N-terminal)
- No helix broken - Cysteine at N-terminal
Family B: Glucagon/VIP/Calcitonin receptor-like
NATURE REVIEWS | DRUG DISCOVERY VOLUME 3 | JULY 2004 | 581
T W E N T Y Q U E S T I O N S
different types of mammalian cell has been useful.Using these preparations, a great number of pharmaco-logically useful probes have been created (includingtheir radiolabelled counterparts when necessary), whichhas allowed the determination of receptor distribution,their principal functions and agonist versus antagonistactivity. Expression in cells of both human GPCRs andtheir corresponding rodent proteins is an importantstep towards a rapid physiopharmacological, and puta-tively clinical, study of the target. At this time, there are
Bernard P. Roques. GPCR gene knockouts haveallowed, in many cases, the determination of the maineffects resulting from the TONIC or PHASIC stimulationof the target. A typical example is the knockout of theµ-opioid receptor14, which demonstrated definitivelythe major role of this receptor in analgesia and opioidaddiction, and the putative clinical interest of selectiveδ-opioid receptor stimulation15–17.
In addition, the development of HTS methods byexpressing GPCRs (including orphan receptors) in
Box 1 | G-protein-coupled-receptor families
G-protein-coupled receptors (GPCRs) are the largestfamily of cell-surface receptors, and transduce the signalsmediated by a diverse range of signalling molecules,including ions, biogenic amines, peptides and lipids, as wellas photons, to mediate alterations of intracellular function.GPCRs can be divided into different families on the basisof their structural and genetic characteristics (see GPCRDatabase online). GPCRs in the different families do notshare significant sequence similarity, although they all havethe characteristic seven transmembrane (TM) domains.The figure shows schematic representations of receptormonomers (GPCRs have been shown to exist as dimers oroligomers), and illustrates some key structural aspects ofthe three main GPCR families known at present. Family 1(panel a; also referred to as family A or the rhodopsin-likefamily) is by far the largest subgroup and containsreceptors for odorants, important neurotransmitters, suchas dopamine and serotonin, as well as neuropeptides andglycoprotein hormones. Receptors of family 1 arecharacterized by several highly conserved amino acids(some of which are indicated in the diagram by red circles)and a disulphide bridge that connects the first and secondextracellular loops (ECLs). Most of these receptors alsohave a PALMITOYLATED cysteine in the carboxy-terminal tail,which serves as an anchor to the membrane (orange zig-zag). The recent determination of the crystal structure ofrhodopsin59 has indicated that the transmembranedomains of family 1 receptors are ‘tilted’ and ‘kinked’ asshown, due to the presence of amino acids such as prolinethat distort the helical transmembrane domain. Family 2 orfamily B GPCRs (panel b) are characterized by a relativelylong amino terminus, which contains several cysteines thatform a network of disulphide bridges. Their morphology issimilar to some family 1 receptors, but the palmitoylationsite is missing and the conserved residues and motifs aredifferent from the conserved residues in the family 1receptors. Little is known about the orientation of the TMdomains, but given the divergence in amino-acid sequence,they are likely to be different from family 1 receptors.Ligands for family 2 GPCRs include hormones, such asglucagon, secretin and parathyroid hormone. Family 3(panel c) contains the metabotropic glutamate, the Ca2+-sensing and the GABAB (γ-aminobutyric acid, type B)receptors. These receptors are characterized by a long amino terminus and carboxyl tail. The ligand-bindingdomain (shown in yellow) is located in the amino terminus, which has been shown by the crystal structure of themetabotropic glutamate receptor to form a disulphide-linked dimer103. It is thought to resemble a Venus fly trap,which can open and close with the agonist bound inside. Except for two cysteines in ECL1 and ECL2 that form aputative disulphide bridge, the family 3 receptors do not have any of the features that characterize family 1 and 2receptors. A unique characteristic of these receptors is that the third intracellular loop is short and highlyconserved. At present, little is known about the orientation of the TM domains. Box adapted with permission fromREF. 40 © 2002 Macmillan Magazines Limited. Susan R. George
b Family 2NH2
1 23
45
67
COOH
C
C
C
C CC
C C
C
P
K
5
6
4
2
c Family 3
NH2
13
COOH
NEA
C
7
C
P
W
COOH
a Family 1
P
NH2
CC
DPN
DR Y
C
7
6 5
1
23
4
Family BDisulfide bridge
�12
GPCRsTypes of GPCR
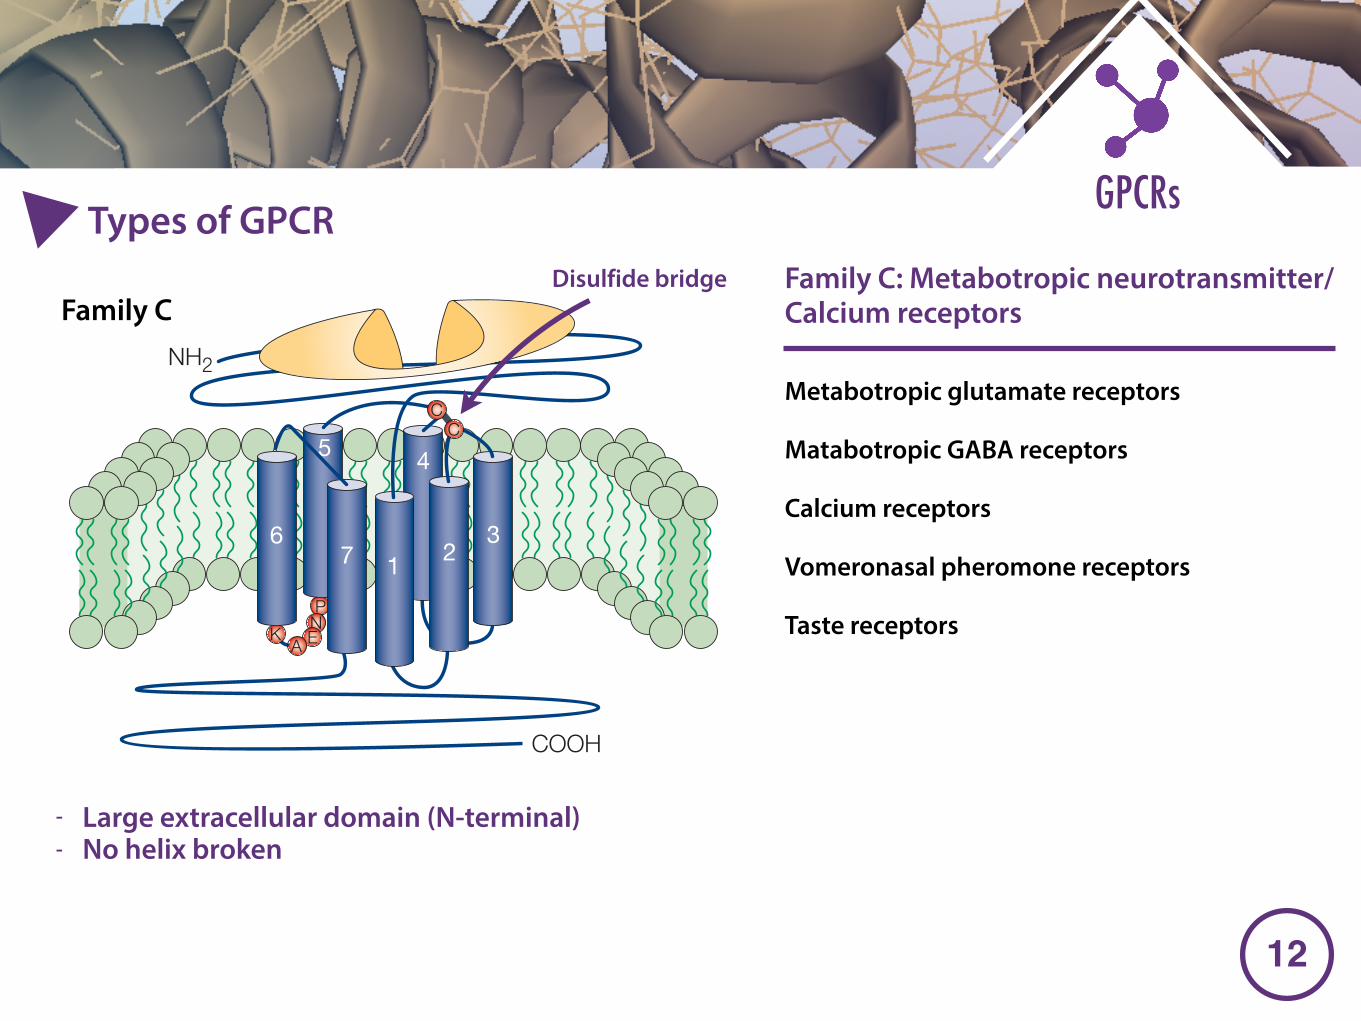
Metabotropic glutamate receptors
Matabotropic GABA receptors
Calcium receptors
Vomeronasal pheromone receptors
Taste receptors
- Large extracellular domain (N-terminal) - No helix broken
Family C: Metabotropic neurotransmitter/Calcium receptors
NATURE REVIEWS | DRUG DISCOVERY VOLUME 3 | JULY 2004 | 581
T W E N T Y Q U E S T I O N S
different types of mammalian cell has been useful.Using these preparations, a great number of pharmaco-logically useful probes have been created (includingtheir radiolabelled counterparts when necessary), whichhas allowed the determination of receptor distribution,their principal functions and agonist versus antagonistactivity. Expression in cells of both human GPCRs andtheir corresponding rodent proteins is an importantstep towards a rapid physiopharmacological, and puta-tively clinical, study of the target. At this time, there are
Bernard P. Roques. GPCR gene knockouts haveallowed, in many cases, the determination of the maineffects resulting from the TONIC or PHASIC stimulationof the target. A typical example is the knockout of theµ-opioid receptor14, which demonstrated definitivelythe major role of this receptor in analgesia and opioidaddiction, and the putative clinical interest of selectiveδ-opioid receptor stimulation15–17.
In addition, the development of HTS methods byexpressing GPCRs (including orphan receptors) in
Box 1 | G-protein-coupled-receptor families
G-protein-coupled receptors (GPCRs) are the largestfamily of cell-surface receptors, and transduce the signalsmediated by a diverse range of signalling molecules,including ions, biogenic amines, peptides and lipids, as wellas photons, to mediate alterations of intracellular function.GPCRs can be divided into different families on the basisof their structural and genetic characteristics (see GPCRDatabase online). GPCRs in the different families do notshare significant sequence similarity, although they all havethe characteristic seven transmembrane (TM) domains.The figure shows schematic representations of receptormonomers (GPCRs have been shown to exist as dimers oroligomers), and illustrates some key structural aspects ofthe three main GPCR families known at present. Family 1(panel a; also referred to as family A or the rhodopsin-likefamily) is by far the largest subgroup and containsreceptors for odorants, important neurotransmitters, suchas dopamine and serotonin, as well as neuropeptides andglycoprotein hormones. Receptors of family 1 arecharacterized by several highly conserved amino acids(some of which are indicated in the diagram by red circles)and a disulphide bridge that connects the first and secondextracellular loops (ECLs). Most of these receptors alsohave a PALMITOYLATED cysteine in the carboxy-terminal tail,which serves as an anchor to the membrane (orange zig-zag). The recent determination of the crystal structure ofrhodopsin59 has indicated that the transmembranedomains of family 1 receptors are ‘tilted’ and ‘kinked’ asshown, due to the presence of amino acids such as prolinethat distort the helical transmembrane domain. Family 2 orfamily B GPCRs (panel b) are characterized by a relativelylong amino terminus, which contains several cysteines thatform a network of disulphide bridges. Their morphology issimilar to some family 1 receptors, but the palmitoylationsite is missing and the conserved residues and motifs aredifferent from the conserved residues in the family 1receptors. Little is known about the orientation of the TMdomains, but given the divergence in amino-acid sequence,they are likely to be different from family 1 receptors.Ligands for family 2 GPCRs include hormones, such asglucagon, secretin and parathyroid hormone. Family 3(panel c) contains the metabotropic glutamate, the Ca2+-sensing and the GABAB (γ-aminobutyric acid, type B)receptors. These receptors are characterized by a long amino terminus and carboxyl tail. The ligand-bindingdomain (shown in yellow) is located in the amino terminus, which has been shown by the crystal structure of themetabotropic glutamate receptor to form a disulphide-linked dimer103. It is thought to resemble a Venus fly trap,which can open and close with the agonist bound inside. Except for two cysteines in ECL1 and ECL2 that form aputative disulphide bridge, the family 3 receptors do not have any of the features that characterize family 1 and 2receptors. A unique characteristic of these receptors is that the third intracellular loop is short and highlyconserved. At present, little is known about the orientation of the TM domains. Box adapted with permission fromREF. 40 © 2002 Macmillan Magazines Limited. Susan R. George
b Family 2NH2
1 23
45
67
COOH
C
C
C
C CC
C C
C
P
K
5
6
4
2
c Family 3
NH2
13
COOH
NEA
C
7
C
P
W
COOH
a Family 1
P
NH2
CC
DPN
DR Y
C
7
6 5
1
23
4
Family CDisulfide bridge
NATURE REVIEWS | DRUG DISCOVERY VOLUME 3 | JULY 2004 | 593
T W E N T Y Q U E S T I O N S
Tamas Bartfai. Both inside and outside the pharmaceu-tical industry, the rhodopsin model has been combinedwith what we know about PHARMACOPHORES — which is aknowledge-rich area for several monoamine receptors— to cobble together models. However, such modelshave often been of post factum value; explaining ratherthan predicting results.
Joël Bockaert. The predictions have generally been‘correct’, but the rhodopsin crystal was obtained in thepresence of retinal, which is an inverse agonist. So far, thestructure of an ‘active’ rhodopsin molecule is still lacking.
Arthur Christopoulos. The determination of thecrystal structure of bovine rhodopsin at high resolution59
has certainly been a boon to the GPCR field. One mustbear in mind, however, that rhodopsin has low sequencesimilarity to most other GPCRs, has an inverse agonistincorporated into its structure, and the crystals obtainedwere of the receptor in its inactive state, so we should notnecessarily expect to find high degrees of concordancebetween this structure and other GPCRs. Nevertheless, agood starting point is better than none, and there havebeen very successful predictions for the structures ofsome of the receptors for bioamines and related smallmolecules based on the rhodopsin model; for example,muscarinic M1, dopamine D2, α1-adrenoceptor, hista-mine H3 and adenosine A1 receptors4,63,64. Of course, thisonly refers to the transmembrane domains of the GPCRs;we are still some way off determining the intra- andextracellular loop structures.
Jean-Philippe Pin. The structural predictions havebeen good enough for the general analysis of homo-logous protein structures, even for distantly relatedGPCRs, such as the heptahelical domain of class III(family 3/C) GPCRs, which include metabotropic glutamate, GABAB (γ-amino butyric acid, type B), Ca2+
and some taste and pheromone receptors (see, forexample, REF. 65). However, one should take into con-sideration that the rhodopsin structure corresponds toa fully inactive state of a GPCR (stabilized by an inverseagonist), such that the various active states cannot yetbe predicted with accuracy. Accordingly, such modelsare more useful for the characterization of the bindingsites of inverse agonists. I am still not convinced thatsuch models are accurate enough for a detailed analysisof ligand-binding sites and drug design. Recently,Didier Rognan and collaborators have used such arhodopsin-based model of the vasopressin V2 receptorfor in silico screening of possible new agonists andantagonists66. This approach allowed them to identifyknown agonists and antagonists hidden in the chemicaldatabase, which suggests that it is a promising technique.However, whether new leads can be identified in thisway remains to be shown.
Bernard P. Roques. Few breakthroughs in the field ofGPCR structural determination have emerged from mol-ecular modelling using the rhodopsin structure, exceptsome data about the intra-cytoplasmic loops involved in
Gα
N
C
CPlasma membrane GPCR
β γ
A N
GPCR
Gα Gα
Gα
Gα
Gα
βγ
βγ
GDP
βγ
GTP
GTP
GDP
GTP
GDP
Effector
Pi
βγ
a
b
c
d
e
GPCR
B Agonist
Agonist
Figure 3 | GPCR–Gαα fusion proteins as a model system for the analysis of receptor–G-protein coupling. A | Schematic of a G-protein-coupled receptor (GPCR)–Gα fusion protein.The GPCR carboxyl terminus (C) is fused to the amino terminus (N) of Gα22, ensuring closeproximity and defined stoichiometry of the two coupling partners. GPCRs can activate G proteinslinearly (that is, one GPCR molecule activates one G protein) rather than catalytically (that is, oneGPCR molecule activates several G proteins), which substantiates the relevance of the fusionprotein technique26,85. Fusion proteins also enable the study of coupling between GPCR speciesisoforms58 or intra-species polymorphic forms185 and a particular Gα isoform. Correspondingly,the coupling of a particular receptor to various Gα isoforms can also be analysed26,85. Crosstalkbetween fusion proteins to non-fused Gα and between different fusion protein molecules199,200
must be taken into consideration. B | G-protein cycling. Rate-limiting receptor-promoted GDPdissociation (a) is followed by ternary complex formation (b). The GPCR then catalyses the bindingof GTP to Gα (c), which disrupts the ternary complex, causing dissociation of the G-proteinheterotrimer into Gα and βγ. Both entities regulate the activity of effector systems (d; see alsoTABLES 1, 2 and 3). G-protein activation is terminated by hydrolysis of the Gα-bound GTP to GDPand Pi (e). GPCR–Gα fusions are useful for studying steps b, c, d and e of the G-protein cycle(to our knowledge, GDP dissociation (a) has not been directly studied with this system). Figure prepared by Roland Seifert.
GPCRsGPCR activation and inactivation
G protein
�13EllisClare (2004)
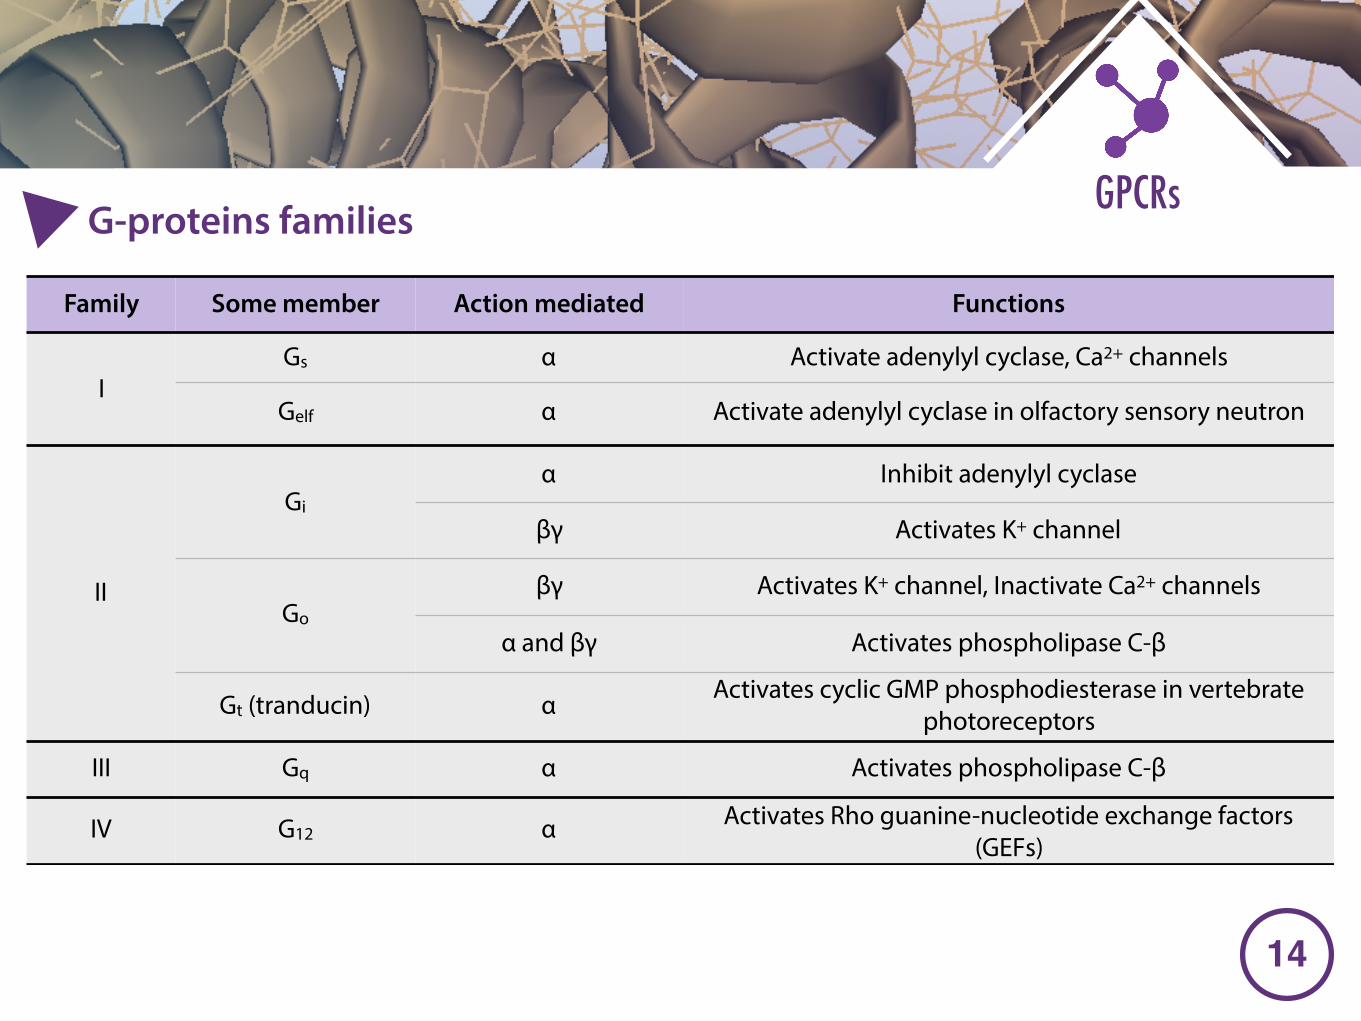
�14
GPCRsG-proteins families
Family Some member Action mediated Functions
IGs α Activate adenylyl cyclase, Ca2+ channels
Gelf α Activate adenylyl cyclase in olfactory sensory neutron
II
Gi
α Inhibit adenylyl cyclase
βγ Activates K+ channel
Go
βγ Activates K+ channel, Inactivate Ca2+ channels
α and βγ Activates phospholipase C-β
Gt (tranducin) α Activates cyclic GMP phosphodiesterase in vertebrate photoreceptors
III Gq α Activates phospholipase C-β
IV G12 α Activates Rho guanine-nucleotide exchange factors (GEFs)
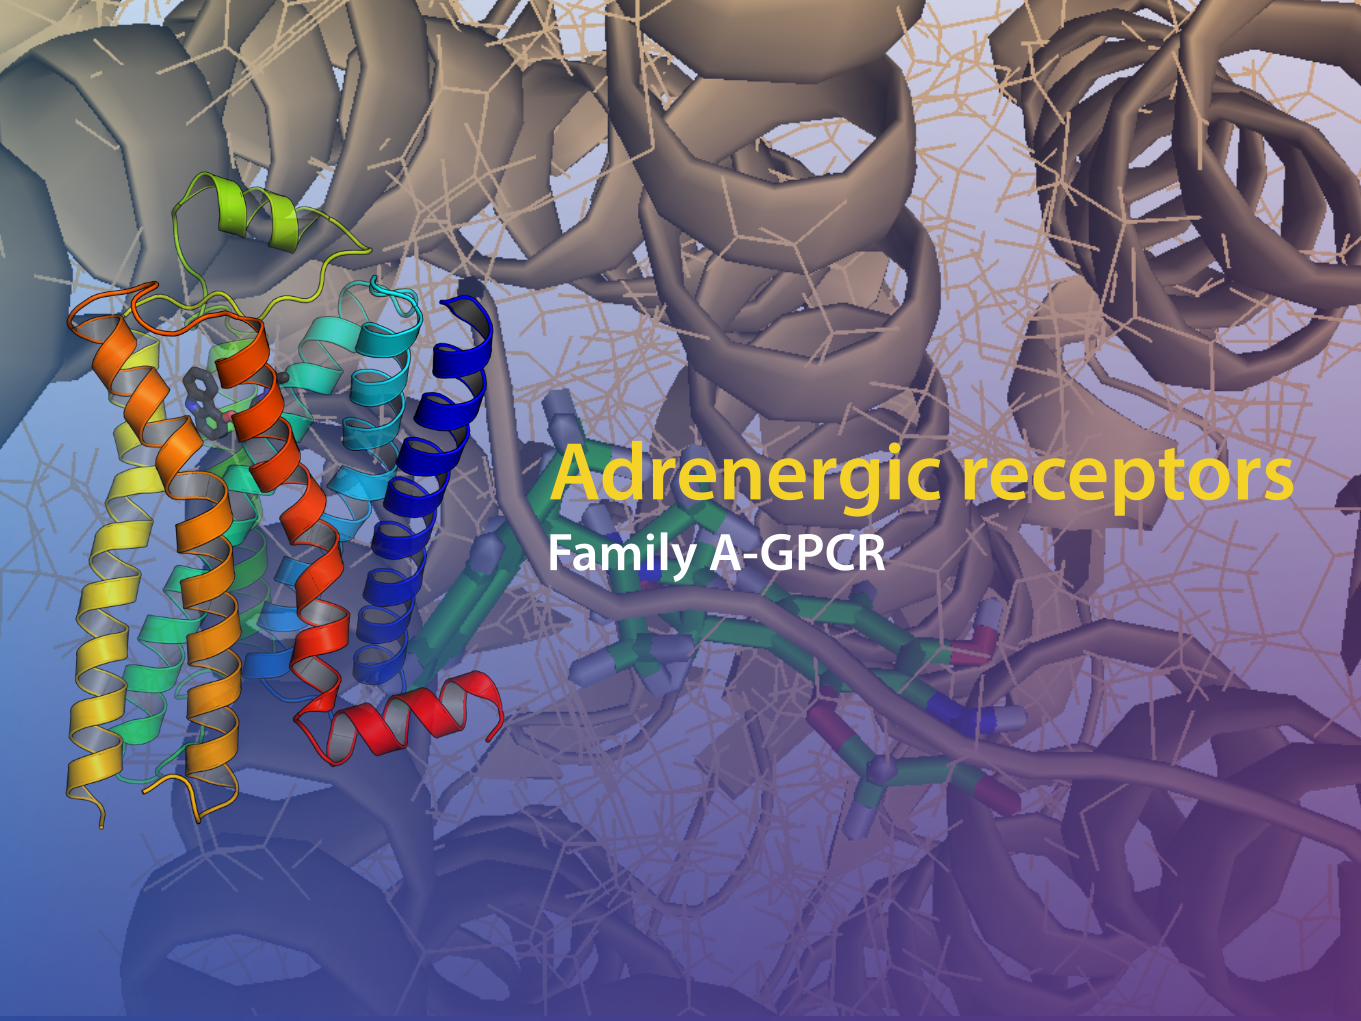
Adrenergic receptorsFamily A-GPCR
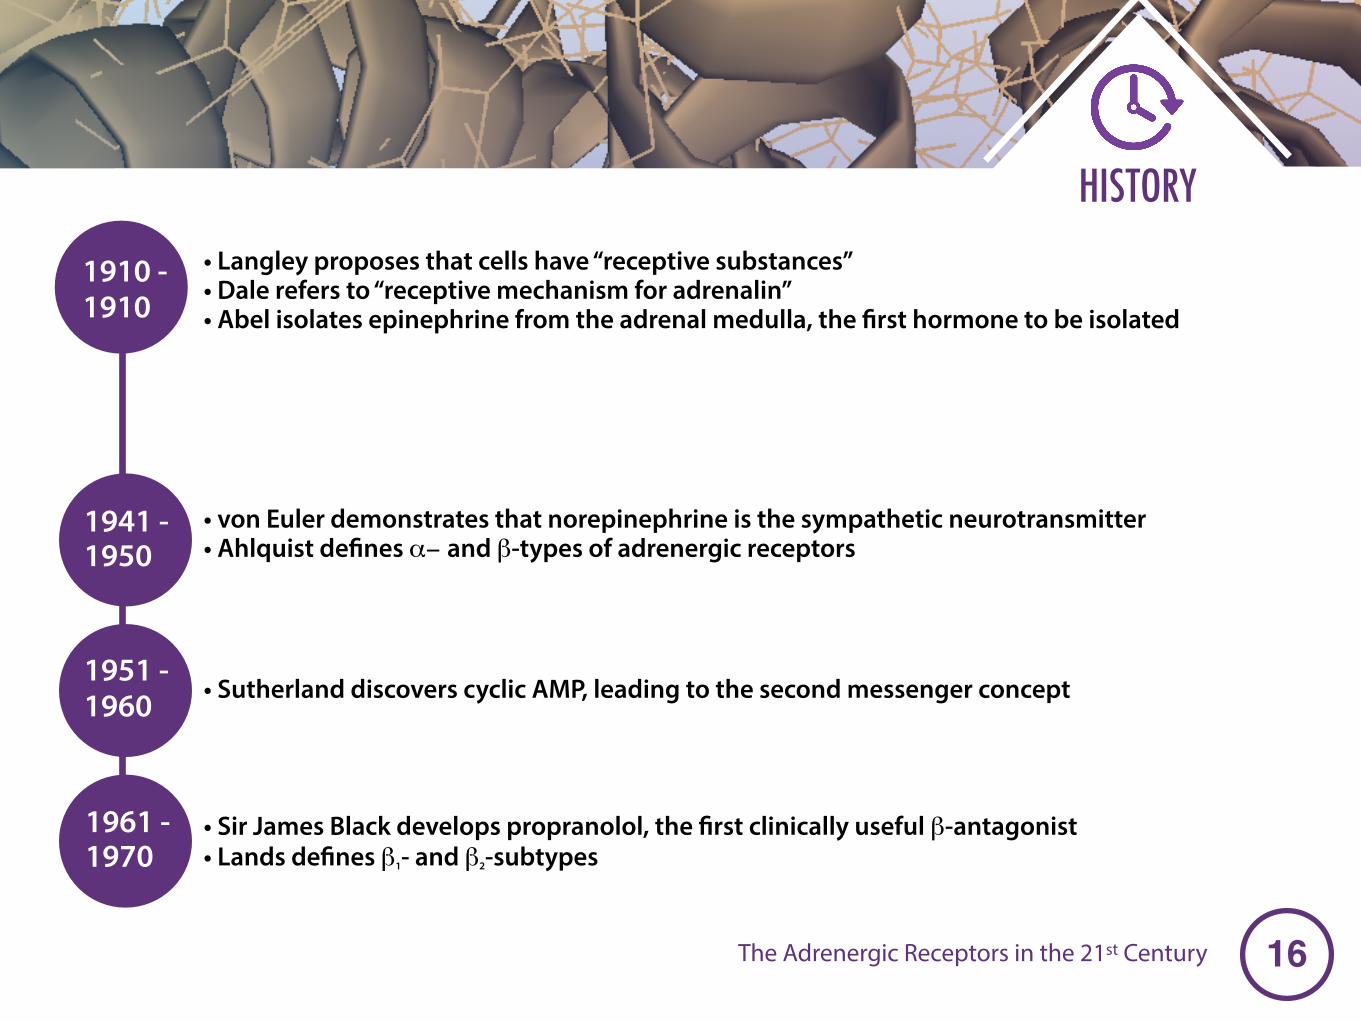
�16
HISTORY
1910 - 1910
• Langley proposes that cells have “receptive substances”• Dale refers to “receptive mechanism for adrenalin”• Abel isolates epinephrine from the adrenal medulla, the first hormone to be isolated
1941 - 1950
• von Euler demonstrates that norepinephrine is the sympathetic neurotransmitter • Ahlquist defines α− and β-types of adrenergic receptors
1951 - 1960 • Sutherland discovers cyclic AMP, leading to the second messenger concept
1961 - 1970
• Sir James Black develops propranolol, the first clinically useful β-antagonist • Lands defines β1- and β2-subtypes
The Adrenergic Receptors in the 21st Century
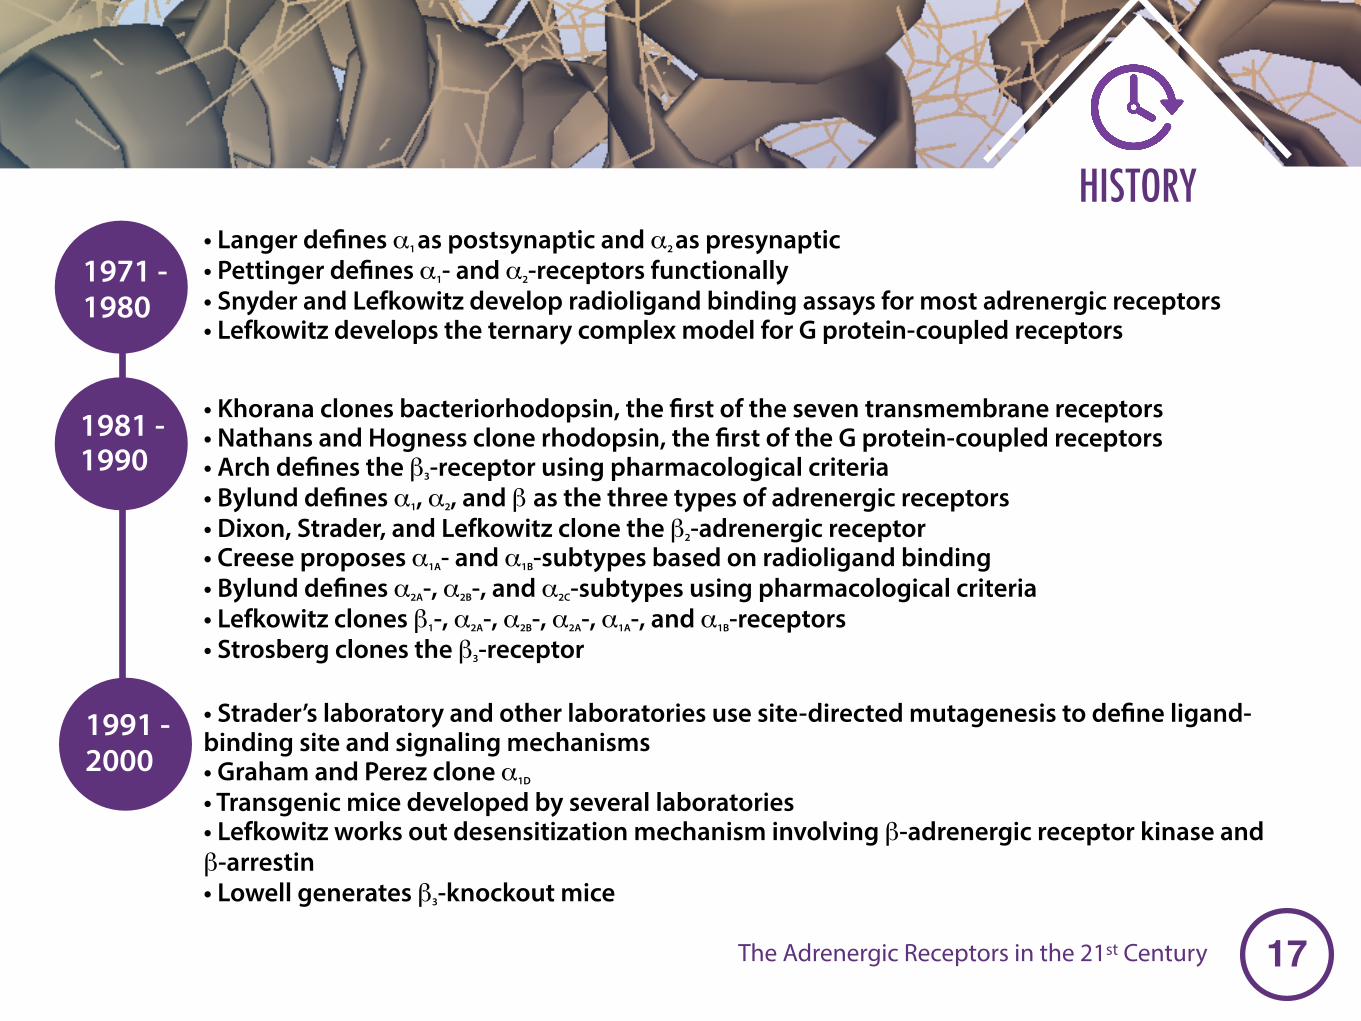
�17
HISTORY
1971 - 1980
• Langer defines α1 as postsynaptic and α2 as presynaptic• Pettinger defines α1- and α2-receptors functionally• Snyder and Lefkowitz develop radioligand binding assays for most adrenergic receptors• Lefkowitz develops the ternary complex model for G protein-coupled receptors
1981 - 1990
• Khorana clones bacteriorhodopsin, the first of the seven transmembrane receptors• Nathans and Hogness clone rhodopsin, the first of the G protein-coupled receptors• Arch defines the β3-receptor using pharmacological criteria• Bylund defines α1, α2, and β as the three types of adrenergic receptors• Dixon, Strader, and Lefkowitz clone the β2-adrenergic receptor• Creese proposes α1A- and α1B-subtypes based on radioligand binding• Bylund defines α2A-, α2B-, and α2C-subtypes using pharmacological criteria• Lefkowitz clones β1-, α2A-, α2B-, α2A-, α1A-, and α1B-receptors• Strosberg clones the β3-receptor
1991 - 2000
• Strader’s laboratory and other laboratories use site-directed mutagenesis to define ligand-binding site and signaling mechanisms• Graham and Perez clone α1D
• Transgenic mice developed by several laboratories• Lefkowitz works out desensitization mechanism involving β-adrenergic receptor kinase and β-arrestin• Lowell generates β3-knockout mice
The Adrenergic Receptors in the 21st Century
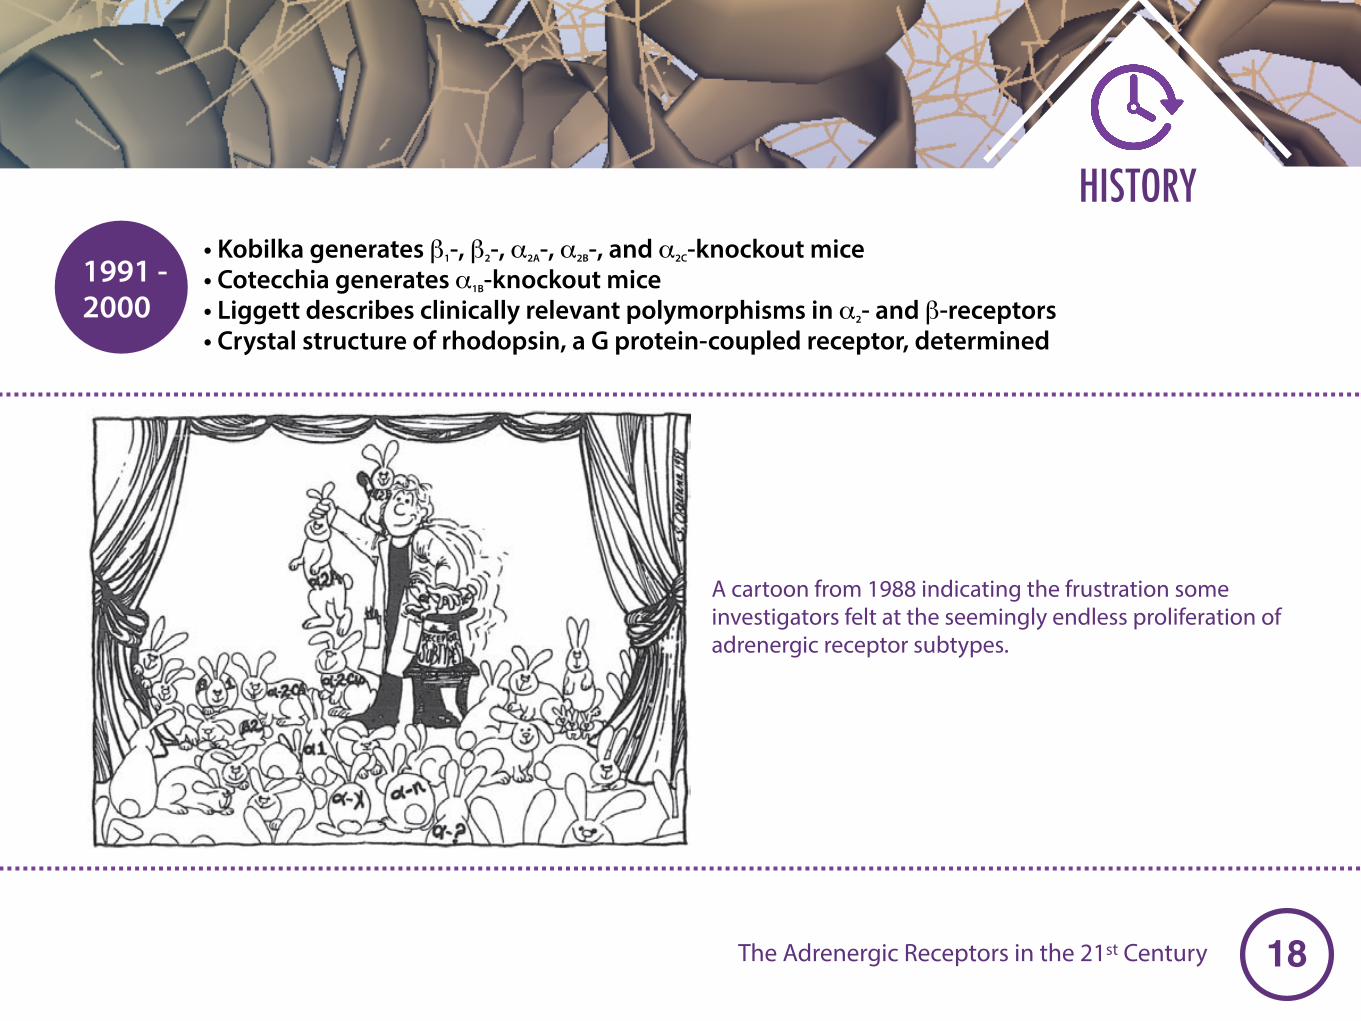
�18
HISTORY
1991 - 2000
• Kobilka generates β1-, β2-, α2A-, α2B-, and α2C-knockout mice• Cotecchia generates α1B-knockout mice• Liggett describes clinically relevant polymorphisms in α2- and β-receptors • Crystal structure of rhodopsin, a G protein-coupled receptor, determined
The Adrenergic Receptors in the 21st Century
10 Bylund
radioligand-binding studies showing that the two subtypes had differential sen-sitivities to the site-directed alkylating agent chloroethylclonidine (33).
The evidence for α2-receptor subtypes came from binding studies in varioustissues and cell lines (34). The α2A and α2B subtypes were initially defined basedon their differential affinities for adrenergic agents such as prazosin andoxymetazoline (35), and their existence was confirmed by functional studies(36). The third subtype, α2C, was identified originally in an opossum kidney cellline using radioligand-binding studies (37). A fourth pharmacological subtype,the α2D, was identified in the rat and cow (38,39). Subsequently, it was shown thatthis pharmacological subtype was a species orthologue of the human α2A sub-type, and thus it is not considered a separate genetic subtype.
During the second half of the 1980s, when new receptor subtypes were pro-posed regularly, there was considerable opposition to this seemingly endlessproliferation of subtypes. One reviewer chided the author on this point in thereview of one of his papers in 1987: “Shall we expect proposals for furtherequally trivial revisions each time a new ligand is found with very high selectiv-ity between receptors for which all previously known ligands had only modestselectivity?” Perhaps the mood at this time is accurately reflected in the cartoon(Fig. 1) from my 1988 review of α-adrenergic receptor classification (40). In thiscartoon, it should be noted that the investigator is trying to push the “subtypes”back into the hat, or at least prevent them from popping out, rather than happilypulling them out.
Fig. 1. A cartoon from 1988 indicating the frustration some investigators felt at theseemingly endless proliferation of adrenergic receptor subtypes. (From ref. 40; © 1988,with permission from Elsevier.)
A cartoon from 1988 indicating the frustration some investigators felt at the seemingly endless proliferation of adrenergic receptor subtypes.
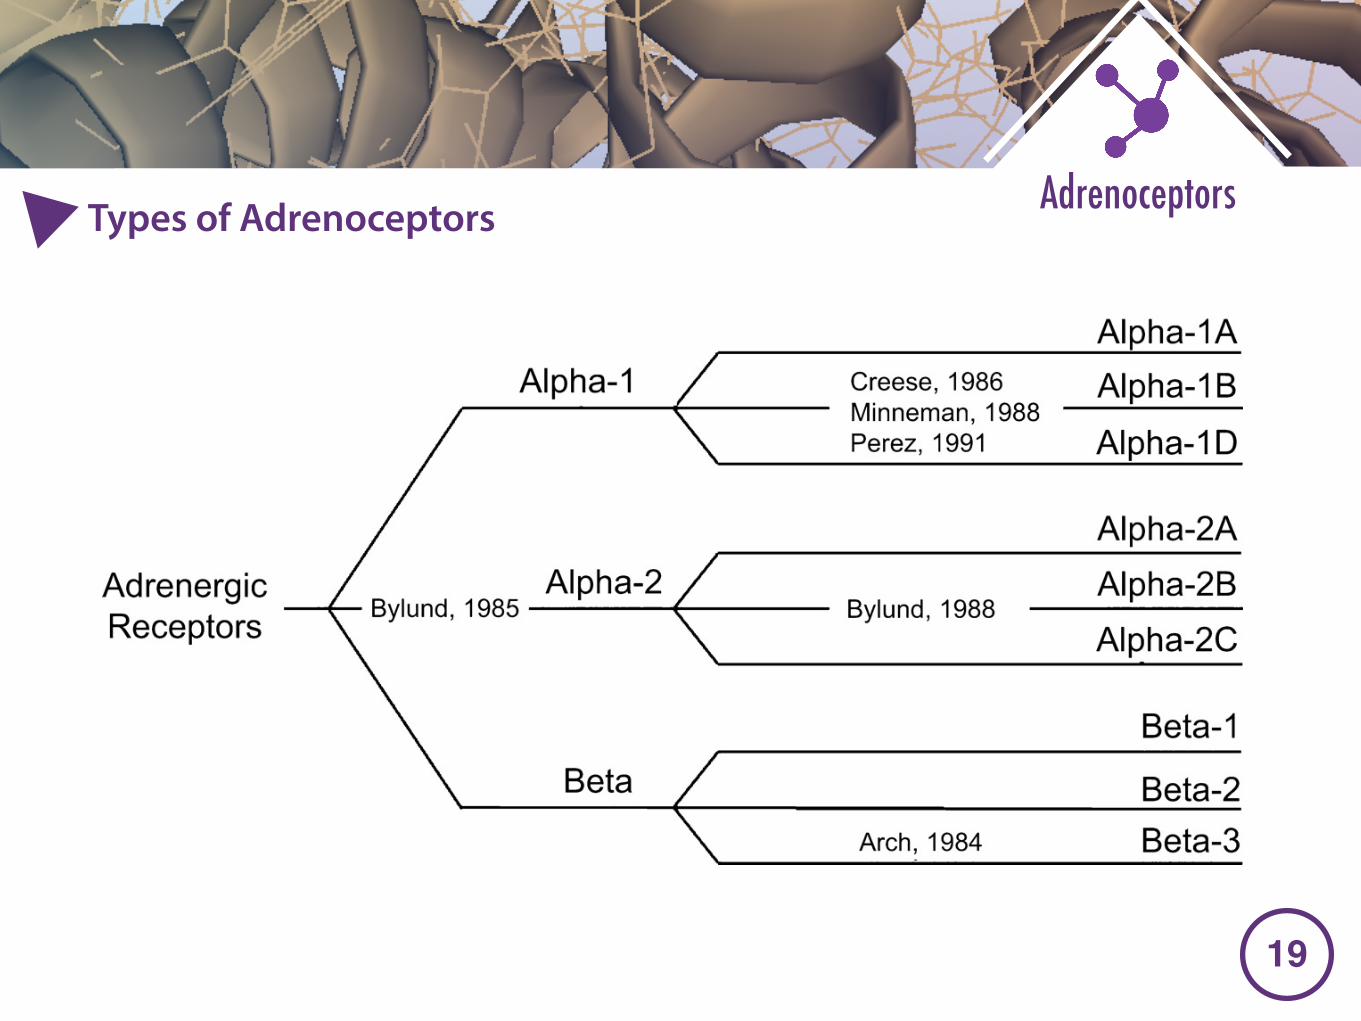
�19
AdrenoceptorsTypes of Adrenoceptors
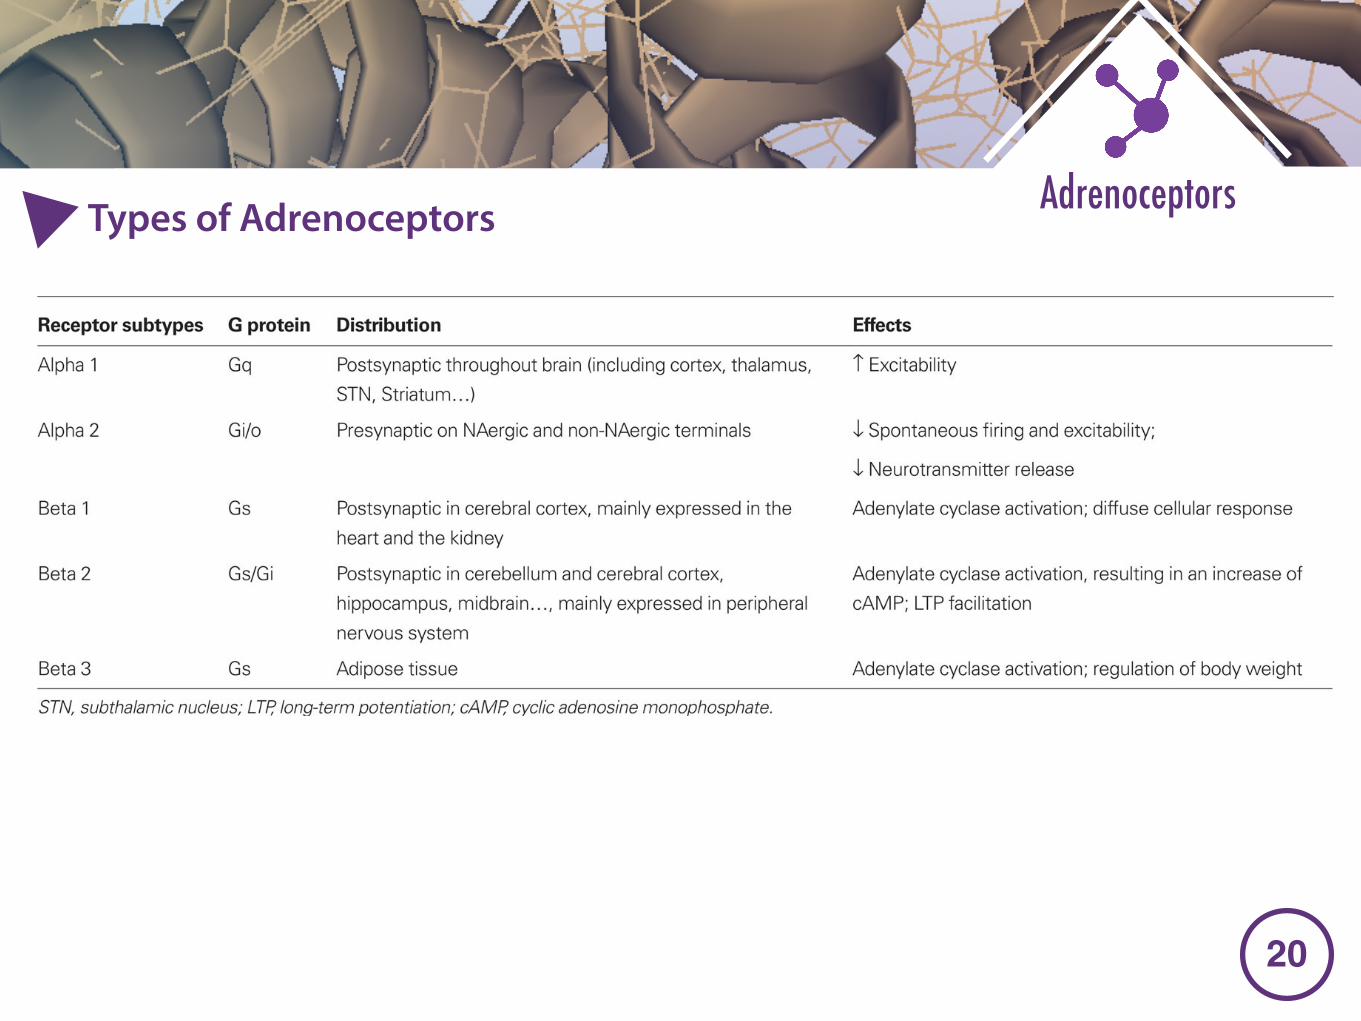
�20
AdrenoceptorsTypes of Adrenoceptors
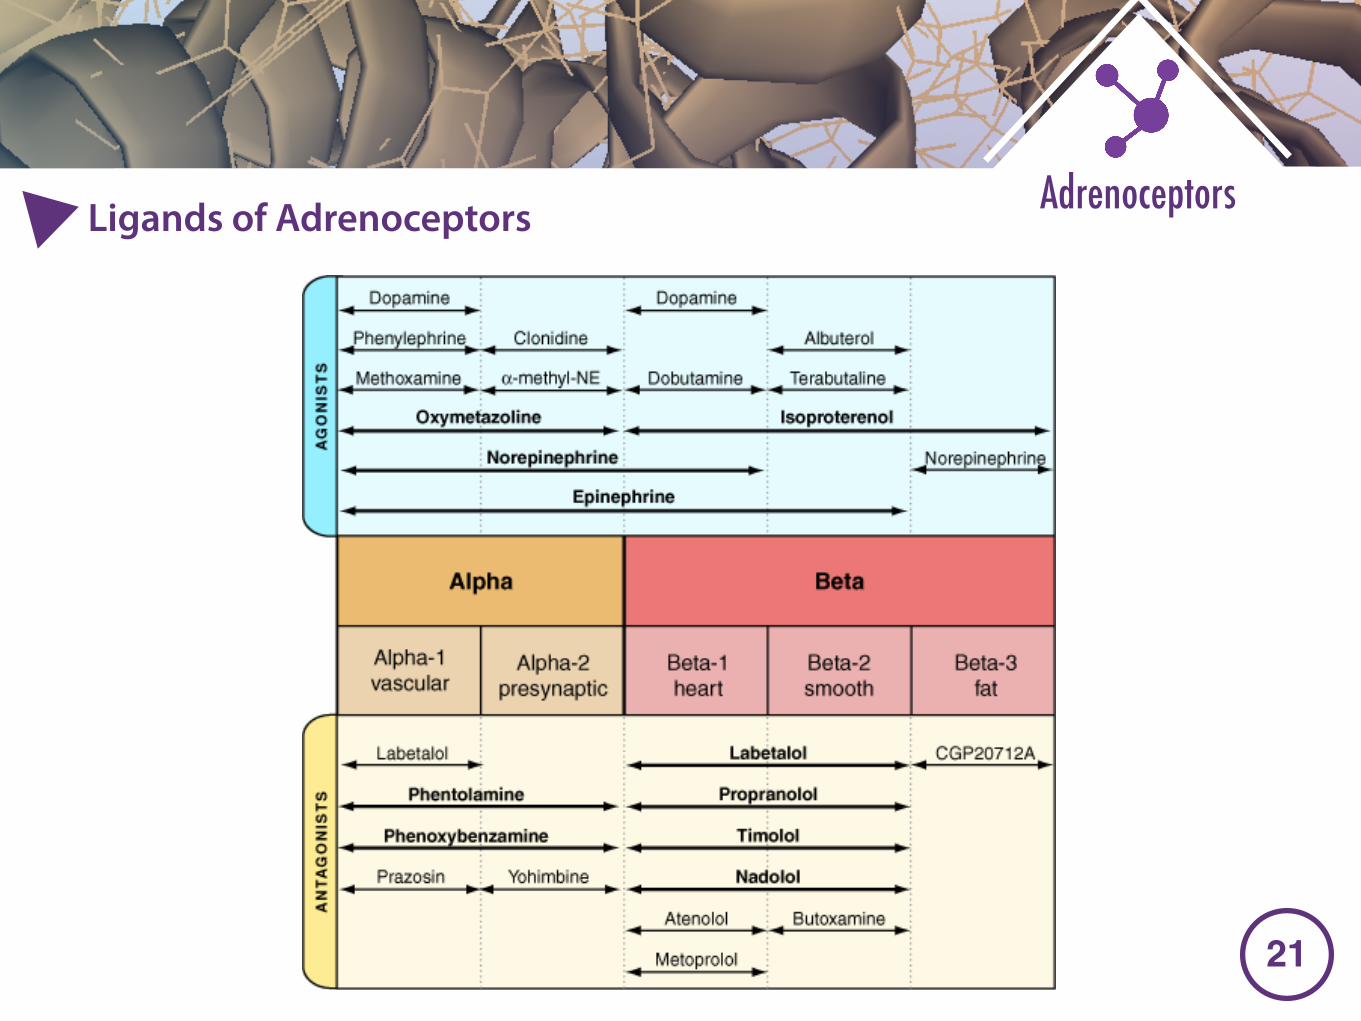
�21
AdrenoceptorsLigands of Adrenoceptors
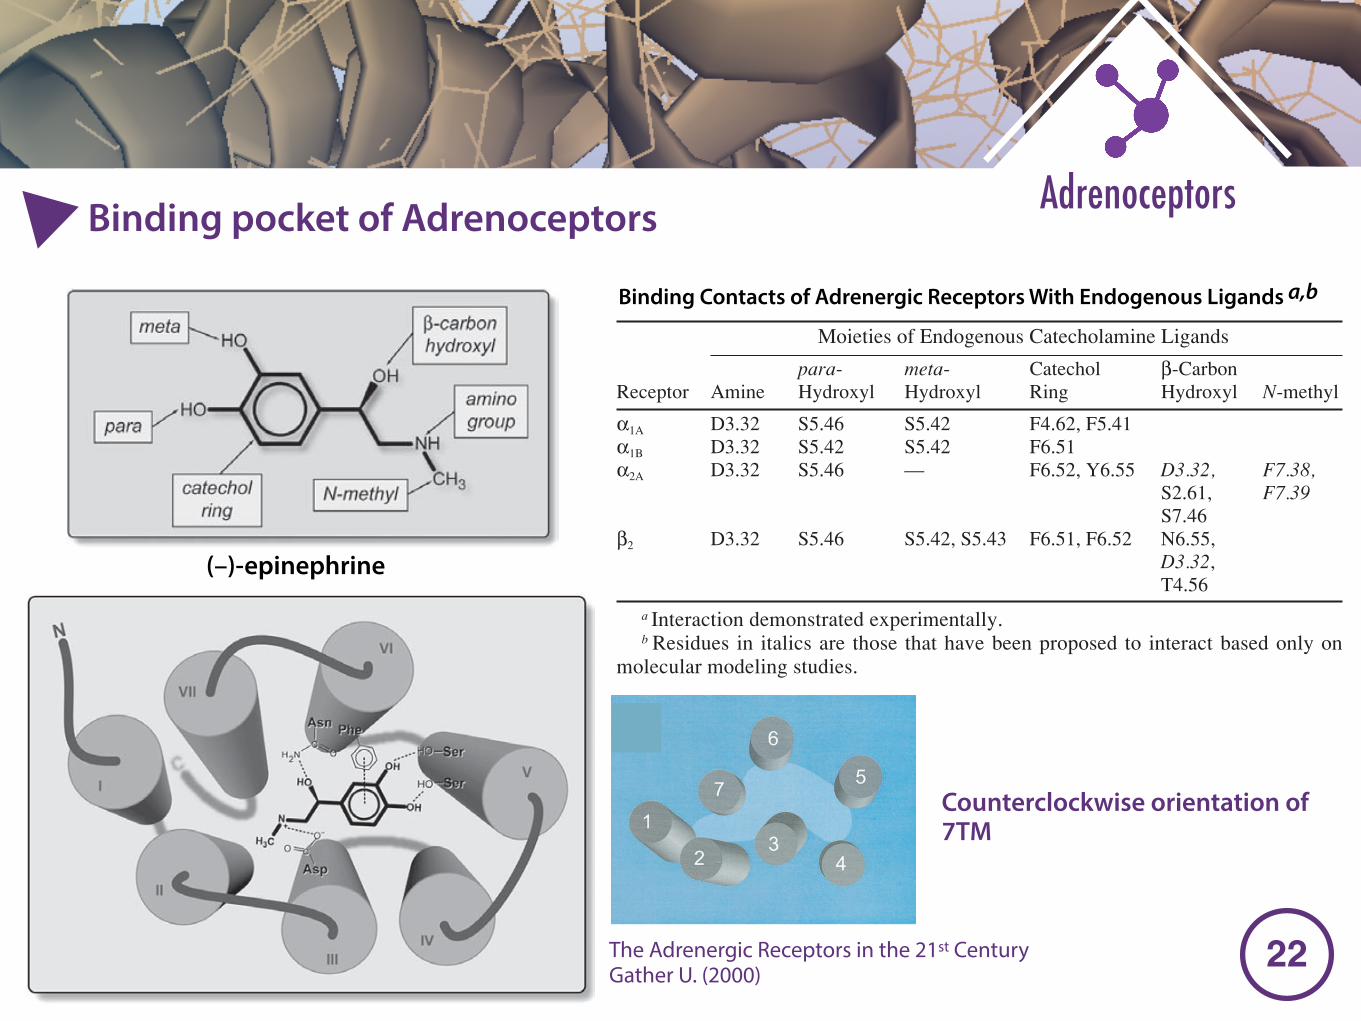
�22
AdrenoceptorsBinding pocket of Adrenoceptors26 Finch, Sarramegna, and Graham
1. Adrenergic Receptor Ligand-Binding Sites1.1. Binding Contacts of the Endogenous Ligands
In the early 1930s, Easson and Stedman proposed that receptor binding of acompound possessing a chiral center involved interactions between three contactpoints on the receptor and three moieties of the ligand (1). On the basis ofexperimental data on the activity of the enantiomers of epinephrine, they pro-posed that epinephrine’s triad consisted of the basic group (the amide), the aro-matic ring with its hydroxyl groups, and the alcoholic chiral, β-carbon hydroxylgroup (1) (Fig. 1). The importance of these three chemical groups and theirinteraction with the adrenergic receptors (ARs) has been borne out by numerousmutagenesis and biochemical studies along with modeling studies performedsince the first of the ARs, the mammalian β2- and turkey β-AR, were cloned in1986 (2,3).
However, as discussed in more detail later in this section, distinct interactionswere also defined for both the aromatic ring and its hydroxyls, giving a total ofat least four critical receptor/ligand moiety contacts. These studies also definedthe binding site for endogenous agonists to be contained within a pocket formedby the clustering of the seven putative transmembrane (TM) helical bundles of thereceptor and to be located approx 11 Å below the extracellular surface (4). Thekey interactions (Table 1) are (1) an ionic interaction between the amino groupof the catechol with the carboxylate side chain of D3.321 of helix 3, (2) hydrogenbonding between the catechol meta- and para-hydroxyl groups and serine resi-dues in helix 5, (3) an aromatic–aromatic interaction between the phenyl ring ofagonists and aromatic residues in helix 6, and (4) hydrogen bonding between thechiral benzylic β-hydroxyl of agonists and a residue in helix 6, which accountsfor the stereoselectivity of adrenergic ligands (Fig. 2).
Fig. 1. Chemical structure of (–)-epinephrine. Individual moieties, including themeta- and para-hydroxyls, catechol ring, protonated amine, alcoholic chiral β-carbonhydroxyl, and N-methyl group are indicated.
1 See the Appendix on page 65 for residue numbering.
(–)-epinephrine
Ligand Binding, Activation, and Agonist Trafficking 27
Table 1Binding Contacts of Adrenergic Receptors With Endogenous Ligands a,b
Moieties of Endogenous Catecholamine Ligands
para- meta- Catechol β-CarbonReceptor Amine Hydroxyl Hydroxyl Ring Hydroxyl N-methyl
α1A D3.32 S5.46 S5.42 F4.62, F5.41α1B D3.32 S5.42 S5.42 F6.51α2A D3.32 S5.46 — F6.52, Y6.55 D3.32, F7.38,
S2.61, F7.39S7.46
β2 D3.32 S5.46 S5.42, S5.43 F6.51, F6.52 N6.55,D3.32,T4.56
a Interaction demonstrated experimentally.b Residues in italics are those that have been proposed to interact based only on
molecular modeling studies.
Fig. 2. Major interactions between (–)-epinephrine and its β-adrenergic receptor bind-ing site: (a) ionic interaction between the amino group of epinephrine and the carboxylateside chain of an aspartic acid (Asp) in helix III; (b) hydrogen bonding between the catecholmeta- and para-hydroxyl groups and serine (Ser) residues in helix V; (c) an aromatic–aromatic interaction between the phenyl ring of agonists and an aromatic residue (Phe) inhelix VI, and (d) hydrogen bonding interaction between the chiral benzylic β-hydroxyl ofepinephrine and a residue (Asn) in helix VI, which accounts for the stereoselectivity ofadrenergic ligands. Transmembrane helices are indicated by Roman numerals.
Binding Contacts of Adrenergic Receptors With Endogenous Ligands a,b
Ligand Binding, Activation, and Agonist Trafficking 27
Table 1Binding Contacts of Adrenergic Receptors With Endogenous Ligands a,b
Moieties of Endogenous Catecholamine Ligands
para- meta- Catechol β-CarbonReceptor Amine Hydroxyl Hydroxyl Ring Hydroxyl N-methyl
α1A D3.32 S5.46 S5.42 F4.62, F5.41α1B D3.32 S5.42 S5.42 F6.51α2A D3.32 S5.46 — F6.52, Y6.55 D3.32, F7.38,
S2.61, F7.39S7.46
β2 D3.32 S5.46 S5.42, S5.43 F6.51, F6.52 N6.55,D3.32,T4.56
a Interaction demonstrated experimentally.b Residues in italics are those that have been proposed to interact based only on
molecular modeling studies.
Fig. 2. Major interactions between (–)-epinephrine and its β-adrenergic receptor bind-ing site: (a) ionic interaction between the amino group of epinephrine and the carboxylateside chain of an aspartic acid (Asp) in helix III; (b) hydrogen bonding between the catecholmeta- and para-hydroxyl groups and serine (Ser) residues in helix V; (c) an aromatic–aromatic interaction between the phenyl ring of agonists and an aromatic residue (Phe) inhelix VI, and (d) hydrogen bonding interaction between the chiral benzylic β-hydroxyl ofepinephrine and a residue (Asn) in helix VI, which accounts for the stereoselectivity ofadrenergic ligands. Transmembrane helices are indicated by Roman numerals.
Counterclockwise orientation of 7TM
is not yet available for GPCRs. A high-resolution structure ofthe light-driven proton pump from Halobacterium halobium,bacteriorhodopsin, has been available for several years (30).Since bacteriorhodopsin, similar to the GPCRs, possessesseven-transmembrane !-helices and uses retinal as its chro-mophore, it has been considered a bacterial homolog of ver-tebrate rhodopsin. The bacteriorhodopsin structure has ac-cordingly been widely used as a template for tertiarystructure models of GPCRs (31–35). However, bacteriorho-dopsin is a proton pump, is not linked to a G protein, anddoes not even display remote sequence homology with anyGPCR. Moreover, the structural information that recently hasbecome available for rhodopsin indicated clear differencesbetween bacteriorhodopsin and rhodopsin (30, 36–39). Over-all, the use of bacteriorhodopsin as a template for molecularmodels should now be considered obsolete.
Using electron cryomicroscopy of two-dimensional crys-tals, Schertler and co-workers (36–39) have succeeded inobtaining low-resolution structures of both bovine and frogrhodopsin. In addition, a low-resolution structure of squidrhodopsin has become available (40). The first projectionmap of bovine rhodopsin at 9 Å resolution provided the firstdirect insight into how the predicted seven helices are or-ganized relative to one another in the tertiary structure of thereceptor (36). Importantly, a very similar arrangement of thetransmembrane helices was found in the projection maps offrog and squid rhodopsin at 7 Å and 8 Å resolutions, re-spectively (38, 40). The projection maps are characterized byan arc-shaped feature, which has been interpreted as reflect-ing the presence of three tilted helices (36, 38, 40). Fouradditional peaks were interpreted as the remaining fourtransmembrane helices (36, 38, 40). The structural informa-tion achieved from aligning multiple receptor sequences per-mitted assignment of the individual peaks in the projectionmaps to the individual helices in the receptor (25, 41). Asshown in Fig. 2, it is believed that the helices are organizedsequentially in a counterclockwise fashion as seen from theextracellular side, with helix 3 being almost in the center ofthe molecule. Further insight into the packing of the seven-helix bundle and calculation of the tilting angles of the heliceshave been achieved by detailed analysis of tilted two-di-mensional crystals of bovine and frog rhodopsin, allowinggeneration of the first three-dimensional maps (37, 38). Theresolution of the map based on the frog rhodopsin crystalswas 7.5 Å in the plane of the membrane and 16.5 Å perpen-dicular to it (38). According to the map, helices 1, 2, and 3 aretilted 27–30 degrees, helix 5 is tilted 23 degrees, whereashelices 4 and 7 are almost perpendicular to the plane of themembrane (38). Helix 6 appears almost perpendicular to theplane of the membrane in the cytoplasmic half but is benttoward helix 5 on the extracellular side (38). The structurealso shows that the helices are tightly packed on the intra-cellular side with helices 2 and 3 packed between helix 4, 6,
FIG. 2. The predicted structure of rhodopsin-like GPCRs. A, Dia-gram of a rhodopsin-like GPCR as seen from the extracellular sidewith each helix represented by a cylinder. The helices are posi-tioned according to the projection maps of frog rhodopsin (37, 38).The helices are organized sequentially in a counterclockwise fash-ion with helix 3 being almost in the center of the molecule (37, 38).B, “Helical wheel” diagram of a rhodopsin-like GPCR as seen fromthe extracellular side. The helices are positioned according to theprojection maps of frog rhodopsin (37, 38). The conserved finger-print residues are shown in yellow. These residues have been givena general number to facilitate comparison of residues between thereceptors. According to the Schwartz numbering scheme, the num-ber is given according to its predicted relative position in the helix(24). For example, ProV.16 indicates residue number 16 in TM 5.In the Ballesteros-Weinstein numbering scheme the most con-served residue in each helix has been given the number 50 (26). Theresidues are indicated according to the Schwartz scheme followedby the Ballesteros-Weinstein number in superscript. C, Molecularmodel of the "2-adrenergic receptor, as seen from the extracellularside, based on the projection map of rhodopsin (26) and structural
analysis of multiple GPCR sequences (26). The full agonist epineph-rine is shown in the binding crevice with key interactions highlighted(see Section IV.A.2 for further details). Dr. Juan Ballesteros isthanked for preparing the figure. Susan L. Glick and Julie Bryantfrom Molecular Simulations, Inc., are thanked for technical assis-tance.
February, 2000 ACTIVATION OF G PROTEIN-COUPLED RECEPTORS 93
The Endocrine Society. Downloaded from press.endocrine.org by [${individualUser.displayName}] on 13 April 2015. at 07:20 For personal use only. No other uses without permission. . All rights reserved.
The Adrenergic Receptors in the 21st Century Gather U. (2000)
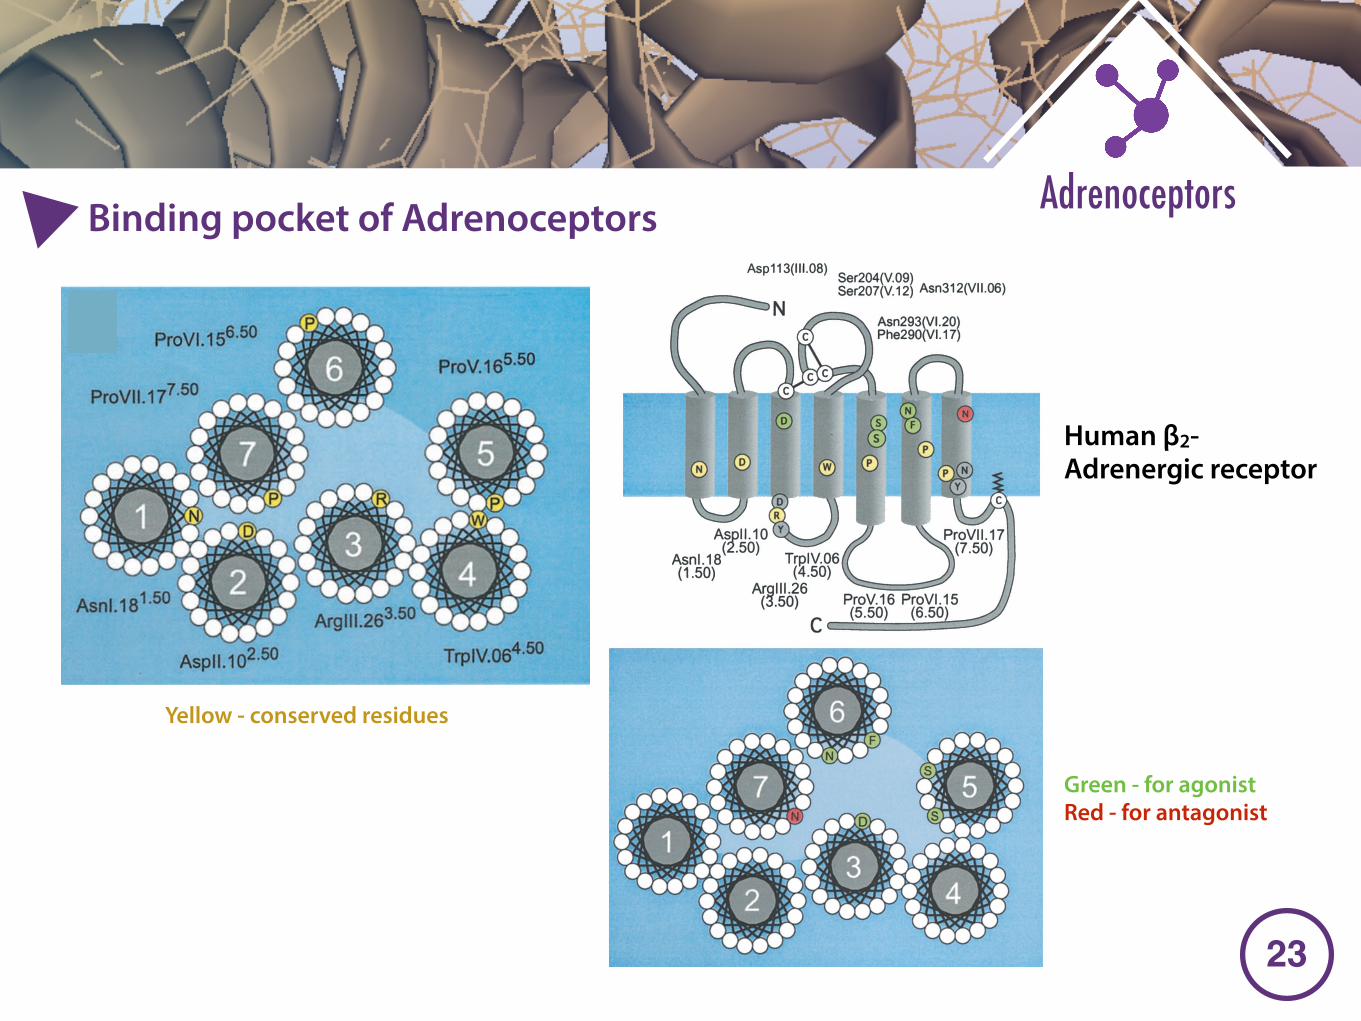
�23
AdrenoceptorsBinding pocket of Adrenoceptors
is not yet available for GPCRs. A high-resolution structure ofthe light-driven proton pump from Halobacterium halobium,bacteriorhodopsin, has been available for several years (30).Since bacteriorhodopsin, similar to the GPCRs, possessesseven-transmembrane !-helices and uses retinal as its chro-mophore, it has been considered a bacterial homolog of ver-tebrate rhodopsin. The bacteriorhodopsin structure has ac-cordingly been widely used as a template for tertiarystructure models of GPCRs (31–35). However, bacteriorho-dopsin is a proton pump, is not linked to a G protein, anddoes not even display remote sequence homology with anyGPCR. Moreover, the structural information that recently hasbecome available for rhodopsin indicated clear differencesbetween bacteriorhodopsin and rhodopsin (30, 36–39). Over-all, the use of bacteriorhodopsin as a template for molecularmodels should now be considered obsolete.
Using electron cryomicroscopy of two-dimensional crys-tals, Schertler and co-workers (36–39) have succeeded inobtaining low-resolution structures of both bovine and frogrhodopsin. In addition, a low-resolution structure of squidrhodopsin has become available (40). The first projectionmap of bovine rhodopsin at 9 Å resolution provided the firstdirect insight into how the predicted seven helices are or-ganized relative to one another in the tertiary structure of thereceptor (36). Importantly, a very similar arrangement of thetransmembrane helices was found in the projection maps offrog and squid rhodopsin at 7 Å and 8 Å resolutions, re-spectively (38, 40). The projection maps are characterized byan arc-shaped feature, which has been interpreted as reflect-ing the presence of three tilted helices (36, 38, 40). Fouradditional peaks were interpreted as the remaining fourtransmembrane helices (36, 38, 40). The structural informa-tion achieved from aligning multiple receptor sequences per-mitted assignment of the individual peaks in the projectionmaps to the individual helices in the receptor (25, 41). Asshown in Fig. 2, it is believed that the helices are organizedsequentially in a counterclockwise fashion as seen from theextracellular side, with helix 3 being almost in the center ofthe molecule. Further insight into the packing of the seven-helix bundle and calculation of the tilting angles of the heliceshave been achieved by detailed analysis of tilted two-di-mensional crystals of bovine and frog rhodopsin, allowinggeneration of the first three-dimensional maps (37, 38). Theresolution of the map based on the frog rhodopsin crystalswas 7.5 Å in the plane of the membrane and 16.5 Å perpen-dicular to it (38). According to the map, helices 1, 2, and 3 aretilted 27–30 degrees, helix 5 is tilted 23 degrees, whereashelices 4 and 7 are almost perpendicular to the plane of themembrane (38). Helix 6 appears almost perpendicular to theplane of the membrane in the cytoplasmic half but is benttoward helix 5 on the extracellular side (38). The structurealso shows that the helices are tightly packed on the intra-cellular side with helices 2 and 3 packed between helix 4, 6,
FIG. 2. The predicted structure of rhodopsin-like GPCRs. A, Dia-gram of a rhodopsin-like GPCR as seen from the extracellular sidewith each helix represented by a cylinder. The helices are posi-tioned according to the projection maps of frog rhodopsin (37, 38).The helices are organized sequentially in a counterclockwise fash-ion with helix 3 being almost in the center of the molecule (37, 38).B, “Helical wheel” diagram of a rhodopsin-like GPCR as seen fromthe extracellular side. The helices are positioned according to theprojection maps of frog rhodopsin (37, 38). The conserved finger-print residues are shown in yellow. These residues have been givena general number to facilitate comparison of residues between thereceptors. According to the Schwartz numbering scheme, the num-ber is given according to its predicted relative position in the helix(24). For example, ProV.16 indicates residue number 16 in TM 5.In the Ballesteros-Weinstein numbering scheme the most con-served residue in each helix has been given the number 50 (26). Theresidues are indicated according to the Schwartz scheme followedby the Ballesteros-Weinstein number in superscript. C, Molecularmodel of the "2-adrenergic receptor, as seen from the extracellularside, based on the projection map of rhodopsin (26) and structural
analysis of multiple GPCR sequences (26). The full agonist epineph-rine is shown in the binding crevice with key interactions highlighted(see Section IV.A.2 for further details). Dr. Juan Ballesteros isthanked for preparing the figure. Susan L. Glick and Julie Bryantfrom Molecular Simulations, Inc., are thanked for technical assis-tance.
February, 2000 ACTIVATION OF G PROTEIN-COUPLED RECEPTORS 93
The Endocrine Society. Downloaded from press.endocrine.org by [${individualUser.displayName}] on 13 April 2015. at 07:20 For personal use only. No other uses without permission. . All rights reserved.
Yellow - conserved residues
Human β2-Adrenergic receptor
tors and changed the peptide receptor field into a rapidlyexpanding area for drug development (24). The majority ofthe nonpeptide compounds [mostly antagonists but recently,in some cases, also agonists (137)] are developed into high-affinity compounds from “leads” identified by screening oflarge chemical files (24). In almost all cases, the resultingcompounds exhibit no obvious structural similarity to theendogenous peptide ligands, despite an apparent classicalcompetitive mode of action and despite the ability of both thepeptide agonist and nonpeptide antagonists to bind withoften subnanomolar affinity to the same receptor (24). In-terestingly, these nonpeptide compounds have turned out to
be valuable for understanding the molecular function ofGPCRs.
1. Tachykinin nonpeptide antagonists. An initial series of chi-meric NK-1/NK-3 receptors provided the first evidence thatthe binding mode for the prototype nonpeptide NK-1 recep-tor antagonist, CP 96,345, was distinct from the bindingmode of the endogenous agonist substance P (138). Severalchimeric exchanges that dramatically affected CP 96,345 af-finity did not affect binding of substance P (138). Overall, thechimeric analyses indicated that CP 96,345 and several otherstructurally distinct nonpeptide NK-1 receptor antagonists,
FIG. 3. Comparison of ligand-binding domains in a prototype small-molecule family A receptor (the !2-adrenergic receptor, !2AR) with aprototype family A peptide receptor (the NK-1 receptor). Upper panels, Snake diagrams of the human !2AR and the human NK-1 receptor.Lower panels, Helical wheel diagrams of the receptors as seen from the extracellular side. The helices are positioned in a counterclockwise fashionaccording to the projection map of rhodopsin (25, 36, 38, 41). In the upper panels the most highly conserved residue in each helix is indicatedin yellow. These so-called “finger print” residues have been given a general number to facilitate comparison of residues between the receptors.According to the Schwartz numbering scheme, the number is given according to its predicted relative position in the helix (24). For example,ProV.16 indicates residue number 16 in TM 5. In the Ballesteros-Weinstein numbering scheme, the most conserved residue in each helix hasbeen given the number 50 (26). The numbers for each key residue, according to both numbering schemes, are indicated on this figure belowthe receptors. Otherwise, the residues shown in the figure are indicated by their “real” number in the receptor followed by the number accordingto the Schwartz numbering scheme. The amino acids predicted to form the contact points for the agonists are shown in green while residuesinvolved in small-molecule antagonist binding are shown in red (see text for details). The residues in the !2AR (left panels) that form the agonistbinding site for the epinephrine are found in a binding crevice between TM 3, 5, and 6 (72, 78, 79). In contrast, the presumed major contactpoints for the peptide agonist, substance P, in the NK-1 receptor (right panels) are found in the extracellular domains or at the top of the helices(86–88). In the !2AR, an asparagine in TM 7 (AsnVII.06) has been shown to interact specifically with aryloxyalkylamine antagonists (80).Notably, the aspartic acid in TM 3 (AspIII.08) (shown in green) is a common interaction point for both adrenergic agonists and antagonists (72).The residues shown in red in the NK-1 receptor are positions of point mutations shown to affect binding of the prototype nonpeptide antagonistCP 96345 (91, 142–146). Mutation of these residues, clustering in a crevice formed by TM 3, 4, 5, and 6, does not affect peptide agonist binding(91, 142–146).
February, 2000 ACTIVATION OF G PROTEIN-COUPLED RECEPTORS 97
The Endocrine Society. Downloaded from press.endocrine.org by [${individualUser.displayName}] on 13 April 2015. at 07:20 For personal use only. No other uses without permission. . All rights reserved.
Green - for agonist Red - for antagonist
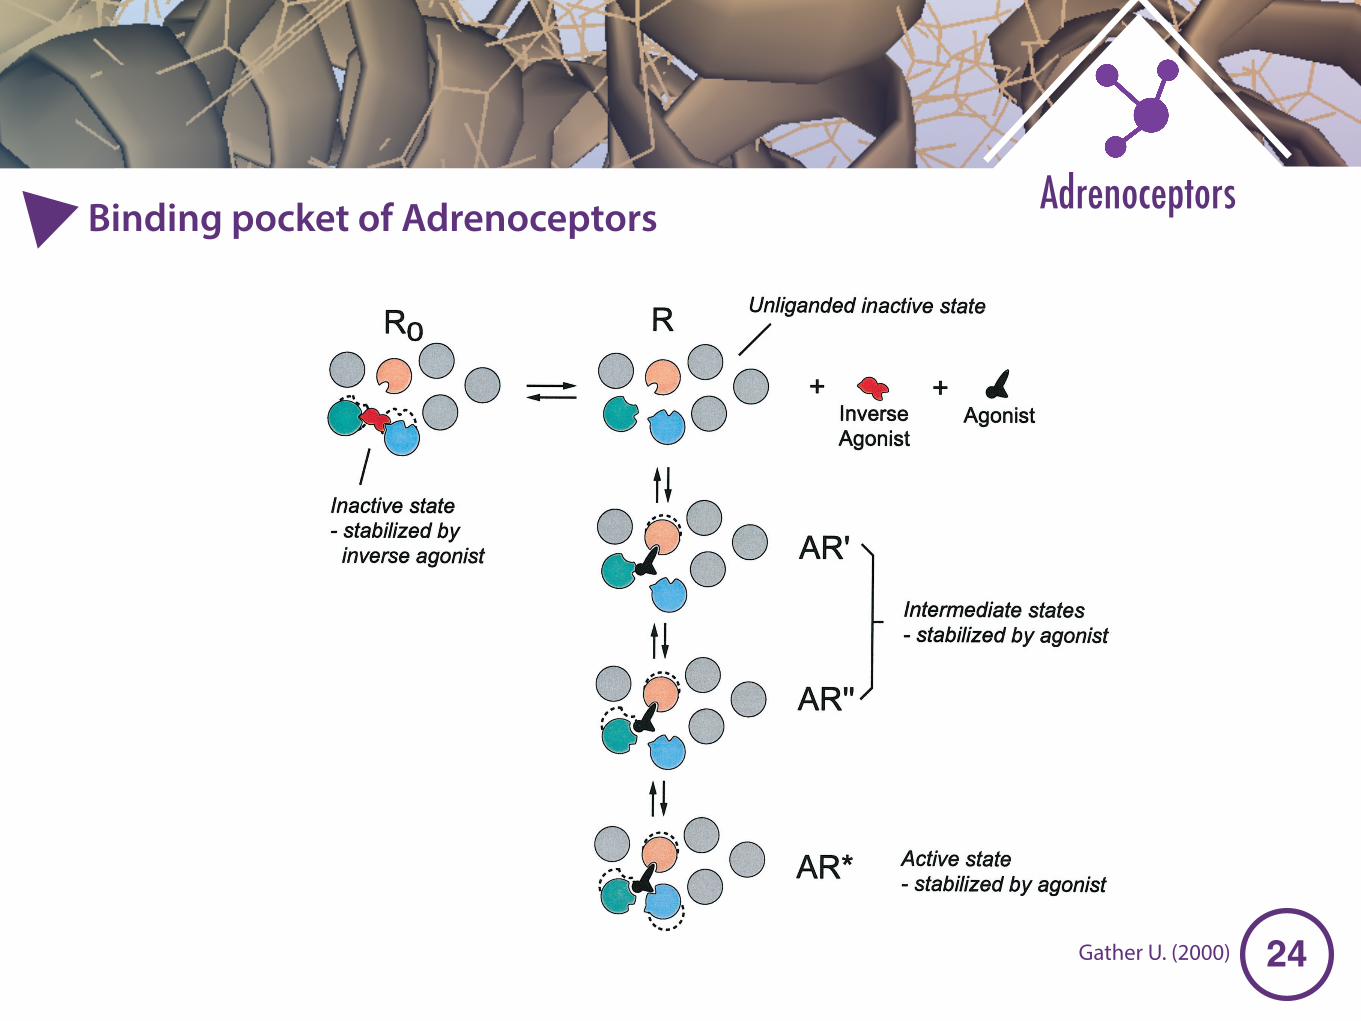
�24
AdrenoceptorsBinding pocket of Adrenoceptors
competitive situation with overlapping binding sites be-tween the agonist and antagonists (24).
B. Implications from biophysical studies on receptoractivation models
The recent biophysical analyses of conformational changesin rhodopsin and in the !2-adrenergic receptor have pro-vided novel insight into the critical conformational changesaccompanying receptor activation. However, the data alsoraise new interesting questions about molecular modes ofagonist-induced receptor activation. As discussed in SectionV.C, spectroscopic studies of conformational changes in bothrhodopsin and the !2-adrenergic receptor suggest that sim-ilar movements are important for activation of both recep-tors. Otherwise, there are substantial differences underlyingactivation of rhodopsin compared with the !2-adrenergicreceptor. Rhodopsin is unique in that its ligand, cis-retinal, iscovalently bound to the receptor as an inverse agonist andupon absorption of a photon isomerizes to an agonist (trans-retinal) within the binding pocket (reviewed in Ref. 66). Inother words, ligand binding is not part of the activationprocess. This specialized mechanism of activation may benecessary to facilitate the very rapid response of rhodopsinto light. Thus, formation of the activated metarhodopsin IIstate occurs essentially within microseconds even in deter-gent solution in the absence of transducin (290). Interestingly,metarhodopsin II subsequently undergoes a slow (t1/2 ! 6min) transition to the inactive metarhodopsin III (290). Dur-ing this inactivating transition trans-retinal undergoes hy-drolysis and release from the binding pocket (291). Remark-ably, free trans-retinal is not a very effective agonist for opsin,producing only approximately 14% of the response observedfor light-activated rhodopsin (292). This shows that efficientactivation of rhodopsin by trans-retinal requires that cis-ret-inal is prebound and that cis-retinal can be rapidly convertedto trans-retinal by photoisomerization. The less efficient ac-tivation of opsin by free trans-retinal may more closely reflectthe process of activation of other GPCRs.
In contrast to the rapid activation and the slow inactivationkinetics observed for rhodopsin, spectroscopic analyses ofthe purified !2-adrenergic receptor labeled with a confor-mationally sensitive fluorophore revealed slow agonist-in-duced conformational changes (t1/2 ! 2–3 min), significantlyslower than the predicted association rate of the agonist (220,248, 249). However, the reversal of the agonist-induced con-formational change was relatively fast (t1/2 ! 30 sec) (220,248, 249). It should be emphasized that the slow activationkinetics now have been observed in several different read-outs. Thus, the agonist-induced spectral changes observedafter labeling of cysteines introduced at the cytoplasmic sideof TM 6 occur with similar kinetics as that observed afterlabeling of the endogenous cysteines (Cys125 and Cys285)(A.D. Jensen and U. Gether, to be published). It is possiblethat the differences between rhodopsin and the !2-adrener-gic receptor are caused by differences in the methodologicalapproach. However, since the measurements were per-formed under similar conditions (in detergent solution in theabsence of G protein) it is more likely that they reflect in-
herent differences between rhodopsin and a receptor acti-vated by a diffusable ligand.
The observed slow activation kinetics cannot be readilyaccommodated into a simple “two-state model”. Accordingto this model the affinity of a full agonist for the R state isnegligible; thus, agonist binding occurs selectively to theactivated state R*, thereby pulling the equilibrium toward R*.This would predict that the association rate for agonist bind-ing is limited by the rate of transition from R to R*. This is
FIG. 5. Sequential binding and conformational stabilization modelfor the molecular mechanisms of ligand action in GPCRs. The hypo-thetical receptor is illustrated by seven apparent helices seen fromabove. The model predicts that the unliganded receptor exists in aunique state R that can undergo transitions to at least two otherstates R0 and R*. R0 is stabilized by inverse agonists and R* isstabilized by agonists. R may undergo spontaneous transitions to theR* state, explaining the high basal activity observed for some GPCRs,and it may undergo spontaneous transition to the R0. As discussed inthe text, binding of the agonist is suggested to occur sequentially,resulting in a series of conformational states that are intermediates(R" and R#) between R and R*. The agonists are known to have severalfunctionally important sites of interaction with the receptor. Bindingmay involve an initial interaction between receptor and one structuralgroup of the agonist. After the initial binding of one structural group,binding of the remaining groups occurs in a sequential manner as aresult of random and spontaneous movements of TM domains topositions that permit interaction with the functional groups. Eachinteraction between the receptor and the agonist stabilize one or moreTM domains until the receptor has been stabilized in the active R*state. A similar mode of binding can be envisioned for inverse agonistsresulting in stabilization of the R0 state. The model would be consis-tent both with a rapid association rate for agonists (formation of AR")and the relatively slow rate of conformational change observed spec-troscopically (formation of AR*). Importantly, the G protein maysubstantially affect the kinetics of the transition from AR" over AR#to AR*. Similar to the multistate model described in Ref. 24, the modelalso readily accommodates the concept of “allosteric competitive an-tagonism” (24) i.e., that a competitive antagonist does not have toshare an overlapping binding site with the agonist. Hence, an “allo-steric competitive” antagonist, according to the model, would simplyact by stabilizing the receptor in R0, which would not be expected tobind the agonist. Conversely, the agonist could stabilize the receptorin R*, which would not be expected to bind the antagonist. In this way,by stabilizing different receptor conformations, the agonist and theantagonist can mutually exclude the binding of each other to thereceptor.
February, 2000 ACTIVATION OF G PROTEIN-COUPLED RECEPTORS 105
The Endocrine Society. Downloaded from press.endocrine.org by [${individualUser.displayName}] on 13 April 2015. at 07:20 For personal use only. No other uses without permission. . All rights reserved.
Gather U. (2000)
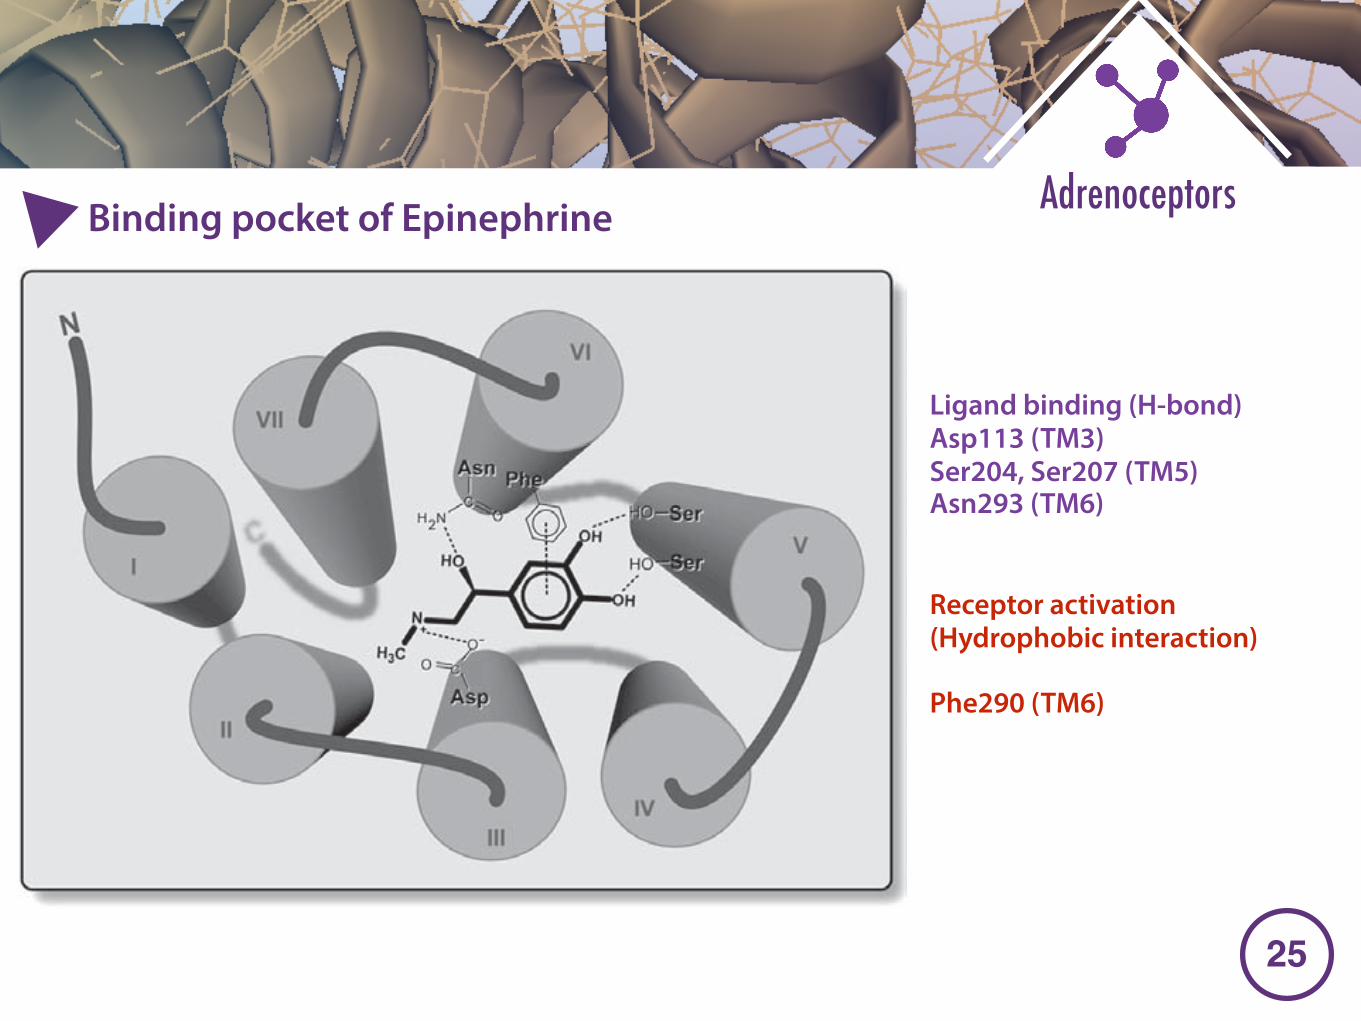
�25
AdrenoceptorsBinding pocket of Epinephrine
Ligand Binding, Activation, and Agonist Trafficking 27
Table 1Binding Contacts of Adrenergic Receptors With Endogenous Ligands a,b
Moieties of Endogenous Catecholamine Ligands
para- meta- Catechol β-CarbonReceptor Amine Hydroxyl Hydroxyl Ring Hydroxyl N-methyl
α1A D3.32 S5.46 S5.42 F4.62, F5.41α1B D3.32 S5.42 S5.42 F6.51α2A D3.32 S5.46 — F6.52, Y6.55 D3.32, F7.38,
S2.61, F7.39S7.46
β2 D3.32 S5.46 S5.42, S5.43 F6.51, F6.52 N6.55,D3.32,T4.56
a Interaction demonstrated experimentally.b Residues in italics are those that have been proposed to interact based only on
molecular modeling studies.
Fig. 2. Major interactions between (–)-epinephrine and its β-adrenergic receptor bind-ing site: (a) ionic interaction between the amino group of epinephrine and the carboxylateside chain of an aspartic acid (Asp) in helix III; (b) hydrogen bonding between the catecholmeta- and para-hydroxyl groups and serine (Ser) residues in helix V; (c) an aromatic–aromatic interaction between the phenyl ring of agonists and an aromatic residue (Phe) inhelix VI, and (d) hydrogen bonding interaction between the chiral benzylic β-hydroxyl ofepinephrine and a residue (Asn) in helix VI, which accounts for the stereoselectivity ofadrenergic ligands. Transmembrane helices are indicated by Roman numerals.
Ligand binding (H-bond) Asp113 (TM3) Ser204, Ser207 (TM5) Asn293 (TM6)
Receptor activation (Hydrophobic interaction)
Phe290 (TM6)
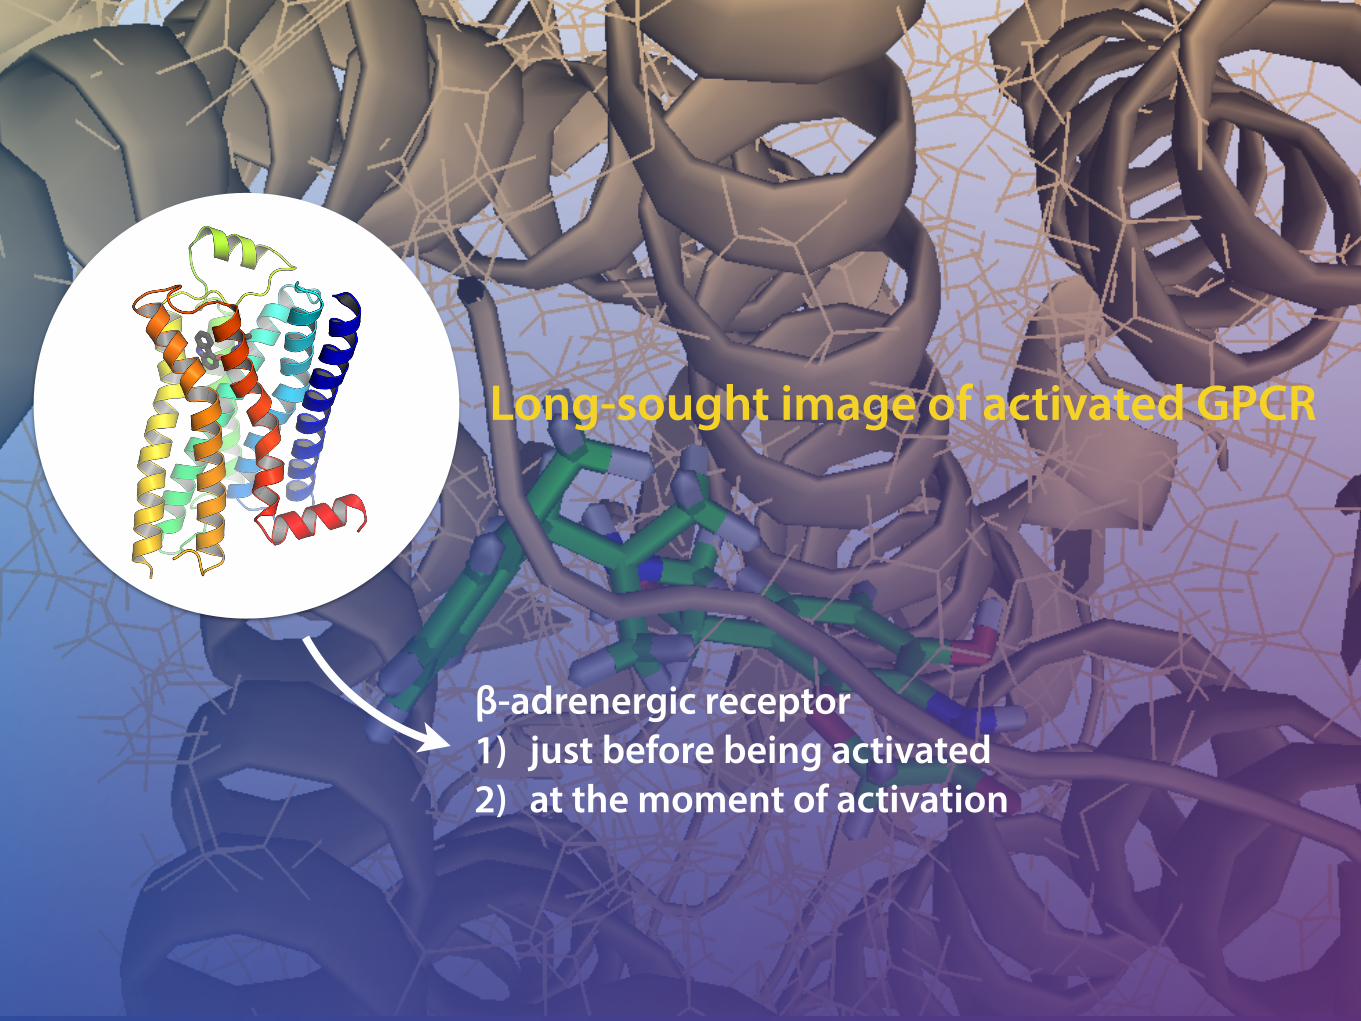
Long-sought image of activated GPCR
β-adrenergic receptor 1) just before being activated 2) at the moment of activation
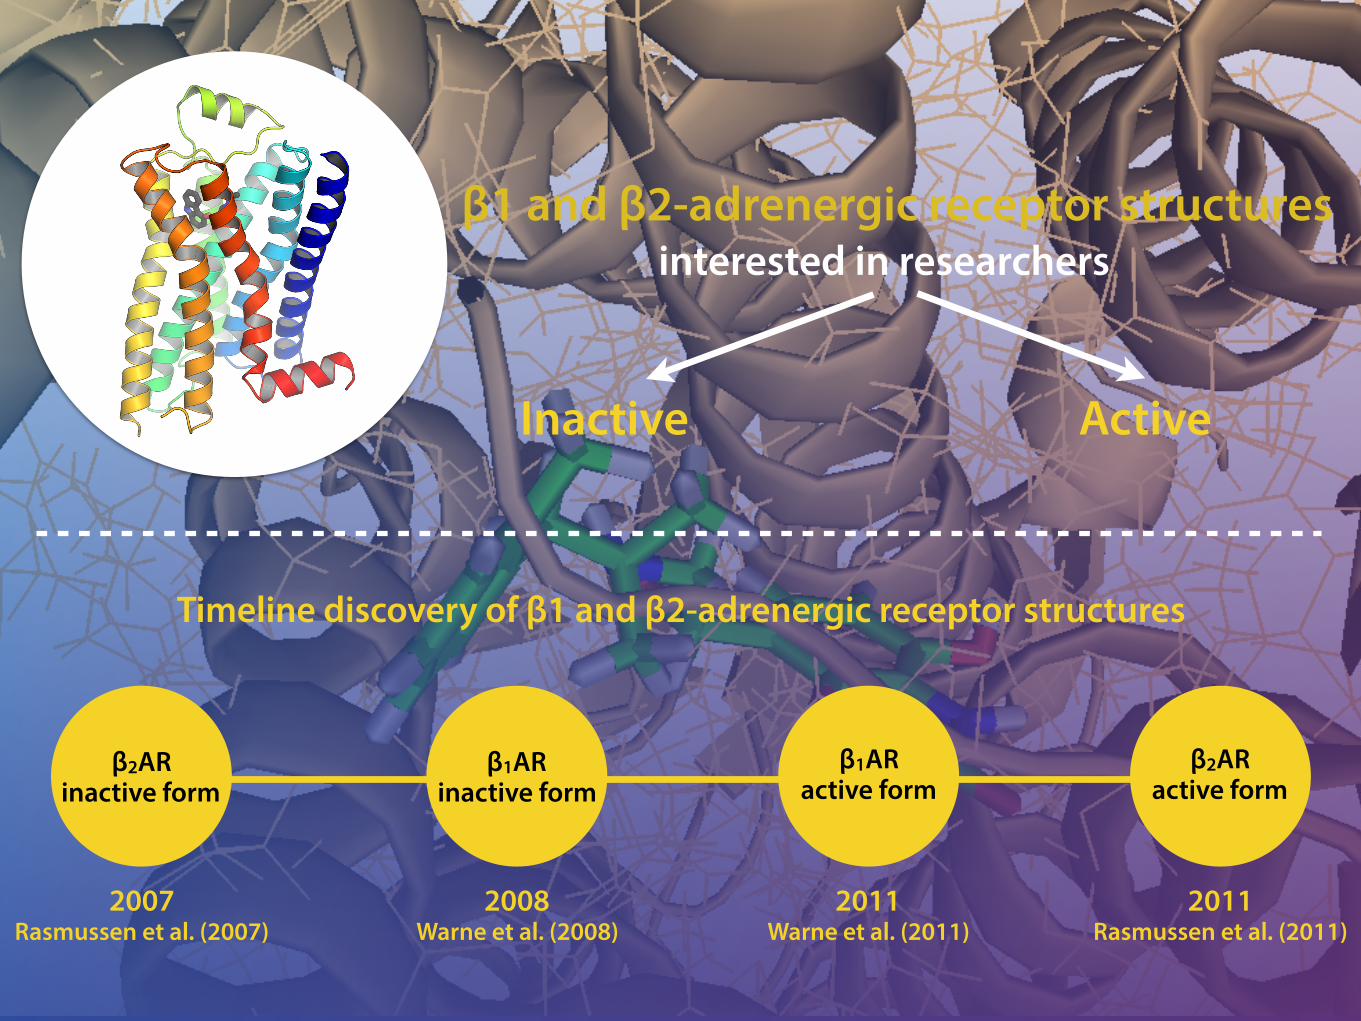
β1 and β2-adrenergic receptor structuresinterested in researchers
Inactive Active
2007 2008 2011 2011
β2AR inactive form
β1AR inactive form
β1AR active form
β2AR active form
Rasmussen et al. (2007) Warne et al. (2008) Warne et al. (2011) Rasmussen et al. (2011)
Timeline discovery of β1 and β2-adrenergic receptor structures
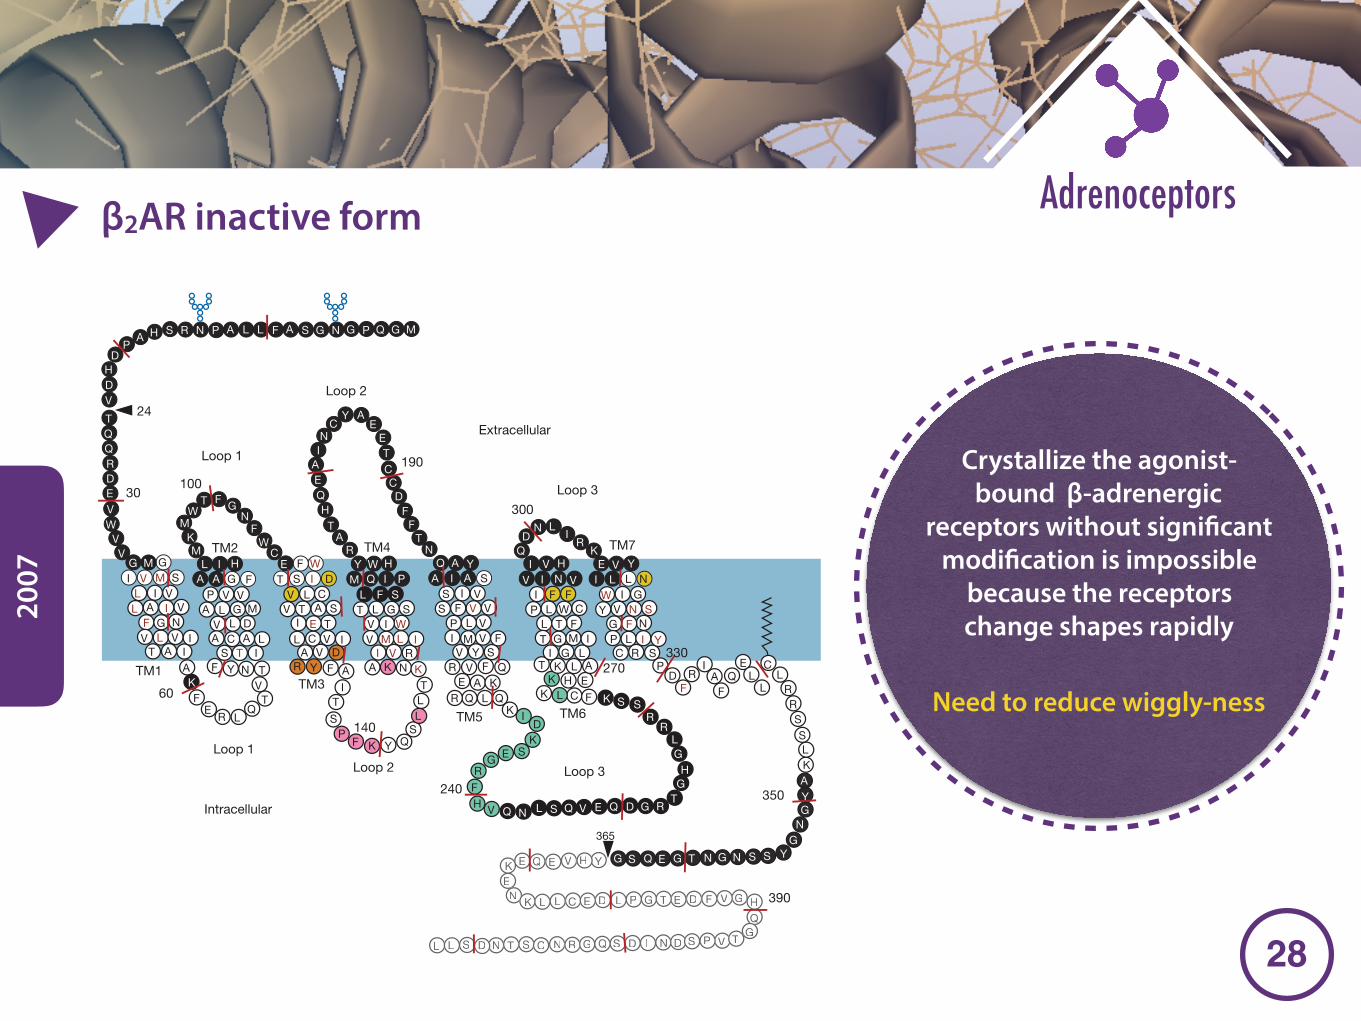
�28
Adrenoceptorsβ2AR inactive form
2007
by immunizing mice with purified b2AR reconstituted into phospho-lipid vesicles at a high protein-to-lipid ratio. Binding of Mab5 tob2AR does not alter agonist or antagonist binding affinities, and doesnot prevent agonist-induced conformational changes28; therefore, itdoes not significantly alter the native structure of the receptor.Purified, deglycosylated b2AR bound to carazolol (an inverseagonist) forms a complex with the Fab generated from Mab5(Fab5) in detergent, and the b2AR–Fab5 complex can be isolatedby size-exclusion chromatography.
Crystals of the carazolol-bound b2AR–Fab5 complex were grown inDMPC bicelles29 using ammonium sulphate as a precipitant. The sizeand uniformity of the crystals were improved by removing 48 aminoacids from the unstructured C terminus (b2AR365, Fig. 1). Crystals ofthe b2AR365–Fab5 complex grew as long, thin plates up to 300-mmlong, approximately 30-mm wide, and less than 10-mm thick. Owing tothe size and radiation sensitivity of the crystals, data collection requiredthe use of microbeam technology7,30 in which X-ray beams are eitherfocused (ID-13 and ID23-2 beamlines, European Synchrotron Radia-tion Facility, Grenoble) or moderately focused and then further colli-mated (23ID-B GM/CA-CAT beamline, Advanced Photon Source) todiameters between 5 and 10mm. The initial images from the bestcrystals showed diffraction to 3.0 A; however, resolution was rapidlylost in sequential images from the same crystal volume. Nevertheless,we obtained a complete data set from a single crystal, and determinedthe structure by molecular replacement using immunoglobulin-domain search models for the Fab. The diffraction is anisotropic, withdiffraction extending to 3.4 A in the plane of the membrane and 3.7 Aperpendicular to the plane of the membrane.
Structure of the b2AR–Fab5 complex
Figure 2a shows the packing of the b2AR365–Fab5 complex in thecrystals. The crystals seem to be formed from stacks of two-dimensional
crystals, as previously reported for bacteriorhodopsin crystallized inbicelles31. There are few contacts between adjacent receptor moleculeswithin a bicelle layer, indicating that the receptor is monomeric in thecrystal. This is somewhat surprising considering that, in all reportedcrystals of rhodopsin, rhodopsin exists as antiparallel or paralleldimers1–7. Moreover, evidence from a variety of biochemical andbiophysical studies suggest that the b2AR and many other GPCRsexist as dimers or higher-order oligomers in the plasma membraneof cultured cells32, and there may be a role for dimers in the export ofproperly folded receptor protein from the endoplasmic reticulum32.It is important to note, however, that b2AR dimerization is notrequired for G protein activation. Purified b2AR exists as monomers,and monomeric b2AR reconstituted into recombinant high-densitylipoprotein particles couples efficiently to Gs—its preferred hetero-trimeric G protein33.
The best-resolved regions of the crystal are the Fab5 fragments andcytoplasmic ends of the transmembrane segments of the receptor(Supplementary Fig. 1). In contrast to the cytoplasmic side of thereceptor, the electron density is uninterpretable in the extracellulardomain (Supplementary Fig. 2), even though this region of tworeceptor molecules packs together in a head-to-head manner aroundthe crystallographic two-fold axis. The poor packing in this interfaceprobably explains the significant anisotropy and poor overall reso-lution of the crystals. In an effort to improve the packing of theextracellular domains, we further modified b2AR365 by inserting aTEV cleavage site after amino acid 24 (b2AR24/365, Fig. 1). However,crystals of this construct are isomorphous to those made withb2AR365, and the structure (Supplementary Table 1) is virtuallyidentical to that obtained from b2AR365–Fab5.
As expected, the overall structure of the b2AR (Fig. 2b) is similar torhodopsin, with seven transmembrane helices and an eighth helixthat runs parallel to the cytoplasmic face of the membrane. Several of
PD
HDV
T
A H MGQPN GS GF AL LAPNRS
RDEVW
VV
G GMI V M S
L I VL A I V
F G NV L V I
T A I
L HIA A G F
P V VA L G M
V L DA C A L
S T IAKF
ER L
QT
VTF Y N
MKM
WT F G
NF
WC
E WFT S I D
V L CV T A S
I E TL C V I
V DR Y F A
ITS
PF K Y Q
SLLT
KNKA
Y HWM Q I P
L F ST L G S
V I WV M L I
V RI
TA
R
EQH
NI
A
CY A
EET
CC
DF
FT
NQ YA
A I A SS I V
S F V VP L VI M V F
Y SV
I HVV I N V
I F FP L W C
L T FT G M I
G L
E YVI L L N
W I GY V N S
G F NL I YR S
QD
N LI
RK
I CR V F Q
E A KR Q L Q
K
T K L AK H E
K L C F K S
PD
FR
IA
FQ
EL
L
CL
RRS
SR
RL
TGH
G
ID
K
Q D G R
G E S
Q V EHFR
NQV L S
SL
GYAK
YG
N
G N S SE G T NG S Q
P
V H YEQEKEN K L L C E D L P G T E FD V G H
QQGG
TS P VD I N DR G Q ST S NL L S D N C
365
24
30
60
100
190
A
140
240
270
300
330
350
390
Extracellular
TM1
TM2
TM3
TM4
TM5 TM6
TM7
Intracellular
Loop 1
Loop 2
Loop 3
Loop 1Loop 2 Loop 3
Figure 1 | Schematic diagram of theb2AR. Black circles with whiteletters indicate disordered residuesnot included in the model. Greyletters and circles indicate residuesnot included in the b2AR365construct used for crystallography.Red letters indicate amino acids forwhich side-chain electron densitywas not modelled. Yellow residuesindicate amino acids implicated inligand binding from mutagenesisstudies. Orange residues indicatethe conserved DRY sequence.Green residues form the Fab5epitope, and pink residues arepacked against the Fab5 constantdomain in the lattice. Small bluecircles indicate glycosylation sites.Red lines indicate ten-amino-acidincrements.
ARTICLES NATURE | Vol 450 | 15 November 2007
384Nature ©2007 Publishing Group
Crystallize the agonist-bound β-adrenergic
receptors without significant modification is impossible
because the receptors change shapes rapidly
Need to reduce wiggly-ness
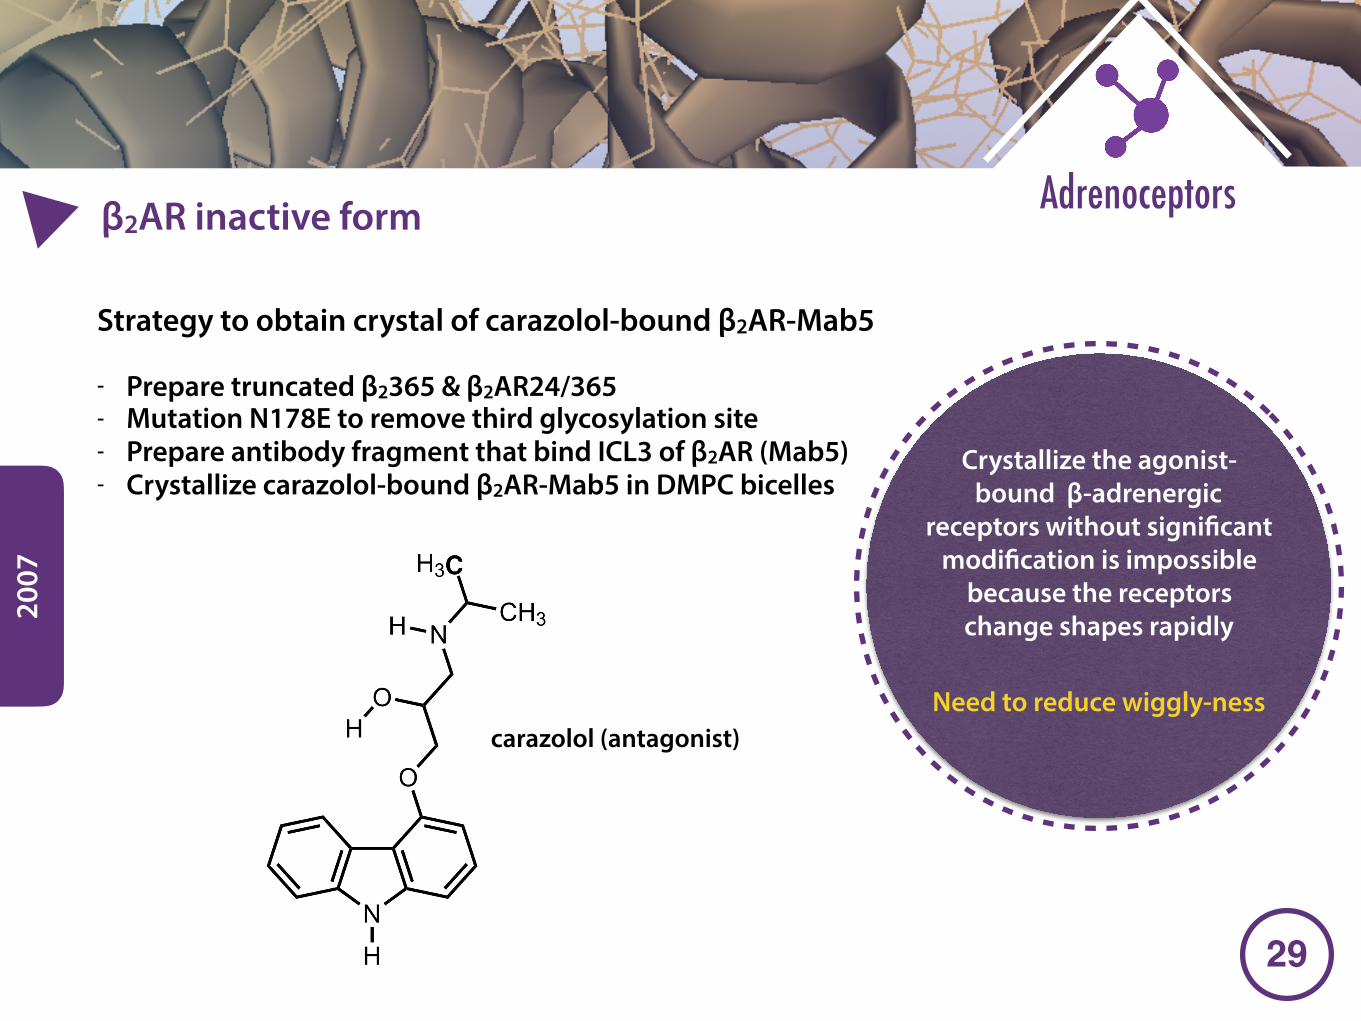
�29
Adrenoceptorsβ2AR inactive form
2007
Crystallize the agonist-bound β-adrenergic
receptors without significant modification is impossible
because the receptors change shapes rapidly
Need to reduce wiggly-ness
Strategy to obtain crystal of carazolol-bound β2AR-Mab5
- Prepare truncated β2365 & β2AR24/365 - Mutation N178E to remove third glycosylation site - Prepare antibody fragment that bind ICL3 of β2AR (Mab5) - Crystallize carazolol-bound β2AR-Mab5 in DMPC bicelles
carazolol (antagonist)
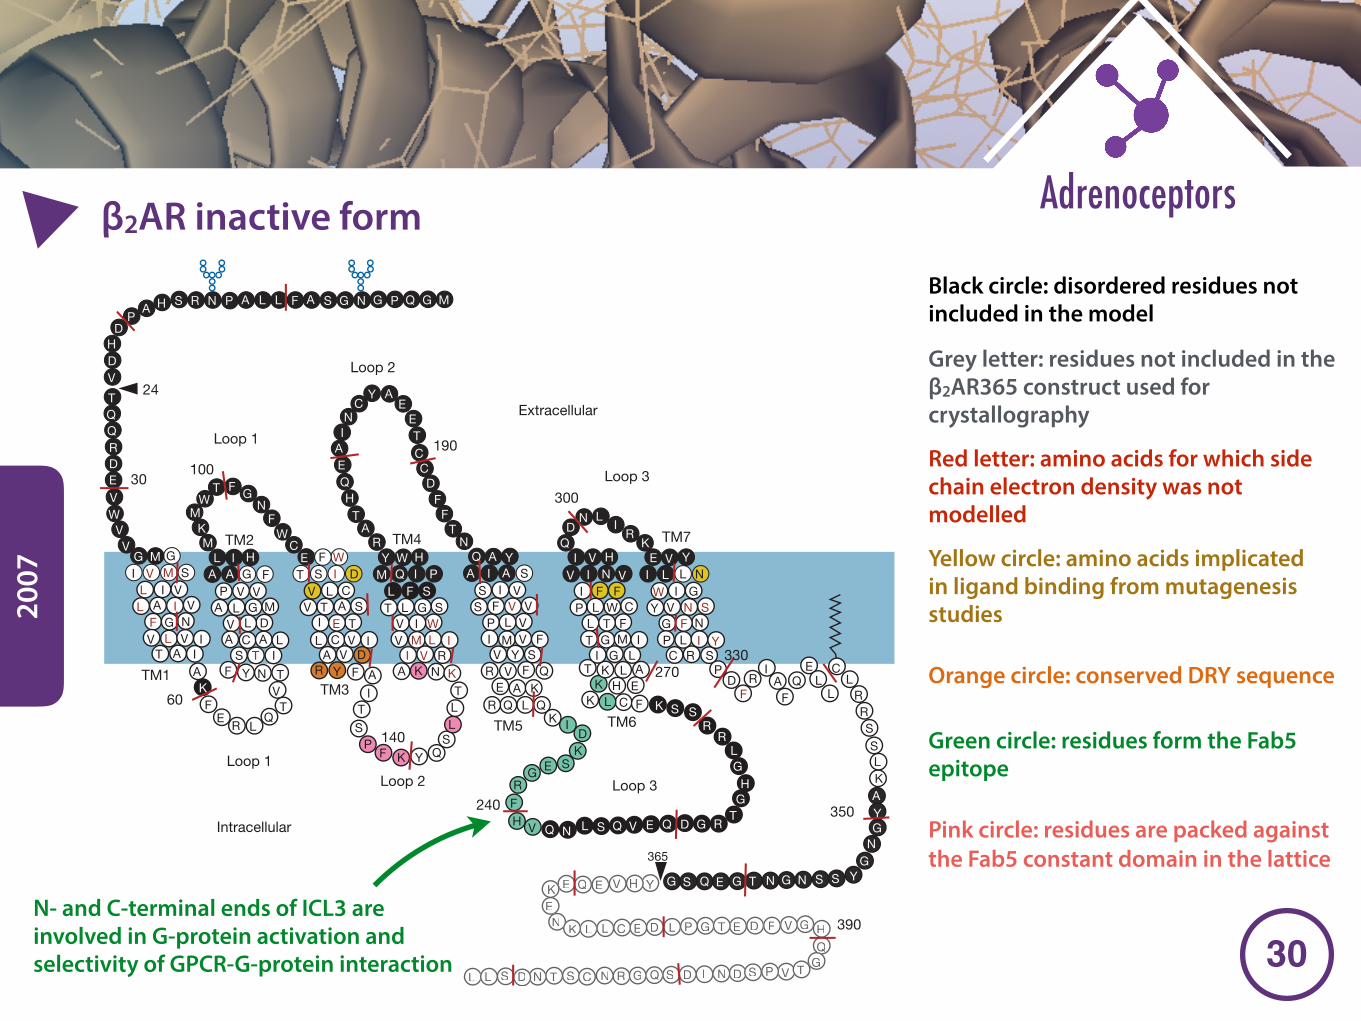
�30
Adrenoceptorsβ2AR inactive form
2007
by immunizing mice with purified b2AR reconstituted into phospho-lipid vesicles at a high protein-to-lipid ratio. Binding of Mab5 tob2AR does not alter agonist or antagonist binding affinities, and doesnot prevent agonist-induced conformational changes28; therefore, itdoes not significantly alter the native structure of the receptor.Purified, deglycosylated b2AR bound to carazolol (an inverseagonist) forms a complex with the Fab generated from Mab5(Fab5) in detergent, and the b2AR–Fab5 complex can be isolatedby size-exclusion chromatography.
Crystals of the carazolol-bound b2AR–Fab5 complex were grown inDMPC bicelles29 using ammonium sulphate as a precipitant. The sizeand uniformity of the crystals were improved by removing 48 aminoacids from the unstructured C terminus (b2AR365, Fig. 1). Crystals ofthe b2AR365–Fab5 complex grew as long, thin plates up to 300-mmlong, approximately 30-mm wide, and less than 10-mm thick. Owing tothe size and radiation sensitivity of the crystals, data collection requiredthe use of microbeam technology7,30 in which X-ray beams are eitherfocused (ID-13 and ID23-2 beamlines, European Synchrotron Radia-tion Facility, Grenoble) or moderately focused and then further colli-mated (23ID-B GM/CA-CAT beamline, Advanced Photon Source) todiameters between 5 and 10mm. The initial images from the bestcrystals showed diffraction to 3.0 A; however, resolution was rapidlylost in sequential images from the same crystal volume. Nevertheless,we obtained a complete data set from a single crystal, and determinedthe structure by molecular replacement using immunoglobulin-domain search models for the Fab. The diffraction is anisotropic, withdiffraction extending to 3.4 A in the plane of the membrane and 3.7 Aperpendicular to the plane of the membrane.
Structure of the b2AR–Fab5 complex
Figure 2a shows the packing of the b2AR365–Fab5 complex in thecrystals. The crystals seem to be formed from stacks of two-dimensional
crystals, as previously reported for bacteriorhodopsin crystallized inbicelles31. There are few contacts between adjacent receptor moleculeswithin a bicelle layer, indicating that the receptor is monomeric in thecrystal. This is somewhat surprising considering that, in all reportedcrystals of rhodopsin, rhodopsin exists as antiparallel or paralleldimers1–7. Moreover, evidence from a variety of biochemical andbiophysical studies suggest that the b2AR and many other GPCRsexist as dimers or higher-order oligomers in the plasma membraneof cultured cells32, and there may be a role for dimers in the export ofproperly folded receptor protein from the endoplasmic reticulum32.It is important to note, however, that b2AR dimerization is notrequired for G protein activation. Purified b2AR exists as monomers,and monomeric b2AR reconstituted into recombinant high-densitylipoprotein particles couples efficiently to Gs—its preferred hetero-trimeric G protein33.
The best-resolved regions of the crystal are the Fab5 fragments andcytoplasmic ends of the transmembrane segments of the receptor(Supplementary Fig. 1). In contrast to the cytoplasmic side of thereceptor, the electron density is uninterpretable in the extracellulardomain (Supplementary Fig. 2), even though this region of tworeceptor molecules packs together in a head-to-head manner aroundthe crystallographic two-fold axis. The poor packing in this interfaceprobably explains the significant anisotropy and poor overall reso-lution of the crystals. In an effort to improve the packing of theextracellular domains, we further modified b2AR365 by inserting aTEV cleavage site after amino acid 24 (b2AR24/365, Fig. 1). However,crystals of this construct are isomorphous to those made withb2AR365, and the structure (Supplementary Table 1) is virtuallyidentical to that obtained from b2AR365–Fab5.
As expected, the overall structure of the b2AR (Fig. 2b) is similar torhodopsin, with seven transmembrane helices and an eighth helixthat runs parallel to the cytoplasmic face of the membrane. Several of
PD
HDV
T
A H MGQPN GS GF AL LAPNRS
RDEVW
VV
G GMI V M S
L I VL A I V
F G NV L V I
T A I
L HIA A G F
P V VA L G M
V L DA C A L
S T IAKF
ER L
QT
VTF Y N
MKM
WT F G
NF
WC
E WFT S I D
V L CV T A S
I E TL C V I
V DR Y F A
ITS
PF K Y Q
SLLT
KNKA
Y HWM Q I P
L F ST L G S
V I WV M L I
V RI
TA
R
EQH
NI
A
CY A
EET
CC
DF
FT
NQ YA
A I A SS I V
S F V VP L VI M V F
Y SV
I HVV I N V
I F FP L W C
L T FT G M I
G L
E YVI L L N
W I GY V N S
G F NL I YR S
QD
N LI
RK
I CR V F Q
E A KR Q L Q
K
T K L AK H E
K L C F K S
PD
FR
IA
FQ
EL
L
CL
RRS
SR
RL
TGH
G
ID
K
Q D G R
G E S
Q V EHFR
NQV L S
SL
GYAK
YG
N
G N S SE G T NG S Q
P
V H YEQEKEN K L L C E D L P G T E FD V G H
QQGG
TS P VD I N DR G Q ST S NL L S D N C
365
24
30
60
100
190
A
140
240
270
300
330
350
390
Extracellular
TM1
TM2
TM3
TM4
TM5 TM6
TM7
Intracellular
Loop 1
Loop 2
Loop 3
Loop 1Loop 2 Loop 3
Figure 1 | Schematic diagram of theb2AR. Black circles with whiteletters indicate disordered residuesnot included in the model. Greyletters and circles indicate residuesnot included in the b2AR365construct used for crystallography.Red letters indicate amino acids forwhich side-chain electron densitywas not modelled. Yellow residuesindicate amino acids implicated inligand binding from mutagenesisstudies. Orange residues indicatethe conserved DRY sequence.Green residues form the Fab5epitope, and pink residues arepacked against the Fab5 constantdomain in the lattice. Small bluecircles indicate glycosylation sites.Red lines indicate ten-amino-acidincrements.
ARTICLES NATURE | Vol 450 | 15 November 2007
384Nature ©2007 Publishing Group
Black circle: disordered residues not included in the model
Grey letter: residues not included in the β2AR365 construct used for crystallography
Red letter: amino acids for which side chain electron density was not modelled
Yellow circle: amino acids implicated in ligand binding from mutagenesis studies
Orange circle: conserved DRY sequence
Green circle: residues form the Fab5 epitope
Pink circle: residues are packed against the Fab5 constant domain in the lattice
N- and C-terminal ends of ICL3 are involved in G-protein activation and selectivity of GPCR-G-protein interaction
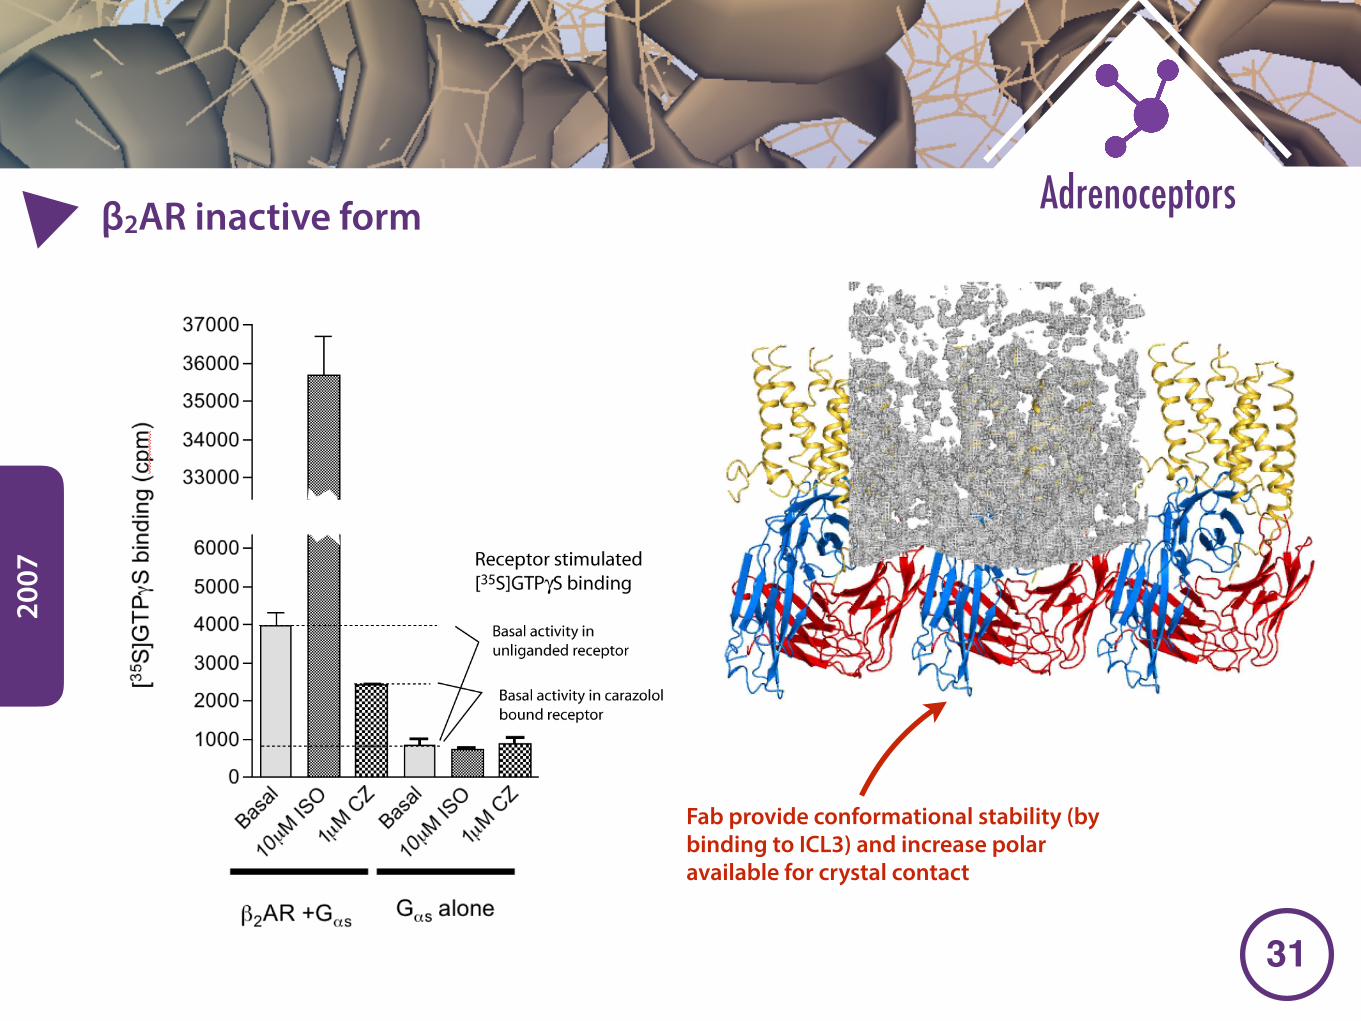
�31
Adrenoceptorsβ2AR inactive form
2007
Figure S4. Basal activity of carazolol-bound β2AR. Purified Gs was reconstituted into
phospholipid vesicles in the presence and absence of purified β2AR. [35S]GTPγS binding was
measured in the absence of ligand, the presence of the agonist isoproterenol or the inverse
agonist carazolol. Basal activity is determined relative to [35S]GTPγS binding to Gs in the
absence of β2AR.
Figure S2. Weak electron density in the extracellular region of the β2AR. The final 2Fo-Fc
map (grey mesh, contoured at 0.7σ) around two receptor molecules packed across the
crystallographic twofold (b) axis (horizontal line). The view is the same as the left panel of
Fig. 2a.
Fab provide conformational stability (by binding to ICL3) and increase polar available for crystal contact
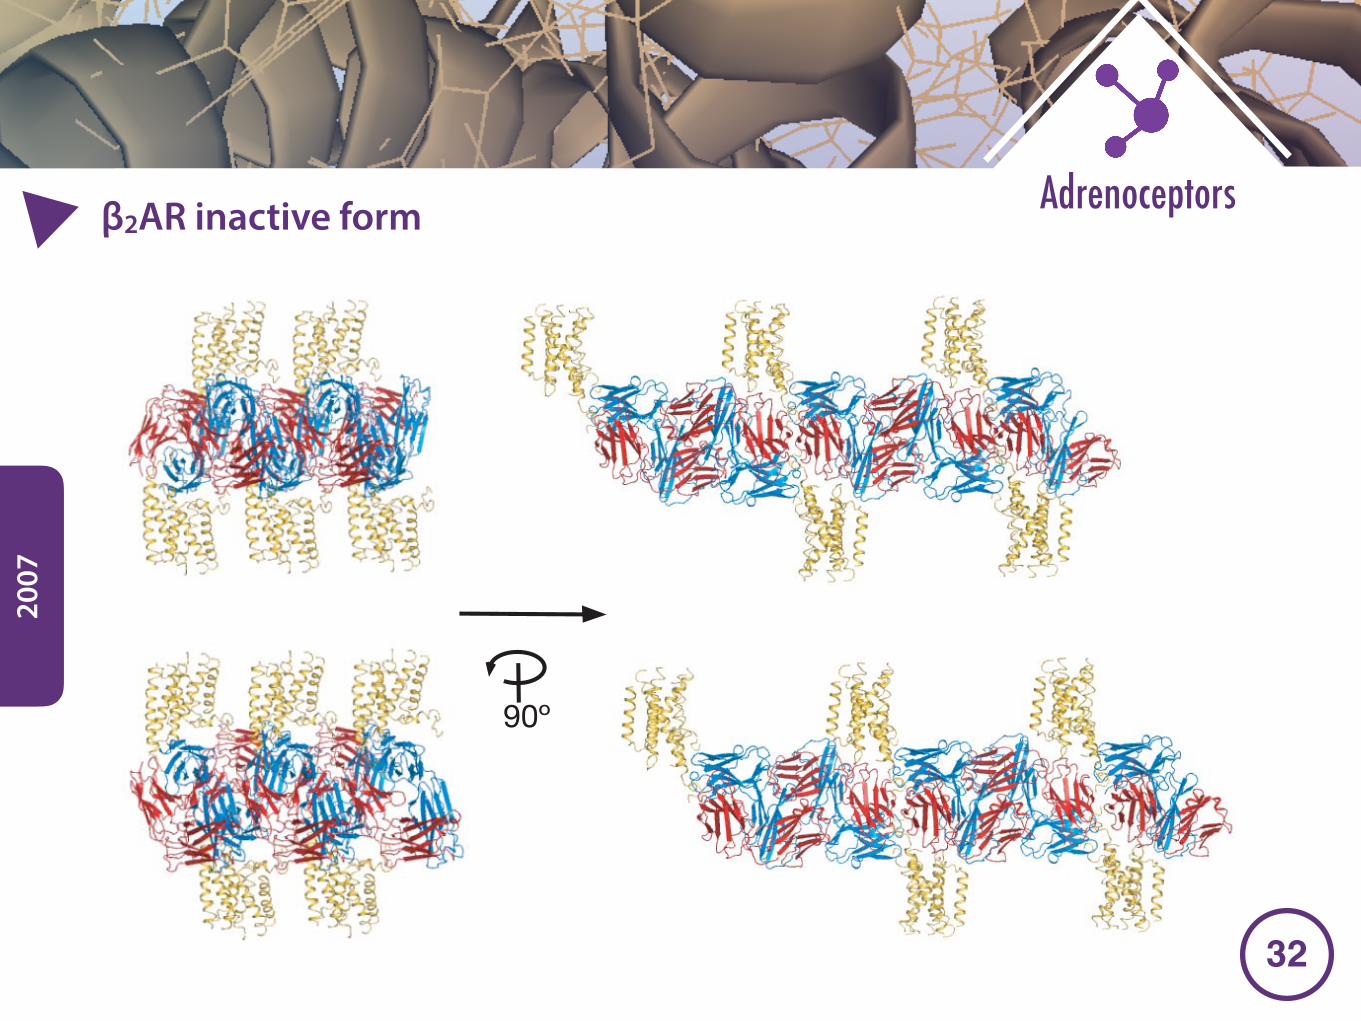
�32
Adrenoceptorsβ2AR inactive form
2007
the transmembrane helices are broken by non-helical kinks, mostprominently TM7. Residues not included in the b2AR model, owingto absent or uninterpretable electron density, are indicated in Fig. 1.In the transmembrane helices, the majority of the missing side chainsface the lipid environment. The loss of electron density occurs justabove the ligand-binding site, near the predicted lipid-water inter-face, suggesting that ligand binding and/or the lipid environmentcontributes to the order of the transmembrane segments. Specificinteractions between the variable domains of Fab5 and the b2ARoccur over a sequence of nine amino acids at the N-terminal endof intercellular loop 3 (I233–V242) and two amino acids at theC-terminal end (L266 and K270) (shown in green in Fig. 2b).Therefore, Fab5 recognizes a three-dimensional epitope on theb2AR, which is in agreement with the observation that Fab5 bindsto native, but not denatured b2AR protein28. Additional lattice con-tacts occur between the constant domain of a symmetry-related Fab5molecule and the second intracellular loop of b2AR (shown inmagenta in Fig. 2b).
Structural insights into basal activity
The ligand-binding site can be identified by an extended flat featurein the electron-density maps close to the extracellular side of thetransmembrane helices (Fig. 2b, c). This is the only large feature inresidual electron-density maps and is adjacent to Asp 113, Val 114,Phe 289, Phe 290 and Asn 312—residues identified from mutagenesisstudies as being involved in ligand binding in the b2AR9,34,35. Thisregion corresponds to the retinal-binding site of rhodopsin. Theweak electron density in this region precludes definitive modellingof carazolol. It is unlikely that the crystallization conditions resultedin dissociation of carazolol from b2AR. Carazolol bound to the b2ARhas a distinct fluorescence emission spectrum36, and b2AR crystalsand associated protein precipitate harvested from equilibratedhanging-drops showed no significant loss of carazolol binding, asdetected by fluorescence spectroscopy (data not shown).
Figure 3 shows a comparison of transmembrane segments of theb2AR superimposed with the homologous structure of rhodopsin.The root mean squared deviation for the alpha carbon backbone ofthe transmembrane segments is 1.56 A. Although the overall arrange-ment of the transmembrane segments is similar, the b2AR has a moreopen structure. The difference in the arrangement of the cytoplasmicends of the transmembrane segments of b2AR and rhodopsin mayprovide structural insights into basal receptor activity. Rhodopsinhas no detectable basal activity, a feature essential for vision. In con-trast, even when bound to the inverse agonist carazolol, the compara-tively high basal activity of the b2AR is suppressed by only 50%(Supplementary Fig. 4). Therefore, the carazolol bound b2AR is notfunctionally equivalent to dark rhodopsin. Figure 3b compares theb2AR and two rhodopsin structures at the level of the conserved(E/D)R(Y/W) sequence (found in 72% of rhodopsin family mem-bers)18. In the high-resolution structure of inactive (dark) rhodopsin,E134 and R135 in TM3 and E247 in TM6 form a network of hydrogenbonds and charge interactions referred to as the ‘ionic lock’37. Theseinteractions maintain rhodopsin in an inactive conformation. Theionic lock residues seem to have a similar role in the b2AR becausemutations of these amino acids in the b2AR or other adrenergic recep-tors lead to constitutive activity37,38. Moreover, evidence from biophys-ical studies suggests that movement of the cytoplasmic end of TM3relative to TM6 on activation is similar for theb2AR and rhodopsin17,39.However, as shown in Fig. 3b, the transmembrane segments of theb2AR have a more open structure in this region, and R131 in carazolol-bound b2AR is not close enough to E268 to form a hydrogen bond.The structure of carazolol-bound b2AR around the ionic lock is moresimilar to the structure of light-activated rhodopsin40 (Fig. 3b), inwhich R135 and E247 are separated by 4.1 A. This light-activated rho-dopsin structure may not represent the fully active conformationbecause the spectral properties of these crystals are similar, but notidentical, to those of metarhodopsin II40. Nevertheless, given the roleof TM3, TM6 and the adjacent cytoplasmic loops in G protein coup-ling, the more open structure of the b2AR may account for the residualbasal activity of the b2AR bound to the inverse agonist carazolol.
It is unlikely that the observed structural differences between theb2AR and rhodopsin are due to distortion of the b2AR owing tointeractions between Fab5 and the third intracellular loop, becausebinding of Fab5 had no effect on agonist or antagonist binding affin-ity, and does not effect agonist-induced movement of TM3 relative toTM6 (ref. 28). However, we cannot exclude the possibility that crystalpacking interactions between Fab5 and the second extracellular loop(Fig. 2b) contribute to these structural differences.
Another set of intramolecular interactions known to be importantfor minimizing the basal activity of the b2AR involves L272 in TM6.Mutation of L272 to alanine was the first reported constitutivelyactive mutant of the b2AR41. As seen in Fig. 4, L272 forms extensivevan der Waals interactions with I135 in TM3; V222 and Y219 in TM5;and Y141 in intracellular loop 2 (Fig. 4, and Supplementary Fig. 5).Because L272 is adjacent to E268, disruption of the packing inter-actions by mutation to alanine may have an effect similar to
a
b
TM5TM6
TM7
TM1
TM2
TM3
TM5
TM6
TM7
TM1
TM2
TM3
TM4
HN
OH
H
O
N
Carazolol
F289
F290
N312D113
V114
90º
90º
c
TM3
TM6
Figure 2 | Structure of the b2AR365–Fab5 complex. a, Packing of theb2AR365–Fab5 complex in crystals formed in DMPC bicelles (b2AR, gold;heavy chain, blue; light chain, red). b, Structure of the b2AR showing sites ofthe interactions with Fab5. Sites of specific (idiotypic) interactions betweenFab5 and the b2AR are shown in green. Sites of interactions between theb2AR and the constant region of Fab5 of the symmetry mate are shown inmagenta. Dotted grey lines indicate predicted membrane boundaries. Solidblack lines indicate extracellular connections between transmembranesegments. c, FO–FC map contoured at 2.0 s and surrounded by residuesknown to be involved in ligand binding. The chemical structure of carazolol,the bound ligand, is shown on the right.
NATURE | Vol 450 | 15 November 2007 ARTICLES
385Nature ©2007 Publishing Group
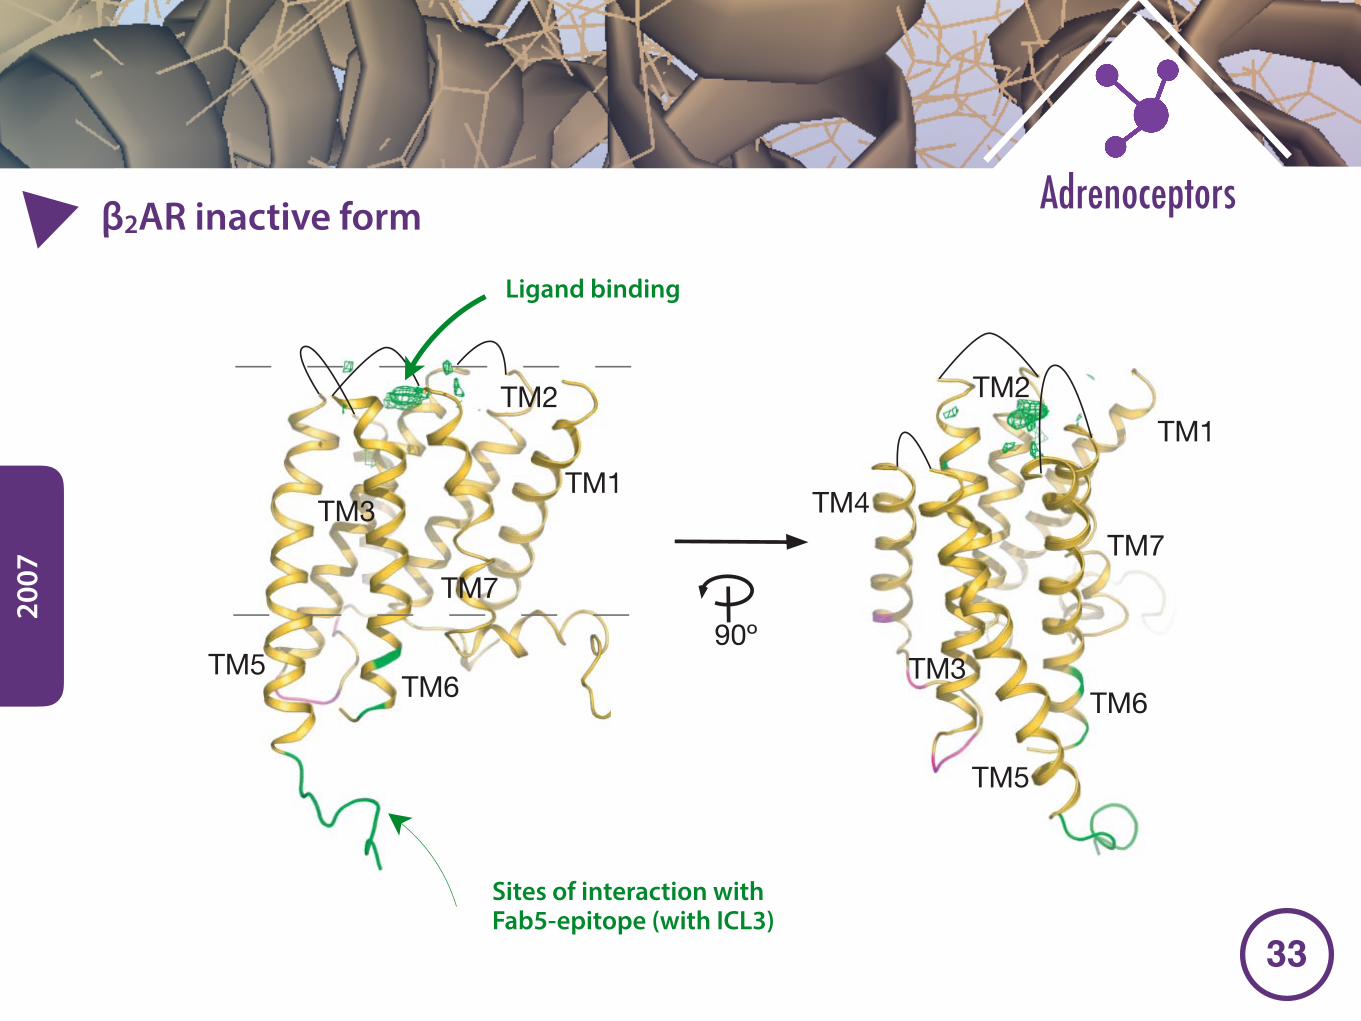
�33
Adrenoceptorsβ2AR inactive form
2007
the transmembrane helices are broken by non-helical kinks, mostprominently TM7. Residues not included in the b2AR model, owingto absent or uninterpretable electron density, are indicated in Fig. 1.In the transmembrane helices, the majority of the missing side chainsface the lipid environment. The loss of electron density occurs justabove the ligand-binding site, near the predicted lipid-water inter-face, suggesting that ligand binding and/or the lipid environmentcontributes to the order of the transmembrane segments. Specificinteractions between the variable domains of Fab5 and the b2ARoccur over a sequence of nine amino acids at the N-terminal endof intercellular loop 3 (I233–V242) and two amino acids at theC-terminal end (L266 and K270) (shown in green in Fig. 2b).Therefore, Fab5 recognizes a three-dimensional epitope on theb2AR, which is in agreement with the observation that Fab5 bindsto native, but not denatured b2AR protein28. Additional lattice con-tacts occur between the constant domain of a symmetry-related Fab5molecule and the second intracellular loop of b2AR (shown inmagenta in Fig. 2b).
Structural insights into basal activity
The ligand-binding site can be identified by an extended flat featurein the electron-density maps close to the extracellular side of thetransmembrane helices (Fig. 2b, c). This is the only large feature inresidual electron-density maps and is adjacent to Asp 113, Val 114,Phe 289, Phe 290 and Asn 312—residues identified from mutagenesisstudies as being involved in ligand binding in the b2AR9,34,35. Thisregion corresponds to the retinal-binding site of rhodopsin. Theweak electron density in this region precludes definitive modellingof carazolol. It is unlikely that the crystallization conditions resultedin dissociation of carazolol from b2AR. Carazolol bound to the b2ARhas a distinct fluorescence emission spectrum36, and b2AR crystalsand associated protein precipitate harvested from equilibratedhanging-drops showed no significant loss of carazolol binding, asdetected by fluorescence spectroscopy (data not shown).
Figure 3 shows a comparison of transmembrane segments of theb2AR superimposed with the homologous structure of rhodopsin.The root mean squared deviation for the alpha carbon backbone ofthe transmembrane segments is 1.56 A. Although the overall arrange-ment of the transmembrane segments is similar, the b2AR has a moreopen structure. The difference in the arrangement of the cytoplasmicends of the transmembrane segments of b2AR and rhodopsin mayprovide structural insights into basal receptor activity. Rhodopsinhas no detectable basal activity, a feature essential for vision. In con-trast, even when bound to the inverse agonist carazolol, the compara-tively high basal activity of the b2AR is suppressed by only 50%(Supplementary Fig. 4). Therefore, the carazolol bound b2AR is notfunctionally equivalent to dark rhodopsin. Figure 3b compares theb2AR and two rhodopsin structures at the level of the conserved(E/D)R(Y/W) sequence (found in 72% of rhodopsin family mem-bers)18. In the high-resolution structure of inactive (dark) rhodopsin,E134 and R135 in TM3 and E247 in TM6 form a network of hydrogenbonds and charge interactions referred to as the ‘ionic lock’37. Theseinteractions maintain rhodopsin in an inactive conformation. Theionic lock residues seem to have a similar role in the b2AR becausemutations of these amino acids in the b2AR or other adrenergic recep-tors lead to constitutive activity37,38. Moreover, evidence from biophys-ical studies suggests that movement of the cytoplasmic end of TM3relative to TM6 on activation is similar for theb2AR and rhodopsin17,39.However, as shown in Fig. 3b, the transmembrane segments of theb2AR have a more open structure in this region, and R131 in carazolol-bound b2AR is not close enough to E268 to form a hydrogen bond.The structure of carazolol-bound b2AR around the ionic lock is moresimilar to the structure of light-activated rhodopsin40 (Fig. 3b), inwhich R135 and E247 are separated by 4.1 A. This light-activated rho-dopsin structure may not represent the fully active conformationbecause the spectral properties of these crystals are similar, but notidentical, to those of metarhodopsin II40. Nevertheless, given the roleof TM3, TM6 and the adjacent cytoplasmic loops in G protein coup-ling, the more open structure of the b2AR may account for the residualbasal activity of the b2AR bound to the inverse agonist carazolol.
It is unlikely that the observed structural differences between theb2AR and rhodopsin are due to distortion of the b2AR owing tointeractions between Fab5 and the third intracellular loop, becausebinding of Fab5 had no effect on agonist or antagonist binding affin-ity, and does not effect agonist-induced movement of TM3 relative toTM6 (ref. 28). However, we cannot exclude the possibility that crystalpacking interactions between Fab5 and the second extracellular loop(Fig. 2b) contribute to these structural differences.
Another set of intramolecular interactions known to be importantfor minimizing the basal activity of the b2AR involves L272 in TM6.Mutation of L272 to alanine was the first reported constitutivelyactive mutant of the b2AR41. As seen in Fig. 4, L272 forms extensivevan der Waals interactions with I135 in TM3; V222 and Y219 in TM5;and Y141 in intracellular loop 2 (Fig. 4, and Supplementary Fig. 5).Because L272 is adjacent to E268, disruption of the packing inter-actions by mutation to alanine may have an effect similar to
a
b
TM5TM6
TM7
TM1
TM2
TM3
TM5
TM6
TM7
TM1
TM2
TM3
TM4
HN
OH
H
O
N
Carazolol
F289
F290
N312D113
V114
90º
90º
c
TM3
TM6
Figure 2 | Structure of the b2AR365–Fab5 complex. a, Packing of theb2AR365–Fab5 complex in crystals formed in DMPC bicelles (b2AR, gold;heavy chain, blue; light chain, red). b, Structure of the b2AR showing sites ofthe interactions with Fab5. Sites of specific (idiotypic) interactions betweenFab5 and the b2AR are shown in green. Sites of interactions between theb2AR and the constant region of Fab5 of the symmetry mate are shown inmagenta. Dotted grey lines indicate predicted membrane boundaries. Solidblack lines indicate extracellular connections between transmembranesegments. c, FO–FC map contoured at 2.0 s and surrounded by residuesknown to be involved in ligand binding. The chemical structure of carazolol,the bound ligand, is shown on the right.
NATURE | Vol 450 | 15 November 2007 ARTICLES
385Nature ©2007 Publishing Group
Ligand binding
Sites of interaction with Fab5-epitope (with ICL3)
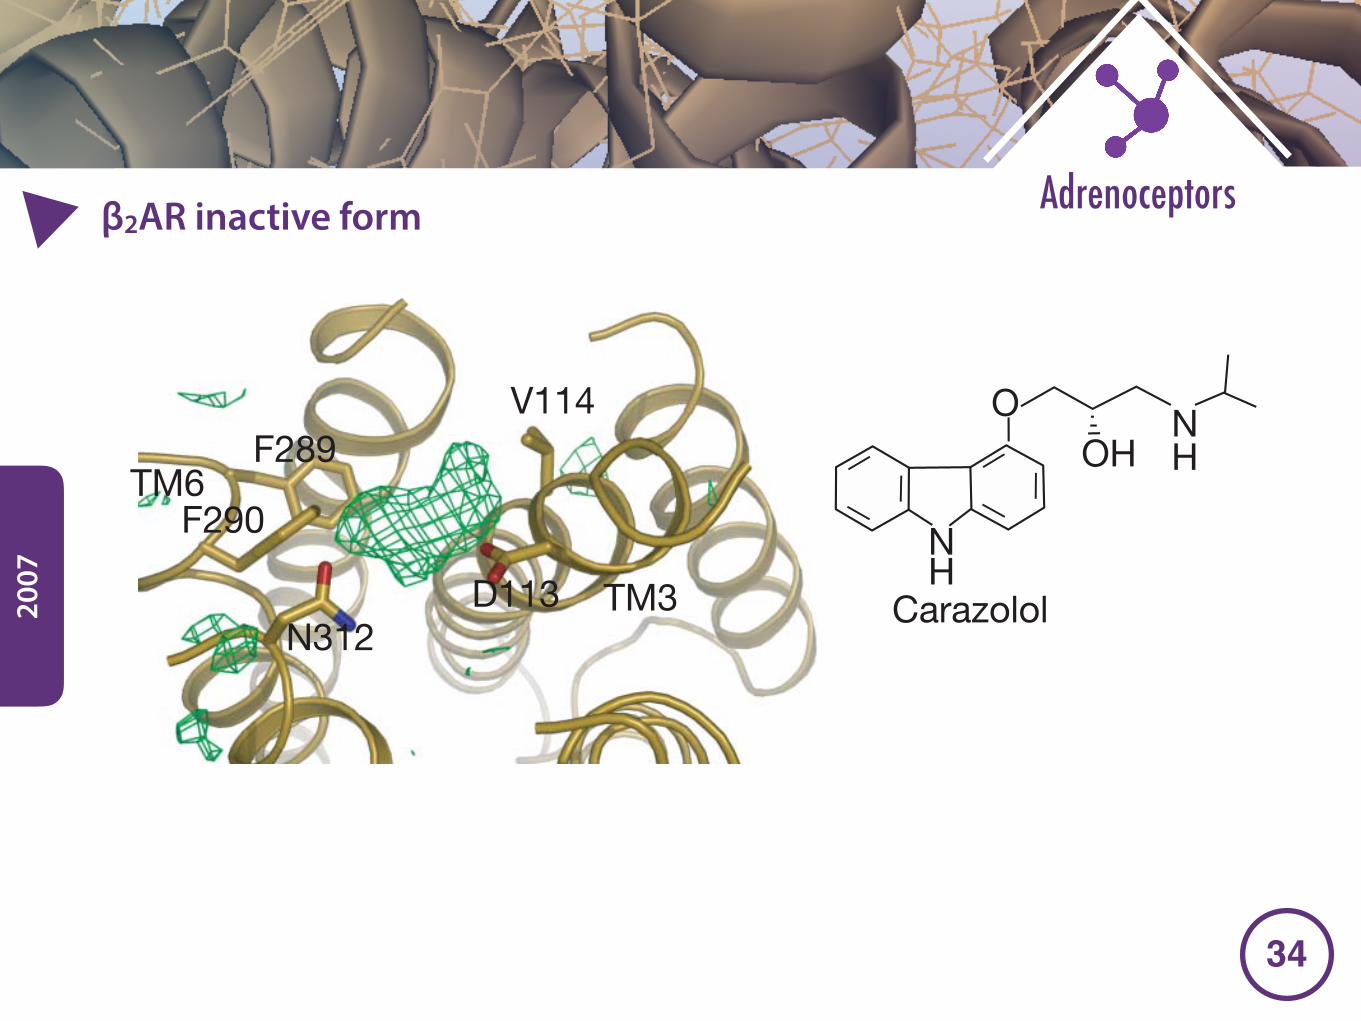
�34
Adrenoceptorsβ2AR inactive form
2007
the transmembrane helices are broken by non-helical kinks, mostprominently TM7. Residues not included in the b2AR model, owingto absent or uninterpretable electron density, are indicated in Fig. 1.In the transmembrane helices, the majority of the missing side chainsface the lipid environment. The loss of electron density occurs justabove the ligand-binding site, near the predicted lipid-water inter-face, suggesting that ligand binding and/or the lipid environmentcontributes to the order of the transmembrane segments. Specificinteractions between the variable domains of Fab5 and the b2ARoccur over a sequence of nine amino acids at the N-terminal endof intercellular loop 3 (I233–V242) and two amino acids at theC-terminal end (L266 and K270) (shown in green in Fig. 2b).Therefore, Fab5 recognizes a three-dimensional epitope on theb2AR, which is in agreement with the observation that Fab5 bindsto native, but not denatured b2AR protein28. Additional lattice con-tacts occur between the constant domain of a symmetry-related Fab5molecule and the second intracellular loop of b2AR (shown inmagenta in Fig. 2b).
Structural insights into basal activity
The ligand-binding site can be identified by an extended flat featurein the electron-density maps close to the extracellular side of thetransmembrane helices (Fig. 2b, c). This is the only large feature inresidual electron-density maps and is adjacent to Asp 113, Val 114,Phe 289, Phe 290 and Asn 312—residues identified from mutagenesisstudies as being involved in ligand binding in the b2AR9,34,35. Thisregion corresponds to the retinal-binding site of rhodopsin. Theweak electron density in this region precludes definitive modellingof carazolol. It is unlikely that the crystallization conditions resultedin dissociation of carazolol from b2AR. Carazolol bound to the b2ARhas a distinct fluorescence emission spectrum36, and b2AR crystalsand associated protein precipitate harvested from equilibratedhanging-drops showed no significant loss of carazolol binding, asdetected by fluorescence spectroscopy (data not shown).
Figure 3 shows a comparison of transmembrane segments of theb2AR superimposed with the homologous structure of rhodopsin.The root mean squared deviation for the alpha carbon backbone ofthe transmembrane segments is 1.56 A. Although the overall arrange-ment of the transmembrane segments is similar, the b2AR has a moreopen structure. The difference in the arrangement of the cytoplasmicends of the transmembrane segments of b2AR and rhodopsin mayprovide structural insights into basal receptor activity. Rhodopsinhas no detectable basal activity, a feature essential for vision. In con-trast, even when bound to the inverse agonist carazolol, the compara-tively high basal activity of the b2AR is suppressed by only 50%(Supplementary Fig. 4). Therefore, the carazolol bound b2AR is notfunctionally equivalent to dark rhodopsin. Figure 3b compares theb2AR and two rhodopsin structures at the level of the conserved(E/D)R(Y/W) sequence (found in 72% of rhodopsin family mem-bers)18. In the high-resolution structure of inactive (dark) rhodopsin,E134 and R135 in TM3 and E247 in TM6 form a network of hydrogenbonds and charge interactions referred to as the ‘ionic lock’37. Theseinteractions maintain rhodopsin in an inactive conformation. Theionic lock residues seem to have a similar role in the b2AR becausemutations of these amino acids in the b2AR or other adrenergic recep-tors lead to constitutive activity37,38. Moreover, evidence from biophys-ical studies suggests that movement of the cytoplasmic end of TM3relative to TM6 on activation is similar for theb2AR and rhodopsin17,39.However, as shown in Fig. 3b, the transmembrane segments of theb2AR have a more open structure in this region, and R131 in carazolol-bound b2AR is not close enough to E268 to form a hydrogen bond.The structure of carazolol-bound b2AR around the ionic lock is moresimilar to the structure of light-activated rhodopsin40 (Fig. 3b), inwhich R135 and E247 are separated by 4.1 A. This light-activated rho-dopsin structure may not represent the fully active conformationbecause the spectral properties of these crystals are similar, but notidentical, to those of metarhodopsin II40. Nevertheless, given the roleof TM3, TM6 and the adjacent cytoplasmic loops in G protein coup-ling, the more open structure of the b2AR may account for the residualbasal activity of the b2AR bound to the inverse agonist carazolol.
It is unlikely that the observed structural differences between theb2AR and rhodopsin are due to distortion of the b2AR owing tointeractions between Fab5 and the third intracellular loop, becausebinding of Fab5 had no effect on agonist or antagonist binding affin-ity, and does not effect agonist-induced movement of TM3 relative toTM6 (ref. 28). However, we cannot exclude the possibility that crystalpacking interactions between Fab5 and the second extracellular loop(Fig. 2b) contribute to these structural differences.
Another set of intramolecular interactions known to be importantfor minimizing the basal activity of the b2AR involves L272 in TM6.Mutation of L272 to alanine was the first reported constitutivelyactive mutant of the b2AR41. As seen in Fig. 4, L272 forms extensivevan der Waals interactions with I135 in TM3; V222 and Y219 in TM5;and Y141 in intracellular loop 2 (Fig. 4, and Supplementary Fig. 5).Because L272 is adjacent to E268, disruption of the packing inter-actions by mutation to alanine may have an effect similar to
a
b
TM5TM6
TM7
TM1
TM2
TM3
TM5
TM6
TM7
TM1
TM2
TM3
TM4
HN
OH
H
O
N
Carazolol
F289
F290
N312D113
V114
90º
90º
c
TM3
TM6
Figure 2 | Structure of the b2AR365–Fab5 complex. a, Packing of theb2AR365–Fab5 complex in crystals formed in DMPC bicelles (b2AR, gold;heavy chain, blue; light chain, red). b, Structure of the b2AR showing sites ofthe interactions with Fab5. Sites of specific (idiotypic) interactions betweenFab5 and the b2AR are shown in green. Sites of interactions between theb2AR and the constant region of Fab5 of the symmetry mate are shown inmagenta. Dotted grey lines indicate predicted membrane boundaries. Solidblack lines indicate extracellular connections between transmembranesegments. c, FO–FC map contoured at 2.0 s and surrounded by residuesknown to be involved in ligand binding. The chemical structure of carazolol,the bound ligand, is shown on the right.
NATURE | Vol 450 | 15 November 2007 ARTICLES
385Nature ©2007 Publishing Group
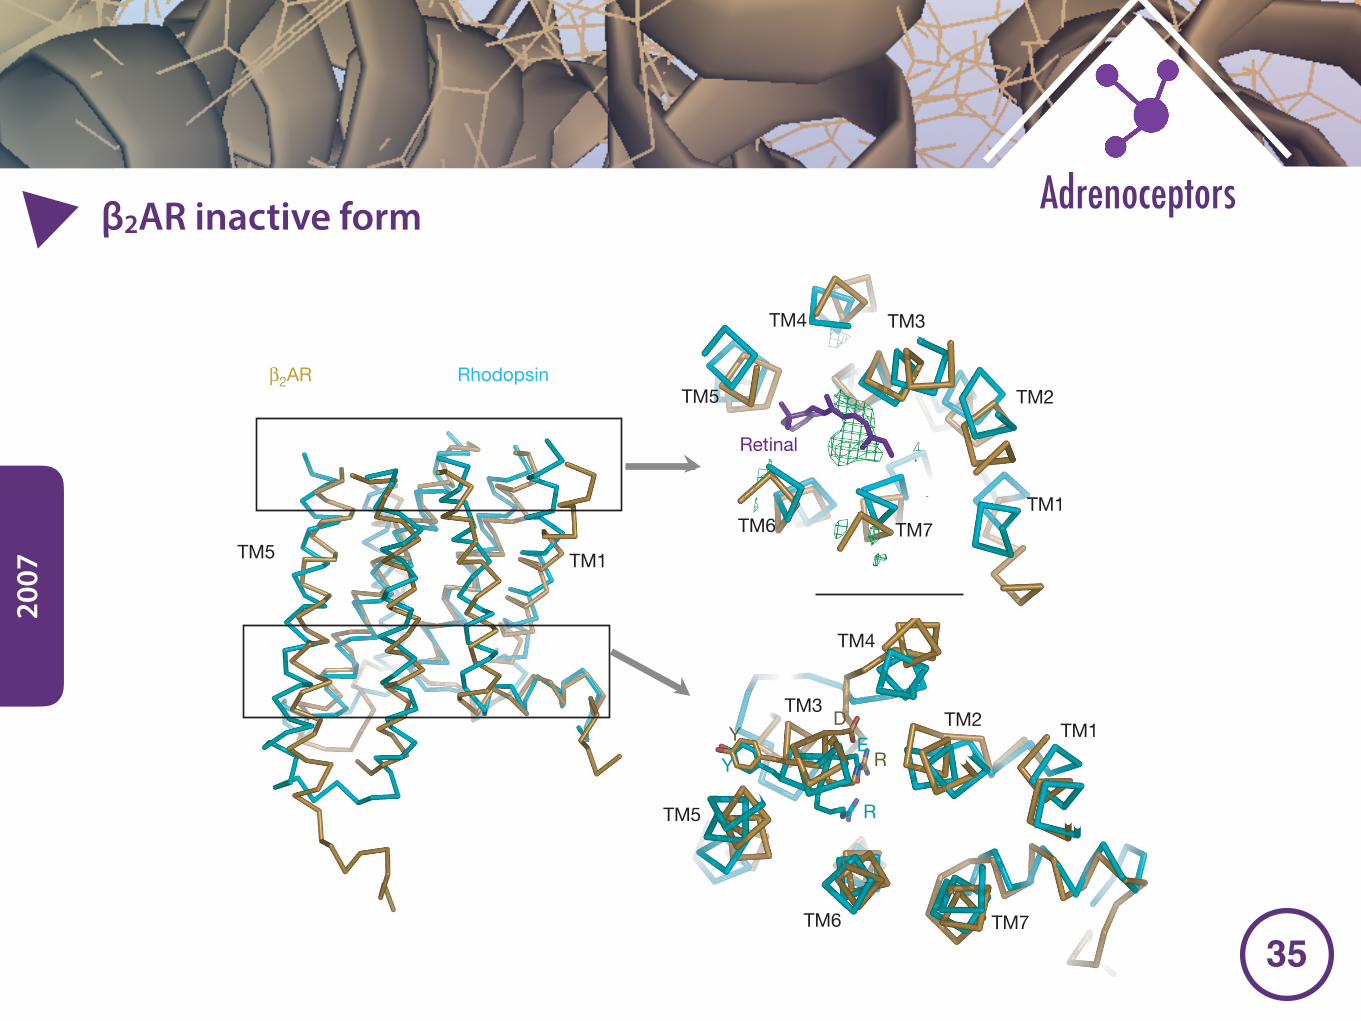
�35
Adrenoceptorsβ2AR inactive form
2007
disruption of the ionic lock in rhodopsin. It is likely that this muta-tion would produce a more loosely packed, dynamic structure in thisregion, shifting the equilibrium towards a more active state.
It is interesting that packing interactions around L272 are observedwhile the ionic lock interactions are absent. Because mutation ofeither E268 or L272 leads to elevated basal activity, it is likely thatboth are involved in maintaining the basal state of the receptor. Fromthe current structure, we can conclude that formation of the ioniclock and the tight packing of L272 are not interdependent, and mighteven be structurally incompatible. It is possible that the ionic lock andL272 interactions stabilize two of several distinct substates in theunliganded b2AR, and that these two substates have lower activitytowards Gs than the others. Carazolol binding may further stabilizethe substate that favours packing around L272, and therefore reducebasal activity relative to the ensemble of substates in the unligandedreceptor. The residual activity in the carazolol-bound receptor maybe due to the failure to stabilize ionic lock interactions.
The limitations of this crystal structure of the b2AR can be attri-buted to the poor crystal packing and the inherent structural flex-ibility of this GPCR relative to rhodopsin. Different crystallographicapproaches will be needed to stabilize and visualize the extracellulardomain and provide a more detailed picture of extracellular loops aswell as the ligand-binding site. Nevertheless, this structure of theb2AR in a lipid environment provides structural insights into thebasis of basal activity, a feature of many GPCRs that may have bothphysiologic and therapeutic relevance.
METHODS SUMMARYb2AR was expressed in Sf9 insect cells using recombinant baculovirus. Sf9 cellmembranes were solubilized in dodecylmaltoside and purified by sequentialantibody and ligand affinity chromatography. Fab5 was generated by papaindigestion of Mab5 and purified by ion-exchange chromatography. The b2AR–Fab5 complex was formed by mixing purified b2AR with a stoichiometric
TM3
TM1
TM4
TM6
TM5 TM2
TM7
TM3
TM4
TM5
TM1
TM6
TM2
TM7
TM5 TM1
Retinal
D
RY E
R
Y
β2AR Rhodopsin
β2AR Inactive rhodopsin
a
b
Light-activated rhodopsin
TM6
TM3
TM2
E268D130
R131
TM6TM3
TM2
E247
R135
E1342.9 Å6.2 Å
TM6TM3
TM2
E247
R135
E1344.1 Å
Figure 3 | Comparison of b2AR and rhodopsinstructures. a, The b2AR is superimposed withthe homologous structure of rhodopsin6. Retinalis shown in purple and the electron density in theputative ligand-binding site is shown as a greenmesh. Structures were aligned using all seventransmembrane segments. The right panelsrepresent cross-sections that are rotated 90uaround the horizontal axis and viewed from theextracellular face of the receptor. b, Comparisonof the b2AR with structures of inactive rhodopsinand light-activated rhodopsin around theconserved E/DRY sequence in TM3. A dashedline shows the distance between the homologousarginine in TM3 and glutamate in TM6. Tofacilitate comparison of the E/DRY regions, thestructures were aligned by superimposing TM3only.
L272
Y141
I135
V222
Y219
L275
TM5
TM3
TM6
Figure 4 | Side-chain interactions between Leu 272 and residues in TM3,TM5 and intracellular loop 2. Packing interactions are reflected in lowerB-factors for these amino acids. The average B value of residues 135, 141, 219,222, 272 and 275 is 117 A2, compared to 157 A2 for the receptor as a whole.
ARTICLES NATURE | Vol 450 | 15 November 2007
386Nature ©2007 Publishing Group
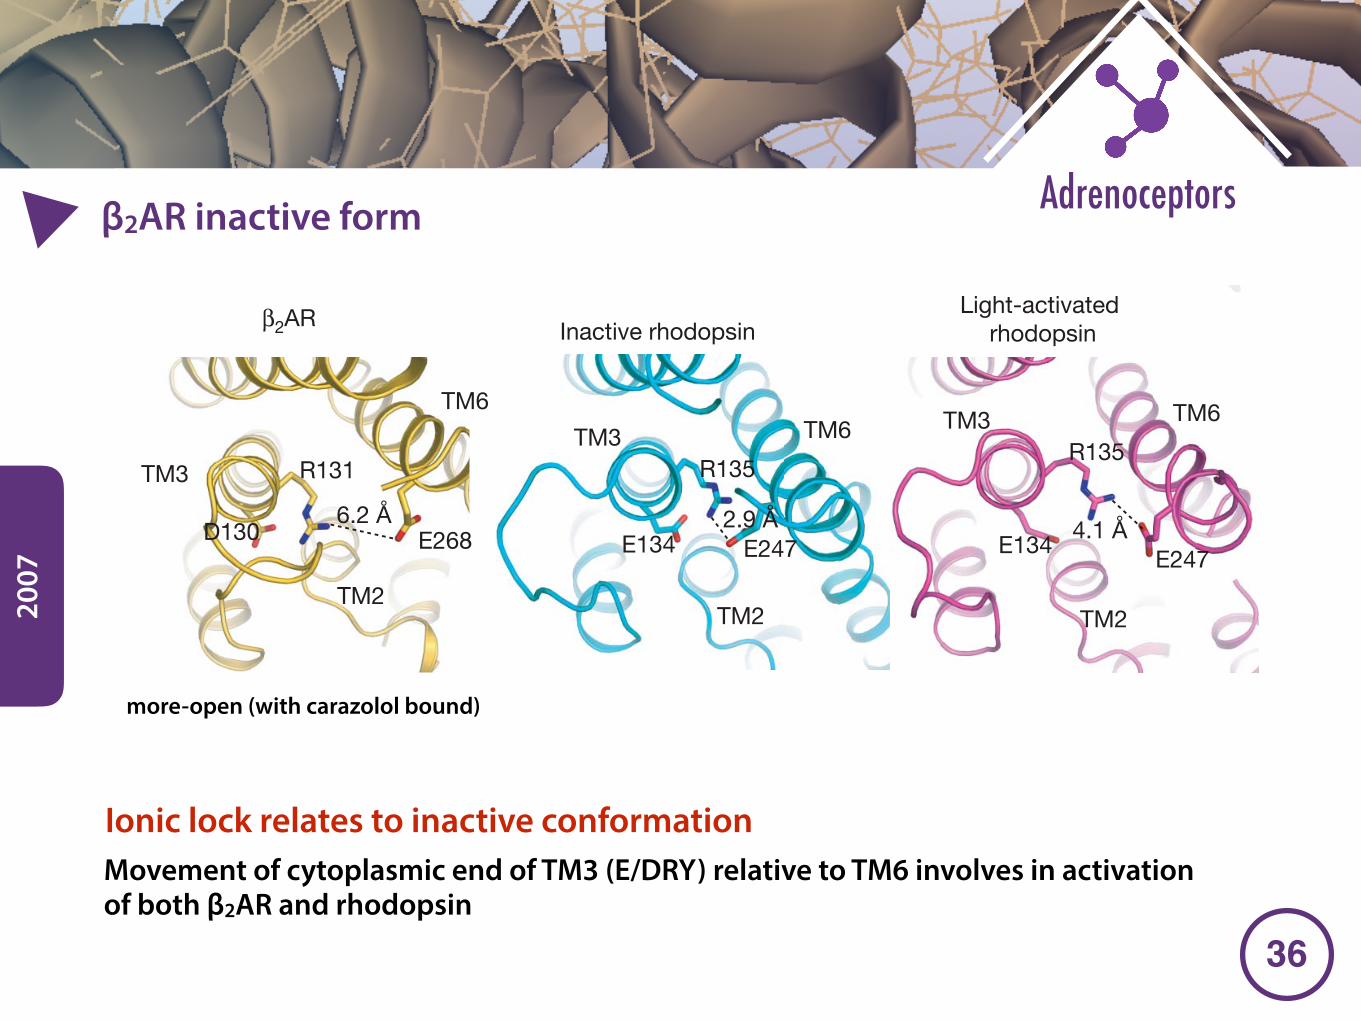
�36
Adrenoceptorsβ2AR inactive form
2007
disruption of the ionic lock in rhodopsin. It is likely that this muta-tion would produce a more loosely packed, dynamic structure in thisregion, shifting the equilibrium towards a more active state.
It is interesting that packing interactions around L272 are observedwhile the ionic lock interactions are absent. Because mutation ofeither E268 or L272 leads to elevated basal activity, it is likely thatboth are involved in maintaining the basal state of the receptor. Fromthe current structure, we can conclude that formation of the ioniclock and the tight packing of L272 are not interdependent, and mighteven be structurally incompatible. It is possible that the ionic lock andL272 interactions stabilize two of several distinct substates in theunliganded b2AR, and that these two substates have lower activitytowards Gs than the others. Carazolol binding may further stabilizethe substate that favours packing around L272, and therefore reducebasal activity relative to the ensemble of substates in the unligandedreceptor. The residual activity in the carazolol-bound receptor maybe due to the failure to stabilize ionic lock interactions.
The limitations of this crystal structure of the b2AR can be attri-buted to the poor crystal packing and the inherent structural flex-ibility of this GPCR relative to rhodopsin. Different crystallographicapproaches will be needed to stabilize and visualize the extracellulardomain and provide a more detailed picture of extracellular loops aswell as the ligand-binding site. Nevertheless, this structure of theb2AR in a lipid environment provides structural insights into thebasis of basal activity, a feature of many GPCRs that may have bothphysiologic and therapeutic relevance.
METHODS SUMMARYb2AR was expressed in Sf9 insect cells using recombinant baculovirus. Sf9 cellmembranes were solubilized in dodecylmaltoside and purified by sequentialantibody and ligand affinity chromatography. Fab5 was generated by papaindigestion of Mab5 and purified by ion-exchange chromatography. The b2AR–Fab5 complex was formed by mixing purified b2AR with a stoichiometric
TM3
TM1
TM4
TM6
TM5 TM2
TM7
TM3
TM4
TM5
TM1
TM6
TM2
TM7
TM5 TM1
Retinal
D
RY E
R
Y
β2AR Rhodopsin
β2AR Inactive rhodopsin
a
b
Light-activated rhodopsin
TM6
TM3
TM2
E268D130
R131
TM6TM3
TM2
E247
R135
E1342.9 Å6.2 Å
TM6TM3
TM2
E247
R135
E1344.1 Å
Figure 3 | Comparison of b2AR and rhodopsinstructures. a, The b2AR is superimposed withthe homologous structure of rhodopsin6. Retinalis shown in purple and the electron density in theputative ligand-binding site is shown as a greenmesh. Structures were aligned using all seventransmembrane segments. The right panelsrepresent cross-sections that are rotated 90uaround the horizontal axis and viewed from theextracellular face of the receptor. b, Comparisonof the b2AR with structures of inactive rhodopsinand light-activated rhodopsin around theconserved E/DRY sequence in TM3. A dashedline shows the distance between the homologousarginine in TM3 and glutamate in TM6. Tofacilitate comparison of the E/DRY regions, thestructures were aligned by superimposing TM3only.
L272
Y141
I135
V222
Y219
L275
TM5
TM3
TM6
Figure 4 | Side-chain interactions between Leu 272 and residues in TM3,TM5 and intracellular loop 2. Packing interactions are reflected in lowerB-factors for these amino acids. The average B value of residues 135, 141, 219,222, 272 and 275 is 117 A2, compared to 157 A2 for the receptor as a whole.
ARTICLES NATURE | Vol 450 | 15 November 2007
386Nature ©2007 Publishing Group
Ionic lock relates to inactive conformationMovement of cytoplasmic end of TM3 (E/DRY) relative to TM6 involves in activation of both β2AR and rhodopsin
more-open (with carazolol bound)
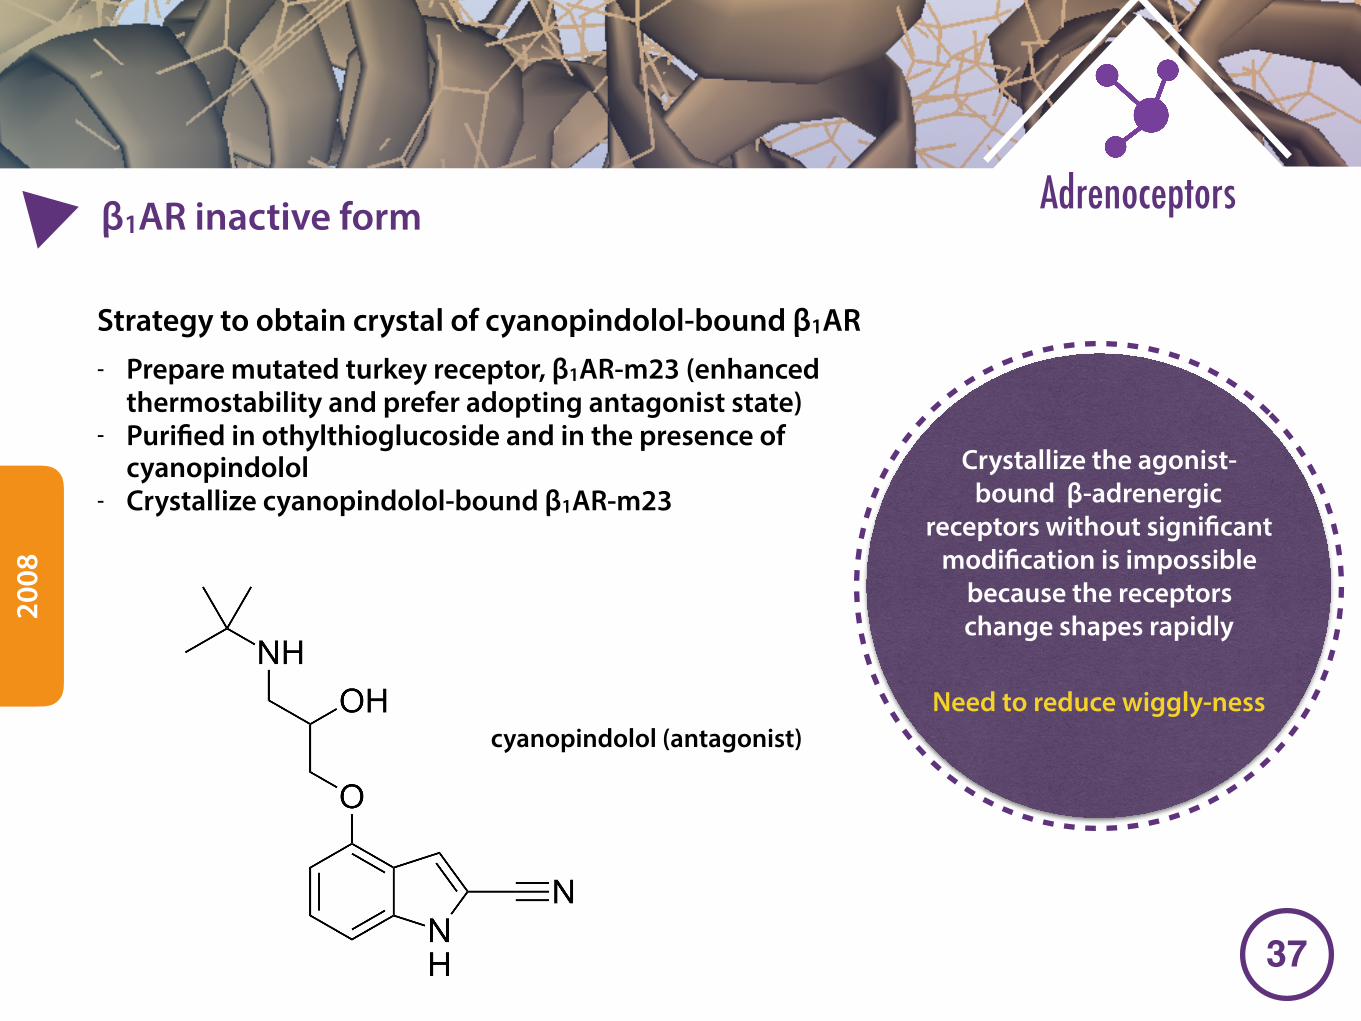
�37
Adrenoceptorsβ1AR inactive form
2008
Crystallize the agonist-bound β-adrenergic
receptors without significant modification is impossible
because the receptors change shapes rapidly
Need to reduce wiggly-ness
Strategy to obtain crystal of cyanopindolol-bound β1AR- Prepare mutated turkey receptor, β1AR-m23 (enhanced
thermostability and prefer adopting antagonist state) - Purified in othylthioglucoside and in the presence of
cyanopindolol - Crystallize cyanopindolol-bound β1AR-m23
cyanopindolol (antagonist)
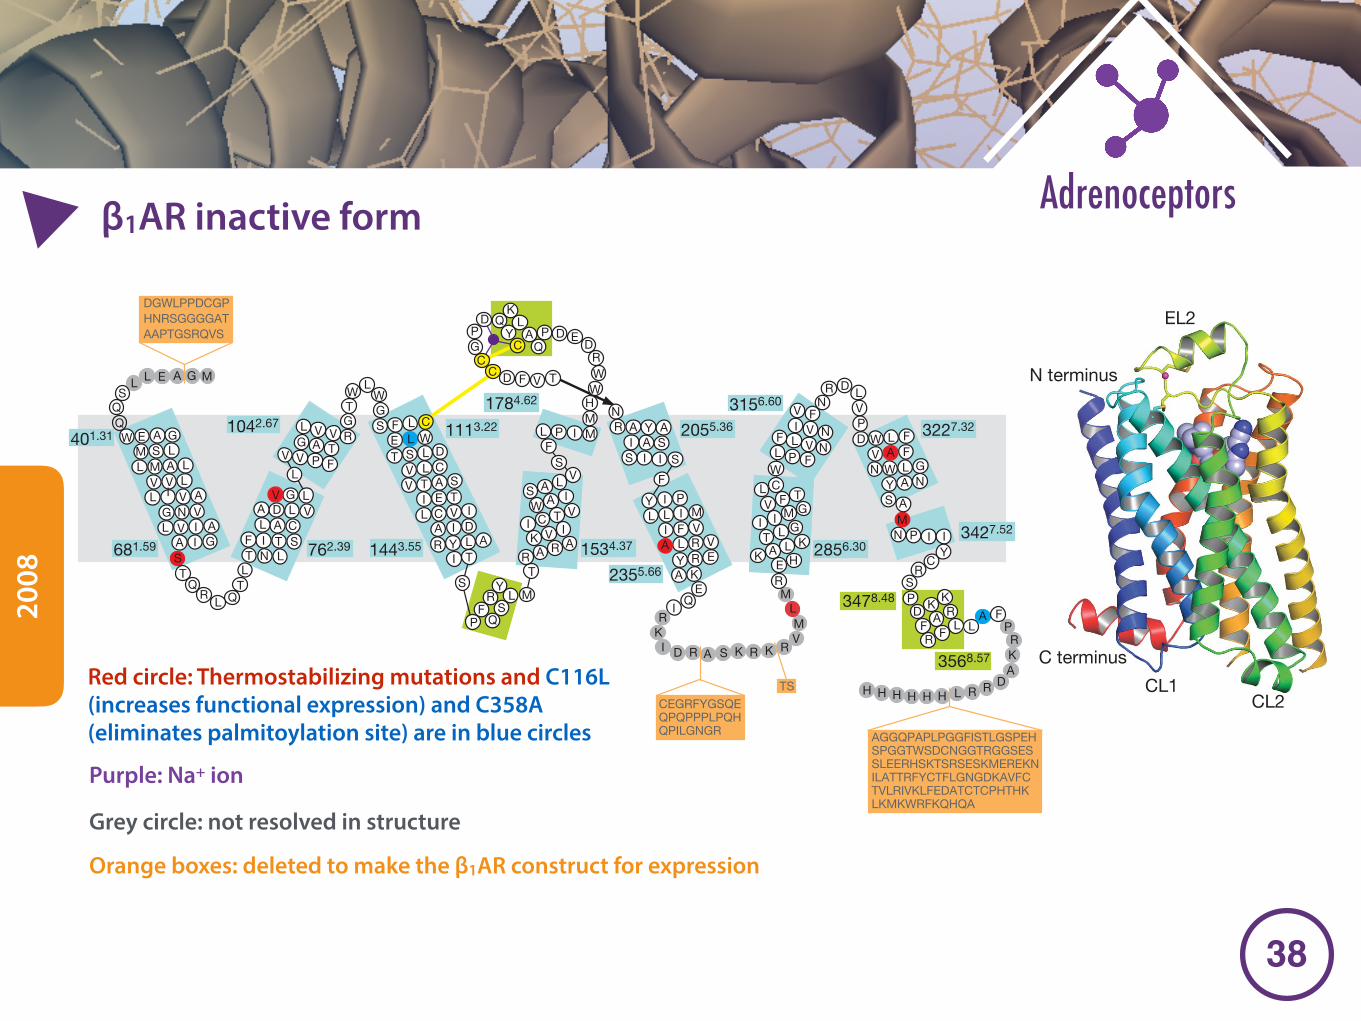
�38
Adrenoceptorsβ1AR inactive form
2008
more weakly by a factor of 2,470 and 650, respectively15. This reflects achange in the R to R* equilibrium of the receptor towards the anta-gonist R state. From this we predicted that, in a G-protein-couplingassay, the receptor would show no basal activity and that the con-centration of agonist required for signalling would be orders of mag-nitude higher. Signalling assays were performed on stable cell linesexpressing the wild-type b1AR truncated at the N and C termini(b1ARtrunc) and also containing the six thermostabilizing mutations(m23) (Supplementary Fig. 3).b1ARtrunc-m23 coupled efficiently toG proteins and elicited a robust stimulation of cAMP-responsivereporter gene, although the agonist concentration response curve,as expected, was shifted to the right16. The drug ICI 118551, aninverse agonist for both b1AR17 and b2AR18, showed no reductionin the basal level of cAMP when added at a concentration 100-foldabove its inhibition constant (Ki) to cells containing b1ARtrunc-m23, implying there is negligible basal constitutive activity. Thestructure we have determined contains the very high affinity anta-gonist cyanopindolol in the binding pocket and represents closely theinactive conformation with respect to G-protein coupling.
Overall structure and the extracellular loops
The structure was solved by molecular replacement to 2.7 A resolutionwith an Rwork of 0.212 and an Rfree of 0.268 (Supplementary Table 1).The four receptor molecules in the unit cell, labelled A–D(Supplementary Figs 4–6), were all very similar except that moleculesA and D both had a 60u kink in helix 1 (H1). Also modelled were 31water molecules, 4 Na1 ions and 14 detergent molecules (seeSupplementary Information). Unless otherwise stated, all further dis-cussion refers to molecule B, because this molecule has an unkinkedH1 and a relatively well-ordered H8. The helix boundaries, disorderedregions and overall structural motifs are presented in Fig. 1.
The amino acid sequence of turkey b1AR19 is 82% and 67% iden-tical to human b1AR and human b2AR, respectively, over residuesTrp401.31–Asp2425.73 and Glu2856.30–Cys358H8-Cterm (that is,excluding the N and C termini and most of CL3); it is thereforeexpected that the structure of the transmembrane regions of b1AR
andb2AR should be very similar. Our superposition ofb2AR (ProteinData Bank, PDB, code 2RH1) and b1AR (chain B) is based on selectedresidues in H3, H5, H6 and H7 because we were particularly intere-sted in comparing the ligand-binding pockets; 78 Ca atoms can besuperimposed with a root mean square deviation (r.m.s.d.) of 0.25 A.The r.m.s.d. over all transmembrane helices is 0.7 A (269 Ca atoms;Supplementary Fig. 7). Comparison of the structures of b1AR andb2AR reveals no evidence for any significant changes in backboneconformation at the sites of the six point mutants introduced15 tostabilize b1AR. This is consistent with the observation that b1AR-m23 binds antagonists with similar affinities to the wild-type recep-tor15 and that it can couple efficiently to G proteins, although athigher agonist concentration (Supplementary Fig. 3). The basis forthe thermostabilization by the six mutations R681.59S, M902.53V,Y2275.58A, A2826.27L, F3277.37A and F3387.48M is not immediatelyapparent from the structure.
The structures of the three extracellular loops (EL1–3) in b1AR arevery similar to those of b2AR (Ca r.m.s.d. of 0.8 A), consistent withthe high sequence conservation of these regions in the bAR family(Supplementary Fig. 1). On the extracellular surface, a clear peak inthe electron density is present at a position co-ordinated by thebackbone carbonyl groups of residues Cys 192, Asp 195, Cys 198and one or two water molecules (Supplementary Fig. 8). This densitywas assigned to a sodium ion on the basis of its coordination geo-metry20. Its role, bound at the negative end of the EL2 a-helix dipole,may be to stabilize the helical conformation of EL2 and thus thestructure of the entrance to the ligand-binding pocket. The largedifference in EL2 conformation between the a-helix found in b2ARand the b-hairpin that closes off the retinal-binding site in rhodopsinis confirmed in the structure of b1AR, suggesting that the a-helix maybe a common feature in those GPCRs that bind their ligands rapidlyand reversibly.
Cytoplasmic loop structure
In all GPCRs, CL2 and CL3 are believed to have an important role inthe binding, selectivity and activation of G proteins, CL2 being
EL2
N terminus
C terminus
CL1CL2
V P F
G A T
L V V RG
PQ
AL
K
CY
QD
GAELL
WQQS
E A GM S LL M A
LV VL
L I V AG N VL V I A
A I GST
QR
L QTL
NF
LI T SL A CA D L
VV
G
L
L
TW
LWGS F L
E L WT S L D
V L CV T A S
I E TL C V I
A I DR Y L A
I T
SM
PF
RY
QS
L
TR A R AK V II C T VW A IS A L V
SF
L P I MMHWWR
DEP
G
D F V T
NR A Y A
I A SS I I S
KI D R A S K R K R
VM
LM
RE HK A L KT L GI I M GV F TL C
WL P F
F L V N
I V N
V FP
CR
NR D L
V
CEGRFYGSQEQPQPPPLPQHQPILGNGR
M
DGWLPPDCGPHNRSGGGGATAAPTGSRQVS
ADRRLHHHHHH
AGGQPAPLPGGFISTLGSPEHSPGGTWSDCNGGTRGGSESSLEERHSKTSRSESKMEREKNILATTRFYCTFLGNGDKAVFCTVLRIVKLFEDATCTCPHTHKLKMKWRFKQHQA
CC
C
401.31
681.59
1042.67
762.39 1443.55
1113.22
1784.62
1534.37
2055.36
2355.66
3156.60
2856.30
3227.32
3427.52
3568.57
3478.48
LD
FR
KAF
KR
L
PA F
PRK
T
D
YL L I M
I F VLA V
Y R EA K
EQ
I
R
PI
R
MN P I I
LW FV A FN W L G
Y A NS
D
A
S
Y
V
TS
F
a b
Figure 1 | Schematic representations of the turkey b1AR structure.a, Diagram of the turkey b1AR sequence in relation to secondary structureelements. The residues in white circles indicate regions that are well ordered;the sequences in grey circles were not resolved in the structure. Thesequences on an orange background were deleted to make the b1ARconstruct for expression. Thermostabilizing mutations are in red circles andtwo other mutations—C116L (increases functional expression) and C358A(eliminates palmitoylation site)—are in blue circles. The Na1 ion is inpurple. Numbers refer to the first and last amino acid residues in each helix
(blue boxes), with the Ballesteros–Weinstein numbering in superscript.Helices were defined using the Kabsch and Sander algorithm49, with helixdistortions being defined as residues that have main chain torsion anglesthat differ by more than 40u from standard a-helix values (260u,240u).b, Ribbon representation of the b1AR structure in rainbow colouration (Nterminus, blue; C terminus, red), with the Na1 ion in pink, the two near-bydisulphide bonds in yellow, and cyanopindolol as a space-filling model. Theextracellular loop 2 (EL2) and cytoplasmic loops 1 and 2 (CL1, CL2) arelabelled.
NATURE | Vol 454 | 24 July 2008 ARTICLES
487 ©2008 Macmillan Publishers Limited. All rights reserved
Red circle: Thermostabilizing mutations and C116L (increases functional expression) and C358A (eliminates palmitoylation site) are in blue circles
Purple: Na+ ion
Grey circle: not resolved in structure
Orange boxes: deleted to make the β1AR construct for expression
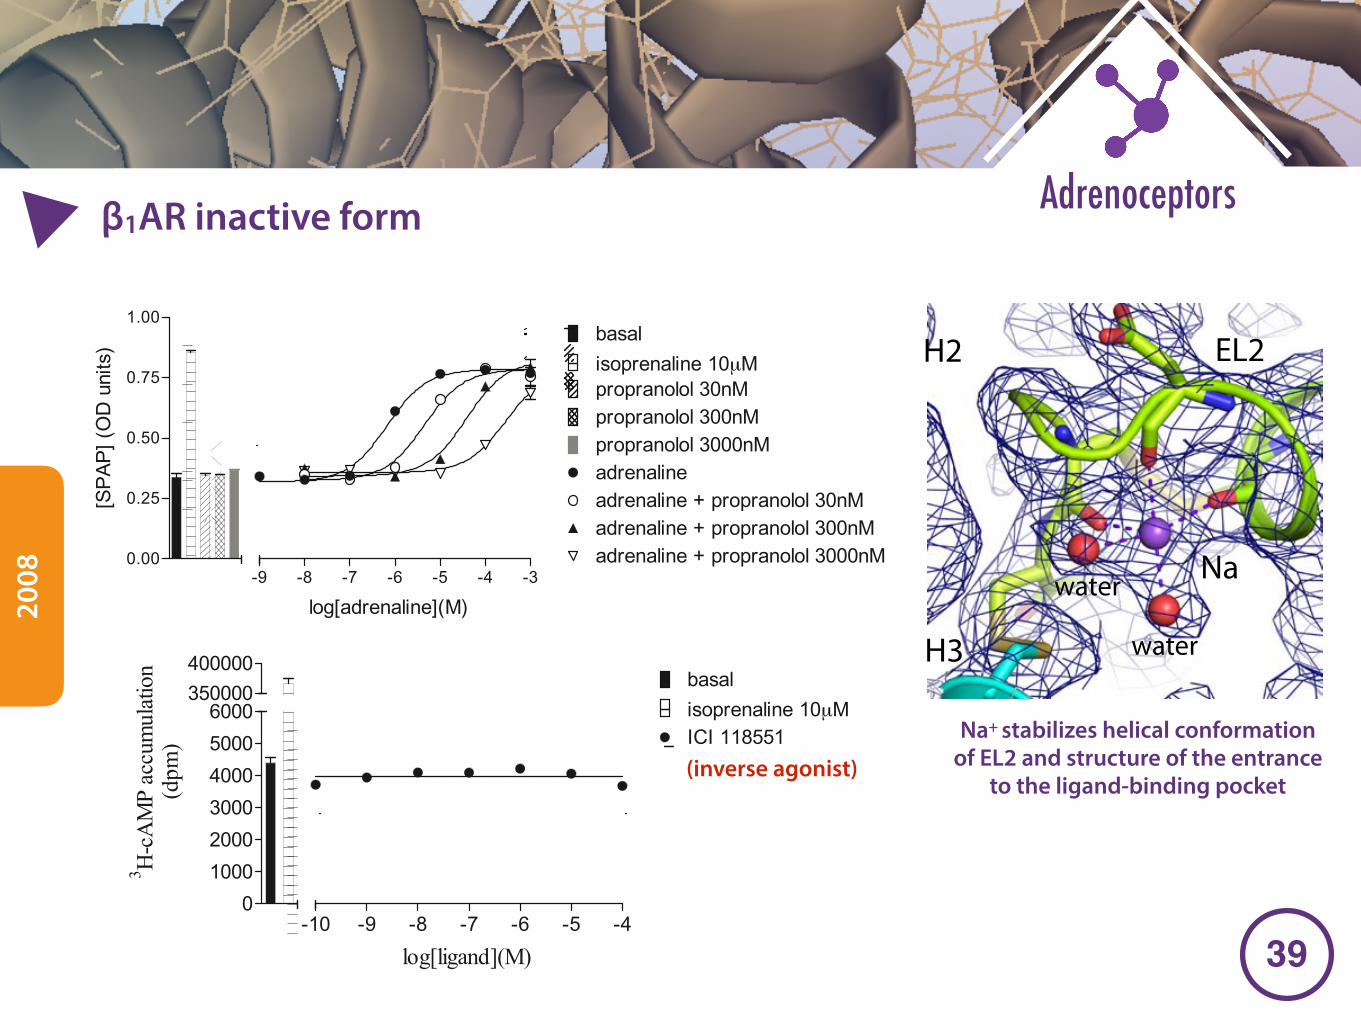
�39
Adrenoceptorsβ1AR inactive form
2008
0.00
0.25
0.50
0.75
1.00
-9 -8 -7 -6 -5 -4 -3
basalisoprenaline 10μMpropranolol 30nMpropranolol 300nMpropranolol 3000nMadrenalineadrenaline + propranolol 30nMadrenaline + propranolol 300nMadrenaline + propranolol 3000nM
log[adrenaline](M)
[SPAP](ODunits)
0100020003000400050006000
-10 -9 -8 -7 -6 -5 -4
basalisoprenaline 10μM
350000400000
ICI 118551
log[ligand](M)
3 H-cAMPaccumulation
(dpm)
A
B
Supplementary Figure 3. Basal activity and agonist-induced downstream signalling from β1AR-m23. The construct expressed in the stable CHO cell line used in these assays (see Supplementary Methods) contained amino acid residues 1-2 and 33-424 of the turkey β1-adrenergic receptor i.e. there were truncations at the N- and C-termini, but CL3 was intact. (A) The coupling of β1AR-m23 was tested by incubating CHO-m23-SPAP cells with the agonist adrenaline and measuring the amount of secreted alkaline phosphatase (SPAP) expressed from the cAMP response elements due to increased intracellular cAMP (filled circles, log EC50 for adrenaline was -5.82 ± 0.09, 96.5 ± 2.1% maximal response to isoprenaline, n=11). Agonist binding was competed by the antagonist propranolol in increasing concentrations (open circles and triangles, log KD = -8.03 ± 0.05, n=13). The Schild slope of this was 0.95 ± 0.08, n=3, indicating that the interaction of the ligands with the receptor was competitive. The EC50 value for adrenaline is -6.2 compared with -7.5 for human β1AR16. (B) The inverse agonist ICI 118551 did not reduce the background cAMP level in the CHO-m23-SPAP cells, despite binding to CHO-m23-SPAP cells with a log KD values of -6.49 ± 0.03, n=7.
(inverse agonist)
B
A
EL2
H3
H2
CYP
H6 W303
D87 N335
D121
water
Na
water
water H2
Supplementary Figure 8. Representative regions of 2Fo-Fc electron density in EL2 and near the ligand binding pocket. (A) Co-ordination of the Na+ ion in EL2 by the backbone carbonyl groups from amino acid residues Cys192, Asp195, Cys198 and two waters in molecule D. There is density for two water molecules in A and D, and for one in B and C. (B) Water molecule hydrogen bonded to Trp3036.48 in H6 in molecule C; Trp3036.48 is highly conserved and is thought to be important for receptor activation (Shi et al., (2002) J.Biol. Chem. 277, 40989).Another water molecule, visible in molecules A and D, maintains the structure of the kink in H6, by hydrogen bonding to the carbonyl of Cys3026.47. Other waters tended to be less buried, and are not conserved between β1AR and β2AR, nor even between the different molecules of β1AR, suggesting that any water structure important for receptor activation is loosely packed rather than forming a conserved hydrogen bonding network.
Na+ stabilizes helical conformation of EL2 and structure of the entrance
to the ligand-binding pocket
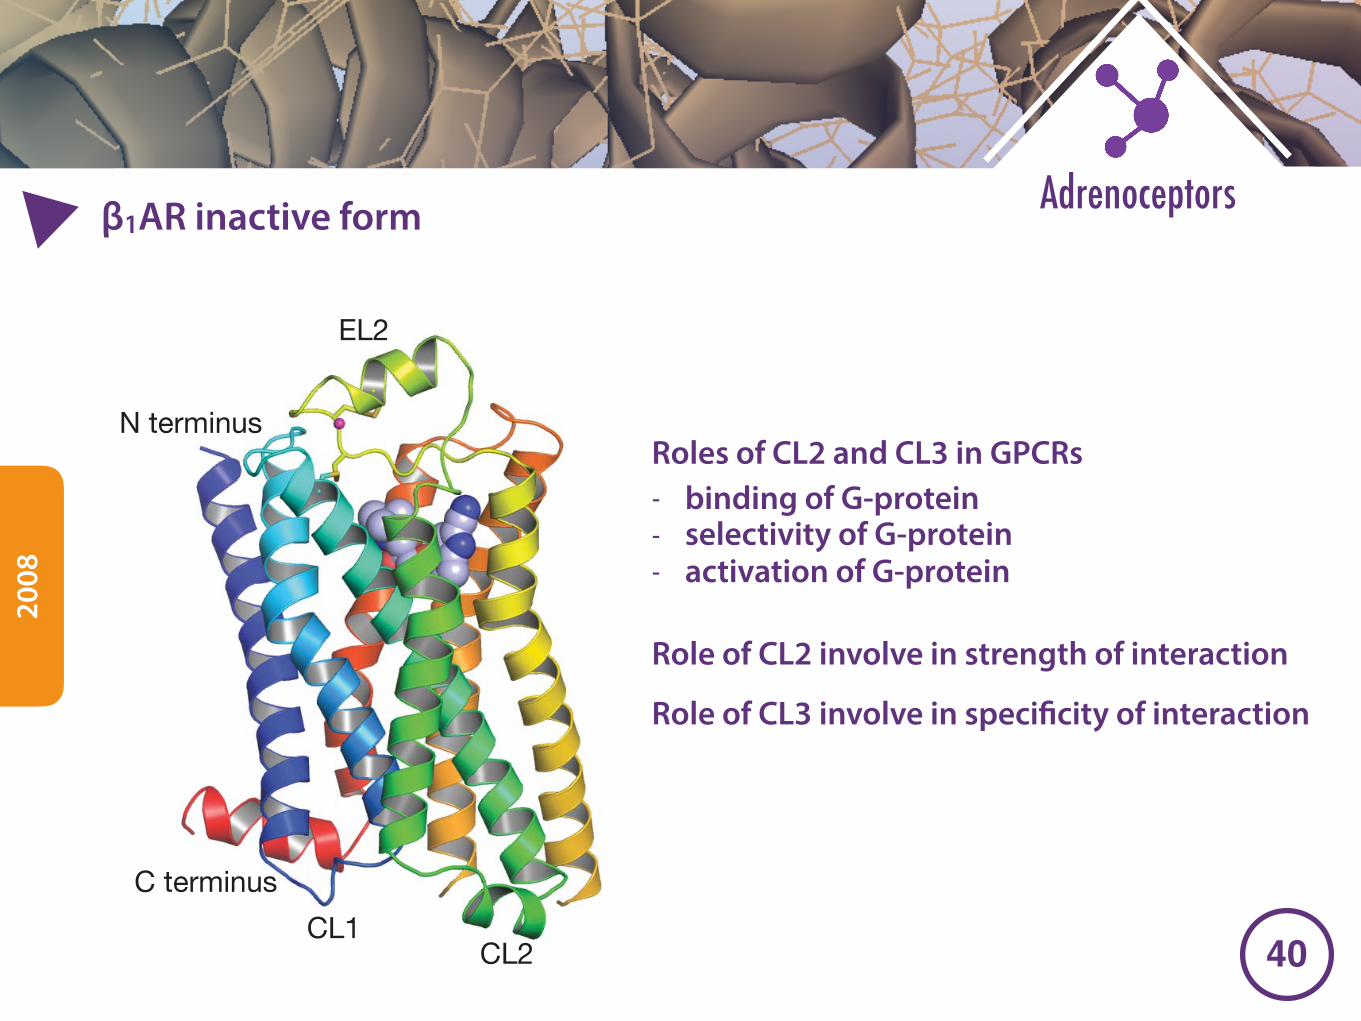
�40
Adrenoceptorsβ1AR inactive form
2008
more weakly by a factor of 2,470 and 650, respectively15. This reflects achange in the R to R* equilibrium of the receptor towards the anta-gonist R state. From this we predicted that, in a G-protein-couplingassay, the receptor would show no basal activity and that the con-centration of agonist required for signalling would be orders of mag-nitude higher. Signalling assays were performed on stable cell linesexpressing the wild-type b1AR truncated at the N and C termini(b1ARtrunc) and also containing the six thermostabilizing mutations(m23) (Supplementary Fig. 3).b1ARtrunc-m23 coupled efficiently toG proteins and elicited a robust stimulation of cAMP-responsivereporter gene, although the agonist concentration response curve,as expected, was shifted to the right16. The drug ICI 118551, aninverse agonist for both b1AR17 and b2AR18, showed no reductionin the basal level of cAMP when added at a concentration 100-foldabove its inhibition constant (Ki) to cells containing b1ARtrunc-m23, implying there is negligible basal constitutive activity. Thestructure we have determined contains the very high affinity anta-gonist cyanopindolol in the binding pocket and represents closely theinactive conformation with respect to G-protein coupling.
Overall structure and the extracellular loops
The structure was solved by molecular replacement to 2.7 A resolutionwith an Rwork of 0.212 and an Rfree of 0.268 (Supplementary Table 1).The four receptor molecules in the unit cell, labelled A–D(Supplementary Figs 4–6), were all very similar except that moleculesA and D both had a 60u kink in helix 1 (H1). Also modelled were 31water molecules, 4 Na1 ions and 14 detergent molecules (seeSupplementary Information). Unless otherwise stated, all further dis-cussion refers to molecule B, because this molecule has an unkinkedH1 and a relatively well-ordered H8. The helix boundaries, disorderedregions and overall structural motifs are presented in Fig. 1.
The amino acid sequence of turkey b1AR19 is 82% and 67% iden-tical to human b1AR and human b2AR, respectively, over residuesTrp401.31–Asp2425.73 and Glu2856.30–Cys358H8-Cterm (that is,excluding the N and C termini and most of CL3); it is thereforeexpected that the structure of the transmembrane regions of b1AR
andb2AR should be very similar. Our superposition ofb2AR (ProteinData Bank, PDB, code 2RH1) and b1AR (chain B) is based on selectedresidues in H3, H5, H6 and H7 because we were particularly intere-sted in comparing the ligand-binding pockets; 78 Ca atoms can besuperimposed with a root mean square deviation (r.m.s.d.) of 0.25 A.The r.m.s.d. over all transmembrane helices is 0.7 A (269 Ca atoms;Supplementary Fig. 7). Comparison of the structures of b1AR andb2AR reveals no evidence for any significant changes in backboneconformation at the sites of the six point mutants introduced15 tostabilize b1AR. This is consistent with the observation that b1AR-m23 binds antagonists with similar affinities to the wild-type recep-tor15 and that it can couple efficiently to G proteins, although athigher agonist concentration (Supplementary Fig. 3). The basis forthe thermostabilization by the six mutations R681.59S, M902.53V,Y2275.58A, A2826.27L, F3277.37A and F3387.48M is not immediatelyapparent from the structure.
The structures of the three extracellular loops (EL1–3) in b1AR arevery similar to those of b2AR (Ca r.m.s.d. of 0.8 A), consistent withthe high sequence conservation of these regions in the bAR family(Supplementary Fig. 1). On the extracellular surface, a clear peak inthe electron density is present at a position co-ordinated by thebackbone carbonyl groups of residues Cys 192, Asp 195, Cys 198and one or two water molecules (Supplementary Fig. 8). This densitywas assigned to a sodium ion on the basis of its coordination geo-metry20. Its role, bound at the negative end of the EL2 a-helix dipole,may be to stabilize the helical conformation of EL2 and thus thestructure of the entrance to the ligand-binding pocket. The largedifference in EL2 conformation between the a-helix found in b2ARand the b-hairpin that closes off the retinal-binding site in rhodopsinis confirmed in the structure of b1AR, suggesting that the a-helix maybe a common feature in those GPCRs that bind their ligands rapidlyand reversibly.
Cytoplasmic loop structure
In all GPCRs, CL2 and CL3 are believed to have an important role inthe binding, selectivity and activation of G proteins, CL2 being
EL2
N terminus
C terminus
CL1CL2
V P F
G A T
L V V RG
PQ
AL
K
CY
QD
GAELL
WQQS
E A GM S LL M A
LV VL
L I V AG N VL V I A
A I GST
QR
L QTL
NF
LI T SL A CA D L
VV
G
L
L
TW
LWGS F L
E L WT S L D
V L CV T A S
I E TL C V I
A I DR Y L A
I T
SM
PF
RY
QS
L
TR A R AK V II C T VW A IS A L V
SF
L P I MMHWWR
DEP
G
D F V T
NR A Y A
I A SS I I S
KI D R A S K R K R
VM
LM
RE HK A L KT L GI I M GV F TL C
WL P F
F L V N
I V N
V FP
CR
NR D L
V
CEGRFYGSQEQPQPPPLPQHQPILGNGR
M
DGWLPPDCGPHNRSGGGGATAAPTGSRQVS
ADRRLHHHHHH
AGGQPAPLPGGFISTLGSPEHSPGGTWSDCNGGTRGGSESSLEERHSKTSRSESKMEREKNILATTRFYCTFLGNGDKAVFCTVLRIVKLFEDATCTCPHTHKLKMKWRFKQHQA
CC
C
401.31
681.59
1042.67
762.39 1443.55
1113.22
1784.62
1534.37
2055.36
2355.66
3156.60
2856.30
3227.32
3427.52
3568.57
3478.48
LD
FR
KAF
KR
L
PA F
PRK
T
D
YL L I M
I F VLA V
Y R EA K
EQ
I
R
PI
R
MN P I I
LW FV A FN W L G
Y A NS
D
A
S
Y
V
TS
F
a b
Figure 1 | Schematic representations of the turkey b1AR structure.a, Diagram of the turkey b1AR sequence in relation to secondary structureelements. The residues in white circles indicate regions that are well ordered;the sequences in grey circles were not resolved in the structure. Thesequences on an orange background were deleted to make the b1ARconstruct for expression. Thermostabilizing mutations are in red circles andtwo other mutations—C116L (increases functional expression) and C358A(eliminates palmitoylation site)—are in blue circles. The Na1 ion is inpurple. Numbers refer to the first and last amino acid residues in each helix
(blue boxes), with the Ballesteros–Weinstein numbering in superscript.Helices were defined using the Kabsch and Sander algorithm49, with helixdistortions being defined as residues that have main chain torsion anglesthat differ by more than 40u from standard a-helix values (260u,240u).b, Ribbon representation of the b1AR structure in rainbow colouration (Nterminus, blue; C terminus, red), with the Na1 ion in pink, the two near-bydisulphide bonds in yellow, and cyanopindolol as a space-filling model. Theextracellular loop 2 (EL2) and cytoplasmic loops 1 and 2 (CL1, CL2) arelabelled.
NATURE | Vol 454 | 24 July 2008 ARTICLES
487 ©2008 Macmillan Publishers Limited. All rights reserved
Roles of CL2 and CL3 in GPCRs- binding of G-protein - selectivity of G-protein - activation of G-protein
Role of CL2 involve in strength of interaction
Role of CL3 involve in specificity of interaction
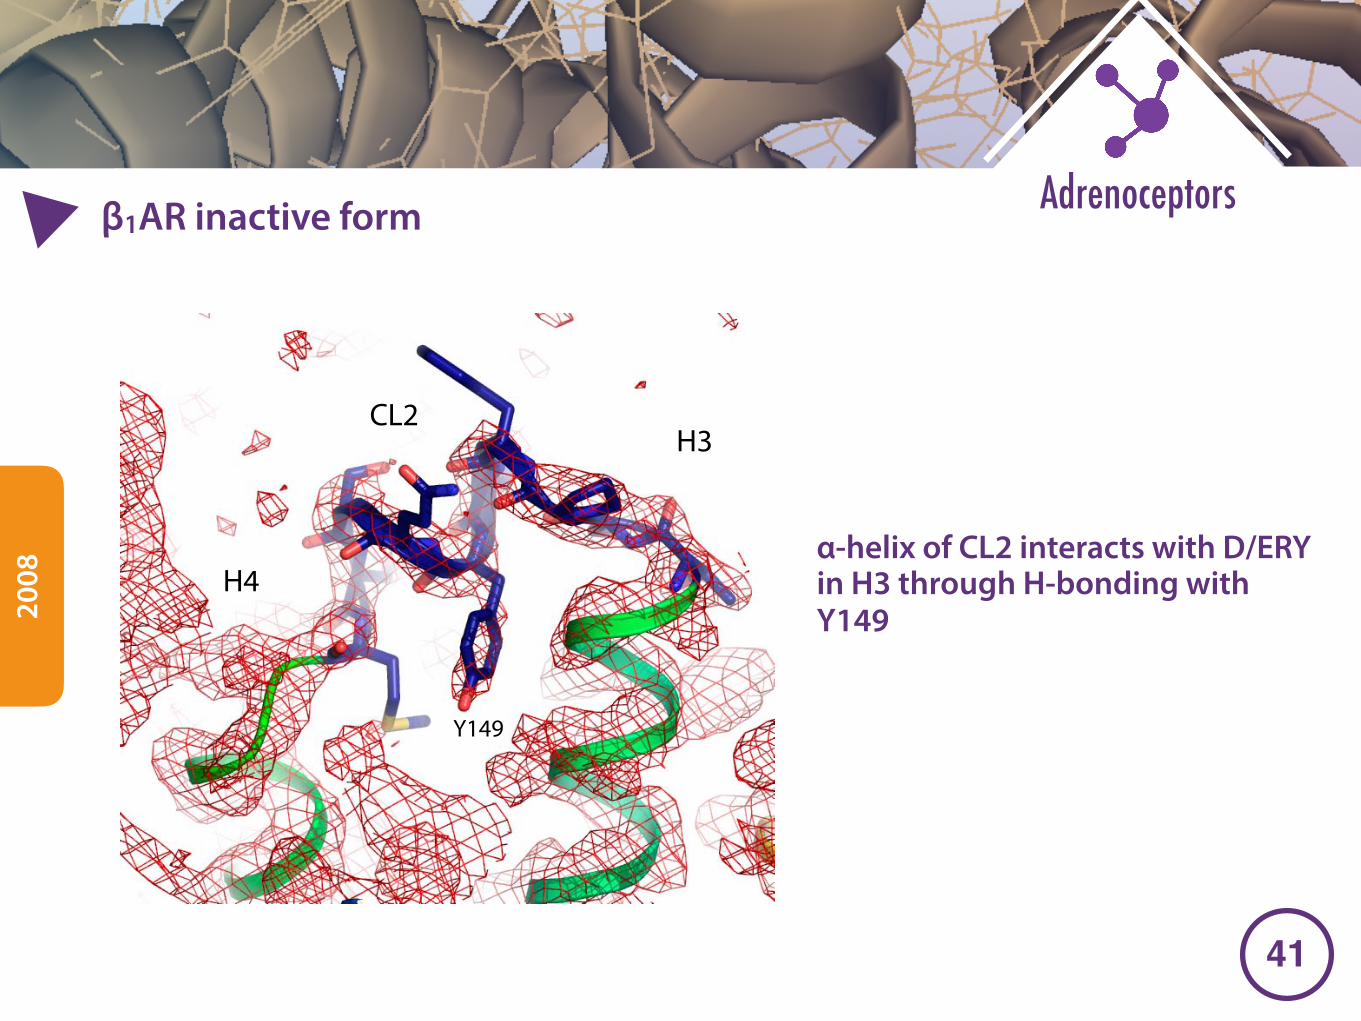
�41
Adrenoceptorsβ1AR inactive form
2008
H3
H4
CL2
Y149
Supplementary Figure 9. Omit map of cytoplasmic loop 2. The 2Fo-Fc map (red mesh) of molecule B was calculated after deleting the CL2 loop (residues 144-153, blue) from the initial model and before rebuilding it into its new conformation. The map is contoured at the 1 sigma level and the coordinates of the final structure are superimposed on this density, with the backbone of helices H3 and H4 shown in green.
α-helix of CL2 interacts with D/ERY in H3 through H-bonding with Y149
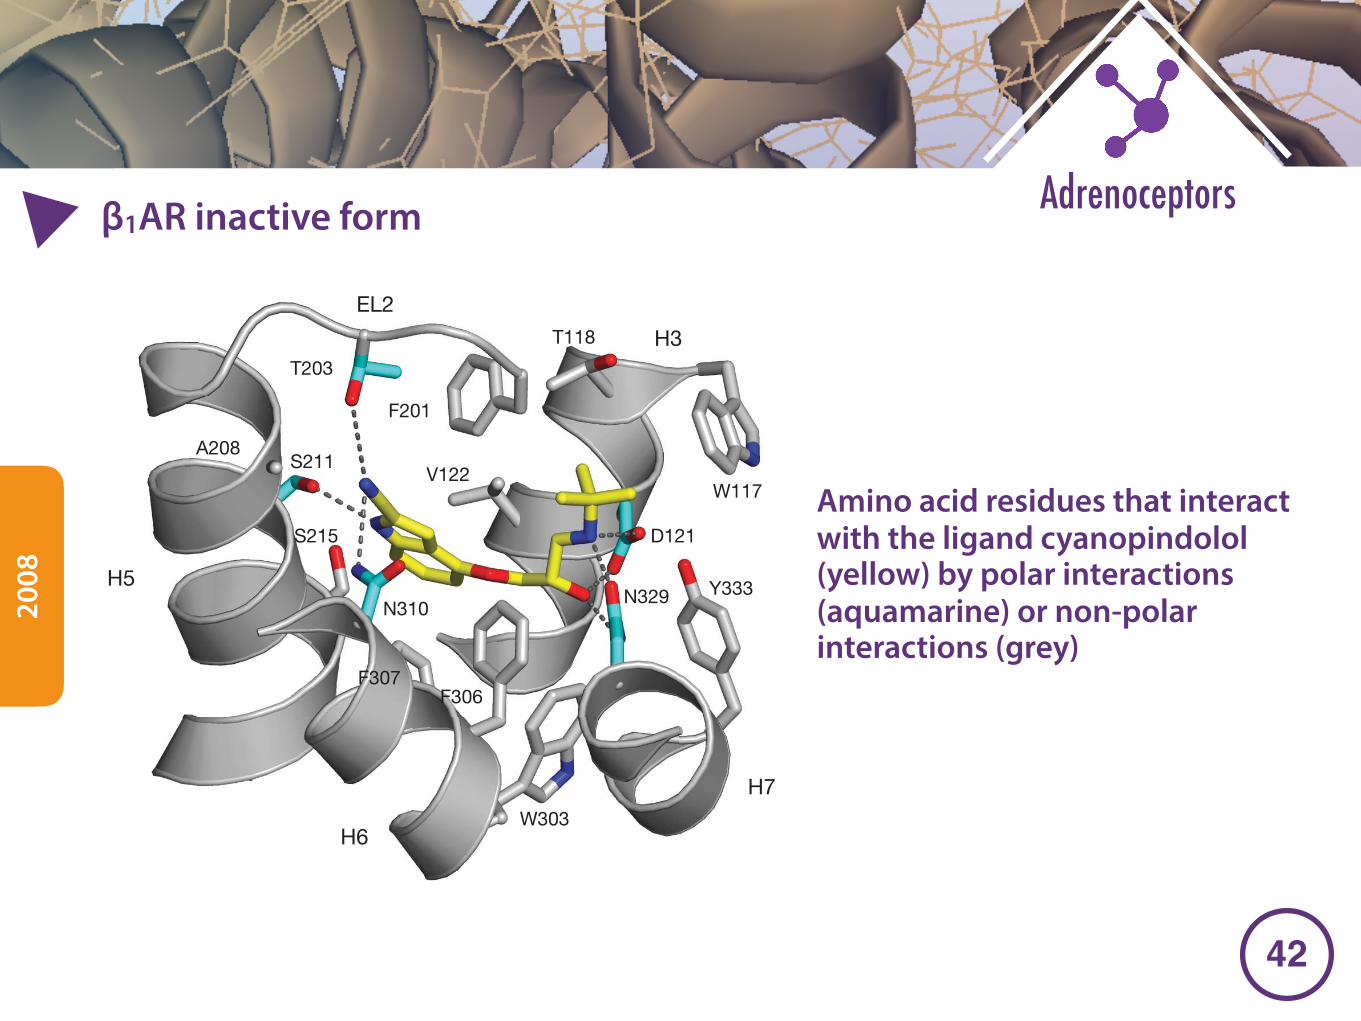
�42
Adrenoceptorsβ1AR inactive form
2008
Amino acid residues that interact with the ligand cyanopindolol (yellow) by polar interactions (aquamarine) or non-polar interactions (grey)
the sites of allosteric modulators34, and that the loop flexibility isimportant to the binding kinetics35.
The structure of b1AR, when compared to that of b2AR, provides asound basis for studying selectivity differences between bAR antago-nists that are structurally similar to cyanopindolol and carazolol.However, many ligands, such as the inverse agonist CGP 20712A(Supplementary Fig. 2), show very high selectivities11 but are phys-ically larger and structurally distinct from either cyanopindolol orcarazolol. These ligands could well make contact with residues otherthan those described here.
Agonist binding and GPCR activation
The b1AR crystal structure shows the inactive state of the receptor,but it is notable that many agonists, including the natural ligandsadrenaline and noradrenaline, are smaller than many of the best
antagonists, including cyanopindolol. Agonists have a shorter dis-tance, by two carbon–carbon bonds or 2–3 A, between the catecholhydroxyl groups or their equivalent and the obligatory amine nitro-gen. We superimposed (Fig. 4b) a model of adrenaline with that ofcyanopindolol and examined its relationship to the side chains ofAsp 1213.32 and Asn 3297.39, which make hydrogen bonds with theamine, and those of Ser 2115.42, Ser 2125.43 and Ser 2155.46, which areexpected to hydrogen bond with the meta- and para-hydroxyl groupson the catechol ring36–38. As noticed previously39, the catecholhydroxyl groups are well spaced and well oriented to interact withthe side chain hydroxyl groups of Ser 2115.42, Ser 2125.43 andSer 2155.46 on H5, but cannot reach far enough to make good hydro-gen bonds if the amine occupies the same position as it does adjacentto Asp 1213.32 in the cyanopindolol complex, without a substantialstructural change in the receptor. It seems very reasonable that the
H3
H4H5
H6
H7H2
β1 V172β2 T164
β2 Y308β1 F325
β2 N293β1 N310 β1 CYP
β2 CAR
β1 S211β2 S203
EL2
H5
H3
T203
S211
S212
S215
Cyanopindolol
AdrenalineD121
5.0
5.9
4.5
2.8
2.5
a
b
Figure 4 | Comparisons between b receptor ligand-binding pockets and thebinding of different ligands. a, Superposition ofb1AR molecule B withb2AR(PDB code 2RH1, ref. 10) in the region surrounding the ligand-binding site.Shown are side chains that have different rotamer conformations (N3106.55
and S2115.42) along with two residues that are conserved yet consistentlydifferent between b1 and b2 receptors (F325/Y3087.35 and V172/T1644.56).Cyanopindolol (CYP) is in the ligand-binding pocket of the b1 receptor, andcarazolol (CAR) is in the b2 receptor. The biggest backbone deviation is seenat the V172/T1644.56 position. b, Superposition of a model of the agonist,adrenaline (yellow), with the structure of the antagonist, cyanopindolol(pink), as it binds to b1AR, showing the distances (in A, red) to the nearestside chains known to interact with the hydoxyl groups on the catechol ring ofthe agonist. It is clear that a 2–3 A tightening of the pocket around the ligandmust occur on agonist binding.
b EL2
T203
T118
F201
W117
H3
D121
N329 Y333
W303
F306F307
N310
S215
S211A208
V122
H5
H7
H6
aEL2
H5CYP
F201
F307
W303
H7
Y333
F299
T203
Figure 3 | Structure of the ligand-binding pocket. a, 2Fo–Fc map beforeinclusion of cyanopindolol (CYP) in the model, showing the interaction ofCYP with Thr 203 and Phe 201 in EL2. b, Amino acid residues that interactwith the ligand cyanopindolol (yellow) by polar interactions (aquamarine)or non-polar interactions (grey).
NATURE | Vol 454 | 24 July 2008 ARTICLES
489 ©2008 Macmillan Publishers Limited. All rights reserved
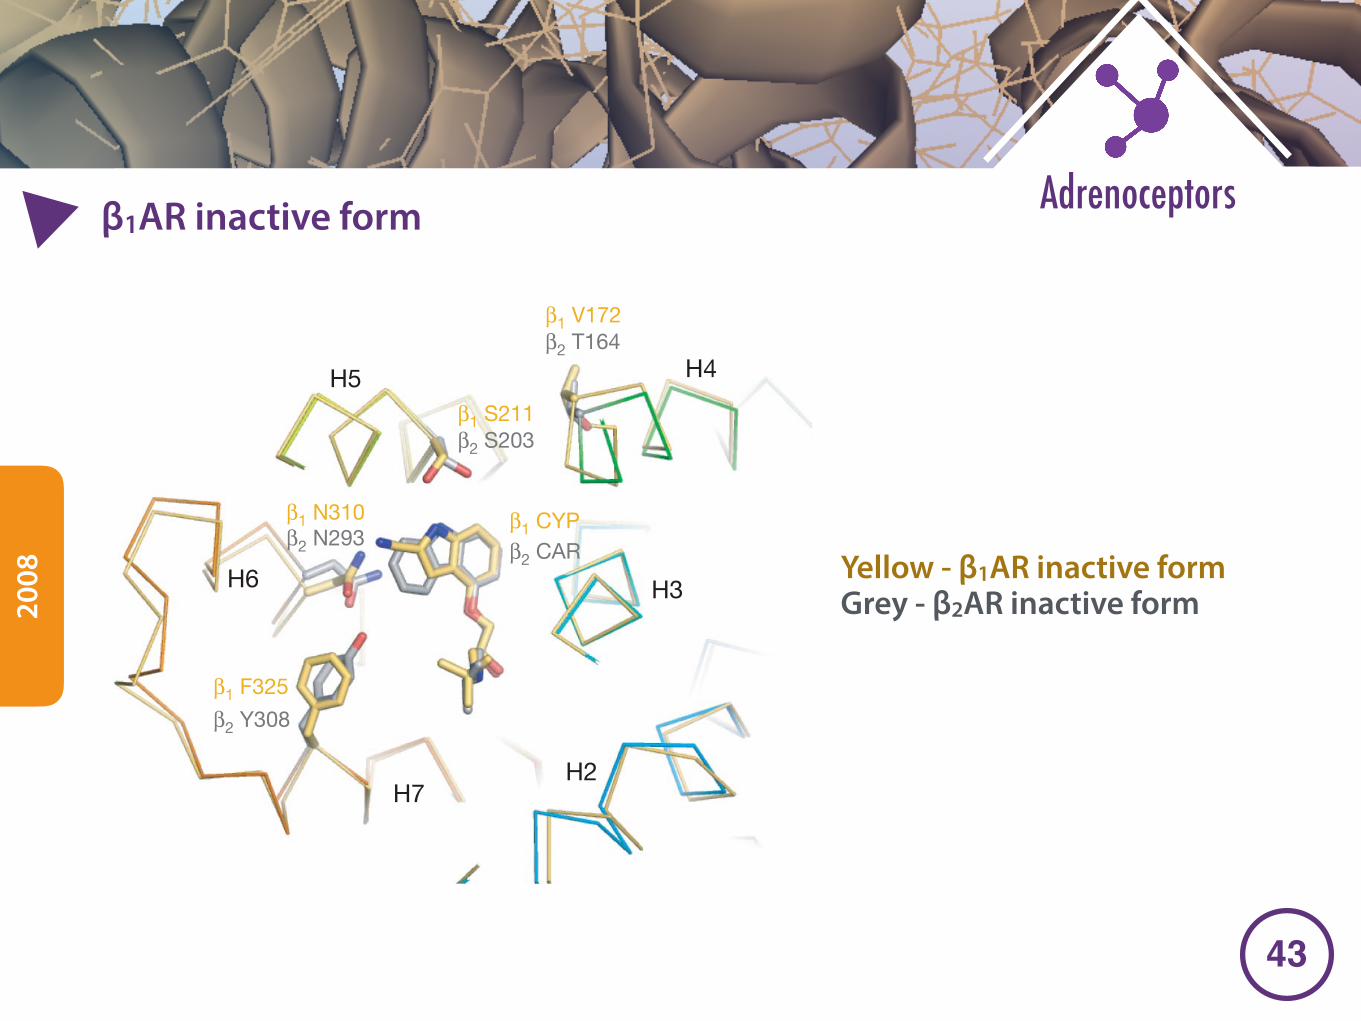
�43
Adrenoceptorsβ1AR inactive form
2008 Yellow - β1AR inactive form
Grey - β2AR inactive form
the sites of allosteric modulators34, and that the loop flexibility isimportant to the binding kinetics35.
The structure of b1AR, when compared to that of b2AR, provides asound basis for studying selectivity differences between bAR antago-nists that are structurally similar to cyanopindolol and carazolol.However, many ligands, such as the inverse agonist CGP 20712A(Supplementary Fig. 2), show very high selectivities11 but are phys-ically larger and structurally distinct from either cyanopindolol orcarazolol. These ligands could well make contact with residues otherthan those described here.
Agonist binding and GPCR activation
The b1AR crystal structure shows the inactive state of the receptor,but it is notable that many agonists, including the natural ligandsadrenaline and noradrenaline, are smaller than many of the best
antagonists, including cyanopindolol. Agonists have a shorter dis-tance, by two carbon–carbon bonds or 2–3 A, between the catecholhydroxyl groups or their equivalent and the obligatory amine nitro-gen. We superimposed (Fig. 4b) a model of adrenaline with that ofcyanopindolol and examined its relationship to the side chains ofAsp 1213.32 and Asn 3297.39, which make hydrogen bonds with theamine, and those of Ser 2115.42, Ser 2125.43 and Ser 2155.46, which areexpected to hydrogen bond with the meta- and para-hydroxyl groupson the catechol ring36–38. As noticed previously39, the catecholhydroxyl groups are well spaced and well oriented to interact withthe side chain hydroxyl groups of Ser 2115.42, Ser 2125.43 andSer 2155.46 on H5, but cannot reach far enough to make good hydro-gen bonds if the amine occupies the same position as it does adjacentto Asp 1213.32 in the cyanopindolol complex, without a substantialstructural change in the receptor. It seems very reasonable that the
H3
H4H5
H6
H7H2
β1 V172β2 T164
β2 Y308β1 F325
β2 N293β1 N310 β1 CYP
β2 CAR
β1 S211β2 S203
EL2
H5
H3
T203
S211
S212
S215
Cyanopindolol
AdrenalineD121
5.0
5.9
4.5
2.8
2.5
a
b
Figure 4 | Comparisons between b receptor ligand-binding pockets and thebinding of different ligands. a, Superposition ofb1AR molecule B withb2AR(PDB code 2RH1, ref. 10) in the region surrounding the ligand-binding site.Shown are side chains that have different rotamer conformations (N3106.55
and S2115.42) along with two residues that are conserved yet consistentlydifferent between b1 and b2 receptors (F325/Y3087.35 and V172/T1644.56).Cyanopindolol (CYP) is in the ligand-binding pocket of the b1 receptor, andcarazolol (CAR) is in the b2 receptor. The biggest backbone deviation is seenat the V172/T1644.56 position. b, Superposition of a model of the agonist,adrenaline (yellow), with the structure of the antagonist, cyanopindolol(pink), as it binds to b1AR, showing the distances (in A, red) to the nearestside chains known to interact with the hydoxyl groups on the catechol ring ofthe agonist. It is clear that a 2–3 A tightening of the pocket around the ligandmust occur on agonist binding.
b EL2
T203
T118
F201
W117
H3
D121
N329 Y333
W303
F306F307
N310
S215
S211A208
V122
H5
H7
H6
aEL2
H5CYP
F201
F307
W303
H7
Y333
F299
T203
Figure 3 | Structure of the ligand-binding pocket. a, 2Fo–Fc map beforeinclusion of cyanopindolol (CYP) in the model, showing the interaction ofCYP with Thr 203 and Phe 201 in EL2. b, Amino acid residues that interactwith the ligand cyanopindolol (yellow) by polar interactions (aquamarine)or non-polar interactions (grey).
NATURE | Vol 454 | 24 July 2008 ARTICLES
489 ©2008 Macmillan Publishers Limited. All rights reserved
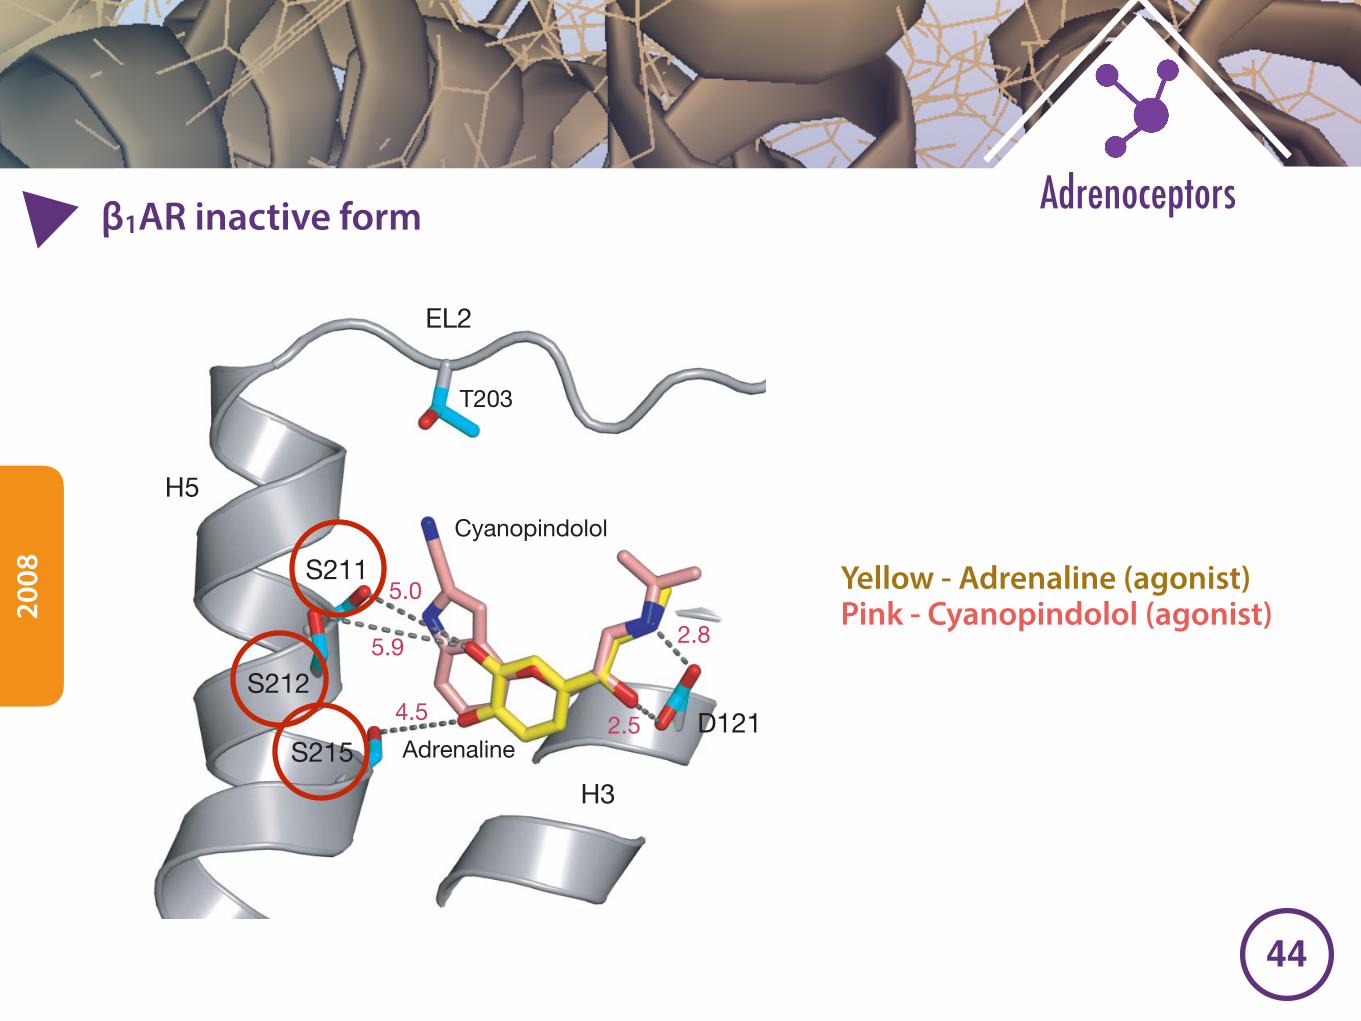
�44
Adrenoceptorsβ1AR inactive form
2008 Yellow - Adrenaline (agonist)
Pink - Cyanopindolol (agonist)
the sites of allosteric modulators34, and that the loop flexibility isimportant to the binding kinetics35.
The structure of b1AR, when compared to that of b2AR, provides asound basis for studying selectivity differences between bAR antago-nists that are structurally similar to cyanopindolol and carazolol.However, many ligands, such as the inverse agonist CGP 20712A(Supplementary Fig. 2), show very high selectivities11 but are phys-ically larger and structurally distinct from either cyanopindolol orcarazolol. These ligands could well make contact with residues otherthan those described here.
Agonist binding and GPCR activation
The b1AR crystal structure shows the inactive state of the receptor,but it is notable that many agonists, including the natural ligandsadrenaline and noradrenaline, are smaller than many of the best
antagonists, including cyanopindolol. Agonists have a shorter dis-tance, by two carbon–carbon bonds or 2–3 A, between the catecholhydroxyl groups or their equivalent and the obligatory amine nitro-gen. We superimposed (Fig. 4b) a model of adrenaline with that ofcyanopindolol and examined its relationship to the side chains ofAsp 1213.32 and Asn 3297.39, which make hydrogen bonds with theamine, and those of Ser 2115.42, Ser 2125.43 and Ser 2155.46, which areexpected to hydrogen bond with the meta- and para-hydroxyl groupson the catechol ring36–38. As noticed previously39, the catecholhydroxyl groups are well spaced and well oriented to interact withthe side chain hydroxyl groups of Ser 2115.42, Ser 2125.43 andSer 2155.46 on H5, but cannot reach far enough to make good hydro-gen bonds if the amine occupies the same position as it does adjacentto Asp 1213.32 in the cyanopindolol complex, without a substantialstructural change in the receptor. It seems very reasonable that the
H3
H4H5
H6
H7H2
β1 V172β2 T164
β2 Y308β1 F325
β2 N293β1 N310 β1 CYP
β2 CAR
β1 S211β2 S203
EL2
H5
H3
T203
S211
S212
S215
Cyanopindolol
AdrenalineD121
5.0
5.9
4.5
2.8
2.5
a
b
Figure 4 | Comparisons between b receptor ligand-binding pockets and thebinding of different ligands. a, Superposition ofb1AR molecule B withb2AR(PDB code 2RH1, ref. 10) in the region surrounding the ligand-binding site.Shown are side chains that have different rotamer conformations (N3106.55
and S2115.42) along with two residues that are conserved yet consistentlydifferent between b1 and b2 receptors (F325/Y3087.35 and V172/T1644.56).Cyanopindolol (CYP) is in the ligand-binding pocket of the b1 receptor, andcarazolol (CAR) is in the b2 receptor. The biggest backbone deviation is seenat the V172/T1644.56 position. b, Superposition of a model of the agonist,adrenaline (yellow), with the structure of the antagonist, cyanopindolol(pink), as it binds to b1AR, showing the distances (in A, red) to the nearestside chains known to interact with the hydoxyl groups on the catechol ring ofthe agonist. It is clear that a 2–3 A tightening of the pocket around the ligandmust occur on agonist binding.
b EL2
T203
T118
F201
W117
H3
D121
N329 Y333
W303
F306F307
N310
S215
S211A208
V122
H5
H7
H6
aEL2
H5CYP
F201
F307
W303
H7
Y333
F299
T203
Figure 3 | Structure of the ligand-binding pocket. a, 2Fo–Fc map beforeinclusion of cyanopindolol (CYP) in the model, showing the interaction ofCYP with Thr 203 and Phe 201 in EL2. b, Amino acid residues that interactwith the ligand cyanopindolol (yellow) by polar interactions (aquamarine)or non-polar interactions (grey).
NATURE | Vol 454 | 24 July 2008 ARTICLES
489 ©2008 Macmillan Publishers Limited. All rights reserved
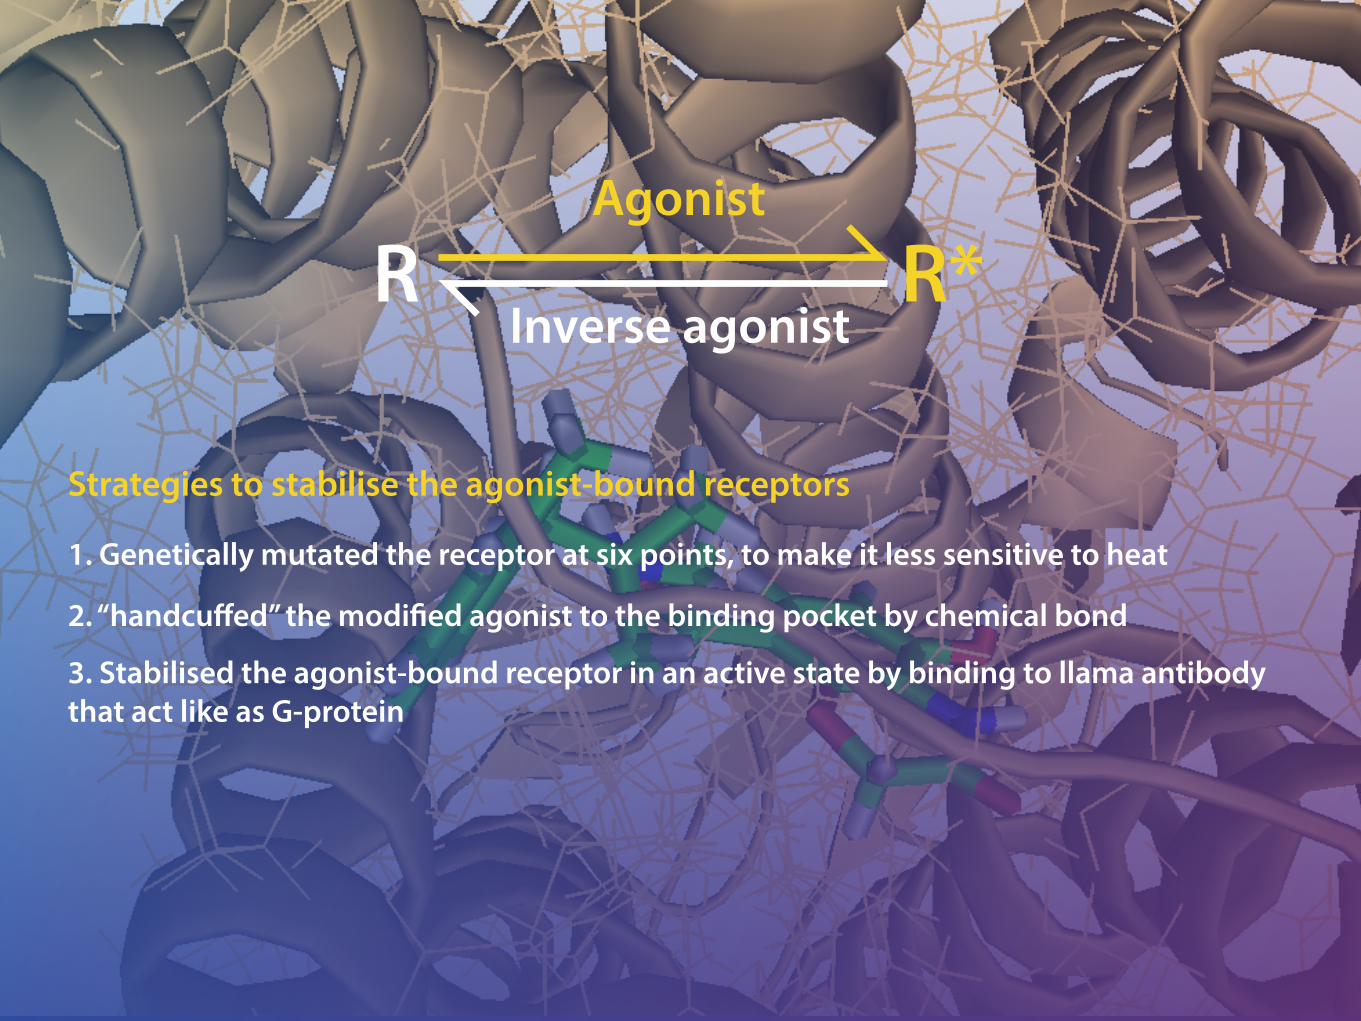
Strategies to stabilise the agonist-bound receptors
R R*Agonist
Inverse agonist
1. Genetically mutated the receptor at six points, to make it less sensitive to heat
2. “handcuffed” the modified agonist to the binding pocket by chemical bond
3. Stabilised the agonist-bound receptor in an active state by binding to llama antibody that act like as G-protein
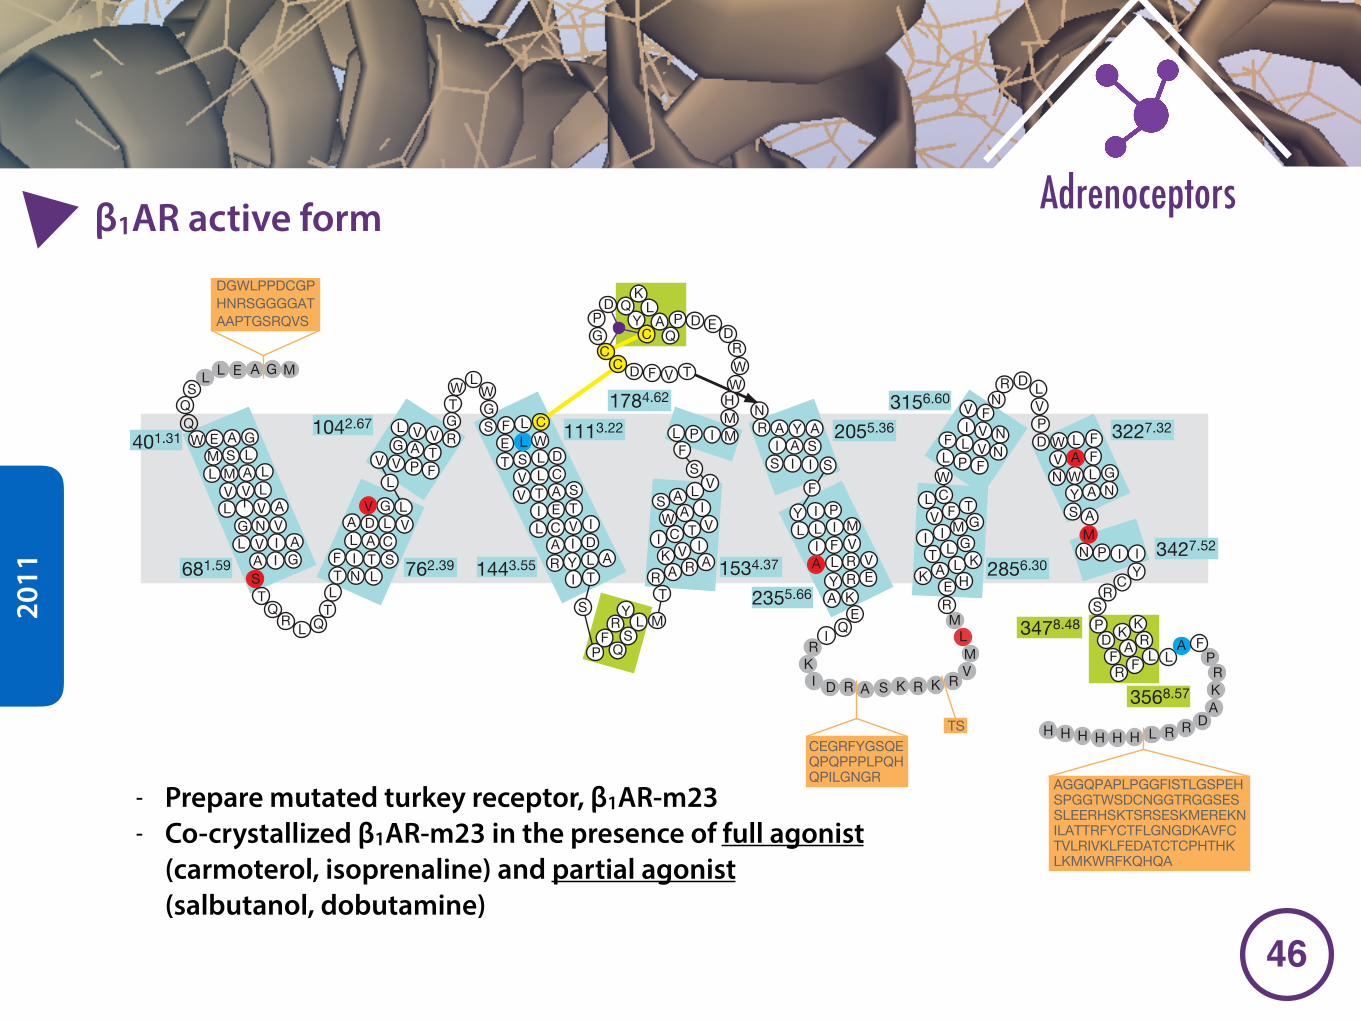
�46
Adrenoceptorsβ1AR active form
2011
more weakly by a factor of 2,470 and 650, respectively15. This reflects achange in the R to R* equilibrium of the receptor towards the anta-gonist R state. From this we predicted that, in a G-protein-couplingassay, the receptor would show no basal activity and that the con-centration of agonist required for signalling would be orders of mag-nitude higher. Signalling assays were performed on stable cell linesexpressing the wild-type b1AR truncated at the N and C termini(b1ARtrunc) and also containing the six thermostabilizing mutations(m23) (Supplementary Fig. 3).b1ARtrunc-m23 coupled efficiently toG proteins and elicited a robust stimulation of cAMP-responsivereporter gene, although the agonist concentration response curve,as expected, was shifted to the right16. The drug ICI 118551, aninverse agonist for both b1AR17 and b2AR18, showed no reductionin the basal level of cAMP when added at a concentration 100-foldabove its inhibition constant (Ki) to cells containing b1ARtrunc-m23, implying there is negligible basal constitutive activity. Thestructure we have determined contains the very high affinity anta-gonist cyanopindolol in the binding pocket and represents closely theinactive conformation with respect to G-protein coupling.
Overall structure and the extracellular loops
The structure was solved by molecular replacement to 2.7 A resolutionwith an Rwork of 0.212 and an Rfree of 0.268 (Supplementary Table 1).The four receptor molecules in the unit cell, labelled A–D(Supplementary Figs 4–6), were all very similar except that moleculesA and D both had a 60u kink in helix 1 (H1). Also modelled were 31water molecules, 4 Na1 ions and 14 detergent molecules (seeSupplementary Information). Unless otherwise stated, all further dis-cussion refers to molecule B, because this molecule has an unkinkedH1 and a relatively well-ordered H8. The helix boundaries, disorderedregions and overall structural motifs are presented in Fig. 1.
The amino acid sequence of turkey b1AR19 is 82% and 67% iden-tical to human b1AR and human b2AR, respectively, over residuesTrp401.31–Asp2425.73 and Glu2856.30–Cys358H8-Cterm (that is,excluding the N and C termini and most of CL3); it is thereforeexpected that the structure of the transmembrane regions of b1AR
andb2AR should be very similar. Our superposition ofb2AR (ProteinData Bank, PDB, code 2RH1) and b1AR (chain B) is based on selectedresidues in H3, H5, H6 and H7 because we were particularly intere-sted in comparing the ligand-binding pockets; 78 Ca atoms can besuperimposed with a root mean square deviation (r.m.s.d.) of 0.25 A.The r.m.s.d. over all transmembrane helices is 0.7 A (269 Ca atoms;Supplementary Fig. 7). Comparison of the structures of b1AR andb2AR reveals no evidence for any significant changes in backboneconformation at the sites of the six point mutants introduced15 tostabilize b1AR. This is consistent with the observation that b1AR-m23 binds antagonists with similar affinities to the wild-type recep-tor15 and that it can couple efficiently to G proteins, although athigher agonist concentration (Supplementary Fig. 3). The basis forthe thermostabilization by the six mutations R681.59S, M902.53V,Y2275.58A, A2826.27L, F3277.37A and F3387.48M is not immediatelyapparent from the structure.
The structures of the three extracellular loops (EL1–3) in b1AR arevery similar to those of b2AR (Ca r.m.s.d. of 0.8 A), consistent withthe high sequence conservation of these regions in the bAR family(Supplementary Fig. 1). On the extracellular surface, a clear peak inthe electron density is present at a position co-ordinated by thebackbone carbonyl groups of residues Cys 192, Asp 195, Cys 198and one or two water molecules (Supplementary Fig. 8). This densitywas assigned to a sodium ion on the basis of its coordination geo-metry20. Its role, bound at the negative end of the EL2 a-helix dipole,may be to stabilize the helical conformation of EL2 and thus thestructure of the entrance to the ligand-binding pocket. The largedifference in EL2 conformation between the a-helix found in b2ARand the b-hairpin that closes off the retinal-binding site in rhodopsinis confirmed in the structure of b1AR, suggesting that the a-helix maybe a common feature in those GPCRs that bind their ligands rapidlyand reversibly.
Cytoplasmic loop structure
In all GPCRs, CL2 and CL3 are believed to have an important role inthe binding, selectivity and activation of G proteins, CL2 being
EL2
N terminus
C terminus
CL1CL2
V P F
G A T
L V V RG
PQ
AL
K
CY
QD
GAELL
WQQS
E A GM S LL M A
LV VL
L I V AG N VL V I A
A I GST
QR
L QTL
NF
LI T SL A CA D L
VV
G
L
L
TW
LWGS F L
E L WT S L D
V L CV T A S
I E TL C V I
A I DR Y L A
I T
SM
PF
RY
QS
L
TR A R AK V II C T VW A IS A L V
SF
L P I MMHWWR
DEP
G
D F V T
NR A Y A
I A SS I I S
KI D R A S K R K R
VM
LM
RE HK A L KT L GI I M GV F TL C
WL P F
F L V N
I V N
V FP
CR
NR D L
V
CEGRFYGSQEQPQPPPLPQHQPILGNGR
M
DGWLPPDCGPHNRSGGGGATAAPTGSRQVS
ADRRLHHHHHH
AGGQPAPLPGGFISTLGSPEHSPGGTWSDCNGGTRGGSESSLEERHSKTSRSESKMEREKNILATTRFYCTFLGNGDKAVFCTVLRIVKLFEDATCTCPHTHKLKMKWRFKQHQA
CC
C
401.31
681.59
1042.67
762.39 1443.55
1113.22
1784.62
1534.37
2055.36
2355.66
3156.60
2856.30
3227.32
3427.52
3568.57
3478.48
LD
FR
KAF
KR
L
PA F
PRK
T
D
YL L I M
I F VLA V
Y R EA K
EQ
I
R
PI
R
MN P I I
LW FV A FN W L G
Y A NS
D
A
S
Y
V
TS
F
a b
Figure 1 | Schematic representations of the turkey b1AR structure.a, Diagram of the turkey b1AR sequence in relation to secondary structureelements. The residues in white circles indicate regions that are well ordered;the sequences in grey circles were not resolved in the structure. Thesequences on an orange background were deleted to make the b1ARconstruct for expression. Thermostabilizing mutations are in red circles andtwo other mutations—C116L (increases functional expression) and C358A(eliminates palmitoylation site)—are in blue circles. The Na1 ion is inpurple. Numbers refer to the first and last amino acid residues in each helix
(blue boxes), with the Ballesteros–Weinstein numbering in superscript.Helices were defined using the Kabsch and Sander algorithm49, with helixdistortions being defined as residues that have main chain torsion anglesthat differ by more than 40u from standard a-helix values (260u,240u).b, Ribbon representation of the b1AR structure in rainbow colouration (Nterminus, blue; C terminus, red), with the Na1 ion in pink, the two near-bydisulphide bonds in yellow, and cyanopindolol as a space-filling model. Theextracellular loop 2 (EL2) and cytoplasmic loops 1 and 2 (CL1, CL2) arelabelled.
NATURE | Vol 454 | 24 July 2008 ARTICLES
487 ©2008 Macmillan Publishers Limited. All rights reserved
- Prepare mutated turkey receptor, β1AR-m23 - Co-crystallized β1AR-m23 in the presence of full agonist
(carmoterol, isoprenaline) and partial agonist (salbutanol, dobutamine)
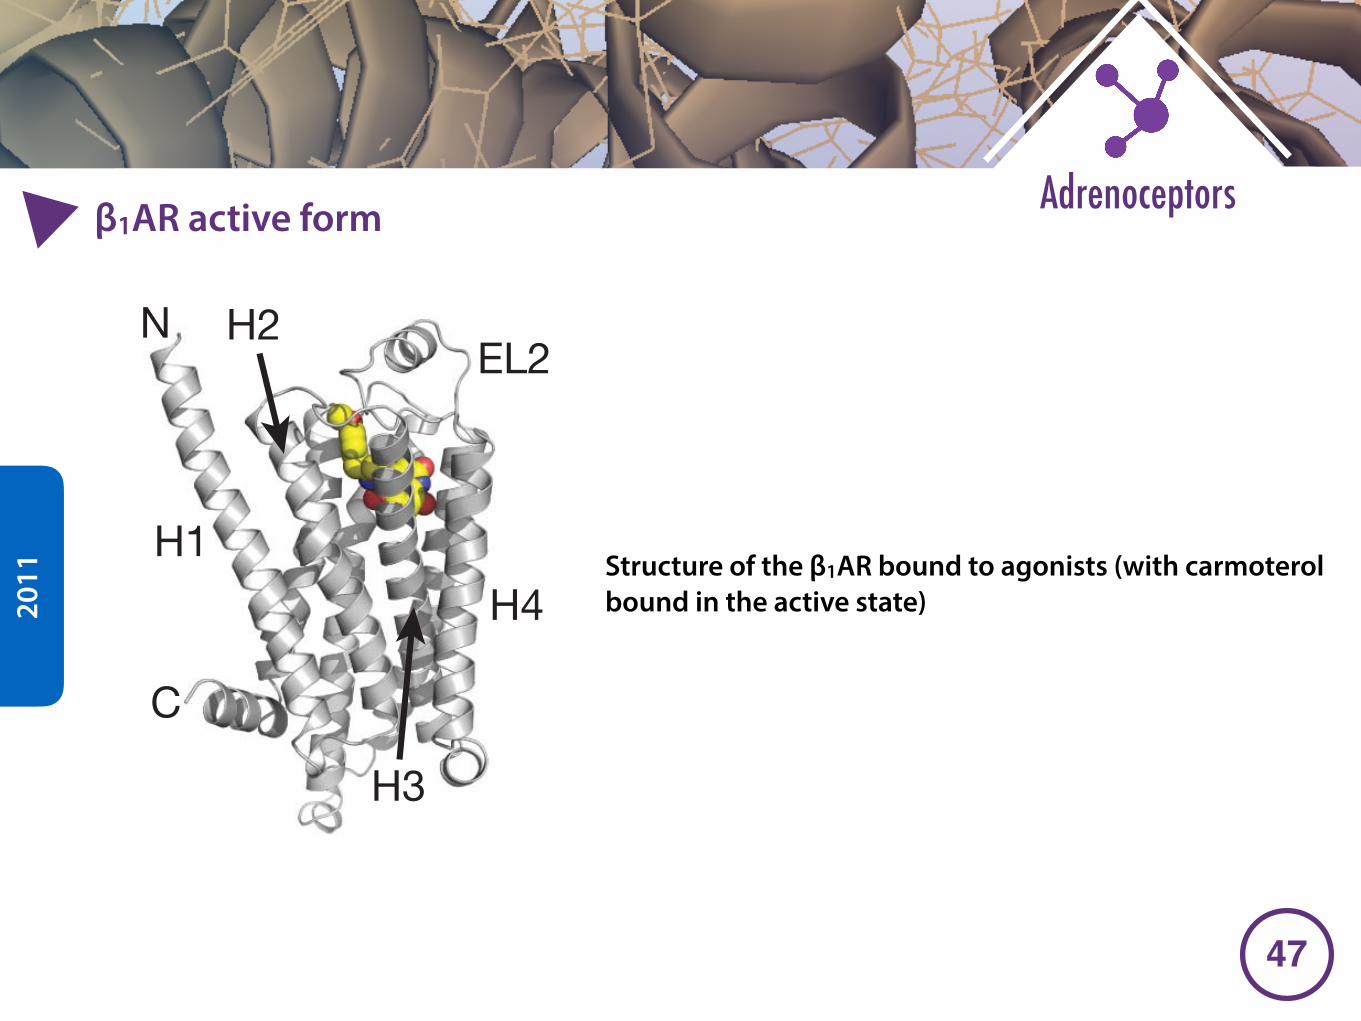
�47
Adrenoceptorsβ1AR active form
2011 Structure of the β1AR bound to agonists (with carmoterol
bound in the active state)
Isoprenaline
Carmoterol
N329
H7H5H6
H3
S211
S215
N310
D121
EL2
N329
H7H5H6
H3
S211
S215
N310
D121
EL2
Cyanopindolol
N
C
H1H4
EL2
H3
H2
N329
H7H5
H6
H3
S211
D121
EL2 T203
Salbutamol
a
b d
e
f
Dobutaminec
N329
H7 H5H6
H3
S211
N310
D121
EL2
W330
W
N329
H7 H5H6
H3
S211
D121
EL2
Figure 1 | Structure of the b1-adrenergic receptor bound to agonists.a, Structure ofb1AR shown in cartoon representation with the intracellular sideat the bottom of the figure. The ligand carmoterol is shown as a space fillingmodel (C, yellow; O, red; N, blue). The amino terminus (N), carboxy terminus(C), extracellular loop 2 (EL2), and transmembrane helices 1–4 (H1–H4) arelabelled. b–f, The same orientation of receptor is shown in panels b, theantagonist cyanopindolol; c, d, the partial agonists dobutamine and salbutamol;e, f, the full agonists isoprenaline and carmoterol. The colour scheme of the
ligand and labelling of the receptor is identical in all panels, with amino acidside chains that make hydrogen bonds to the ligands depicted (C, green; O, red;N, blue). For clarity, residues 171–196 and 94–119 have been removed inb–f, which correspond to the C-terminal region of H4 and EL2, and EL1 withthe C-terminal region of H2 and N-terminal region of H3, respectively. Allstructures shown are of monomer B (Supplementary Fig. 2) and were generatedusing Pymol (DeLano Scientific). For a comparison of the positions of theligands when bound to the receptor, see Supplementary Fig. 5.
Carmoterol
Isoprenaline
Phe 306
Phe 307
Val 122Asp 121
Asn 310
Ser 211
Ser 215
Asn 329
Trp 117
Tyr 333
Val 125
OHH3C
CH3
OHH
OH
N
B* B*
B*
a*
Salbutamol
Val 122
HO
OH
OHH
N
CH3
H3C
Val 125
Asp 121
Asn 329
Asn 310
Ser 211
Ser 215
Phe 306
Tyr 333
Thr 118
Trp 117Phe 201
Phe 307
A*
H3C
Tyr 207B*
B*
b*
Dobutamine
Val 122
OHHO
OH
CH3
H
N
Val 125
Phe 307
Ser 211
Ser 215
W
Asn 310
Phe 306
Phe 201
Asp 121
Asn 329
Leu 101
Trp 117
Tyr 333
Val 102
Gly 98
Thr 118β3: Ala 94
β3: Ala 98β2: Ile 94
β2: His 93β1: Ile 118
<B*>
Trp 330B*
[B*]
B*
Ser 212<B*>
Trp 330A*a b
c d
Phe 307
Val 122Val 125
O
O
OH
CH3
H
OHH
N
N
Phe 201
Cys 199
Tyr 333
Ala 208
Trp 117
Asn 310
Ser 215
Phe 306
Asp 121
Asn 329
Asp 200β3: Ala 197
β3: Val 205
Ser 211
H3C
Thr 203
Thr 118
b*
W
A*
A*
B*
A*B*
b*
a*
b*
Figure 2 | Polar and non-polar interactions involved in agonist binding tob1-adrenergic receptor. a–d, Amino acid residues within 3.9 A of the ligandsare depicted, with residues highlighted in blue making van der Waals contacts(blue rays) and residues highlighted in red making potential hydrogen bondswith favourable geometry (red dashed lines) or hydrogen bonds withunfavourable geometry (blue dashed lines). Amino acid residues labelled withan asterisk make the indicated contact either in monomer A (A*) or inmonomer B (B*) only; for dobutamine, some contacts, labelled ,B*., are
found only in monomer B of dob92, whereas another contact, labelled [B*], isfound only in monomer B of dob102 (Supplementary Fig. 6 and also seeSupplementary Table 6 for further details and for the Ballesteros–Weinsteinnumbering). If specific van der Waals interactions or polar interactions arefound only in monomer A or B, then the interaction is labelled a* or b*,respectively. Where the amino acid residue differs between the turkeyb1AR andthe human b1AR, b2AR and b3AR, the equivalent residue is shown highlightedin orange, purple or green, respectively (see also Supplementary Table 7).
RESEARCH LETTER
2 4 2 | N A T U R E | V O L 4 6 9 | 1 3 J A N U A R Y 2 0 1 1
Macmillan Publishers Limited. All rights reserved©2011
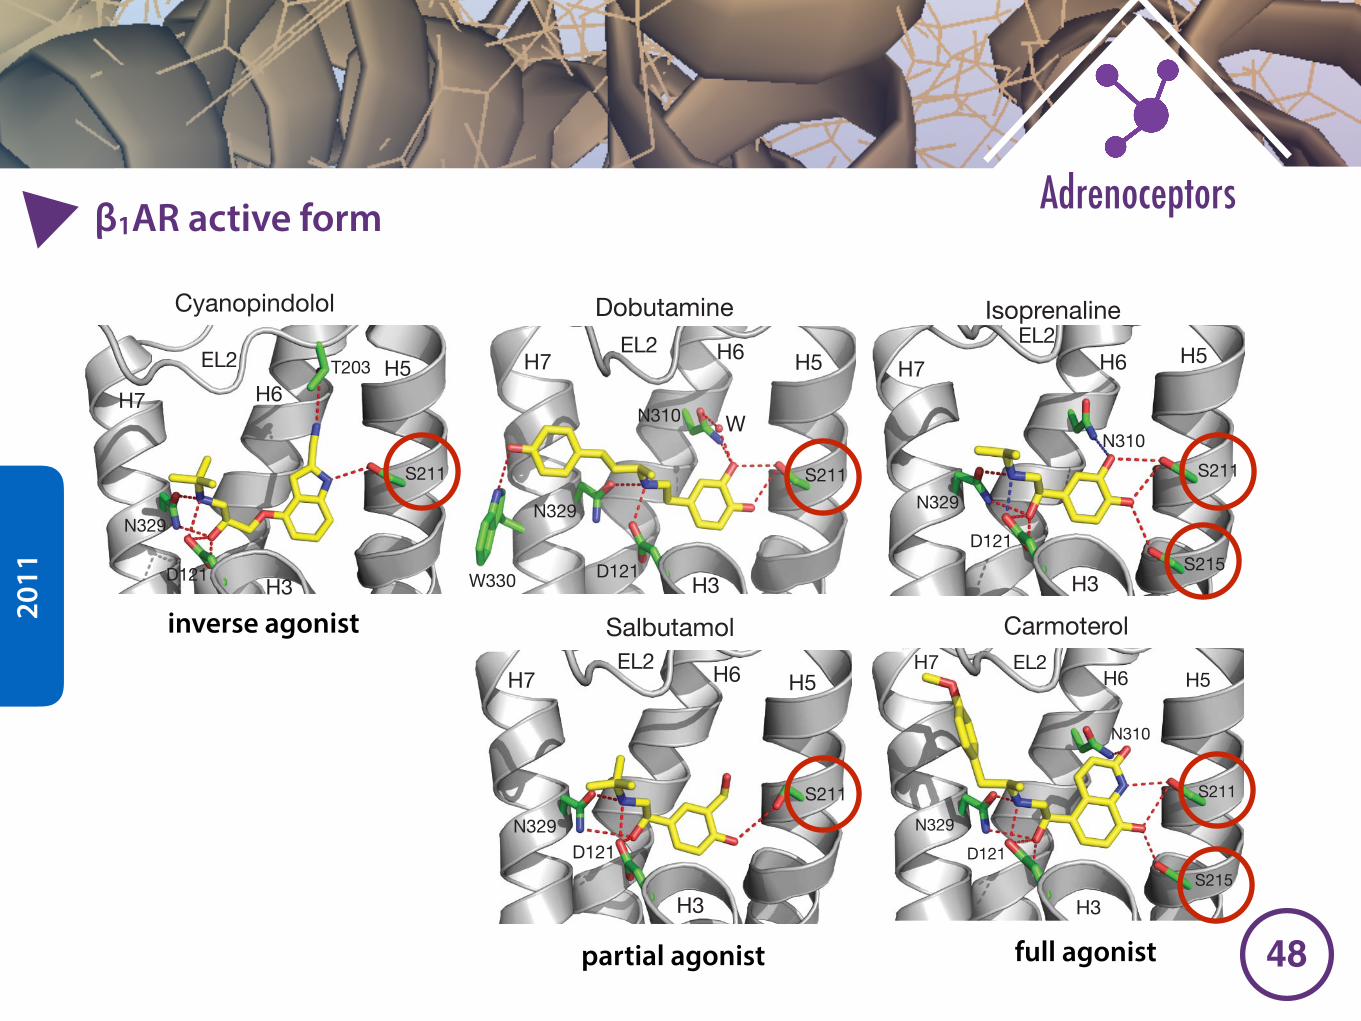
�48
Adrenoceptorsβ1AR active form
2011
inverse agonist
Isoprenaline
Carmoterol
N329
H7H5H6
H3
S211
S215
N310
D121
EL2
N329
H7H5H6
H3
S211
S215
N310
D121
EL2
Cyanopindolol
N
C
H1H4
EL2
H3
H2
N329
H7H5
H6
H3
S211
D121
EL2 T203
Salbutamol
a
b d
e
f
Dobutaminec
N329
H7 H5H6
H3
S211
N310
D121
EL2
W330
W
N329
H7 H5H6
H3
S211
D121
EL2
Figure 1 | Structure of the b1-adrenergic receptor bound to agonists.a, Structure ofb1AR shown in cartoon representation with the intracellular sideat the bottom of the figure. The ligand carmoterol is shown as a space fillingmodel (C, yellow; O, red; N, blue). The amino terminus (N), carboxy terminus(C), extracellular loop 2 (EL2), and transmembrane helices 1–4 (H1–H4) arelabelled. b–f, The same orientation of receptor is shown in panels b, theantagonist cyanopindolol; c, d, the partial agonists dobutamine and salbutamol;e, f, the full agonists isoprenaline and carmoterol. The colour scheme of the
ligand and labelling of the receptor is identical in all panels, with amino acidside chains that make hydrogen bonds to the ligands depicted (C, green; O, red;N, blue). For clarity, residues 171–196 and 94–119 have been removed inb–f, which correspond to the C-terminal region of H4 and EL2, and EL1 withthe C-terminal region of H2 and N-terminal region of H3, respectively. Allstructures shown are of monomer B (Supplementary Fig. 2) and were generatedusing Pymol (DeLano Scientific). For a comparison of the positions of theligands when bound to the receptor, see Supplementary Fig. 5.
Carmoterol
Isoprenaline
Phe 306
Phe 307
Val 122Asp 121
Asn 310
Ser 211
Ser 215
Asn 329
Trp 117
Tyr 333
Val 125
OHH3C
CH3
OHH
OH
N
B* B*
B*
a*
Salbutamol
Val 122
HO
OH
OHH
N
CH3
H3C
Val 125
Asp 121
Asn 329
Asn 310
Ser 211
Ser 215
Phe 306
Tyr 333
Thr 118
Trp 117Phe 201
Phe 307
A*
H3C
Tyr 207B*
B*
b*
Dobutamine
Val 122
OHHO
OH
CH3
H
N
Val 125
Phe 307
Ser 211
Ser 215
W
Asn 310
Phe 306
Phe 201
Asp 121
Asn 329
Leu 101
Trp 117
Tyr 333
Val 102
Gly 98
Thr 118β3: Ala 94
β3: Ala 98β2: Ile 94
β2: His 93β1: Ile 118
<B*>
Trp 330B*
[B*]
B*
Ser 212<B*>
Trp 330A*a b
c d
Phe 307
Val 122Val 125
O
O
OH
CH3
H
OHH
N
N
Phe 201
Cys 199
Tyr 333
Ala 208
Trp 117
Asn 310
Ser 215
Phe 306
Asp 121
Asn 329
Asp 200β3: Ala 197
β3: Val 205
Ser 211
H3C
Thr 203
Thr 118
b*
W
A*
A*
B*
A*B*
b*
a*
b*
Figure 2 | Polar and non-polar interactions involved in agonist binding tob1-adrenergic receptor. a–d, Amino acid residues within 3.9 A of the ligandsare depicted, with residues highlighted in blue making van der Waals contacts(blue rays) and residues highlighted in red making potential hydrogen bondswith favourable geometry (red dashed lines) or hydrogen bonds withunfavourable geometry (blue dashed lines). Amino acid residues labelled withan asterisk make the indicated contact either in monomer A (A*) or inmonomer B (B*) only; for dobutamine, some contacts, labelled ,B*., are
found only in monomer B of dob92, whereas another contact, labelled [B*], isfound only in monomer B of dob102 (Supplementary Fig. 6 and also seeSupplementary Table 6 for further details and for the Ballesteros–Weinsteinnumbering). If specific van der Waals interactions or polar interactions arefound only in monomer A or B, then the interaction is labelled a* or b*,respectively. Where the amino acid residue differs between the turkeyb1AR andthe human b1AR, b2AR and b3AR, the equivalent residue is shown highlightedin orange, purple or green, respectively (see also Supplementary Table 7).
RESEARCH LETTER
2 4 2 | N A T U R E | V O L 4 6 9 | 1 3 J A N U A R Y 2 0 1 1
Macmillan Publishers Limited. All rights reserved©2011
Isoprenaline
Carmoterol
N329
H7H5H6
H3
S211
S215
N310
D121
EL2
N329
H7H5H6
H3
S211
S215
N310
D121
EL2
Cyanopindolol
N
C
H1H4
EL2
H3
H2
N329
H7H5
H6
H3
S211
D121
EL2 T203
Salbutamol
a
b d
e
f
Dobutaminec
N329
H7 H5H6
H3
S211
N310
D121
EL2
W330
W
N329
H7 H5H6
H3
S211
D121
EL2
Figure 1 | Structure of the b1-adrenergic receptor bound to agonists.a, Structure ofb1AR shown in cartoon representation with the intracellular sideat the bottom of the figure. The ligand carmoterol is shown as a space fillingmodel (C, yellow; O, red; N, blue). The amino terminus (N), carboxy terminus(C), extracellular loop 2 (EL2), and transmembrane helices 1–4 (H1–H4) arelabelled. b–f, The same orientation of receptor is shown in panels b, theantagonist cyanopindolol; c, d, the partial agonists dobutamine and salbutamol;e, f, the full agonists isoprenaline and carmoterol. The colour scheme of the
ligand and labelling of the receptor is identical in all panels, with amino acidside chains that make hydrogen bonds to the ligands depicted (C, green; O, red;N, blue). For clarity, residues 171–196 and 94–119 have been removed inb–f, which correspond to the C-terminal region of H4 and EL2, and EL1 withthe C-terminal region of H2 and N-terminal region of H3, respectively. Allstructures shown are of monomer B (Supplementary Fig. 2) and were generatedusing Pymol (DeLano Scientific). For a comparison of the positions of theligands when bound to the receptor, see Supplementary Fig. 5.
Carmoterol
Isoprenaline
Phe 306
Phe 307
Val 122Asp 121
Asn 310
Ser 211
Ser 215
Asn 329
Trp 117
Tyr 333
Val 125
OHH3C
CH3
OHH
OH
N
B* B*
B*
a*
Salbutamol
Val 122
HO
OH
OHH
N
CH3
H3C
Val 125
Asp 121
Asn 329
Asn 310
Ser 211
Ser 215
Phe 306
Tyr 333
Thr 118
Trp 117Phe 201
Phe 307
A*
H3C
Tyr 207B*
B*
b*
Dobutamine
Val 122
OHHO
OH
CH3
H
N
Val 125
Phe 307
Ser 211
Ser 215
W
Asn 310
Phe 306
Phe 201
Asp 121
Asn 329
Leu 101
Trp 117
Tyr 333
Val 102
Gly 98
Thr 118β3: Ala 94
β3: Ala 98β2: Ile 94
β2: His 93β1: Ile 118
<B*>
Trp 330B*
[B*]
B*
Ser 212<B*>
Trp 330A*a b
c d
Phe 307
Val 122Val 125
O
O
OH
CH3
H
OHH
N
N
Phe 201
Cys 199
Tyr 333
Ala 208
Trp 117
Asn 310
Ser 215
Phe 306
Asp 121
Asn 329
Asp 200β3: Ala 197
β3: Val 205
Ser 211
H3C
Thr 203
Thr 118
b*
W
A*
A*
B*
A*B*
b*
a*
b*
Figure 2 | Polar and non-polar interactions involved in agonist binding tob1-adrenergic receptor. a–d, Amino acid residues within 3.9 A of the ligandsare depicted, with residues highlighted in blue making van der Waals contacts(blue rays) and residues highlighted in red making potential hydrogen bondswith favourable geometry (red dashed lines) or hydrogen bonds withunfavourable geometry (blue dashed lines). Amino acid residues labelled withan asterisk make the indicated contact either in monomer A (A*) or inmonomer B (B*) only; for dobutamine, some contacts, labelled ,B*., are
found only in monomer B of dob92, whereas another contact, labelled [B*], isfound only in monomer B of dob102 (Supplementary Fig. 6 and also seeSupplementary Table 6 for further details and for the Ballesteros–Weinsteinnumbering). If specific van der Waals interactions or polar interactions arefound only in monomer A or B, then the interaction is labelled a* or b*,respectively. Where the amino acid residue differs between the turkeyb1AR andthe human b1AR, b2AR and b3AR, the equivalent residue is shown highlightedin orange, purple or green, respectively (see also Supplementary Table 7).
RESEARCH LETTER
2 4 2 | N A T U R E | V O L 4 6 9 | 1 3 J A N U A R Y 2 0 1 1
Macmillan Publishers Limited. All rights reserved©2011
partial agonist full agonist
Isoprenaline
Carmoterol
N329
H7H5H6
H3
S211
S215
N310
D121
EL2
N329
H7H5H6
H3
S211
S215
N310
D121
EL2
Cyanopindolol
N
C
H1H4
EL2
H3
H2
N329
H7H5
H6
H3
S211
D121
EL2 T203
Salbutamol
a
b d
e
f
Dobutaminec
N329
H7 H5H6
H3
S211
N310
D121
EL2
W330
W
N329
H7 H5H6
H3
S211
D121
EL2
Figure 1 | Structure of the b1-adrenergic receptor bound to agonists.a, Structure ofb1AR shown in cartoon representation with the intracellular sideat the bottom of the figure. The ligand carmoterol is shown as a space fillingmodel (C, yellow; O, red; N, blue). The amino terminus (N), carboxy terminus(C), extracellular loop 2 (EL2), and transmembrane helices 1–4 (H1–H4) arelabelled. b–f, The same orientation of receptor is shown in panels b, theantagonist cyanopindolol; c, d, the partial agonists dobutamine and salbutamol;e, f, the full agonists isoprenaline and carmoterol. The colour scheme of the
ligand and labelling of the receptor is identical in all panels, with amino acidside chains that make hydrogen bonds to the ligands depicted (C, green; O, red;N, blue). For clarity, residues 171–196 and 94–119 have been removed inb–f, which correspond to the C-terminal region of H4 and EL2, and EL1 withthe C-terminal region of H2 and N-terminal region of H3, respectively. Allstructures shown are of monomer B (Supplementary Fig. 2) and were generatedusing Pymol (DeLano Scientific). For a comparison of the positions of theligands when bound to the receptor, see Supplementary Fig. 5.
Carmoterol
Isoprenaline
Phe 306
Phe 307
Val 122Asp 121
Asn 310
Ser 211
Ser 215
Asn 329
Trp 117
Tyr 333
Val 125
OHH3C
CH3
OHH
OH
N
B* B*
B*
a*
Salbutamol
Val 122
HO
OH
OHH
N
CH3
H3C
Val 125
Asp 121
Asn 329
Asn 310
Ser 211
Ser 215
Phe 306
Tyr 333
Thr 118
Trp 117Phe 201
Phe 307
A*
H3C
Tyr 207B*
B*
b*
Dobutamine
Val 122
OHHO
OH
CH3
H
N
Val 125
Phe 307
Ser 211
Ser 215
W
Asn 310
Phe 306
Phe 201
Asp 121
Asn 329
Leu 101
Trp 117
Tyr 333
Val 102
Gly 98
Thr 118β3: Ala 94
β3: Ala 98β2: Ile 94
β2: His 93β1: Ile 118
<B*>
Trp 330B*
[B*]
B*
Ser 212<B*>
Trp 330A*a b
c d
Phe 307
Val 122Val 125
O
O
OH
CH3
H
OHH
N
N
Phe 201
Cys 199
Tyr 333
Ala 208
Trp 117
Asn 310
Ser 215
Phe 306
Asp 121
Asn 329
Asp 200β3: Ala 197
β3: Val 205
Ser 211
H3C
Thr 203
Thr 118
b*
W
A*
A*
B*
A*B*
b*
a*
b*
Figure 2 | Polar and non-polar interactions involved in agonist binding tob1-adrenergic receptor. a–d, Amino acid residues within 3.9 A of the ligandsare depicted, with residues highlighted in blue making van der Waals contacts(blue rays) and residues highlighted in red making potential hydrogen bondswith favourable geometry (red dashed lines) or hydrogen bonds withunfavourable geometry (blue dashed lines). Amino acid residues labelled withan asterisk make the indicated contact either in monomer A (A*) or inmonomer B (B*) only; for dobutamine, some contacts, labelled ,B*., are
found only in monomer B of dob92, whereas another contact, labelled [B*], isfound only in monomer B of dob102 (Supplementary Fig. 6 and also seeSupplementary Table 6 for further details and for the Ballesteros–Weinsteinnumbering). If specific van der Waals interactions or polar interactions arefound only in monomer A or B, then the interaction is labelled a* or b*,respectively. Where the amino acid residue differs between the turkeyb1AR andthe human b1AR, b2AR and b3AR, the equivalent residue is shown highlightedin orange, purple or green, respectively (see also Supplementary Table 7).
RESEARCH LETTER
2 4 2 | N A T U R E | V O L 4 6 9 | 1 3 J A N U A R Y 2 0 1 1
Macmillan Publishers Limited. All rights reserved©2011
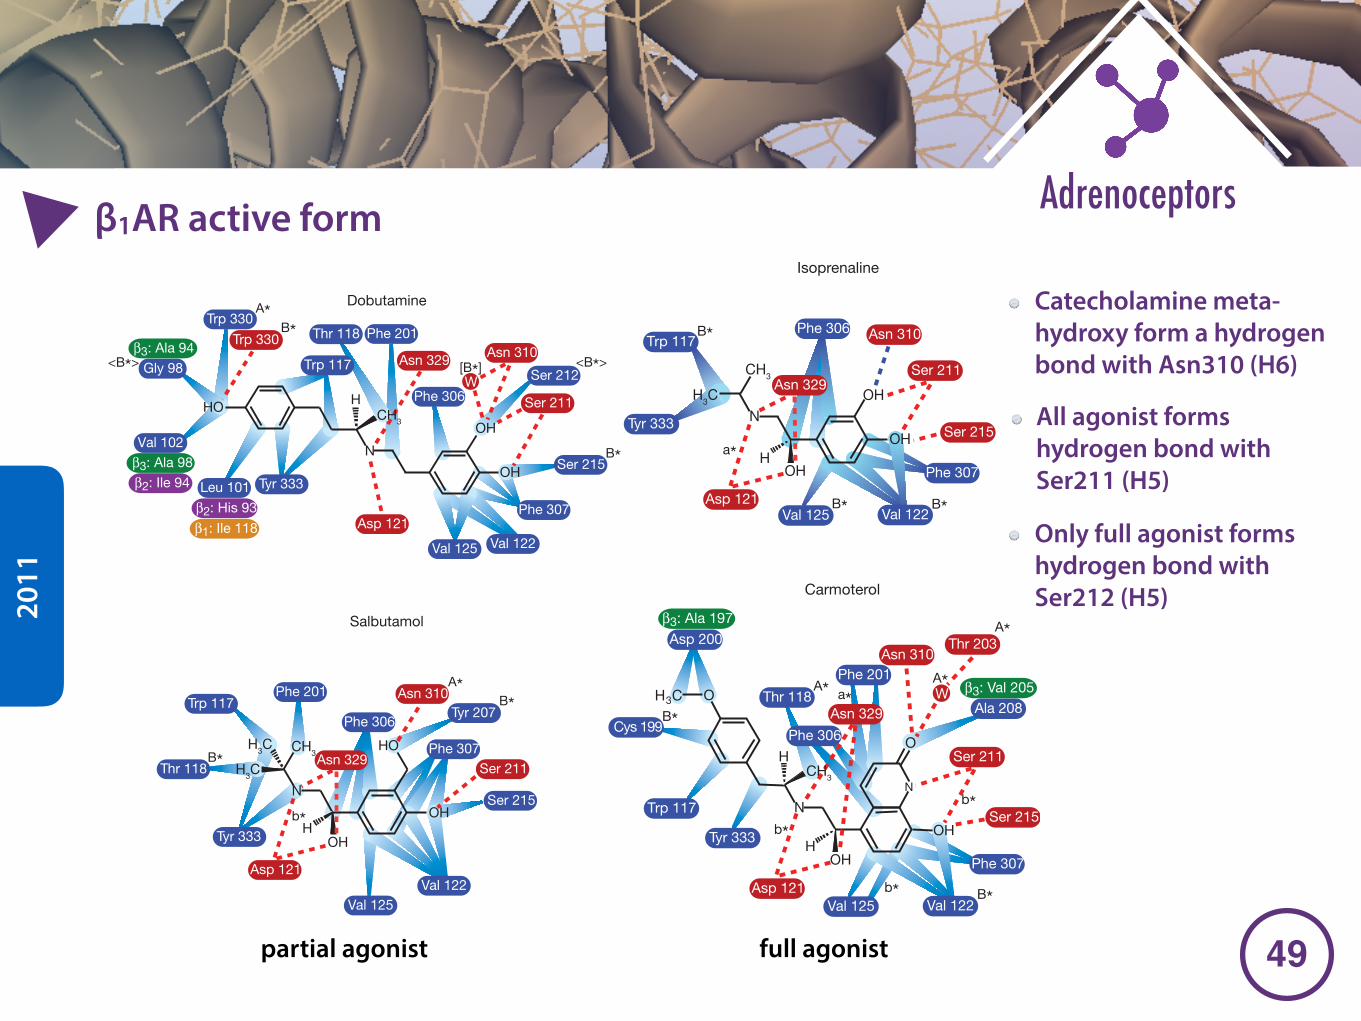
�49
Adrenoceptorsβ1AR active form
2011
partial agonist
Isoprenaline
Carmoterol
N329
H7H5H6
H3
S211
S215
N310
D121
EL2
N329
H7H5H6
H3
S211
S215
N310
D121
EL2
Cyanopindolol
N
C
H1H4
EL2
H3
H2
N329
H7H5
H6
H3
S211
D121
EL2 T203
Salbutamol
a
b d
e
f
Dobutaminec
N329
H7 H5H6
H3
S211
N310
D121
EL2
W330
W
N329
H7 H5H6
H3
S211
D121
EL2
Figure 1 | Structure of the b1-adrenergic receptor bound to agonists.a, Structure ofb1AR shown in cartoon representation with the intracellular sideat the bottom of the figure. The ligand carmoterol is shown as a space fillingmodel (C, yellow; O, red; N, blue). The amino terminus (N), carboxy terminus(C), extracellular loop 2 (EL2), and transmembrane helices 1–4 (H1–H4) arelabelled. b–f, The same orientation of receptor is shown in panels b, theantagonist cyanopindolol; c, d, the partial agonists dobutamine and salbutamol;e, f, the full agonists isoprenaline and carmoterol. The colour scheme of the
ligand and labelling of the receptor is identical in all panels, with amino acidside chains that make hydrogen bonds to the ligands depicted (C, green; O, red;N, blue). For clarity, residues 171–196 and 94–119 have been removed inb–f, which correspond to the C-terminal region of H4 and EL2, and EL1 withthe C-terminal region of H2 and N-terminal region of H3, respectively. Allstructures shown are of monomer B (Supplementary Fig. 2) and were generatedusing Pymol (DeLano Scientific). For a comparison of the positions of theligands when bound to the receptor, see Supplementary Fig. 5.
Carmoterol
Isoprenaline
Phe 306
Phe 307
Val 122Asp 121
Asn 310
Ser 211
Ser 215
Asn 329
Trp 117
Tyr 333
Val 125
OHH3C
CH3
OHH
OH
N
B* B*
B*
a*
Salbutamol
Val 122
HO
OH
OHH
N
CH3
H3C
Val 125
Asp 121
Asn 329
Asn 310
Ser 211
Ser 215
Phe 306
Tyr 333
Thr 118
Trp 117Phe 201
Phe 307
A*
H3C
Tyr 207B*
B*
b*
Dobutamine
Val 122
OHHO
OH
CH3
H
N
Val 125
Phe 307
Ser 211
Ser 215
W
Asn 310
Phe 306
Phe 201
Asp 121
Asn 329
Leu 101
Trp 117
Tyr 333
Val 102
Gly 98
Thr 118β3: Ala 94
β3: Ala 98β2: Ile 94
β2: His 93β1: Ile 118
<B*>
Trp 330B*
[B*]
B*
Ser 212<B*>
Trp 330A*a b
c d
Phe 307
Val 122Val 125
O
O
OH
CH3
H
OHH
N
N
Phe 201
Cys 199
Tyr 333
Ala 208
Trp 117
Asn 310
Ser 215
Phe 306
Asp 121
Asn 329
Asp 200β3: Ala 197
β3: Val 205
Ser 211
H3C
Thr 203
Thr 118
b*
W
A*
A*
B*
A*B*
b*
a*
b*
Figure 2 | Polar and non-polar interactions involved in agonist binding tob1-adrenergic receptor. a–d, Amino acid residues within 3.9 A of the ligandsare depicted, with residues highlighted in blue making van der Waals contacts(blue rays) and residues highlighted in red making potential hydrogen bondswith favourable geometry (red dashed lines) or hydrogen bonds withunfavourable geometry (blue dashed lines). Amino acid residues labelled withan asterisk make the indicated contact either in monomer A (A*) or inmonomer B (B*) only; for dobutamine, some contacts, labelled ,B*., are
found only in monomer B of dob92, whereas another contact, labelled [B*], isfound only in monomer B of dob102 (Supplementary Fig. 6 and also seeSupplementary Table 6 for further details and for the Ballesteros–Weinsteinnumbering). If specific van der Waals interactions or polar interactions arefound only in monomer A or B, then the interaction is labelled a* or b*,respectively. Where the amino acid residue differs between the turkeyb1AR andthe human b1AR, b2AR and b3AR, the equivalent residue is shown highlightedin orange, purple or green, respectively (see also Supplementary Table 7).
RESEARCH LETTER
2 4 2 | N A T U R E | V O L 4 6 9 | 1 3 J A N U A R Y 2 0 1 1
Macmillan Publishers Limited. All rights reserved©2011
full agonist
Isoprenaline
Carmoterol
N329
H7H5H6
H3
S211
S215
N310
D121
EL2
N329
H7H5H6
H3
S211
S215
N310
D121
EL2
Cyanopindolol
N
C
H1H4
EL2
H3
H2
N329
H7H5
H6
H3
S211
D121
EL2 T203
Salbutamol
a
b d
e
f
Dobutaminec
N329
H7 H5H6
H3
S211
N310
D121
EL2
W330
W
N329
H7 H5H6
H3
S211
D121
EL2
Figure 1 | Structure of the b1-adrenergic receptor bound to agonists.a, Structure ofb1AR shown in cartoon representation with the intracellular sideat the bottom of the figure. The ligand carmoterol is shown as a space fillingmodel (C, yellow; O, red; N, blue). The amino terminus (N), carboxy terminus(C), extracellular loop 2 (EL2), and transmembrane helices 1–4 (H1–H4) arelabelled. b–f, The same orientation of receptor is shown in panels b, theantagonist cyanopindolol; c, d, the partial agonists dobutamine and salbutamol;e, f, the full agonists isoprenaline and carmoterol. The colour scheme of the
ligand and labelling of the receptor is identical in all panels, with amino acidside chains that make hydrogen bonds to the ligands depicted (C, green; O, red;N, blue). For clarity, residues 171–196 and 94–119 have been removed inb–f, which correspond to the C-terminal region of H4 and EL2, and EL1 withthe C-terminal region of H2 and N-terminal region of H3, respectively. Allstructures shown are of monomer B (Supplementary Fig. 2) and were generatedusing Pymol (DeLano Scientific). For a comparison of the positions of theligands when bound to the receptor, see Supplementary Fig. 5.
Carmoterol
Isoprenaline
Phe 306
Phe 307
Val 122Asp 121
Asn 310
Ser 211
Ser 215
Asn 329
Trp 117
Tyr 333
Val 125
OHH3C
CH3
OHH
OH
N
B* B*
B*
a*
Salbutamol
Val 122
HO
OH
OHH
N
CH3
H3C
Val 125
Asp 121
Asn 329
Asn 310
Ser 211
Ser 215
Phe 306
Tyr 333
Thr 118
Trp 117Phe 201
Phe 307
A*
H3C
Tyr 207B*
B*
b*
Dobutamine
Val 122
OHHO
OH
CH3
H
N
Val 125
Phe 307
Ser 211
Ser 215
W
Asn 310
Phe 306
Phe 201
Asp 121
Asn 329
Leu 101
Trp 117
Tyr 333
Val 102
Gly 98
Thr 118β3: Ala 94
β3: Ala 98β2: Ile 94
β2: His 93β1: Ile 118
<B*>
Trp 330B*
[B*]
B*
Ser 212<B*>
Trp 330A*a b
c d
Phe 307
Val 122Val 125
O
O
OH
CH3
H
OHH
N
N
Phe 201
Cys 199
Tyr 333
Ala 208
Trp 117
Asn 310
Ser 215
Phe 306
Asp 121
Asn 329
Asp 200β3: Ala 197
β3: Val 205
Ser 211
H3C
Thr 203
Thr 118
b*
W
A*
A*
B*
A*B*
b*
a*
b*
Figure 2 | Polar and non-polar interactions involved in agonist binding tob1-adrenergic receptor. a–d, Amino acid residues within 3.9 A of the ligandsare depicted, with residues highlighted in blue making van der Waals contacts(blue rays) and residues highlighted in red making potential hydrogen bondswith favourable geometry (red dashed lines) or hydrogen bonds withunfavourable geometry (blue dashed lines). Amino acid residues labelled withan asterisk make the indicated contact either in monomer A (A*) or inmonomer B (B*) only; for dobutamine, some contacts, labelled ,B*., are
found only in monomer B of dob92, whereas another contact, labelled [B*], isfound only in monomer B of dob102 (Supplementary Fig. 6 and also seeSupplementary Table 6 for further details and for the Ballesteros–Weinsteinnumbering). If specific van der Waals interactions or polar interactions arefound only in monomer A or B, then the interaction is labelled a* or b*,respectively. Where the amino acid residue differs between the turkeyb1AR andthe human b1AR, b2AR and b3AR, the equivalent residue is shown highlightedin orange, purple or green, respectively (see also Supplementary Table 7).
RESEARCH LETTER
2 4 2 | N A T U R E | V O L 4 6 9 | 1 3 J A N U A R Y 2 0 1 1
Macmillan Publishers Limited. All rights reserved©2011
Catecholamine meta-hydroxy form a hydrogen bond with Asn310 (H6)
All agonist forms hydrogen bond with Ser211 (H5)
Only full agonist forms hydrogen bond with Ser212 (H5)
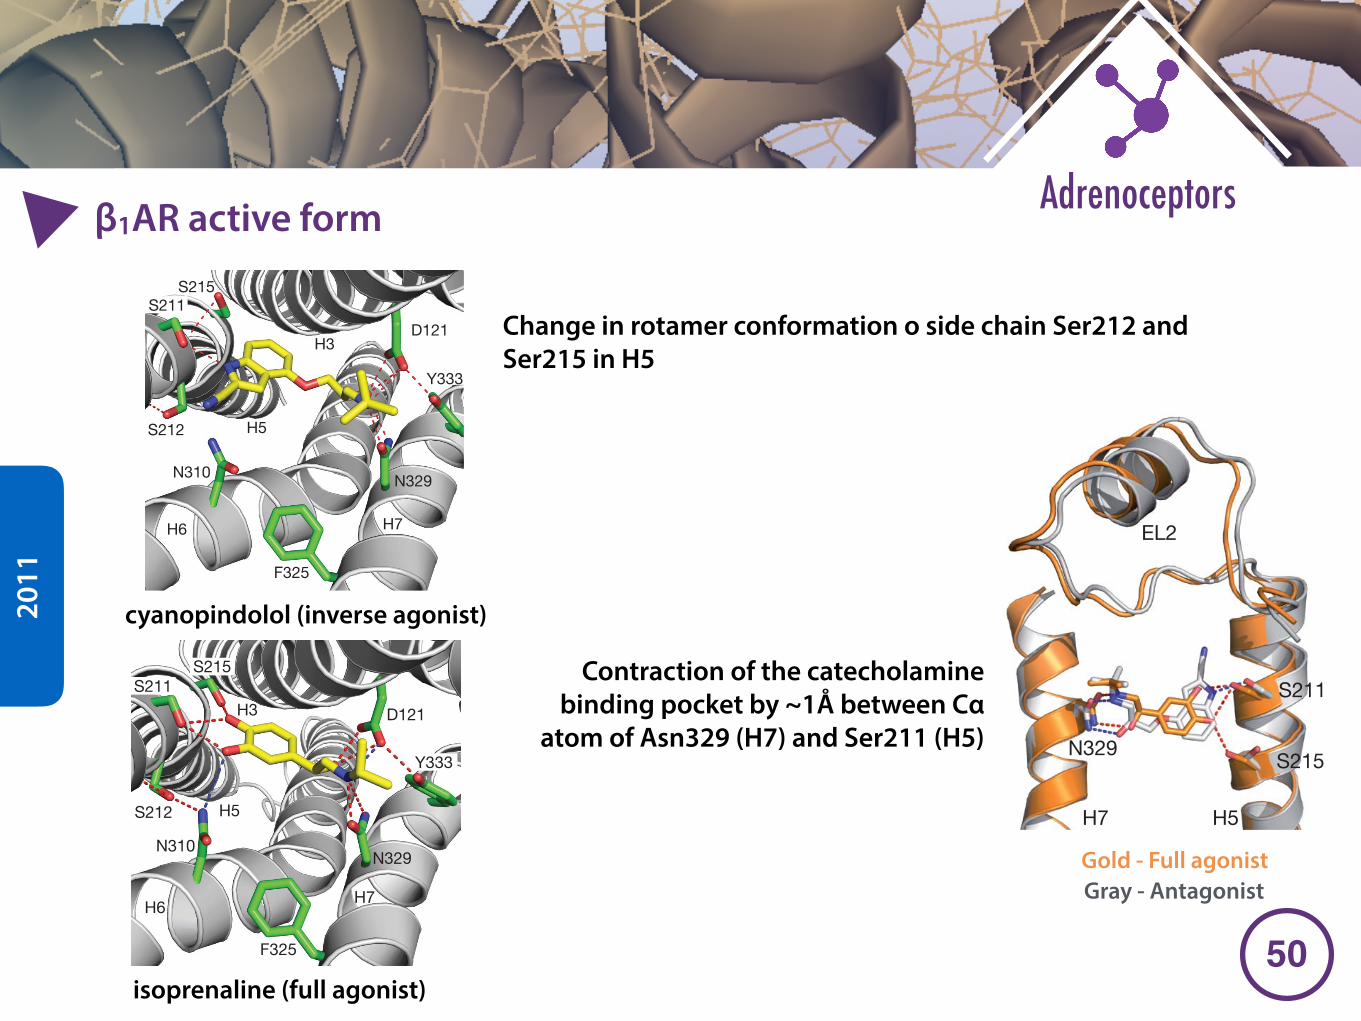
�50
Adrenoceptorsβ1AR active form
2011
Change in rotamer conformation o side chain Ser212 and Ser215 in H5
between H4 and H5. As there is only a minimal interface betweentransmembrane helices H4 and H5 in this region (SupplementaryTable 8 and Supplementary Fig. 8), this loss of interaction may besignificant in the activation process. In this regard, it is noteworthy thatthe naturally occurring polymorphism inb2AR at the H4–H5 interface,T164I4.56, converts a polar residue to a hydrophobic residue as seen inb1AR (Val 1724.56), which results in both reduced basal activity andreduced agonist stimulation21. This supports the hypothesis that theextent of interaction between H4 and H5 could affect the probabilityof a receptor transition into the activated state.
In contrast to the apparent weakening of helix–helix interactions bythe agonist-induced rotamer conformation change of Ser 2155.46, theagonist-induced rotamer conformation change of Ser 2125.43 probablyresults in the strengthening of interactions between H5 and H6. Uponagonist binding, Ser 2125.43 forms a hydrogen bond with Asn 3106.55
(Fig. 3) and, in addition, hydrogen bond interactions to Ser 2115.43 andAsn 3106.55 mediated by the ligand serve to bridge H5 and H6. The
combined effects of strengthening the H5–H6 interface and weakeningthe H4–H5 interface could facilitate the subsequent movements of H5and H6, as observed in the activation of rhodopsin.
Stabilization of the contracted catecholamine binding pocket is prob-ably the most important role of bound agonists in the activation process(Fig. 4). This probably requires strong hydrogen bonding interactionsbetween the catechol (or equivalent) moiety and both H5 and H6, andstrong interactions between the secondary amine and b-hydroxylgroups in the agonist and the amino acid side chains in helices H3and H7. Reduction in the strength of these interactions is likely to reducethe efficacy of a ligand29. Both salbutamol and dobutamine are partialagonists of b1AR-m23 (Supplementary Table 3) and human b1AR. Inthe case of salbutamol, there are only two predicted hydrogen bondsbetween the headgroup and H5/H6, compared to three–four potentialhydrogen bonds for isoprenaline and carmoterol. Dobutamine lacks theb-hydroxyl group, which similarly reduces the number of potentialhydrogen bonds to H3/H7 from three–four seen in the other agoniststo only two. We propose that this weakening of agonist interactions withH5/H6 for salbutamol and H3/H7 for dobutamine is a major contri-buting factor in making these ligands partial agonists rather than fullagonists.
The agonist-bound structures ofb1AR indicate there are three majordeterminants that dictate the efficacy of any ligand: ligand-inducedrotamer conformational changes of (1) Ser 2125.43 and (2) Ser 2155.46
and (3) stabilization of the contracted ligand-binding pocket. The fullagonists studied here achieve all three. The partial agonists studied heredo not alter the conformation of Ser 2155.46 and may be less successfulthan isoprenaline or carmoterol at stabilizing the contracted catecho-lamine binding pocket due to reduced numbers of hydrogen bondsbetween the ligand and the receptor. The antagonist cyanopindololacts as a very weak partial agonist and none of the three agonist-induced changes are observed. In contrast to partial agonists, neutralantagonists or very weak partial agonists such as cyanopindolol mayalso have a reduced ability to contract the binding pocket owing to thegreater distance between the secondary amine and the catechol moiety(or equivalent). For example, the number of atoms in the linkerbetween the secondary amine and the headgroup of cyanopindolol isfour, whereas the agonists in this study only contain two (Fig. 1 andSupplementary Fig. 4). A ligand with a sufficiently bulky headgroupthat binds with high affinity and which actively prevents any spontan-eous contraction of the binding pocket and/or Ser5.46 rotamer change,would be predicted to act as a full inverse agonist. This is indeed what isobserved in the recently determined structure15 of b2AR bound to theinverse agonist ICI 118,551.
The significant structural similarities amongst GPCRs suggests thatsimilar agonist-induced conformational changes to those we have
S212
N310
D121
N329
Y333
S211S215
F325
H7H6
H5
H3
c
S212
S215
N310
D121
N329
Y333
S211
F325
H7H6
H5
H3
b
Y308
N293
N312
D113
S204
Y316
S207S203
H7H6
H5
H3
a
Figure 3 | Comparison of the ligand-binding pockets of the b1 and b2
adrenergic receptors. The ligand-binding pockets are shown as viewed fromthe extracellular surface with EL2 removed for clarity (same colour scheme as inFig. 1). a, b2AR with the antagonist carazolol bound (PDB code 2RH1); b, b1ARwith the antagonist cyanopindolol bound (PDB code 2VT4); c, b1AR with theagonist isoprenaline bound.
H7 H5
S211
S215N329
EL2
Figure 4 | Differences in the ligand-binding pocket between antagonist- andagonist-bound b1-adrenergic receptor. An alignment was performed (seeMethods) between the structures of b1AR-m23 bound to either cyanopindolol(grey) or isoprenaline (orange) and the relative positions of the ligands and thetransmembrane helices H5 and H7 are depicted. The 1 A contraction of theligand-binding pocket between H5 and H7 is clear.
LETTER RESEARCH
1 3 J A N U A R Y 2 0 1 1 | V O L 4 6 9 | N A T U R E | 2 4 3
Macmillan Publishers Limited. All rights reserved©2011
cyanopindolol (inverse agonist)
isoprenaline (full agonist)
between H4 and H5. As there is only a minimal interface betweentransmembrane helices H4 and H5 in this region (SupplementaryTable 8 and Supplementary Fig. 8), this loss of interaction may besignificant in the activation process. In this regard, it is noteworthy thatthe naturally occurring polymorphism inb2AR at the H4–H5 interface,T164I4.56, converts a polar residue to a hydrophobic residue as seen inb1AR (Val 1724.56), which results in both reduced basal activity andreduced agonist stimulation21. This supports the hypothesis that theextent of interaction between H4 and H5 could affect the probabilityof a receptor transition into the activated state.
In contrast to the apparent weakening of helix–helix interactions bythe agonist-induced rotamer conformation change of Ser 2155.46, theagonist-induced rotamer conformation change of Ser 2125.43 probablyresults in the strengthening of interactions between H5 and H6. Uponagonist binding, Ser 2125.43 forms a hydrogen bond with Asn 3106.55
(Fig. 3) and, in addition, hydrogen bond interactions to Ser 2115.43 andAsn 3106.55 mediated by the ligand serve to bridge H5 and H6. The
combined effects of strengthening the H5–H6 interface and weakeningthe H4–H5 interface could facilitate the subsequent movements of H5and H6, as observed in the activation of rhodopsin.
Stabilization of the contracted catecholamine binding pocket is prob-ably the most important role of bound agonists in the activation process(Fig. 4). This probably requires strong hydrogen bonding interactionsbetween the catechol (or equivalent) moiety and both H5 and H6, andstrong interactions between the secondary amine and b-hydroxylgroups in the agonist and the amino acid side chains in helices H3and H7. Reduction in the strength of these interactions is likely to reducethe efficacy of a ligand29. Both salbutamol and dobutamine are partialagonists of b1AR-m23 (Supplementary Table 3) and human b1AR. Inthe case of salbutamol, there are only two predicted hydrogen bondsbetween the headgroup and H5/H6, compared to three–four potentialhydrogen bonds for isoprenaline and carmoterol. Dobutamine lacks theb-hydroxyl group, which similarly reduces the number of potentialhydrogen bonds to H3/H7 from three–four seen in the other agoniststo only two. We propose that this weakening of agonist interactions withH5/H6 for salbutamol and H3/H7 for dobutamine is a major contri-buting factor in making these ligands partial agonists rather than fullagonists.
The agonist-bound structures ofb1AR indicate there are three majordeterminants that dictate the efficacy of any ligand: ligand-inducedrotamer conformational changes of (1) Ser 2125.43 and (2) Ser 2155.46
and (3) stabilization of the contracted ligand-binding pocket. The fullagonists studied here achieve all three. The partial agonists studied heredo not alter the conformation of Ser 2155.46 and may be less successfulthan isoprenaline or carmoterol at stabilizing the contracted catecho-lamine binding pocket due to reduced numbers of hydrogen bondsbetween the ligand and the receptor. The antagonist cyanopindololacts as a very weak partial agonist and none of the three agonist-induced changes are observed. In contrast to partial agonists, neutralantagonists or very weak partial agonists such as cyanopindolol mayalso have a reduced ability to contract the binding pocket owing to thegreater distance between the secondary amine and the catechol moiety(or equivalent). For example, the number of atoms in the linkerbetween the secondary amine and the headgroup of cyanopindolol isfour, whereas the agonists in this study only contain two (Fig. 1 andSupplementary Fig. 4). A ligand with a sufficiently bulky headgroupthat binds with high affinity and which actively prevents any spontan-eous contraction of the binding pocket and/or Ser5.46 rotamer change,would be predicted to act as a full inverse agonist. This is indeed what isobserved in the recently determined structure15 of b2AR bound to theinverse agonist ICI 118,551.
The significant structural similarities amongst GPCRs suggests thatsimilar agonist-induced conformational changes to those we have
S212
N310
D121
N329
Y333
S211S215
F325
H7H6
H5
H3
c
S212
S215
N310
D121
N329
Y333
S211
F325
H7H6
H5
H3
b
Y308
N293
N312
D113
S204
Y316
S207S203
H7H6
H5
H3
a
Figure 3 | Comparison of the ligand-binding pockets of the b1 and b2
adrenergic receptors. The ligand-binding pockets are shown as viewed fromthe extracellular surface with EL2 removed for clarity (same colour scheme as inFig. 1). a, b2AR with the antagonist carazolol bound (PDB code 2RH1); b, b1ARwith the antagonist cyanopindolol bound (PDB code 2VT4); c, b1AR with theagonist isoprenaline bound.
H7 H5
S211
S215N329
EL2
Figure 4 | Differences in the ligand-binding pocket between antagonist- andagonist-bound b1-adrenergic receptor. An alignment was performed (seeMethods) between the structures of b1AR-m23 bound to either cyanopindolol(grey) or isoprenaline (orange) and the relative positions of the ligands and thetransmembrane helices H5 and H7 are depicted. The 1 A contraction of theligand-binding pocket between H5 and H7 is clear.
LETTER RESEARCH
1 3 J A N U A R Y 2 0 1 1 | V O L 4 6 9 | N A T U R E | 2 4 3
Macmillan Publishers Limited. All rights reserved©2011
Contraction of the catecholamine binding pocket by ~1Å between Cα
atom of Asn329 (H7) and Ser211 (H5)
Gold - Full agonist Gray - Antagonist
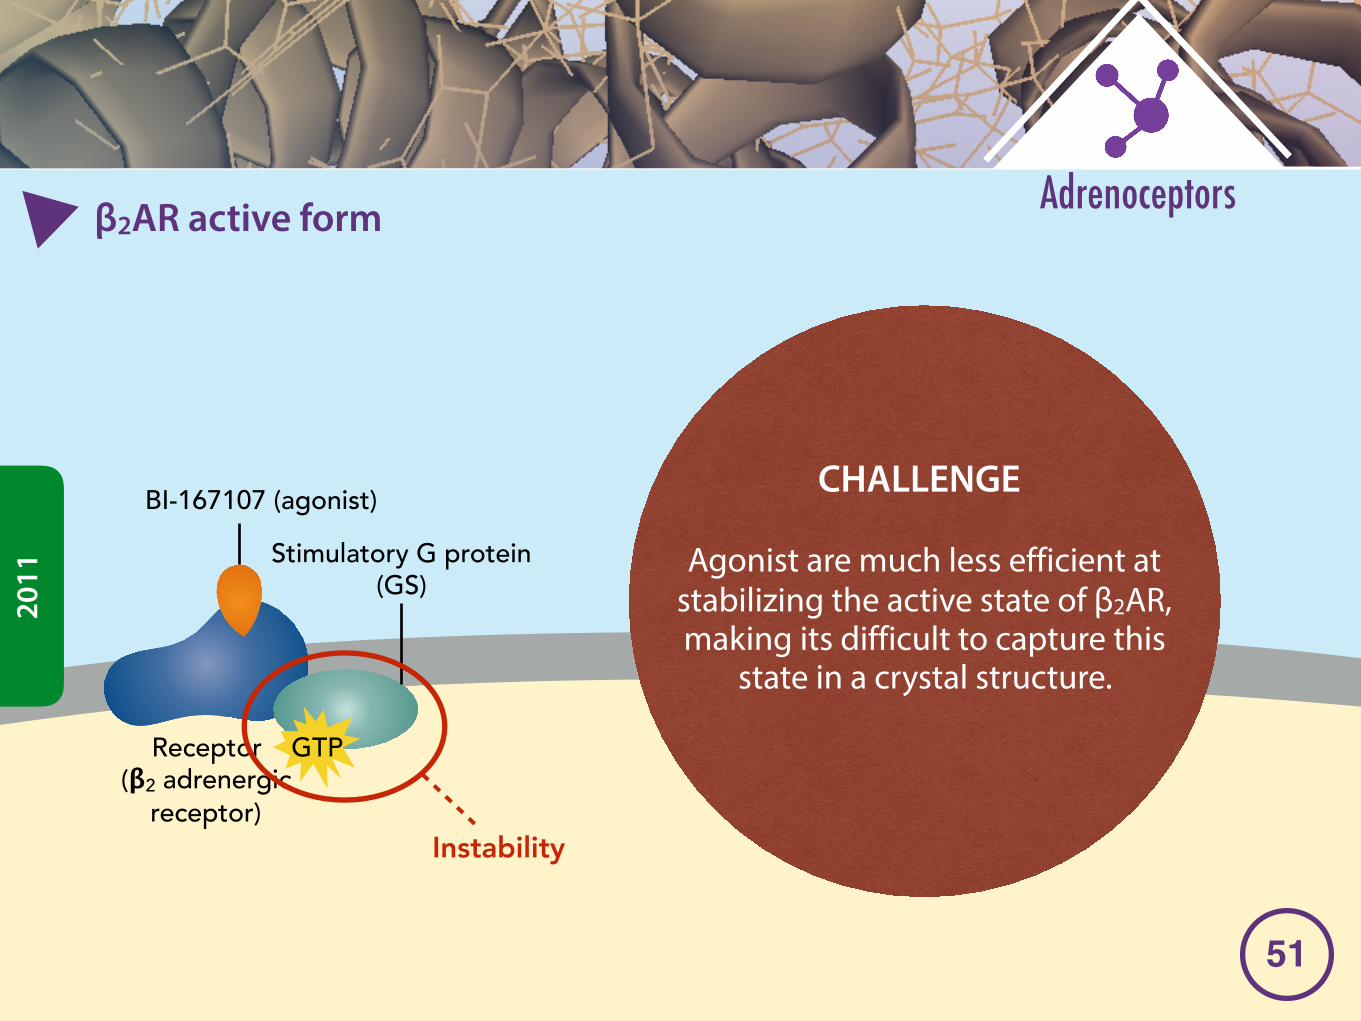
CHALLENGE
Agonist are much less efficient at stabilizing the active state of β2AR, making its difficult to capture this
state in a crystal structure.
BI-167107 (agonist)
Receptor (β2 adrenergic
receptor)
Stimulatory G protein (GS)
GTP
Instability
β2AR active form Adrenoceptors
2011
�51
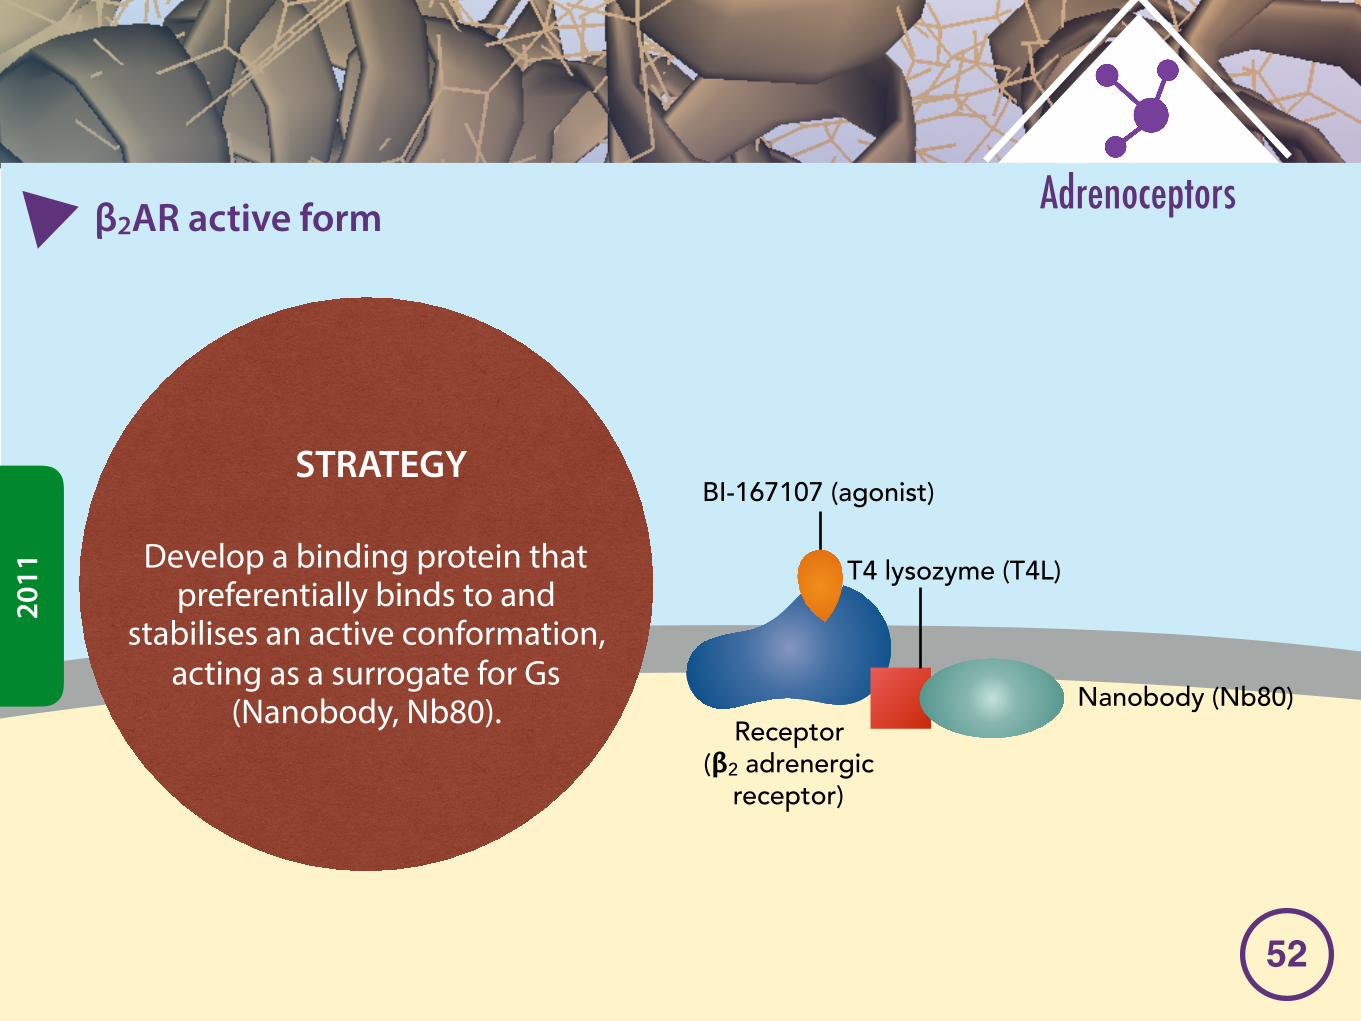
�52
BI-167107 (agonist)
Receptor (β2 adrenergic
receptor)
T4 lysozyme (T4L)
Nanobody (Nb80)
STRATEGY
Develop a binding protein that preferentially binds to and
stabilises an active conformation, acting as a surrogate for Gs
(Nanobody, Nb80).
Adrenoceptorsβ2AR active form
2011
�52
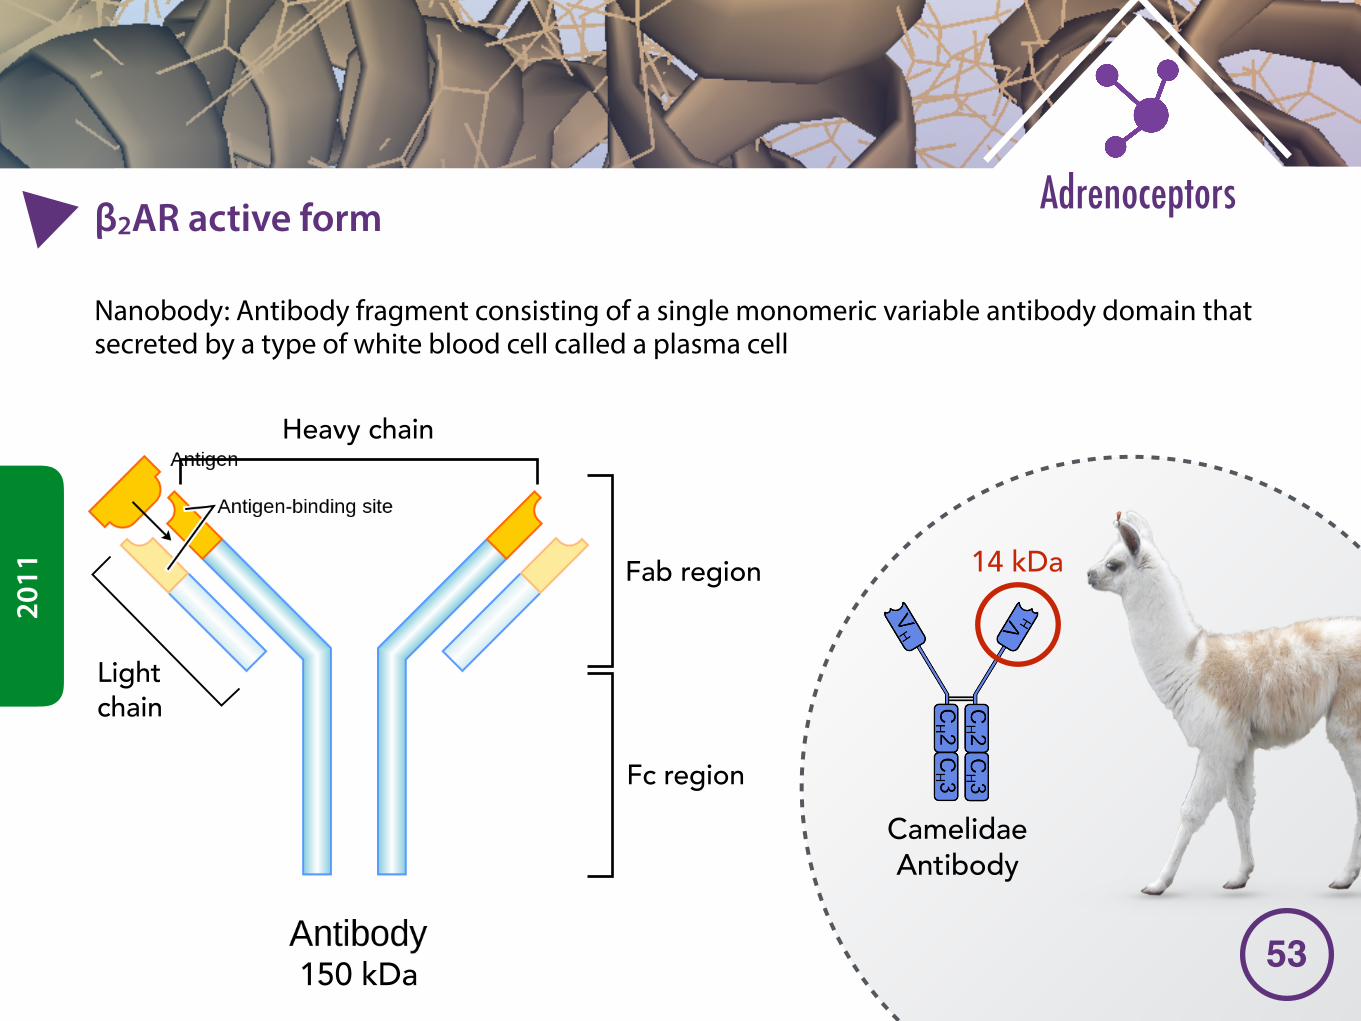
�53
Adrenoceptorsβ2AR active form
2011
Nanobody: Antibody fragment consisting of a single monomeric variable antibody domain that secreted by a type of white blood cell called a plasma cell
150 kDa
Camelidae Antibody
14 kDaFab region
Fc region
Heavy chain
Light chain
�53
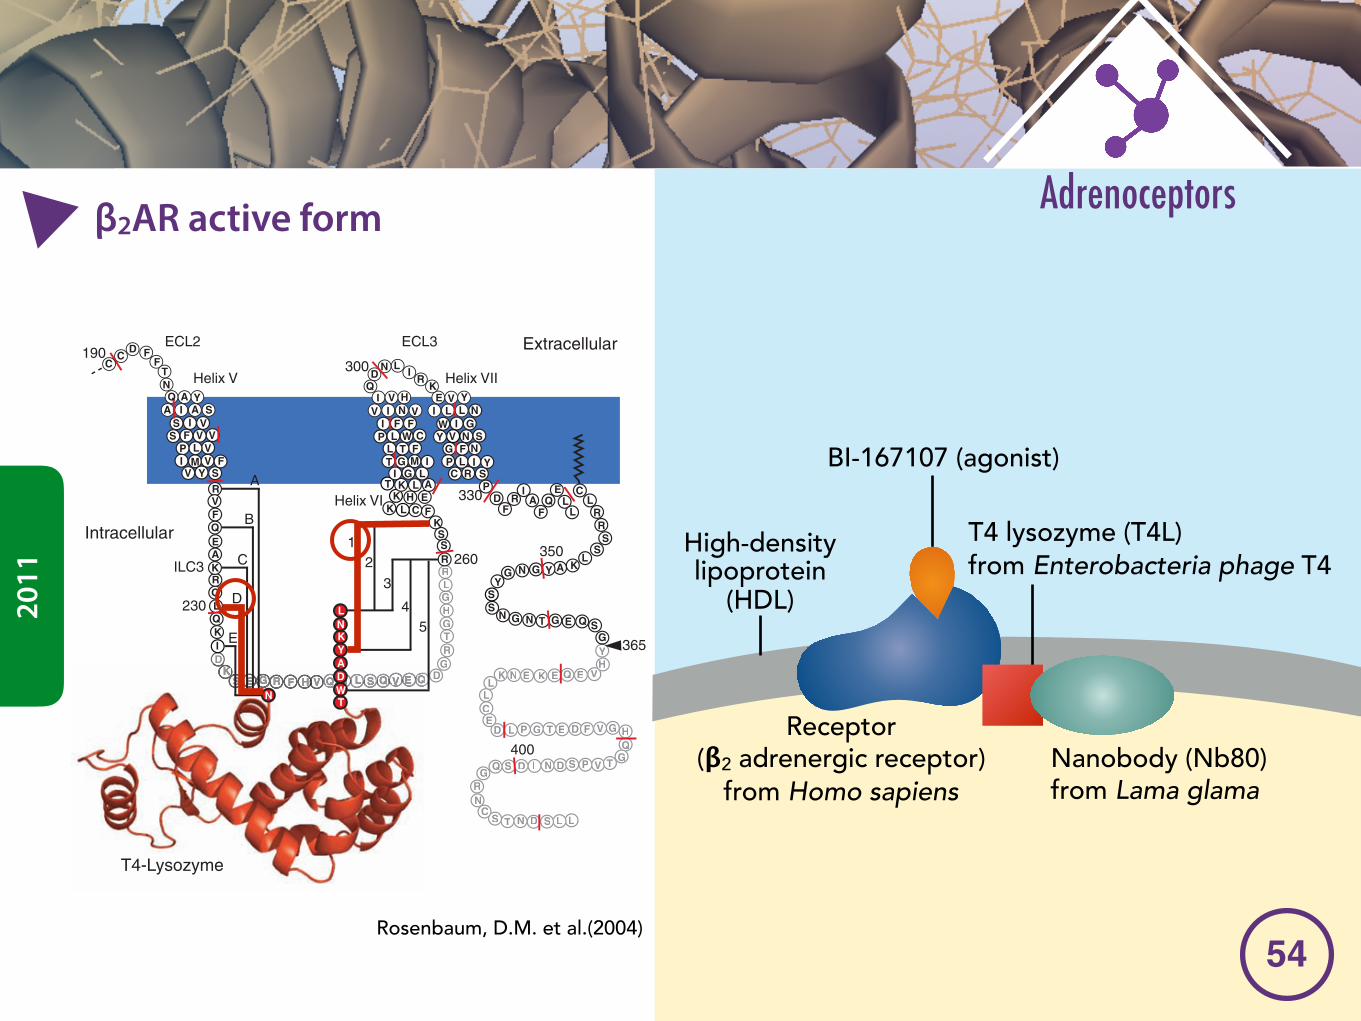
�54
Adrenoceptorsβ2AR active form
2011
BI-167107 (agonist)
Receptor (β2 adrenergic receptor)
from Homo sapiens
T4 lysozyme (T4L) from Enterobacteria phage T4
Nanobody (Nb80) from Lama glama
High-density lipoprotein
(HDL)
�54
Adrenoceptors
solubilized b2AR365 (WT receptor truncatedat 365) and b2AR-T4L were each labeled withmonobromobimane, which has been used pre-viously to monitor conformational changes of theb2AR (21). The addition of the agonist isopro-terenol to purified b2AR365 induces a decreasein fluorescence intensity and a shift in the wave-length at maximum intensity (lmax) for the at-tached bimane probe (Fig. 2B and table S2).These changes in intensity and lmax are con-sistent with an agonist-induced increase in polar-ity around bimane. A smaller change is observedwith the partial agonist salbutamol, whereas theinverse agonist ICI-118,551 had little effect. Forthe b2AR-T4L, there are subtle differences in thebaseline spectrum of the bimane-labeled fusionprotein, as might be expected if the environmentaround Cys2656.27 is altered by T4L. However,the full agonist isoproterenol induces a qualita-tively similar decrease in intensity and rightwardshift in lmax. Thus, the presence of the fusedT4L does not prevent agonist-induced confor-mational changes. The partial agonist salbuta-mol induced larger responses in b2AR-T4L thanwere observed in WT b2AR, and there was asmall increase in fluorescence in response to theinverse agonist ICI-118,551. These properties areobserved in CAMs (15, 22) and are consistentwith the higher affinities for agonists and partial
agonists exhibited by b2AR-T4L. Therefore, weconclude that the T4L fusion induces a partialconstitutively active phenotype in the b2AR, prob-ably caused by changes at the cytoplasmic endsof helices V and VI.
Comparison between b2AR-T4L and b2AR-Fab structures. The b2AR-T4L fusion strategyis validated by a comparison of its structure tothat of WT b2AR complexed with a Fab thatrecognizes a three-dimensional epitope consistingof the N- and C-terminal ends of ICL3, deter-mined at an anisotropic resolution of 3.4 Å/3.7 Å(23). Figure 3A illustrates the similarity betweenthe fusion and antibody complex approaches tob2AR crystallization, in that both strategies relyon attachment (covalent or noncovalent, respec-tively) of a soluble protein partner between helicesV and VI. A major difference between the twostructures is that the extracellular loops and thecarazolol ligand could not be modeled in theb2AR-Fab complex, whereas these regions areresolved in the structure of b2AR-T4L. None-theless, it is clear that the T4L insertion does notsubstantially alter the receptor. Superposition ofthe two structures (fig. S4) illustrates that the trans-membrane helices of the receptor componentsare very similar (root mean square deviation =0.8 Å for 154 common modeled transmembraneCa positions versus 2.3 Å between b2AR-T4L
and the 154 equivalent residues in rhodopsin),especially when the modest resolution of theFab complex is taken into account.
There is one major difference between theFab-complex and chimeric-receptor structuresthat can be attributed to the presence of T4L.The cytoplasmic end of helix VI is pulled out-ward as a result of the fusion to the C terminusof T4L, which alters the packing of Phe2646.26
at the end of helix VI (Fig. 3B). In the Fab-complex b2AR, interactions between Phe2646.26
and residues in helix V, helix VI, and ICL2 maybe important in maintaining the b2AR in the basalstate. The loss of these packing interactions inb2AR-T4L could contribute to the higher agonistbinding affinity characteristic of a CAM.
An unexpected difference between the struc-ture of rhodopsin and the b2AR-T4L involvesthe sequence E/DRY (24) found at the cytoplasmicend of helix III in 71% of class A GPCRs. Inrhodopsin, Glu1343.49 and Arg1353.50 form anetwork of hydrogen bond and ionic interac-tions with Glu2476.30 at the cytoplasmic end ofhelix VI. These interactions have been referredto as an “ionic lock” that stabilizes the inactivestate of rhodopsin and other class A members(25). However, the arrangement of the homolo-gous residues is considerably different in b2AR-T4L: Arg1313.50 interacts primarily with Asp1303.49
CD F
FTNQ YA
A I A SS I V
S F V VP L VI M V F
D
Q
Y SVRVFQEAKRQLQKI
YG N
GNSS
EGTN
GSQ
VHY
EQQEKKENKKL
LCE
D L P G T E FD V G HQQ
GGTS P VD I N D
RGG
QQ S
TS
N
LLSDDNC
365
190
230
400
Extracellular
Helix V
Intracellular
I HVV I N V
I F FP L W C
L T FT G M I
G L
E YVI L L NW I GY V N S
G F NL I YR S
QD
N L IR
K
I CT K L A
K H EK L C F
KS
PD
RL
TGHGG
DGR
FR
IA
FQ
EL
L
CL
RRS
SR
SL
G Y A K
P
260
300
330
350
Helix VI
Helix VII
ECL3
ILC3
N
ADWT
LNKY
A
B
C
D
E
12
3
45
T4-Lysozyme
C
ECL2BA
Positive Control:
FLAG-β1AR
D3
C3
D5
D1
NegativeControl:pCDNA3
β2AR-T4L
M1 M1+DAPI
Fig. 1. Design and optimization of the b2AR-T4L fusion protein. (A) Thesequence of the region of the b2AR targeted for insertion of a crystallizabledomain is shown, and the positions of the junctions between the receptorand T4L (red) for various constructs are indicated. The sequences that wereinitially replaced or removed are faded. Red lines are shown after every tenthresidue. ECL, extracellular loop. (B) Immunofluorescence images of HEK293
cells expressing selected fusion constructs. (Left) M1 anti-FLAG signal corre-sponding to antibody bound to the N terminus of the receptor. (Right) Samesignal merged with blue emission from 4´,6´-diamidino-2-phenylindole(nuclear staining for all cells). Plasma membrane staining is observed inthe positive control, D3, and D1, whereas C3 and D5 are retained in theendoplasmic reticulum.
23 NOVEMBER 2007 VOL 318 SCIENCE www.sciencemag.org1268
RESEARCH ARTICLES
Rosenbaum, D.M. et al.(2004)
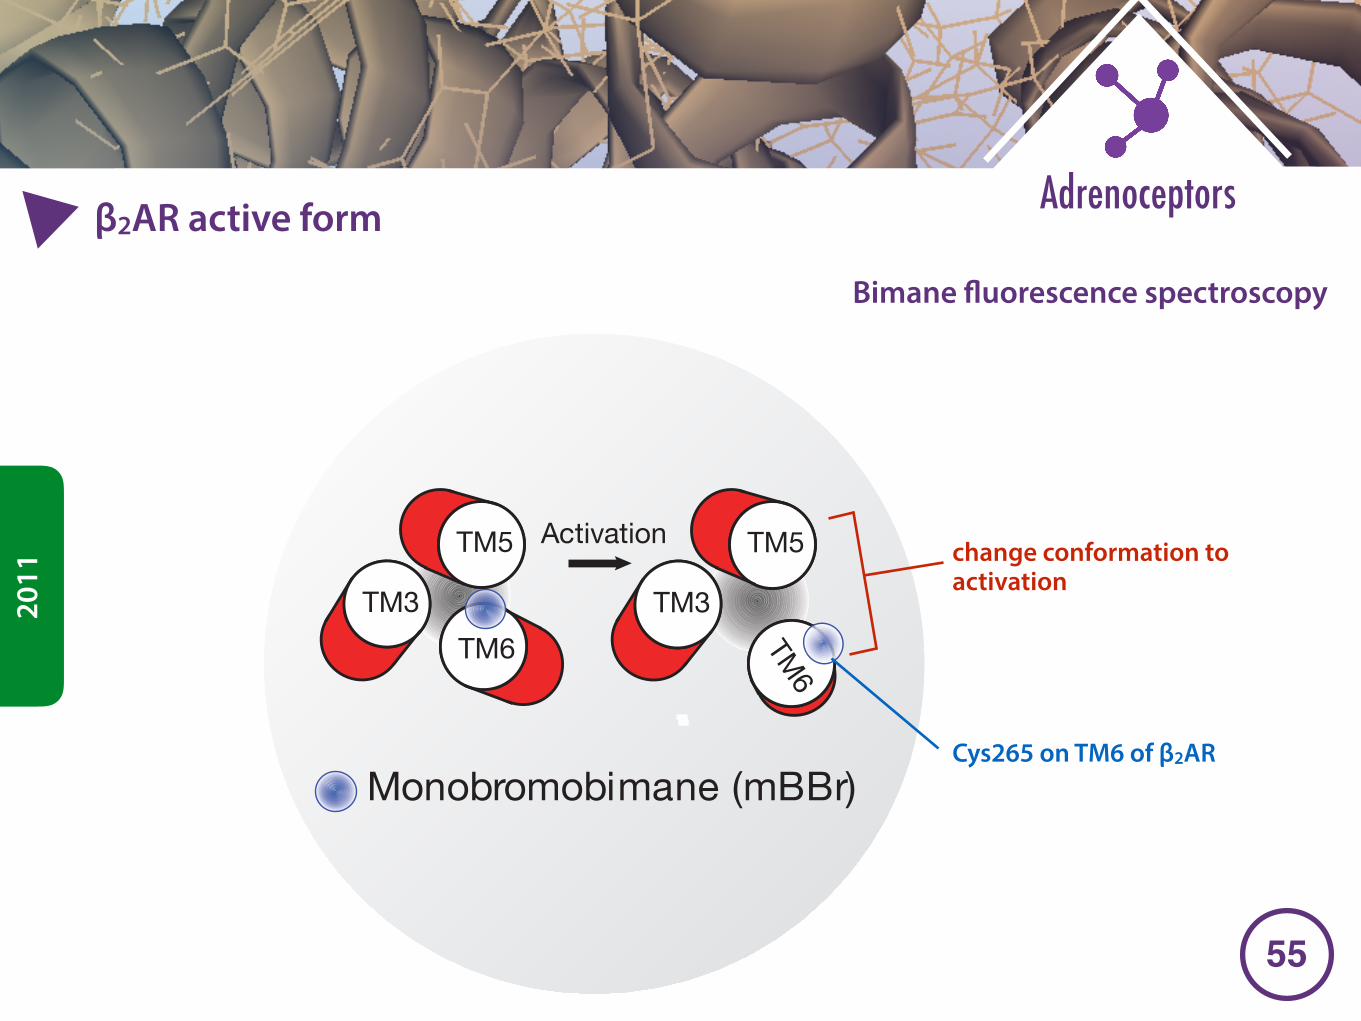
�55
Adrenoceptorsβ2AR active form
2011
Bimane fluorescence spectroscopy
that exhibits G protein-like behaviour towards the b2AR. Tylopoda(camels, dromedaries and llamas) have developed a unique class offunctional antibody molecules that are devoid of light chains16. A nano-body (Nb) is the recombinant minimal-sized intact antigen-bindingdomain of such a camelid heavy chain antibody and is approximately25% the size of a conventional Fab fragment. To generate receptor-specific nanobodies, a llama was immunized with purified agonist-bound b2AR reconstituted at high density into phospholipid vesicles.A library of single-chain nanobody clones was generated and screenedagainst agonist bound receptor. We identified seven clones that recog-nized agonist-bound b2AR. Of these, Nb80 was chosen because itshowed G-protein-like properties upon binding to both wild-typeb2AR and b2AR–T4L, the b2AR–T4 lysozyme fusion protein used toobtain the high-resolution inactive state crystal structure7,9.
We compared the effect of Nb80 with Gs on b2AR structure andagonist binding affinity. b2AR was labelled at the cytoplasmic end oftransmembrane helix 6 (TM6) at Cys 265 with the fluorophore mono-bromobimane and reconstituted into high-density lipoprotein (HDL)particles. TM6 moves relative to TM3 and TM5 upon agonist activa-tion (Fig. 1a), and we have shown previously that the environmentaround bimane covalently linked to Cys 265 changes with both ago-nist binding and G protein coupling, resulting in a decrease in fluor-escence intensity and a red shift in lmax
15. As shown in Fig. 1b, thecatecholamine agonist isoproterenol and Gs both stabilize an active-like conformation, but the effect of Gs is greater in the presence ofisoproterenol, consistent with the cooperative interactions of agonistand Gs on b2AR structure. Nb80 alone has an effect on bimane fluor-escence and lmax of unliganded b2AR that is similar to that of Gs(Fig. 1c). This effect was not observed in b2AR bound to the inverseagonist ICI-118,551. The effect of Nb80 was increased in the presenceof 10 mM isoproterenol. These results show that Nb80 does not recog-nize the inactive conformation of the b2AR, but binds efficiently to
agonist-occupied b2AR and produces a change in bimane fluor-escence that is indistinguishable from that observed in the presenceof Gs and isoproterenol.
Figure 1d and e shows the effect of Gs and Nb80 on agonist affinityfor b2AR. b2AR was reconstituted into HDL particles and agonistcompetition binding experiments were performed in the absence orpresence of Nb80 and Gs. In the absence of either protein, isoproterenolhas an inhibition constant (Ki) of 107 nM. In the presence of Gs twoaffinity states are observed, because not all of the b2AR is coupled to Gs.In the Gs-coupled state the affinity of isoproterenol increases by 100-fold (Ki 5 1.07 nM) (Fig. 1d and Supplementary Table 1). Similarly, inthe presence of Nb80 the affinity of isoproterenol increases by 95-fold(Ki 5 1.13 nM) (Fig. 1e and Supplementary Table 1). In contrast, Nb80had little effect on b2AR binding to the inverse agonist ICI-118,551(Supplementary Fig. 1 and Supplementary Table 1). These binding dataindicate that Nb80 stabilizes a conformation in wild-type b2AR that isvery similar to that stabilized by Gs, such that the energetic coupling ofagonist and Gs binding is faithfully mimicked by Nb80.
The high-resolution structure of the inactive state of the b2AR wasobtained with a b2AR–T4L fusion protein. We showed previously thatb2AR–T4L has a higher affinity for isoproterenol than wild-typeb2AR7.Nevertheless, in the presence of Nb80 the affinity increased by 60-fold,resulting in an affinity (Ki 5 0.56 nM) comparable to that of wild-typeb2AR bound to Nb80 (Fig. 1f and Supplementary Table 1). Althoughwe cannot study G protein coupling in b2AR–T4L due to steric hind-rance by T4L, the results show that T4L does not prevent binding ofNb80, and the nearly identical Ki values for agonist binding to wild-typeb2AR and b2AR–T4L in the presence of Nb80 indicate that Nb80stabilizes a similar conformation in these two proteins. The most likelyexplanation for the ability of Nb80 to bind to b2AR–T4L whereas Gsdoes not is the difference in size of these two proteins. Nb80 is approxi-mately 14 kDa whereas the Gs heterotrimer is approximately 90 kDa.
425 450 475 500
0.4
0.6
0.8
1.0
425 450 475 500
0.4
0.6
0.8
1.0
Wavelength (nm)
Fl
uore
scen
ce in
tens
ity
(nor
mal
ized
to u
nlig
ande
d)
Gs + ISO
ISO
Gs
Unliganded
Nb80 + ISO
Nb80
Nb80 + ICI
ICI
mBB-β2AR/HDL with Gs
mBB-β2AR/HDL with Nb80
–12–11–10 –9 –8 –7 –6 –5 –4
0
20
40
60
80
100
[3H
]-D
HA
bin
ding
–12–11–10 –9 –8 –7 –6 –5 –4–12–11–10–9 –8 –7 –6 –5 –4
β2AR/HDL β2AR–T4L/HDLβ2AR/HDL
+ Nb80 Control Control + Nb80 + Gs + GTPγS
+ Gs
0
20
40
60
80
100
0
20
40
60
80
100
Log ISO concentration (M) Log ISO concentration (M) Log ISO concentration (M)
b ca
d e f
Activation
TM6
TM5
TM3
TM5
TM3TM
6
Monobromobimane (mBBr)
Wavelength (nm)
Figure 1 | Effect of Nb80 on b2AR structure and function. a, The cartoonillustrates the movement of the environmentally-sensitive bimane probeattached to Cys 2656.27 in the cytoplasmic end of TM6 from a more buried,hydrophobic environment to a more polar, solvent-exposed position duringreceptor activation that results in a decrease in fluorescence in Fig. 1b–c andSupplementary Fig. 2c, d. b, c, Fluorescence emission spectra showing ligand-induced conformational changes of monobromobimane-labelled b2ARreconstituted into high density lipoprotein particles (mBB-b2AR/HDL) in theabsence (black solid line) or presence of full agonist isoproterenol (ISO, green
wide dashed line), inverse agonist ICI-118,551 (ICI, black dashed line), Gsheterotrimer (red solid line), nanobody-80 (Nb80, blue solid lines), andcombinations of Gs with ISO (red wide dashed line), Nb80 with ISO (blue widedashed line), and Nb80 with ICI (blue dashed line). d2f, Ligand binding curvesfor ISO competing against [3H]-dihydroalprenolol ([3H]-DHA) for d, b2AR/HDL reconstituted with Gs heterotrimer in the absence or presence GTPcS;e, b2AR/HDL in the absence and presence of Nb80; and f, b2AR–T4L/HDL inthe absence and presence of Nb80. Error bars represent standard errors.
RESEARCH ARTICLE
1 7 6 | N A T U R E | V O L 4 6 9 | 1 3 J A N U A R Y 2 0 1 1
Macmillan Publishers Limited. All rights reserved©2011
change conformation to activation
Cys265 on TM6 of β2AR
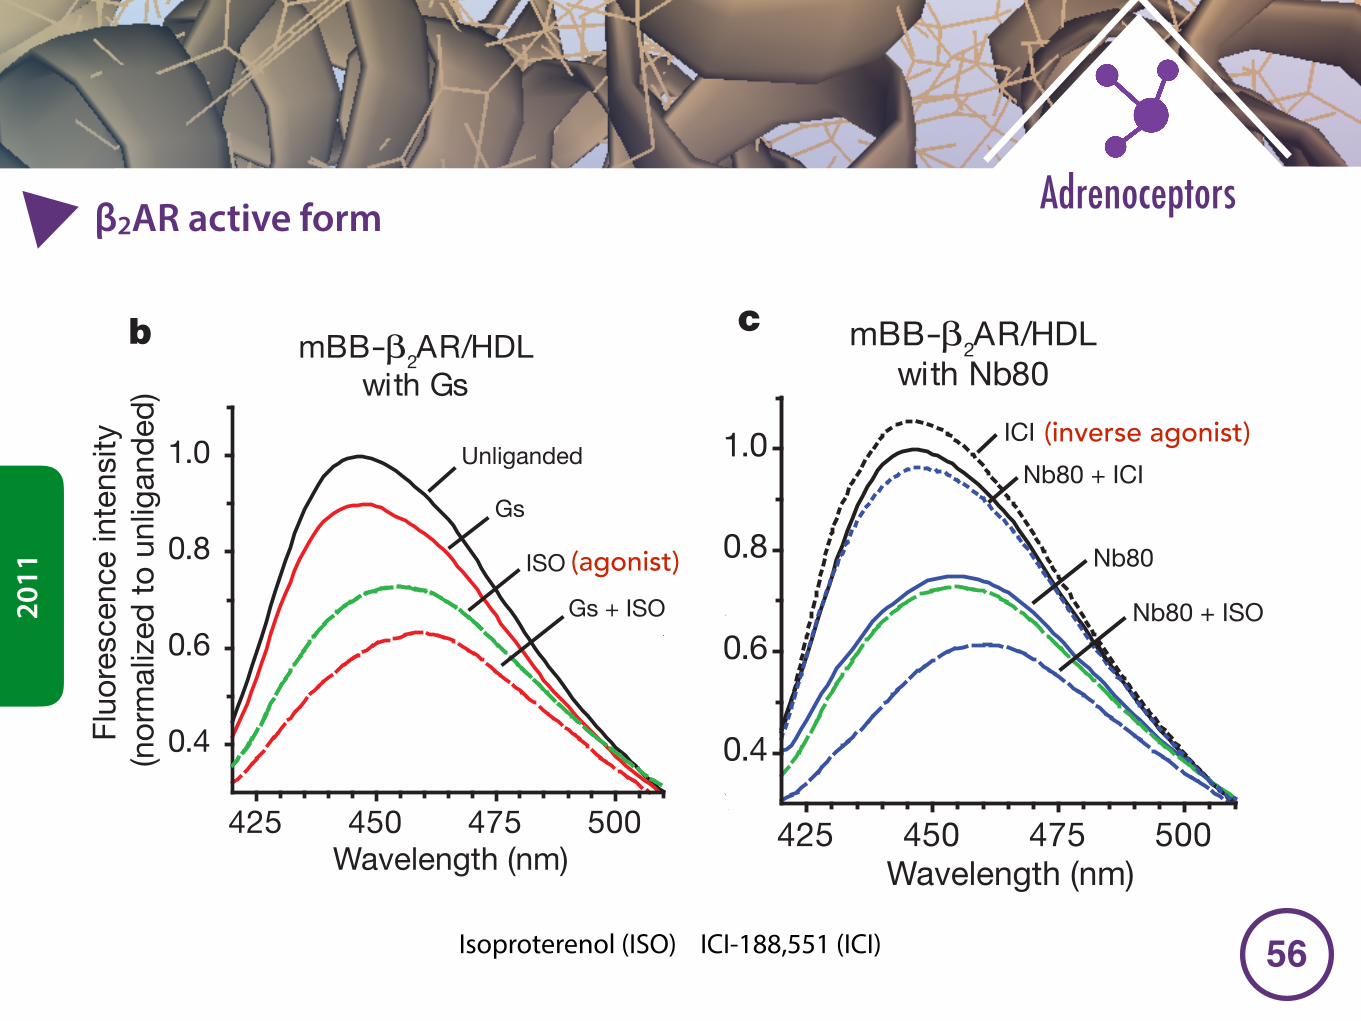
�56
Adrenoceptorsβ2AR active form
2011
that exhibits G protein-like behaviour towards the b2AR. Tylopoda(camels, dromedaries and llamas) have developed a unique class offunctional antibody molecules that are devoid of light chains16. A nano-body (Nb) is the recombinant minimal-sized intact antigen-bindingdomain of such a camelid heavy chain antibody and is approximately25% the size of a conventional Fab fragment. To generate receptor-specific nanobodies, a llama was immunized with purified agonist-bound b2AR reconstituted at high density into phospholipid vesicles.A library of single-chain nanobody clones was generated and screenedagainst agonist bound receptor. We identified seven clones that recog-nized agonist-bound b2AR. Of these, Nb80 was chosen because itshowed G-protein-like properties upon binding to both wild-typeb2AR and b2AR–T4L, the b2AR–T4 lysozyme fusion protein used toobtain the high-resolution inactive state crystal structure7,9.
We compared the effect of Nb80 with Gs on b2AR structure andagonist binding affinity. b2AR was labelled at the cytoplasmic end oftransmembrane helix 6 (TM6) at Cys 265 with the fluorophore mono-bromobimane and reconstituted into high-density lipoprotein (HDL)particles. TM6 moves relative to TM3 and TM5 upon agonist activa-tion (Fig. 1a), and we have shown previously that the environmentaround bimane covalently linked to Cys 265 changes with both ago-nist binding and G protein coupling, resulting in a decrease in fluor-escence intensity and a red shift in lmax
15. As shown in Fig. 1b, thecatecholamine agonist isoproterenol and Gs both stabilize an active-like conformation, but the effect of Gs is greater in the presence ofisoproterenol, consistent with the cooperative interactions of agonistand Gs on b2AR structure. Nb80 alone has an effect on bimane fluor-escence and lmax of unliganded b2AR that is similar to that of Gs(Fig. 1c). This effect was not observed in b2AR bound to the inverseagonist ICI-118,551. The effect of Nb80 was increased in the presenceof 10 mM isoproterenol. These results show that Nb80 does not recog-nize the inactive conformation of the b2AR, but binds efficiently to
agonist-occupied b2AR and produces a change in bimane fluor-escence that is indistinguishable from that observed in the presenceof Gs and isoproterenol.
Figure 1d and e shows the effect of Gs and Nb80 on agonist affinityfor b2AR. b2AR was reconstituted into HDL particles and agonistcompetition binding experiments were performed in the absence orpresence of Nb80 and Gs. In the absence of either protein, isoproterenolhas an inhibition constant (Ki) of 107 nM. In the presence of Gs twoaffinity states are observed, because not all of the b2AR is coupled to Gs.In the Gs-coupled state the affinity of isoproterenol increases by 100-fold (Ki 5 1.07 nM) (Fig. 1d and Supplementary Table 1). Similarly, inthe presence of Nb80 the affinity of isoproterenol increases by 95-fold(Ki 5 1.13 nM) (Fig. 1e and Supplementary Table 1). In contrast, Nb80had little effect on b2AR binding to the inverse agonist ICI-118,551(Supplementary Fig. 1 and Supplementary Table 1). These binding dataindicate that Nb80 stabilizes a conformation in wild-type b2AR that isvery similar to that stabilized by Gs, such that the energetic coupling ofagonist and Gs binding is faithfully mimicked by Nb80.
The high-resolution structure of the inactive state of the b2AR wasobtained with a b2AR–T4L fusion protein. We showed previously thatb2AR–T4L has a higher affinity for isoproterenol than wild-typeb2AR7.Nevertheless, in the presence of Nb80 the affinity increased by 60-fold,resulting in an affinity (Ki 5 0.56 nM) comparable to that of wild-typeb2AR bound to Nb80 (Fig. 1f and Supplementary Table 1). Althoughwe cannot study G protein coupling in b2AR–T4L due to steric hind-rance by T4L, the results show that T4L does not prevent binding ofNb80, and the nearly identical Ki values for agonist binding to wild-typeb2AR and b2AR–T4L in the presence of Nb80 indicate that Nb80stabilizes a similar conformation in these two proteins. The most likelyexplanation for the ability of Nb80 to bind to b2AR–T4L whereas Gsdoes not is the difference in size of these two proteins. Nb80 is approxi-mately 14 kDa whereas the Gs heterotrimer is approximately 90 kDa.
425 450 475 500
0.4
0.6
0.8
1.0
425 450 475 500
0.4
0.6
0.8
1.0
Wavelength (nm)
Fl
uore
scen
ce in
tens
ity
(nor
mal
ized
to u
nlig
ande
d)
Gs + ISO
ISO
Gs
Unliganded
Nb80 + ISO
Nb80
Nb80 + ICI
ICI
mBB-β2AR/HDL with Gs
mBB-β2AR/HDL with Nb80
–12–11–10 –9 –8 –7 –6 –5 –4
0
20
40
60
80
100
[3H
]-D
HA
bin
ding
–12–11–10 –9 –8 –7 –6 –5 –4–12–11–10–9 –8 –7 –6 –5 –4
β2AR/HDL β2AR–T4L/HDLβ2AR/HDL
+ Nb80 Control Control + Nb80 + Gs + GTPγS
+ Gs
0
20
40
60
80
100
0
20
40
60
80
100
Log ISO concentration (M) Log ISO concentration (M) Log ISO concentration (M)
b ca
d e f
Activation
TM6
TM5
TM3
TM5
TM3
TM6
Monobromobimane (mBBr)
Wavelength (nm)
Figure 1 | Effect of Nb80 on b2AR structure and function. a, The cartoonillustrates the movement of the environmentally-sensitive bimane probeattached to Cys 2656.27 in the cytoplasmic end of TM6 from a more buried,hydrophobic environment to a more polar, solvent-exposed position duringreceptor activation that results in a decrease in fluorescence in Fig. 1b–c andSupplementary Fig. 2c, d. b, c, Fluorescence emission spectra showing ligand-induced conformational changes of monobromobimane-labelled b2ARreconstituted into high density lipoprotein particles (mBB-b2AR/HDL) in theabsence (black solid line) or presence of full agonist isoproterenol (ISO, green
wide dashed line), inverse agonist ICI-118,551 (ICI, black dashed line), Gsheterotrimer (red solid line), nanobody-80 (Nb80, blue solid lines), andcombinations of Gs with ISO (red wide dashed line), Nb80 with ISO (blue widedashed line), and Nb80 with ICI (blue dashed line). d2f, Ligand binding curvesfor ISO competing against [3H]-dihydroalprenolol ([3H]-DHA) for d, b2AR/HDL reconstituted with Gs heterotrimer in the absence or presence GTPcS;e, b2AR/HDL in the absence and presence of Nb80; and f, b2AR–T4L/HDL inthe absence and presence of Nb80. Error bars represent standard errors.
RESEARCH ARTICLE
1 7 6 | N A T U R E | V O L 4 6 9 | 1 3 J A N U A R Y 2 0 1 1
Macmillan Publishers Limited. All rights reserved©2011
Isoproterenol (ISO) ICI-188,551 (ICI)
(agonist)
that exhibits G protein-like behaviour towards the b2AR. Tylopoda(camels, dromedaries and llamas) have developed a unique class offunctional antibody molecules that are devoid of light chains16. A nano-body (Nb) is the recombinant minimal-sized intact antigen-bindingdomain of such a camelid heavy chain antibody and is approximately25% the size of a conventional Fab fragment. To generate receptor-specific nanobodies, a llama was immunized with purified agonist-bound b2AR reconstituted at high density into phospholipid vesicles.A library of single-chain nanobody clones was generated and screenedagainst agonist bound receptor. We identified seven clones that recog-nized agonist-bound b2AR. Of these, Nb80 was chosen because itshowed G-protein-like properties upon binding to both wild-typeb2AR and b2AR–T4L, the b2AR–T4 lysozyme fusion protein used toobtain the high-resolution inactive state crystal structure7,9.
We compared the effect of Nb80 with Gs on b2AR structure andagonist binding affinity. b2AR was labelled at the cytoplasmic end oftransmembrane helix 6 (TM6) at Cys 265 with the fluorophore mono-bromobimane and reconstituted into high-density lipoprotein (HDL)particles. TM6 moves relative to TM3 and TM5 upon agonist activa-tion (Fig. 1a), and we have shown previously that the environmentaround bimane covalently linked to Cys 265 changes with both ago-nist binding and G protein coupling, resulting in a decrease in fluor-escence intensity and a red shift in lmax
15. As shown in Fig. 1b, thecatecholamine agonist isoproterenol and Gs both stabilize an active-like conformation, but the effect of Gs is greater in the presence ofisoproterenol, consistent with the cooperative interactions of agonistand Gs on b2AR structure. Nb80 alone has an effect on bimane fluor-escence and lmax of unliganded b2AR that is similar to that of Gs(Fig. 1c). This effect was not observed in b2AR bound to the inverseagonist ICI-118,551. The effect of Nb80 was increased in the presenceof 10 mM isoproterenol. These results show that Nb80 does not recog-nize the inactive conformation of the b2AR, but binds efficiently to
agonist-occupied b2AR and produces a change in bimane fluor-escence that is indistinguishable from that observed in the presenceof Gs and isoproterenol.
Figure 1d and e shows the effect of Gs and Nb80 on agonist affinityfor b2AR. b2AR was reconstituted into HDL particles and agonistcompetition binding experiments were performed in the absence orpresence of Nb80 and Gs. In the absence of either protein, isoproterenolhas an inhibition constant (Ki) of 107 nM. In the presence of Gs twoaffinity states are observed, because not all of the b2AR is coupled to Gs.In the Gs-coupled state the affinity of isoproterenol increases by 100-fold (Ki 5 1.07 nM) (Fig. 1d and Supplementary Table 1). Similarly, inthe presence of Nb80 the affinity of isoproterenol increases by 95-fold(Ki 5 1.13 nM) (Fig. 1e and Supplementary Table 1). In contrast, Nb80had little effect on b2AR binding to the inverse agonist ICI-118,551(Supplementary Fig. 1 and Supplementary Table 1). These binding dataindicate that Nb80 stabilizes a conformation in wild-type b2AR that isvery similar to that stabilized by Gs, such that the energetic coupling ofagonist and Gs binding is faithfully mimicked by Nb80.
The high-resolution structure of the inactive state of the b2AR wasobtained with a b2AR–T4L fusion protein. We showed previously thatb2AR–T4L has a higher affinity for isoproterenol than wild-typeb2AR7.Nevertheless, in the presence of Nb80 the affinity increased by 60-fold,resulting in an affinity (Ki 5 0.56 nM) comparable to that of wild-typeb2AR bound to Nb80 (Fig. 1f and Supplementary Table 1). Althoughwe cannot study G protein coupling in b2AR–T4L due to steric hind-rance by T4L, the results show that T4L does not prevent binding ofNb80, and the nearly identical Ki values for agonist binding to wild-typeb2AR and b2AR–T4L in the presence of Nb80 indicate that Nb80stabilizes a similar conformation in these two proteins. The most likelyexplanation for the ability of Nb80 to bind to b2AR–T4L whereas Gsdoes not is the difference in size of these two proteins. Nb80 is approxi-mately 14 kDa whereas the Gs heterotrimer is approximately 90 kDa.
425 450 475 500
0.4
0.6
0.8
1.0
425 450 475 500
0.4
0.6
0.8
1.0
Wavelength (nm)
Fl
uore
scen
ce in
tens
ity
(nor
mal
ized
to u
nlig
ande
d)
Gs + ISO
ISO
Gs
Unliganded
Nb80 + ISO
Nb80
Nb80 + ICI
ICI
mBB-β2AR/HDL with Gs
mBB-β2AR/HDL with Nb80
–12–11–10 –9 –8 –7 –6 –5 –4
0
20
40
60
80
100
[3H
]-D
HA
bin
ding
–12–11–10 –9 –8 –7 –6 –5 –4–12–11–10–9 –8 –7 –6 –5 –4
β2AR/HDL β2AR–T4L/HDLβ2AR/HDL
+ Nb80 Control Control + Nb80 + Gs + GTPγS
+ Gs
0
20
40
60
80
100
0
20
40
60
80
100
Log ISO concentration (M) Log ISO concentration (M) Log ISO concentration (M)
b ca
d e f
Activation
TM6
TM5
TM3
TM5
TM3
TM6
Monobromobimane (mBBr)
Wavelength (nm)
Figure 1 | Effect of Nb80 on b2AR structure and function. a, The cartoonillustrates the movement of the environmentally-sensitive bimane probeattached to Cys 2656.27 in the cytoplasmic end of TM6 from a more buried,hydrophobic environment to a more polar, solvent-exposed position duringreceptor activation that results in a decrease in fluorescence in Fig. 1b–c andSupplementary Fig. 2c, d. b, c, Fluorescence emission spectra showing ligand-induced conformational changes of monobromobimane-labelled b2ARreconstituted into high density lipoprotein particles (mBB-b2AR/HDL) in theabsence (black solid line) or presence of full agonist isoproterenol (ISO, green
wide dashed line), inverse agonist ICI-118,551 (ICI, black dashed line), Gsheterotrimer (red solid line), nanobody-80 (Nb80, blue solid lines), andcombinations of Gs with ISO (red wide dashed line), Nb80 with ISO (blue widedashed line), and Nb80 with ICI (blue dashed line). d2f, Ligand binding curvesfor ISO competing against [3H]-dihydroalprenolol ([3H]-DHA) for d, b2AR/HDL reconstituted with Gs heterotrimer in the absence or presence GTPcS;e, b2AR/HDL in the absence and presence of Nb80; and f, b2AR–T4L/HDL inthe absence and presence of Nb80. Error bars represent standard errors.
RESEARCH ARTICLE
1 7 6 | N A T U R E | V O L 4 6 9 | 1 3 J A N U A R Y 2 0 1 1
Macmillan Publishers Limited. All rights reserved©2011
(inverse agonist)
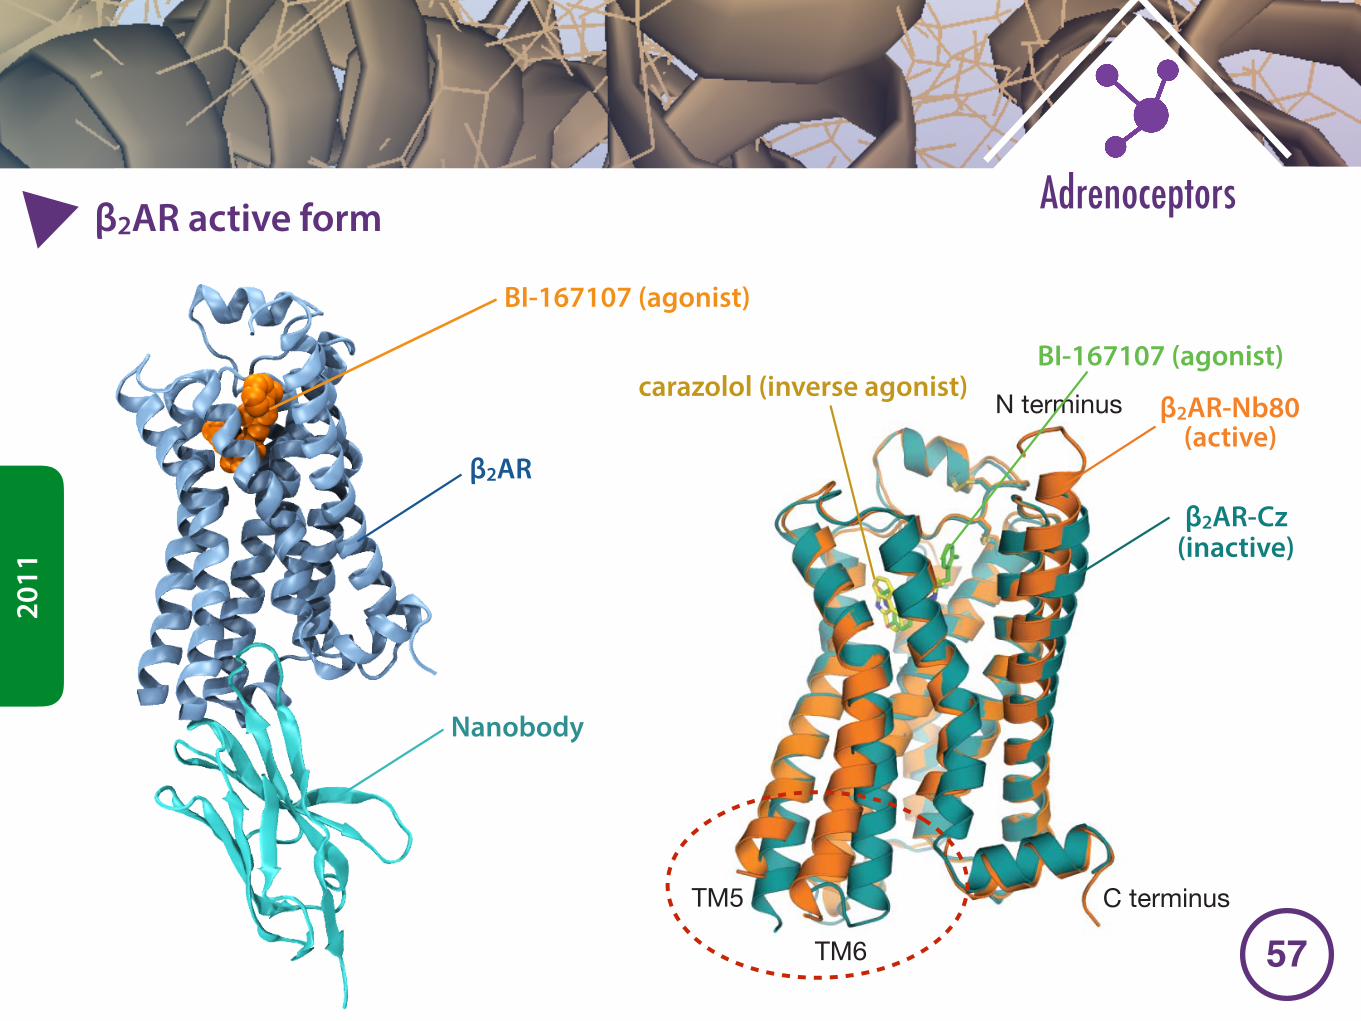
�57
Adrenoceptorsβ2AR active form
BI-167107 (agonist)
β2AR
Nanobody
2011
High affinity b2AR agonistTo stabilize further the active state of the b2AR, we screened over 50commercial and proprietary b2AR ligands. Of these, BI-167107(Boehringer Ingelheim) had the most favourable efficacy, affinity andoff-rate profile. BI-167107 is a full agonist that binds to the b2AR with adissociation constant Kd of 84 pM (Supplementary Fig. 2a and b). Asshown in Supplementary Fig. 2c and d, BI-167107 induces a largerchange in the fluorescence intensity and lmax of bimane bound toCys 265 than does the agonist isoproterenol. Moreover, the rate ofdissociation of BI-167107 was extremely slow. Displacement of BI-167107 with an excess of the neutral antagonist alprenolol required150 h to complete, compared with 5 s for isoproterenol.
Crystallization of b2AR–T4L–Nb80 complexThe b2AR was originally crystallized bound to the inverse agonistcarazolol using two different approaches. The first crystals wereobtained from b2AR bound to a Fab fragment that recognized anepitope composed of the amino and carboxyl terminal ends of thethird intracellular loop connecting TMs 5 and 6 (ref. 8). In the secondapproach, the third intracellular loop was replaced by T4 lysozyme(b2AR–T4L)7. Efforts to crystallize b2AR–Fab complex and b2AR–T4L bound to BI-167107 and other agonists failed to produce crystalsof sufficient quality for structure determination. We thereforeattempted to crystallize BI-167107 bound to b2AR and b2AR–T4L
in complex with Nb80. Although crystals of both complexes wereobtained in lipid bicelles and lipidic cubic phase (LCP), high-resolutiondiffraction was only obtained from crystals ofb2AR–T4L–Nb80 grownin LCP. These crystals grew at pH 8.0 in 39–44% PEG400, 100 mMTris, 4% DMSO and 1% 1,2,3-heptanetriol.
A merged data set at 3.5 A was obtained from 23 crystals(Supplementary Table 2). The structure was solved by molecularreplacement using the structure of the carazolol-bound b2AR and ananobody as search models. Supplementary Fig. 3a shows the packingof the b2AR–T4L–Nb80 complex in the crystal lattice. The receptorhas interactions with lattice neighbours in several directions, and isrelatively well ordered (Supplementary Fig. 3a and b), with readilyinterpretable electron density for most of the polypeptide. Nb80 bindsto the cytoplasmic end of the b2AR, with the third complementarity-determining region (CDR) loop projecting into the core of the recep-tor (Fig. 2a, and Supplementary Fig. 4).
Agonist-stabilized changes in the b2ARFigure 2 b–d compares the inactive b2AR structure (from the carazo-lol bound b2AR–T4L structure) with the agonist-bound b2AR com-ponent of the b2AR–T4L–Nb80 complex. The largest differences arefound at the cytoplasmic face of the receptor, with outward displace-ment of TM5 and TM6 and an inward movement of TM7 and TM3 inthe b2AR–T4L–Nb80 complex relative to the inactive structure. There
a
d
b c
TM5
TM6
C terminus
N terminus
TM7
90º
e
TM3 (DRY)
TM5
TM6 TM7 (NPxxY)
TM1TM2
TM4
11.4 Å
β2AR–Nb80 β2AR–Nb80
D/E3.49
R3.50
Y7.53Y5.58
E6.30
Y3.51
β2AR–Cz Opsin
N terminus
β2AR–Nb80β2AR–CzNb80
Figure 2 | Comparison of the agonist-Nb80 stabilized crystal structures ofthe b2AR with inverse agonist bound b2AR and opsin. The structure ofinverse agonist carazolol-bound b2AR–T4L (b2AR–Cz) is shown in blue withthe carazolol in yellow. The structure of BI-167107 agonist-bound and Nb80-stabilized b2AR–T4L (b2AR–Nb80) is shown in orange with BI-167107 ingreen. These two structures were aligned using the PyMOL align function.a, Side view of the b2AR–Nb80 complex with b2AR in orange and CDRs ofNb80 in light blue (CDR1) and blue (CDR3). b, Side view of the superimposedstructures showing significant structural changes in the intracellular and Gprotein facing part of the receptors. c, Comparison of the extracellular ligand
binding domains showing modest structural changes. d, Cytoplasmic viewshowing the ionic lock interaction between Asp 3.49 and Arg 3.50 of the DRYmotif in TM3 is broken in the b2AR–Nb80 structure. The intracellular end ofTM6 is moved outward and away from the core of the receptor. The arrowindicates an 11.4 A change in distance between the a-carbon of Glu 6.30 in thestructures of b2AR–Cz and b2AR–Nb80. The intracellular ends of TM3 andTM7 move towards the core by 4 and 2.5 A, respectively, while TM5 movesoutward by 6 A. e, The b2AR–Nb80 structure superimposed with the structureof opsin crystallized with the C-terminal peptide of Gt (transducin)2. PyMOL(http://www.pymol.org) was used for the preparation of all structure figures.
ARTICLE RESEARCH
1 3 J A N U A R Y 2 0 1 1 | V O L 4 6 9 | N A T U R E | 1 7 7
Macmillan Publishers Limited. All rights reserved©2011
BI-167107 (agonist)
β2AR-Nb80 (active)
carazolol (inverse agonist)
β2AR-Cz (inactive)
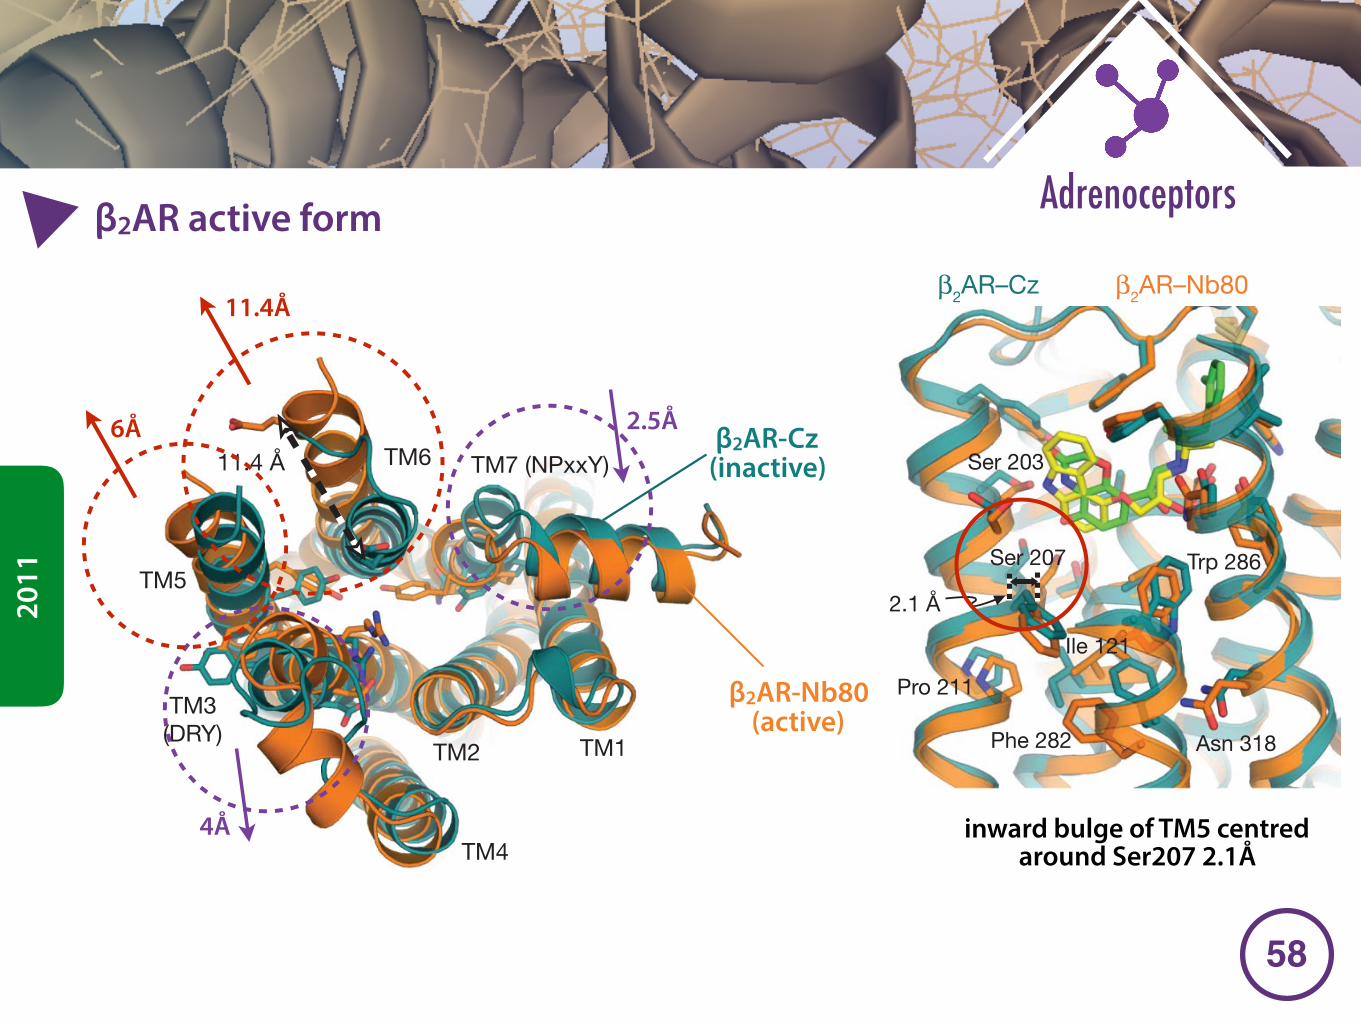
�58
Adrenoceptorsβ2AR active form
2011
High affinity b2AR agonistTo stabilize further the active state of the b2AR, we screened over 50commercial and proprietary b2AR ligands. Of these, BI-167107(Boehringer Ingelheim) had the most favourable efficacy, affinity andoff-rate profile. BI-167107 is a full agonist that binds to the b2AR with adissociation constant Kd of 84 pM (Supplementary Fig. 2a and b). Asshown in Supplementary Fig. 2c and d, BI-167107 induces a largerchange in the fluorescence intensity and lmax of bimane bound toCys 265 than does the agonist isoproterenol. Moreover, the rate ofdissociation of BI-167107 was extremely slow. Displacement of BI-167107 with an excess of the neutral antagonist alprenolol required150 h to complete, compared with 5 s for isoproterenol.
Crystallization of b2AR–T4L–Nb80 complexThe b2AR was originally crystallized bound to the inverse agonistcarazolol using two different approaches. The first crystals wereobtained from b2AR bound to a Fab fragment that recognized anepitope composed of the amino and carboxyl terminal ends of thethird intracellular loop connecting TMs 5 and 6 (ref. 8). In the secondapproach, the third intracellular loop was replaced by T4 lysozyme(b2AR–T4L)7. Efforts to crystallize b2AR–Fab complex and b2AR–T4L bound to BI-167107 and other agonists failed to produce crystalsof sufficient quality for structure determination. We thereforeattempted to crystallize BI-167107 bound to b2AR and b2AR–T4L
in complex with Nb80. Although crystals of both complexes wereobtained in lipid bicelles and lipidic cubic phase (LCP), high-resolutiondiffraction was only obtained from crystals ofb2AR–T4L–Nb80 grownin LCP. These crystals grew at pH 8.0 in 39–44% PEG400, 100 mMTris, 4% DMSO and 1% 1,2,3-heptanetriol.
A merged data set at 3.5 A was obtained from 23 crystals(Supplementary Table 2). The structure was solved by molecularreplacement using the structure of the carazolol-bound b2AR and ananobody as search models. Supplementary Fig. 3a shows the packingof the b2AR–T4L–Nb80 complex in the crystal lattice. The receptorhas interactions with lattice neighbours in several directions, and isrelatively well ordered (Supplementary Fig. 3a and b), with readilyinterpretable electron density for most of the polypeptide. Nb80 bindsto the cytoplasmic end of the b2AR, with the third complementarity-determining region (CDR) loop projecting into the core of the recep-tor (Fig. 2a, and Supplementary Fig. 4).
Agonist-stabilized changes in the b2ARFigure 2 b–d compares the inactive b2AR structure (from the carazo-lol bound b2AR–T4L structure) with the agonist-bound b2AR com-ponent of the b2AR–T4L–Nb80 complex. The largest differences arefound at the cytoplasmic face of the receptor, with outward displace-ment of TM5 and TM6 and an inward movement of TM7 and TM3 inthe b2AR–T4L–Nb80 complex relative to the inactive structure. There
a
d
b c
TM5
TM6
C terminus
N terminus
TM7
90º
e
TM3 (DRY)
TM5
TM6 TM7 (NPxxY)
TM1TM2
TM4
11.4 Å
β2AR–Nb80 β2AR–Nb80
D/E3.49
R3.50
Y7.53Y5.58
E6.30
Y3.51
β2AR–Cz Opsin
N terminus
β2AR–Nb80β2AR–CzNb80
Figure 2 | Comparison of the agonist-Nb80 stabilized crystal structures ofthe b2AR with inverse agonist bound b2AR and opsin. The structure ofinverse agonist carazolol-bound b2AR–T4L (b2AR–Cz) is shown in blue withthe carazolol in yellow. The structure of BI-167107 agonist-bound and Nb80-stabilized b2AR–T4L (b2AR–Nb80) is shown in orange with BI-167107 ingreen. These two structures were aligned using the PyMOL align function.a, Side view of the b2AR–Nb80 complex with b2AR in orange and CDRs ofNb80 in light blue (CDR1) and blue (CDR3). b, Side view of the superimposedstructures showing significant structural changes in the intracellular and Gprotein facing part of the receptors. c, Comparison of the extracellular ligand
binding domains showing modest structural changes. d, Cytoplasmic viewshowing the ionic lock interaction between Asp 3.49 and Arg 3.50 of the DRYmotif in TM3 is broken in the b2AR–Nb80 structure. The intracellular end ofTM6 is moved outward and away from the core of the receptor. The arrowindicates an 11.4 A change in distance between the a-carbon of Glu 6.30 in thestructures of b2AR–Cz and b2AR–Nb80. The intracellular ends of TM3 andTM7 move towards the core by 4 and 2.5 A, respectively, while TM5 movesoutward by 6 A. e, The b2AR–Nb80 structure superimposed with the structureof opsin crystallized with the C-terminal peptide of Gt (transducin)2. PyMOL(http://www.pymol.org) was used for the preparation of all structure figures.
ARTICLE RESEARCH
1 3 J A N U A R Y 2 0 1 1 | V O L 4 6 9 | N A T U R E | 1 7 7
Macmillan Publishers Limited. All rights reserved©2011
β2AR-Nb80 (active)
β2AR-Cz (inactive)
11.4Å
6Å 2.5Å
4Å
agonist has a longer alkyl substituent on the amine, which ends with aphenyl ring that lies in a hydrophobic pocket formed by Trp 1093.28,Phe 1935.32 and Ile 3097.36.
The greatest difference between inactive and active structures in theligand-binding site is an inward bulge of TM5 centred aroundSer 2075.46, whose Ca position shifts by 2.1 A (Fig. 4a). In addition,there are smaller inward movements of TM6 and TM7. The basalactivity shown by the b2AR indicates that the protein structure sur-rounding the binding pocket is relatively dynamic in the absence ofligand, such that it samples active and inactive conformations. Thepresence of Pro 2115.50 in the following turn, which cannot form ahydrogen bond with the backbone at Ser 2075.46, is likely to lower thebarrier to the transition between the conformations observed in thepresence of carazolol and BI-167107. There are extensive interactionsbetween the carbonyl oxygen, amine and hydroxyl groups on theheterocycle of BI-167107 and Ser 2035.42 and 2075.46 in TM5, as wellas Asn 2936.55 in TM6 and Tyr 3087.35 in TM7. In contrast, there isonly one polar interaction between the nitrogen in the heterocycle ofcarazolol and Ser 2035.42. Interactions of Ser 2035.42, Ser 2045.43 andSer 2075.46 with catecholamine hydroxyls have been proposed, on thebasis of mutagenesis studies showing that these serines are importantfor agonist binding and activation18,19. Whereas Ser 2045.43 does notinteract directly with the ligand, it forms a hydrogen bond withAsn 2936.55 on TM6, which is in turn linked to Tyr 3087.35 of extra-cellular loop 3 (ECL3) (Fig. 3a). This tyrosine packs againstPhe 1935.32 of ECL2, and both residues move to close off the ligand-binding site from the extracellular space.
Asn 2936.55 contributes to enantiomeric selectivity for catecholamineagonists20. The b-OH of BI-167107 does not interact with Asn 2936.55,but forms hydrogen bonds with Asp 1133.32 and Asn 3127.39, similar towhat is observed for carazolol in the inactive structure. The chirality oftheb-OH influences the spatial position of the aromatic ring system inb2AR ligands, so the effect of Asn 2936.55 on b-OH enantiomericselectivity may arise from its direct interaction with the aromatic ringsystem of the ligand, as well as its positioning of Ser 2045.43 andTyr 3087.35, which also interact with this portion of the ligand.However, BI-167107 is not a catecholamine, and it is possible thatthe b-OH of catecholamine agonists, such as adrenaline and noradre-naline, has a direct interaction with Asn 2936.55, because mutation ofAsn 2936.55 has a stronger influence on the preference for the chiralityof the b-OH of catecholamine agonists, compared with non-catecholagonists and antagonists20.
Trp 6.48 is highly conserved in Family A GPCRs, and it has beenproposed that its rotameric state has a role in GPCR activation (rotamer
toggle switch)21. We observe no change in the side chain rotamer ofTrp 2866.48 in TM6 (Fig. 4a), which lies near the base of the ligand-binding pocket, although its position shifts slightly in concert withrearrangements of nearby residues Ile 1213.40 and Phe 2826.44.Although there is spectroscopic evidence for changes in the environ-ment of Trp 6.48 upon activation of rhodopsin22, a rotamer change is notobserved in the crystal structures of rhodopsin and low-pH opsin.Moreover, recent mutagenesis experiments on the serotonin 5HT4receptor demonstrate that Trp 6.48 is not required for activation of thisreceptor by serotonin23. These observations indicate that, althoughchanges in hydrophobic packing alter the conformation of the receptorin this region, changes in the Trp 6.48 rotamer do not occur as part of theactivation mechanism.
It is interesting to speculate how the small changes around theagonist-binding pocket are coupled to much larger structural changesin the cytoplasmic regions of TMs 5, 6 and 7 that facilitate binding ofNb80 and Gs. A potential conformational link is shown in Fig. 4.Agonist interactions with Ser 2035.42 and 2075.46 stabilize a receptorconformation that includes a 2.1-A inward movement of TM5 at posi-tion 2075.46 and 1.4-A inward movement of the conserved Pro 2115.50
relative to the inactive, carazolol-bound structure. In the inactive state,the relative positions of TM5, TM3, TM6 and TM7 are stabilized byinteractions between Pro 2115.50, Ile 1213.40, Phe 2826.44 and Asn 3187.45.The position of Pro 2115.50 observed in the agonist structure is incom-patible with this network of interactions, and Ile 1213.40 and Phe 2826.44
are repositioned, with a rotation of TM6 around Phe 2826.44 leading toan outward movement of the cytoplasmic end of TM6.
Although some of the structural changes observed in the cytoplas-mic ends of transmembrane domains of the b2AR–T4L–Nb80 com-plex arise from specific interactions with Nb80, the fact that Nb80 andGs induce or stabilize similar structural changes in the b2AR, as deter-mined by fluorescence spectroscopy and by agonist binding affinity,suggests that Nb80 and Gs recognize similar agonist-stabilized con-formations. The observation that the transmembrane domains of rho-dopsin and the b2AR undergo similar structural changes uponactivation provides further support that the agonist-bound b2AR–T4L–Nb80 represents an active conformation and is consistent witha conserved mechanism of G protein activation.
However, the mechanism by which agonists induce or stabilizethese conformational changes likely differs for different ligands andfor different GPCRs. The conformational equilibria of rhodopsin andb2AR differ, as shown by the fact that rhodopsin appears to adopt afully active conformation in the absence of a G protein24 whereasb2AR cannot15. Thus, the energetics of activation and conformational
TM5TM5
TM7 TM7
TM6TM6
TM3 TM3
Pro 211
Pro 211
Asn 318 Asn 318
Phe 282Phe 282
Ile 121Ile 121
Carazolol BI-167107β2AR–Nb80
1
2
34
5
Pro 211
Asn 318Phe 282
Ile 121
Ser 207
Ser 203
2.1 Å
Trp 286
b ca
β2AR–Cz
Figure 4 | Rearrangement of transmembrane segment packing interactionsupon agonist binding a, The BI-167107- and carazolol-bound structures aresuperimposed to show structural differences propagating from the ligand-binding pocket. BI-167107 and carazolol are shown in green and yellow,respectively. b, Packing interactions that stabilize the inactive state are observed
between Pro 211 in TM5, Ile 121 in TM3, Phe 282 in TM6 and Asn 318 in TM7.c, The inward movement of TM5 upon agonist binding destabilizes the packingof Ile 121 and Pro 211, resulting in a rearrangement of interactions betweenIle 121 and Phe 282. These changes contribute to a rotation and outwardmovement of TM6 and an inward movement of TM7.
ARTICLE RESEARCH
1 3 J A N U A R Y 2 0 1 1 | V O L 4 6 9 | N A T U R E | 1 7 9
Macmillan Publishers Limited. All rights reserved©2011
inward bulge of TM5 centred around Ser207 2.1Å
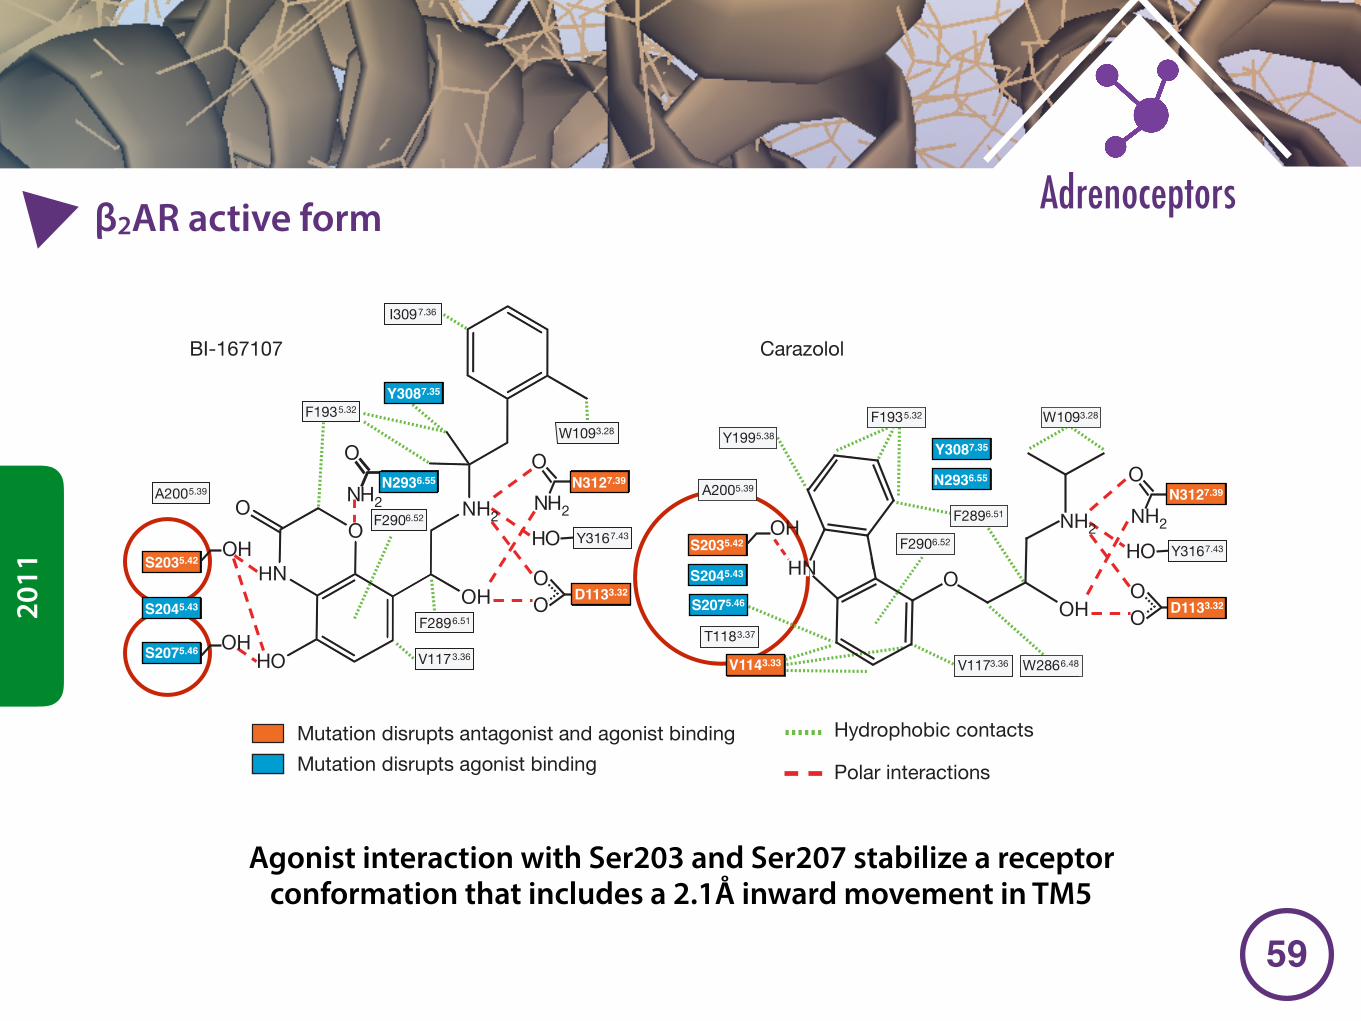
�59
Adrenoceptorsβ2AR active form
2011
Agonist interaction with Ser203 and Ser207 stabilize a receptor conformation that includes a 2.1Å inward movement in TM5
are relatively small changes in the extracellular surface (Fig. 2c). Thesecond intracellular loop (ICL2) between TM3 and TM4 adopts atwo-turn alpha helix (Fig. 2d), similar to that observed in the turkeyb1AR structure11. The absence of this helix in the inactive b2AR struc-ture may reflect crystal lattice contacts involving ICL2.
Figure 2a and Supplementary Fig. 4a–c show details of interactionof Nb80 with the cytoplasmic side of the b2AR. An eight-amino-acidsequence of CDR3 penetrates into a hydrophobic pocket formed byamino acids from TM segments 3, 5, 6 and 7. A four-amino-acidsequence of CDR1 provides additional stabilizing interactions withcytoplasmic ends of TM segments 5 and 6. CDR3 occupies a positionsimilar to the carboxyl terminal peptide of transducin in opsin2
(Supplementary Fig. 4c, d). The majority of interactions betweenNb80 and the b2AR are mediated by hydrophobic contacts.
When comparing the agonist- and inverse agonist-bound struc-tures, the largest change is observed in TM6, with an 11.4-A move-ment of the helix at Glu 2686.30 (part of the ionic lock) (superscripts inthis form indicate Ballesteros–Weinstein numbering for conservedGPCR residues17) (Fig. 2d). This large change is effected by a smallclockwise rotation of TM6 in the turn preceding the conservedPro 2886.50, enabled by the interrupted backbone hydrogen bondingat the proline and repacking of Phe 2826.44 (see below), which swingsthe helix outward.
The changes in agonist-bound b2AR–T4L–Nb80 relative to theinactive carazolol-bound b2AR–T4L are remarkably similar to those
observed between rhodopsin and opsin2,3 (Fig. 2e). The salt bridge inthe ionic lock between highly conserved Arg 1313.50 and Asp/Glu 1303.49 is broken. In opsin, Arg 1353.50 interacts with Tyr 2235.58
in TM5 and a backbone carbonyl of the transducin peptide.Arg 1313.50 of b2AR likewise interacts with a backbone carbonyl ofCDR3 of Nb80. However, Nb80 precludes an interaction betweenArg 1313.50 and Tyr 2195.58, even though the tyrosine occupies a similarposition in opsin and agonist-bound b2AR–T4L–Nb80. As in opsin,Tyr 3267.53 of the highly conserved NPxxY sequence moves into thespace occupied by TM6 in the inactive state. In carazolol-boundb2AR–T4L we observed a network of hydrogen bonding interactionsinvolving highly conserved amino acids in TMs 1, 2, 6 and 7 andseveral water molecules7. Although the resolution of the b2AR–T4L–Nb80 structure is inadequate to detect water molecules, it is clearthat the structural changes we observe would substantially alter thisnetwork.
In contrast to the relatively large changes observed in the cytoplas-mic domains of b2AR–T4L–Nb80, the changes in the agonist-bindingpocket are fairly subtle. Figure 3 shows a comparison of the bindingpockets of the inverse agonist- and agonist-bound structures. An omitmap of the ligand-binding pocket is provided in Supplementary Fig. 5.Many of the interactions between the agonist BI-167107 and theb2ARare similar to those observed with the inverse agonist carazolol. Thealkylamine and the b-OH of both ligands form polar interactions withAsp 1133.32 in TM3, and with Asn 3127.39 and Tyr 3167.43 in TM7. The
S203S207
S204Y308
N293
N312
D113
Y316
TM5
TM3
TM6
TM5
TM3
TM7
TM4
TM6 TM7
a b
β2AR–Czβ2AR–Nb80 CarazololBI-167107
F290
F193
V117
W109
V114
I309
S203S207
S204
Y308N293
N312
D113
Y316
TM4
F290
F193
V117
W109
I309
OH
NO
HN
HO
S204 5.43
S207 5.46
Y308 7.35
S203 5.42
N293 6.55
V117 3.36
F290 6.52
A200 5.39
OH
F193 5.32
F289 6.51
S204 5.43
S207 5.46
Y308 7.35
Hydrophobic contacts
Polar interactions
V114 3.33
T118 3.37
Mutation disrupts antagonist and agonist binding Mutation disrupts agonist binding
19
17
N293 6.55
V117 3.36 W286 6.48
F290 6.52
A200 5.39
Y199 5.38
F193 5.32 W109 3.28
F289 6.51
OH
BI-167107 Carazolol
OHN
I309 7.36
W109 3.28
O
c d
OH
O
H2N
O
H2N
OO
HO S203 5.42OH
O
NH2
OO
HO
D113 3.32
N312 7.39
Y316 7.43
D113 3.32
N312 7.39
Y316 7.43
H2 NH2
Figure 3 | Ligand binding pocket of BI-167107 and carazolol-bound b2ARstructures. a, b, Extracellular views of the agonist BI-167107-bound (a) andcarazolol-bound (b) structures, respectively. Residues within 4 A of one or bothligands are shown as sticks. In all panels, red and blue represent oxygen andnitrogen, respectively. c, d, Schematic representation of the interactionsbetween theb2AR and the ligands BI-167107 (c) and carazolol (d). The residues
shown here have at least one atom within 4 A of the ligand in the crystalstructures. Mutations of amino acids in orange boxes have been shown todisrupt both antagonist and agonist binding. Mutations of amino acids in blueboxes have been shown to disrupt agonist binding. Green lines indicatepotential hydrophobic interactions and orange lines indicate potential polarinteractions.
RESEARCH ARTICLE
1 7 8 | N A T U R E | V O L 4 6 9 | 1 3 J A N U A R Y 2 0 1 1
Macmillan Publishers Limited. All rights reserved©2011
Y3087.35
N2936.55
S2075.46
S2035.42
S2045.43
N3127.39
D1133.32
N3127.39
D1133.32
V1143.33
S2075.46
S2035.42
S2045.43
Y3087.35
N2936.55
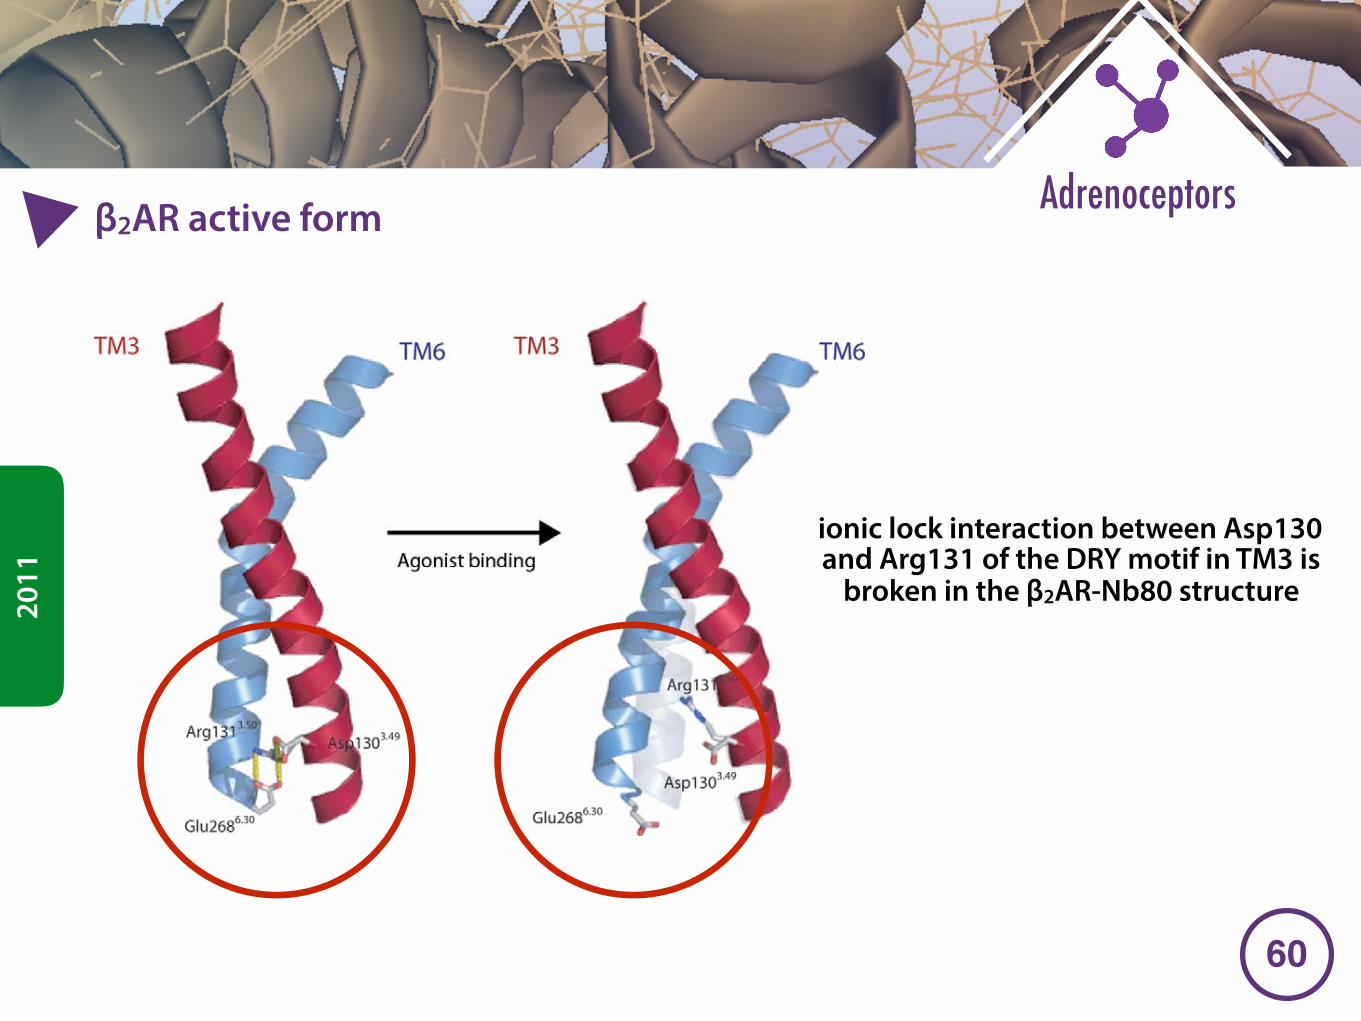
�60
Adrenoceptorsβ2AR active form
2011
also� proposed� that� interactions� between� the� aromatic� ring� of� catecholamineagonists� and Phe2906.52� in� TM6� play� a� role� in� the� stabilization of� the� activeform� of� this� switch.� While� this� mechanism� was� initially� defined� for� catechol-amine� receptors,� this� sequence� motif� is� highly� conserved� in� amine� and� opsinreceptors,� so� it� is� expected� that� this� step� in� the� activation� mechanism� will� beconserved� within� these� families.
2.� Ionic� Lock
Another� molecular� switch,� the� ionic� lock,� involves� the� interaction� betweenGlu6.�30�,� highly� conserved� in� amine� and� opsin� receptors� (>�93%),� and� theAsp3.�49�/Arg3.50� pair,� in� the� highly� conserved� (D/E)RY�motif� found� in� virtuallyall� Class� A� GPCRs� (Ballesteros� et� al.,� 2001a)� (Fig.� 7).� This� ionic� interaction� isproposed� to� hold� together� the� cytoplasmic� ends� of� TM3� and� TM6 in theresting� state� of� different� amine� receptors� (Ballesteros� et� al.,� 2�00�1a�;� Greasleyet al., 2002; Shapiro et al., 2002).� This� interaction� is� also� observed� in� the� crystalstructures of inactive rhodopsin (Li et al., 2004; Okada, 2004; Okada et al.,2002; Palczewski et al., 2000; Teller et al., 2001), and disruption of thisinteraction during activation is suggested by various biophysical (Farrenset� al., 1996;� G�et�he�r� et� al.,� 1997b),� biochemical� (Arnis� et� al.,� 1994;� Ghanouniet al., 2000; Sheikh et al., 1996, 1999), andmutagenesis (Alewijnse et al., 2000;
F�ig.� 7.� The� ionic� lock� stabilizes interactions� between� the� cytoplasmic� ends� of TM3and� TM6 in the inactive state. Agonist binding disrupts these interactions.
152 DEUPI AND KOBILKA
ionic lock interaction between Asp130 and Arg131 of the DRY motif in TM3 is
broken in the β2AR-Nb80 structure
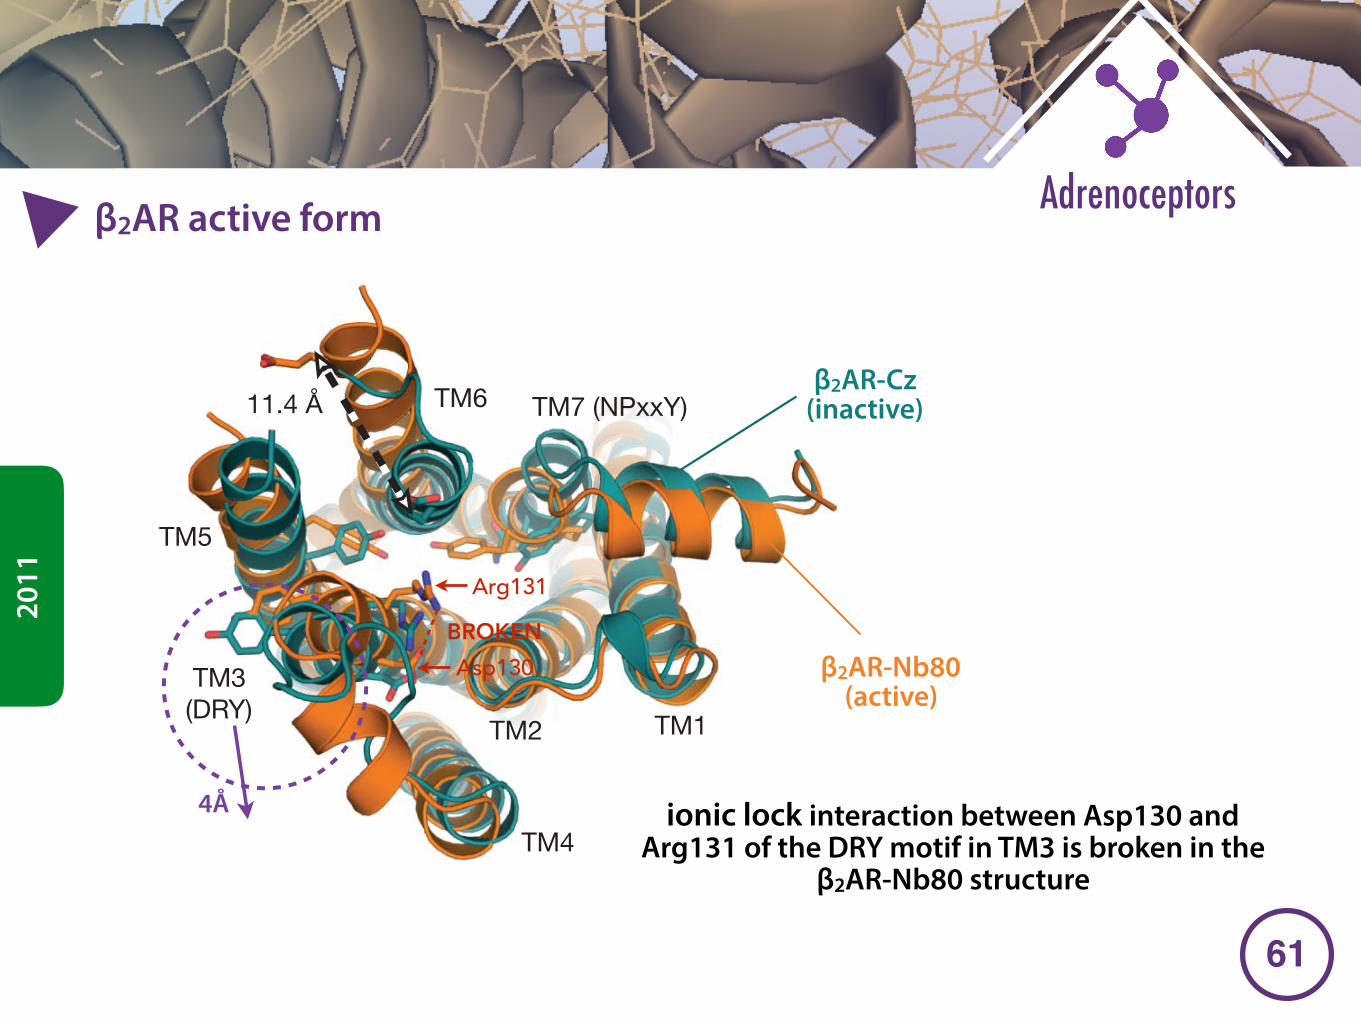
�61
Adrenoceptorsβ2AR active form
2011
High affinity b2AR agonistTo stabilize further the active state of the b2AR, we screened over 50commercial and proprietary b2AR ligands. Of these, BI-167107(Boehringer Ingelheim) had the most favourable efficacy, affinity andoff-rate profile. BI-167107 is a full agonist that binds to the b2AR with adissociation constant Kd of 84 pM (Supplementary Fig. 2a and b). Asshown in Supplementary Fig. 2c and d, BI-167107 induces a largerchange in the fluorescence intensity and lmax of bimane bound toCys 265 than does the agonist isoproterenol. Moreover, the rate ofdissociation of BI-167107 was extremely slow. Displacement of BI-167107 with an excess of the neutral antagonist alprenolol required150 h to complete, compared with 5 s for isoproterenol.
Crystallization of b2AR–T4L–Nb80 complexThe b2AR was originally crystallized bound to the inverse agonistcarazolol using two different approaches. The first crystals wereobtained from b2AR bound to a Fab fragment that recognized anepitope composed of the amino and carboxyl terminal ends of thethird intracellular loop connecting TMs 5 and 6 (ref. 8). In the secondapproach, the third intracellular loop was replaced by T4 lysozyme(b2AR–T4L)7. Efforts to crystallize b2AR–Fab complex and b2AR–T4L bound to BI-167107 and other agonists failed to produce crystalsof sufficient quality for structure determination. We thereforeattempted to crystallize BI-167107 bound to b2AR and b2AR–T4L
in complex with Nb80. Although crystals of both complexes wereobtained in lipid bicelles and lipidic cubic phase (LCP), high-resolutiondiffraction was only obtained from crystals ofb2AR–T4L–Nb80 grownin LCP. These crystals grew at pH 8.0 in 39–44% PEG400, 100 mMTris, 4% DMSO and 1% 1,2,3-heptanetriol.
A merged data set at 3.5 A was obtained from 23 crystals(Supplementary Table 2). The structure was solved by molecularreplacement using the structure of the carazolol-bound b2AR and ananobody as search models. Supplementary Fig. 3a shows the packingof the b2AR–T4L–Nb80 complex in the crystal lattice. The receptorhas interactions with lattice neighbours in several directions, and isrelatively well ordered (Supplementary Fig. 3a and b), with readilyinterpretable electron density for most of the polypeptide. Nb80 bindsto the cytoplasmic end of the b2AR, with the third complementarity-determining region (CDR) loop projecting into the core of the recep-tor (Fig. 2a, and Supplementary Fig. 4).
Agonist-stabilized changes in the b2ARFigure 2 b–d compares the inactive b2AR structure (from the carazo-lol bound b2AR–T4L structure) with the agonist-bound b2AR com-ponent of the b2AR–T4L–Nb80 complex. The largest differences arefound at the cytoplasmic face of the receptor, with outward displace-ment of TM5 and TM6 and an inward movement of TM7 and TM3 inthe b2AR–T4L–Nb80 complex relative to the inactive structure. There
a
d
b c
TM5
TM6
C terminus
N terminus
TM7
90º
e
TM3 (DRY)
TM5
TM6 TM7 (NPxxY)
TM1TM2
TM4
11.4 Å
β2AR–Nb80 β2AR–Nb80
D/E3.49
R3.50
Y7.53Y5.58
E6.30
Y3.51
β2AR–Cz Opsin
N terminus
β2AR–Nb80β2AR–CzNb80
Figure 2 | Comparison of the agonist-Nb80 stabilized crystal structures ofthe b2AR with inverse agonist bound b2AR and opsin. The structure ofinverse agonist carazolol-bound b2AR–T4L (b2AR–Cz) is shown in blue withthe carazolol in yellow. The structure of BI-167107 agonist-bound and Nb80-stabilized b2AR–T4L (b2AR–Nb80) is shown in orange with BI-167107 ingreen. These two structures were aligned using the PyMOL align function.a, Side view of the b2AR–Nb80 complex with b2AR in orange and CDRs ofNb80 in light blue (CDR1) and blue (CDR3). b, Side view of the superimposedstructures showing significant structural changes in the intracellular and Gprotein facing part of the receptors. c, Comparison of the extracellular ligand
binding domains showing modest structural changes. d, Cytoplasmic viewshowing the ionic lock interaction between Asp 3.49 and Arg 3.50 of the DRYmotif in TM3 is broken in the b2AR–Nb80 structure. The intracellular end ofTM6 is moved outward and away from the core of the receptor. The arrowindicates an 11.4 A change in distance between the a-carbon of Glu 6.30 in thestructures of b2AR–Cz and b2AR–Nb80. The intracellular ends of TM3 andTM7 move towards the core by 4 and 2.5 A, respectively, while TM5 movesoutward by 6 A. e, The b2AR–Nb80 structure superimposed with the structureof opsin crystallized with the C-terminal peptide of Gt (transducin)2. PyMOL(http://www.pymol.org) was used for the preparation of all structure figures.
ARTICLE RESEARCH
1 3 J A N U A R Y 2 0 1 1 | V O L 4 6 9 | N A T U R E | 1 7 7
Macmillan Publishers Limited. All rights reserved©2011
β2AR-Nb80 (active)
β2AR-Cz (inactive)
Arg131
Asp130BROKEN
ionic lock interaction between Asp130 and Arg131 of the DRY motif in TM3 is broken in the
β2AR-Nb80 structure
4Å
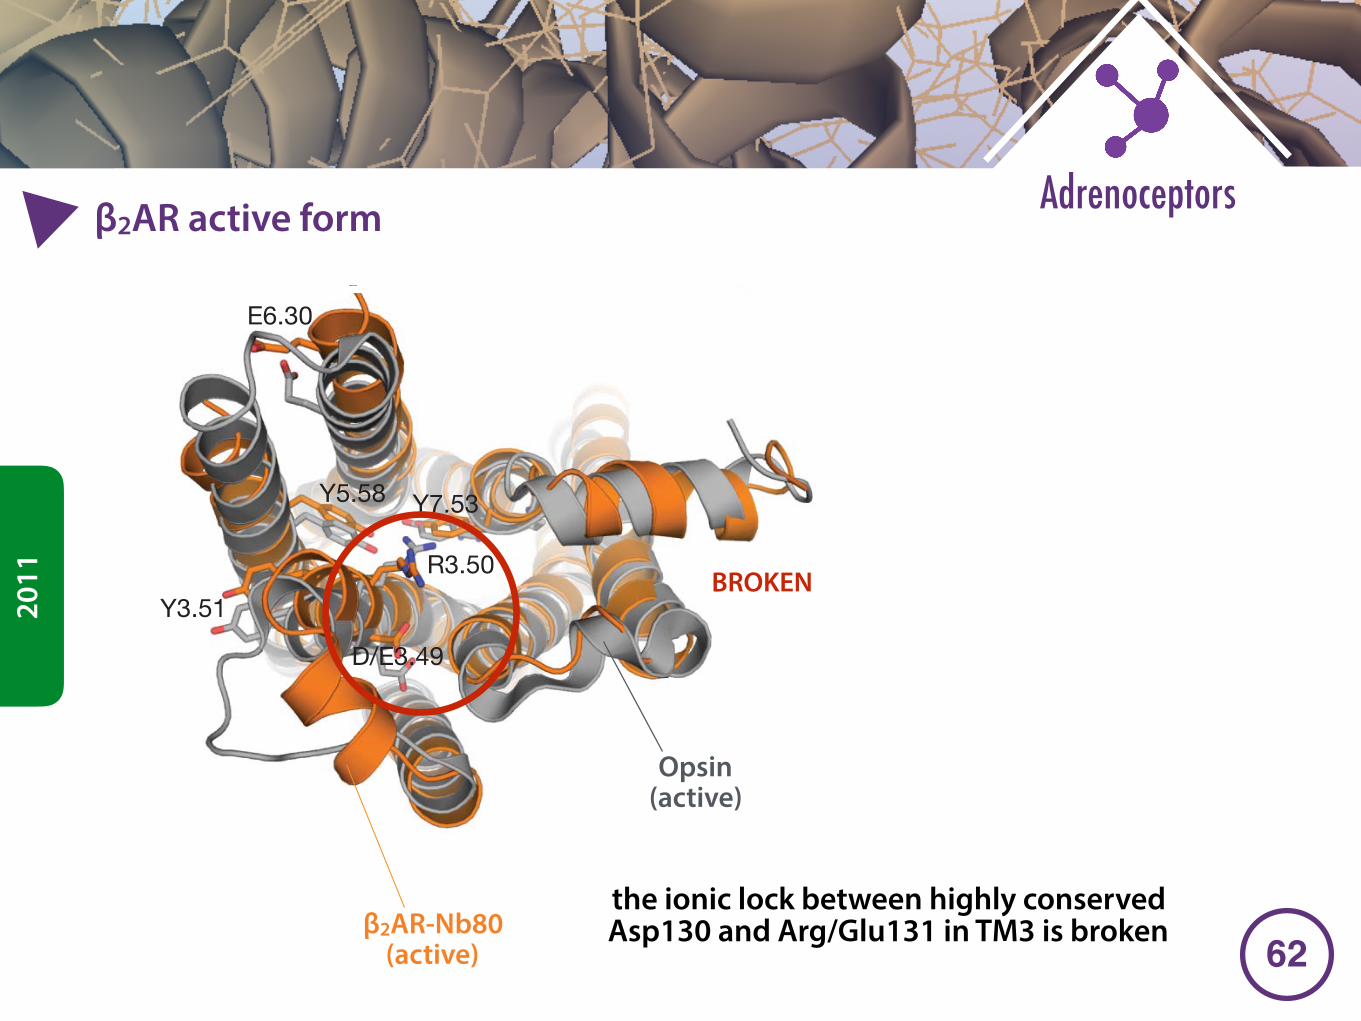
�62
Adrenoceptorsβ2AR active form
2011
High affinity b2AR agonistTo stabilize further the active state of the b2AR, we screened over 50commercial and proprietary b2AR ligands. Of these, BI-167107(Boehringer Ingelheim) had the most favourable efficacy, affinity andoff-rate profile. BI-167107 is a full agonist that binds to the b2AR with adissociation constant Kd of 84 pM (Supplementary Fig. 2a and b). Asshown in Supplementary Fig. 2c and d, BI-167107 induces a largerchange in the fluorescence intensity and lmax of bimane bound toCys 265 than does the agonist isoproterenol. Moreover, the rate ofdissociation of BI-167107 was extremely slow. Displacement of BI-167107 with an excess of the neutral antagonist alprenolol required150 h to complete, compared with 5 s for isoproterenol.
Crystallization of b2AR–T4L–Nb80 complexThe b2AR was originally crystallized bound to the inverse agonistcarazolol using two different approaches. The first crystals wereobtained from b2AR bound to a Fab fragment that recognized anepitope composed of the amino and carboxyl terminal ends of thethird intracellular loop connecting TMs 5 and 6 (ref. 8). In the secondapproach, the third intracellular loop was replaced by T4 lysozyme(b2AR–T4L)7. Efforts to crystallize b2AR–Fab complex and b2AR–T4L bound to BI-167107 and other agonists failed to produce crystalsof sufficient quality for structure determination. We thereforeattempted to crystallize BI-167107 bound to b2AR and b2AR–T4L
in complex with Nb80. Although crystals of both complexes wereobtained in lipid bicelles and lipidic cubic phase (LCP), high-resolutiondiffraction was only obtained from crystals ofb2AR–T4L–Nb80 grownin LCP. These crystals grew at pH 8.0 in 39–44% PEG400, 100 mMTris, 4% DMSO and 1% 1,2,3-heptanetriol.
A merged data set at 3.5 A was obtained from 23 crystals(Supplementary Table 2). The structure was solved by molecularreplacement using the structure of the carazolol-bound b2AR and ananobody as search models. Supplementary Fig. 3a shows the packingof the b2AR–T4L–Nb80 complex in the crystal lattice. The receptorhas interactions with lattice neighbours in several directions, and isrelatively well ordered (Supplementary Fig. 3a and b), with readilyinterpretable electron density for most of the polypeptide. Nb80 bindsto the cytoplasmic end of the b2AR, with the third complementarity-determining region (CDR) loop projecting into the core of the recep-tor (Fig. 2a, and Supplementary Fig. 4).
Agonist-stabilized changes in the b2ARFigure 2 b–d compares the inactive b2AR structure (from the carazo-lol bound b2AR–T4L structure) with the agonist-bound b2AR com-ponent of the b2AR–T4L–Nb80 complex. The largest differences arefound at the cytoplasmic face of the receptor, with outward displace-ment of TM5 and TM6 and an inward movement of TM7 and TM3 inthe b2AR–T4L–Nb80 complex relative to the inactive structure. There
a
d
b c
TM5
TM6
C terminus
N terminus
TM7
90º
e
TM3 (DRY)
TM5
TM6 TM7 (NPxxY)
TM1TM2
TM4
11.4 Å
β2AR–Nb80 β2AR–Nb80
D/E3.49
R3.50
Y7.53Y5.58
E6.30
Y3.51
β2AR–Cz Opsin
N terminus
β2AR–Nb80β2AR–CzNb80
Figure 2 | Comparison of the agonist-Nb80 stabilized crystal structures ofthe b2AR with inverse agonist bound b2AR and opsin. The structure ofinverse agonist carazolol-bound b2AR–T4L (b2AR–Cz) is shown in blue withthe carazolol in yellow. The structure of BI-167107 agonist-bound and Nb80-stabilized b2AR–T4L (b2AR–Nb80) is shown in orange with BI-167107 ingreen. These two structures were aligned using the PyMOL align function.a, Side view of the b2AR–Nb80 complex with b2AR in orange and CDRs ofNb80 in light blue (CDR1) and blue (CDR3). b, Side view of the superimposedstructures showing significant structural changes in the intracellular and Gprotein facing part of the receptors. c, Comparison of the extracellular ligand
binding domains showing modest structural changes. d, Cytoplasmic viewshowing the ionic lock interaction between Asp 3.49 and Arg 3.50 of the DRYmotif in TM3 is broken in the b2AR–Nb80 structure. The intracellular end ofTM6 is moved outward and away from the core of the receptor. The arrowindicates an 11.4 A change in distance between the a-carbon of Glu 6.30 in thestructures of b2AR–Cz and b2AR–Nb80. The intracellular ends of TM3 andTM7 move towards the core by 4 and 2.5 A, respectively, while TM5 movesoutward by 6 A. e, The b2AR–Nb80 structure superimposed with the structureof opsin crystallized with the C-terminal peptide of Gt (transducin)2. PyMOL(http://www.pymol.org) was used for the preparation of all structure figures.
ARTICLE RESEARCH
1 3 J A N U A R Y 2 0 1 1 | V O L 4 6 9 | N A T U R E | 1 7 7
Macmillan Publishers Limited. All rights reserved©2011
the ionic lock between highly conserved Asp130 and Arg/Glu131 in TM3 is brokenβ2AR-Nb80
(active)
Opsin (active)
BROKEN
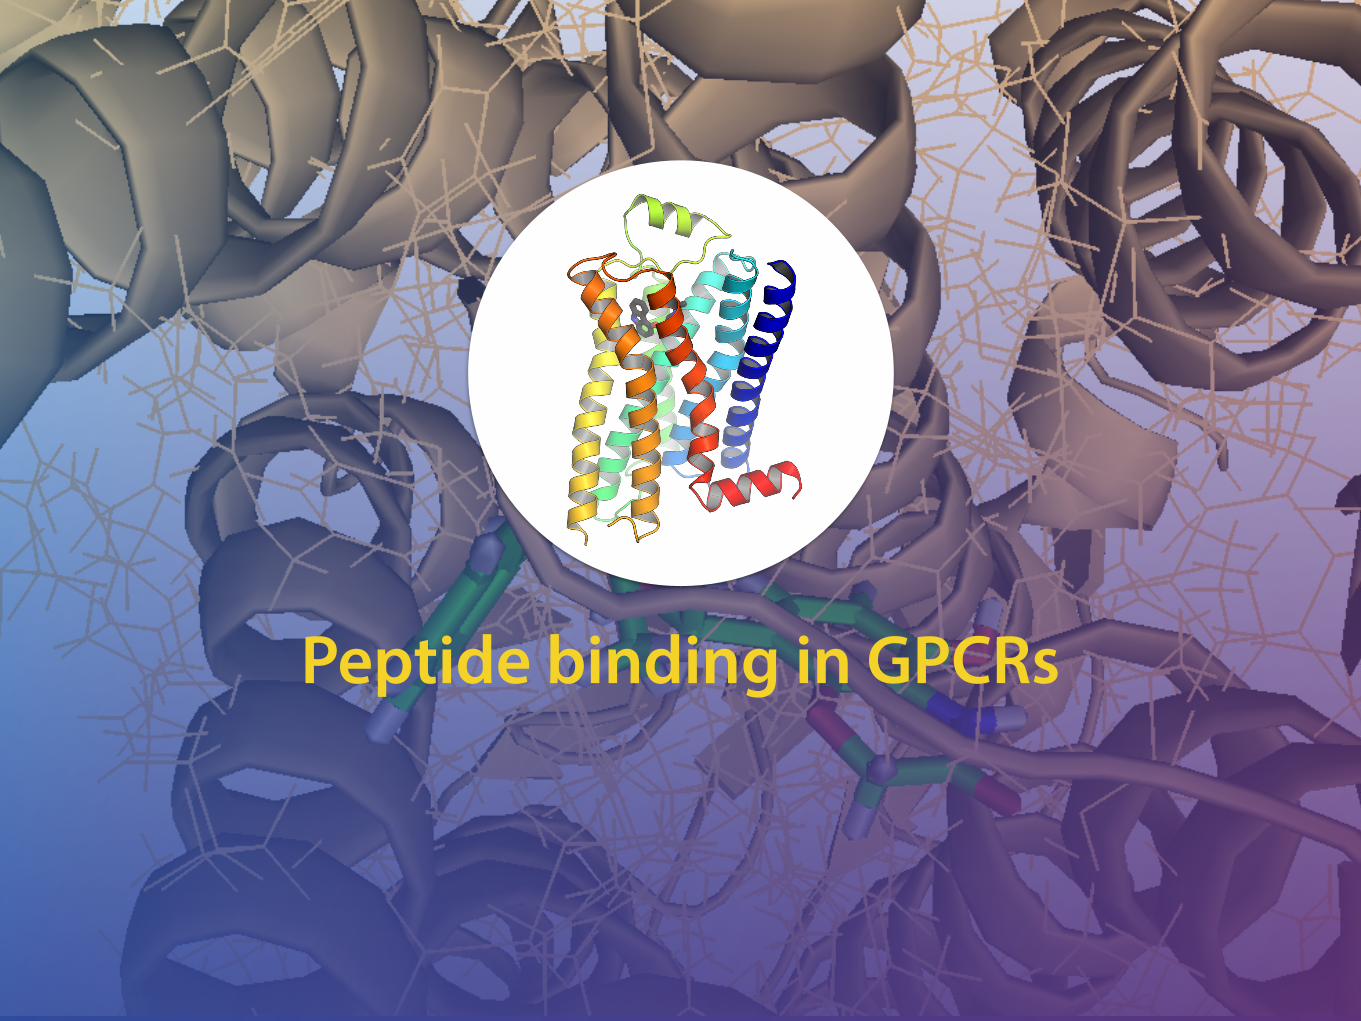
Peptide binding in GPCRs
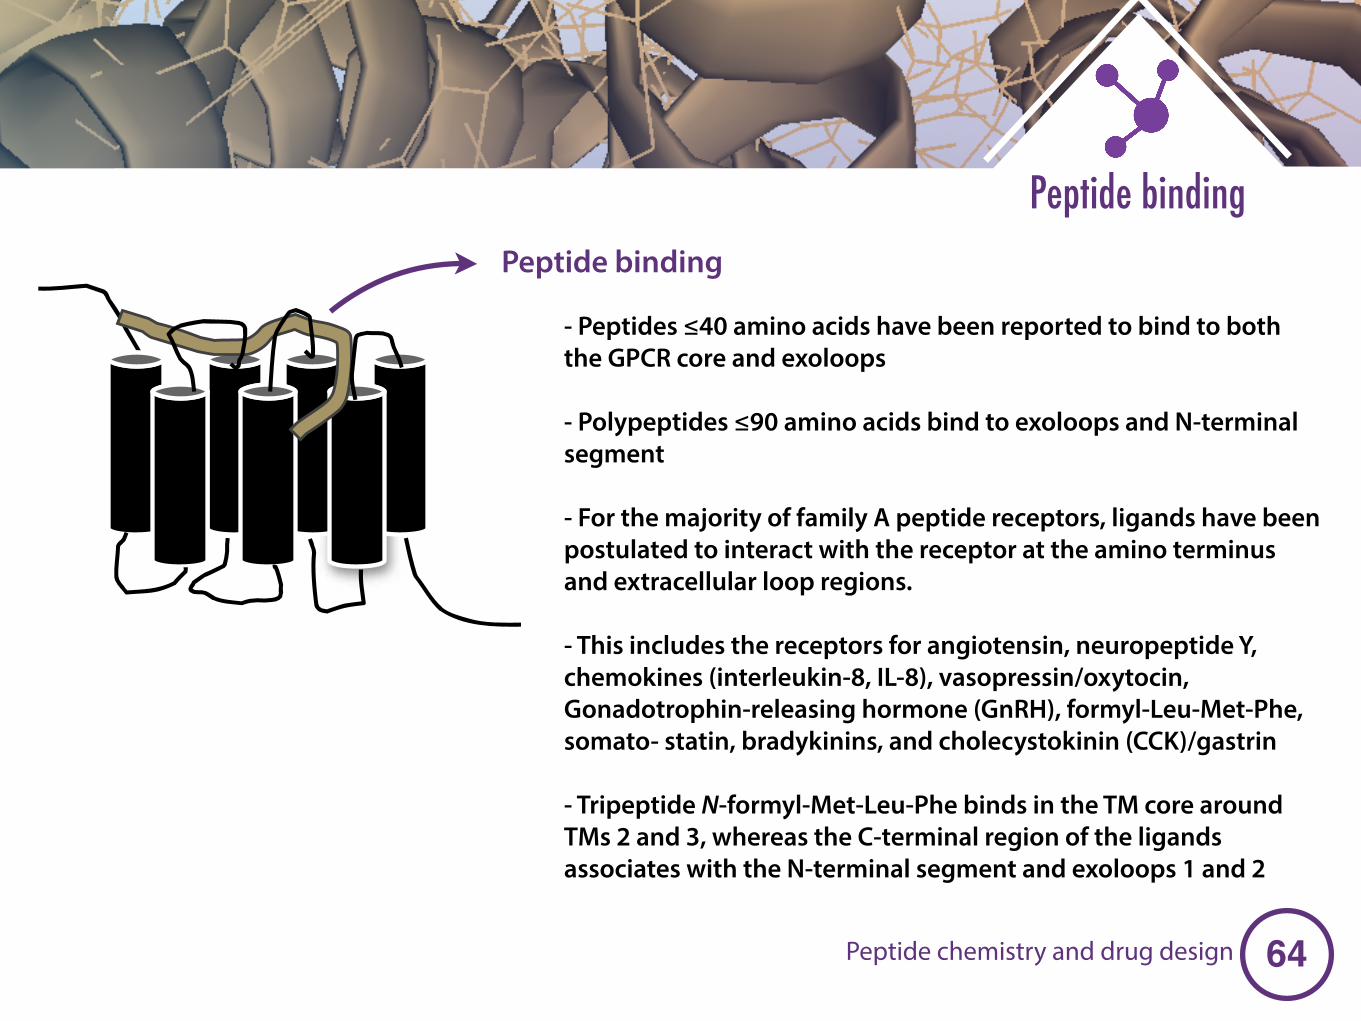
�64
Peptide binding
92 PEPTIDE DESIGN STRATEGIES FOR G-PROTEIN COUPLED RECEPTORS (GPCRs)
TM1
TM2
TM3
TM4
TM5 TM7
TM6
E1 E2 E3
C1C2 C3
NH3
CO2
S S
G-proteins
(a)
(b)
Figure 3.1 (a) General structure of GPCR; E= exoloop; C=Cytoloop. (b) Schematic pre-sentation of peptide hormone-receptor interaction for peptides of ≤40 amino acids.
structures have been refined at resolutions as high as 2.2 Å [19–21]. The structure ofan inactive form confirms the anticlockwise bundle of 7 TM α-helices, connected byextracellular loops of varying lengths [18]. Also, the amino terminal ligand bindingsegment of the Follicle-stimulating hormone (FSH) receptor was crystallized in com-plex with its ligand to 2.9 Å, which shed light on the receptor–ligand interactions andreceptor activation [22].
Remarkable progress in the analysis of GPCR structures was published in2007–2008. Crystal structures of a cephalopod rhodopsin showed structural dif-ferences, suggesting its coupling to the G-protein Gq rather than for transducin[23, 24]. Crystal structures of another class A GPCR, β-adrenergic receptor, whichwas bound to the inverse agonist, represent the first structures of GPCRs bound todiffusible ligands [25–29]. In addition, the crystal structure of bovine opsin hasprovided interesting information about the ligand binding and activation pathway[30, 31]. In another important study, native bovine opsin, an inactive form ofrhodopsin, was crystallized [30] by optimizing the selective extraction of rhodopsinfrom rod cell disc membranes. This methodology enabled crystallization withoutany modification of the protein that might cause structural distortions. Structuralexamination of this opsin revealed only slight changes relative to rhodopsin for TM
Peptide binding
- Peptides ≤40 amino acids have been reported to bind to both the GPCR core and exoloops
- Polypeptides ≤90 amino acids bind to exoloops and N-terminal segment
- For the majority of family A peptide receptors, ligands have been postulated to interact with the receptor at the amino terminus and extracellular loop regions.
- This includes the receptors for angiotensin, neuropeptide Y, chemokines (interleukin-8, IL-8), vasopressin/oxytocin, Gonadotrophin-releasing hormone (GnRH), formyl-Leu-Met-Phe, somato- statin, bradykinins, and cholecystokinin (CCK)/gastrin
- Tripeptide N-formyl-Met-Leu-Phe binds in the TM core around TMs 2 and 3, whereas the C-terminal region of the ligands associates with the N-terminal segment and exoloops 1 and 2
Peptide chemistry and drug design
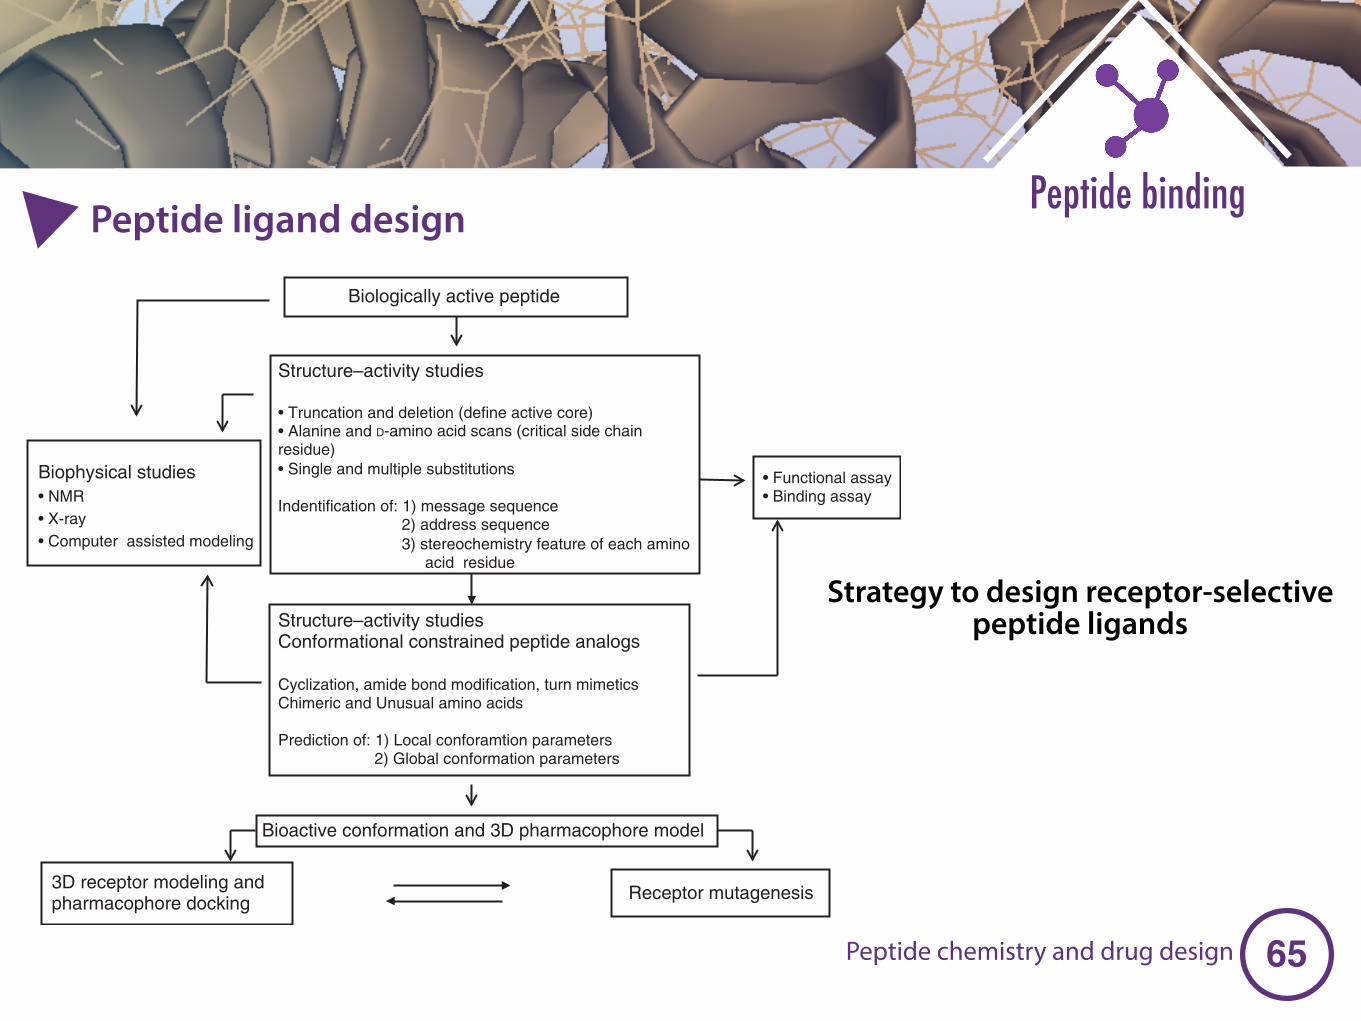
�65
Peptide bindingPeptide ligand design100 PEPTIDE DESIGN STRATEGIES FOR G-PROTEIN COUPLED RECEPTORS (GPCRs)
Biologically active peptide
Biophysical studies• NMR• X-ray • Computer assisted modeling
Structure–activity studies
• Truncation and deletion (define active core)• Alanine and D-amino acid scans (critical side chain residue)• Single and multiple substitutions
Indentification of: 1) message sequence2) address sequence3) stereochemistry feature of each amino
acid residue
Receptor mutagenesis
• Functional assay• Binding assay
Structure–activity studiesConformational constrained peptide analogs
Cyclization, amide bond modification, turn mimeticsChimeric and Unusual amino acids
Prediction of: 1) Local conforamtion parameters2) Global conformation parameters
Bioactive conformation and 3D pharmacophore model
3D receptor modeling and pharmacophore docking
Figure 3.4 Strategy to design receptor-selective peptide ligands.
residue contains a methyl group at the C! side chain position. This residue possessesthe smallest C! side chain of the 20 naturally occurring eukaryotic amino acidsbesides glycine (Gly) residue. Gly residue contains a proton, which is smallerthan the methyl group; however, the amino acid Gly does not possess chirality atthe C! carbon, which can be important for the structure of the peptide. Thus, bysubstituting the peptide side chain with a small relatively neutral amino acid suchas Ala, the importance of a particular amino acid side chain moiety interaction withits corresponding target protein or receptor can be examined. If a particular sidechain is important for peptide structure or function, then on replacement with Ala,decreased ligand affinity and/or potency is anticipated to result. If the residue is notimportant for a particular hormone, then a very subtle, or no change, in ligand affinityand/or potency might be observed. These data can allow for the identification ofthe development of a peptide hormone pharmacophore model. This pharmacophoreportion of a peptide hormone is considered to be the positioning of key atoms in 3Dspace important for the peptide to selectively recognize its cognate receptor. Thisinformation is highly desirable as it can be used in the design process to generatepeptidomimetics and potential small molecule therapeutic ligands.
In the truncation approach, the peptide amino acid residues are deleted singly(or in combination) from either the N- or C-terminal domain of a peptide. Infor-mation obtained from these types of studies can narrow down a particular aminoacid sequence that might retain acceptable potency while decreasing the number of
Strategy to design receptor-selective peptide ligands
Peptide chemistry and drug design
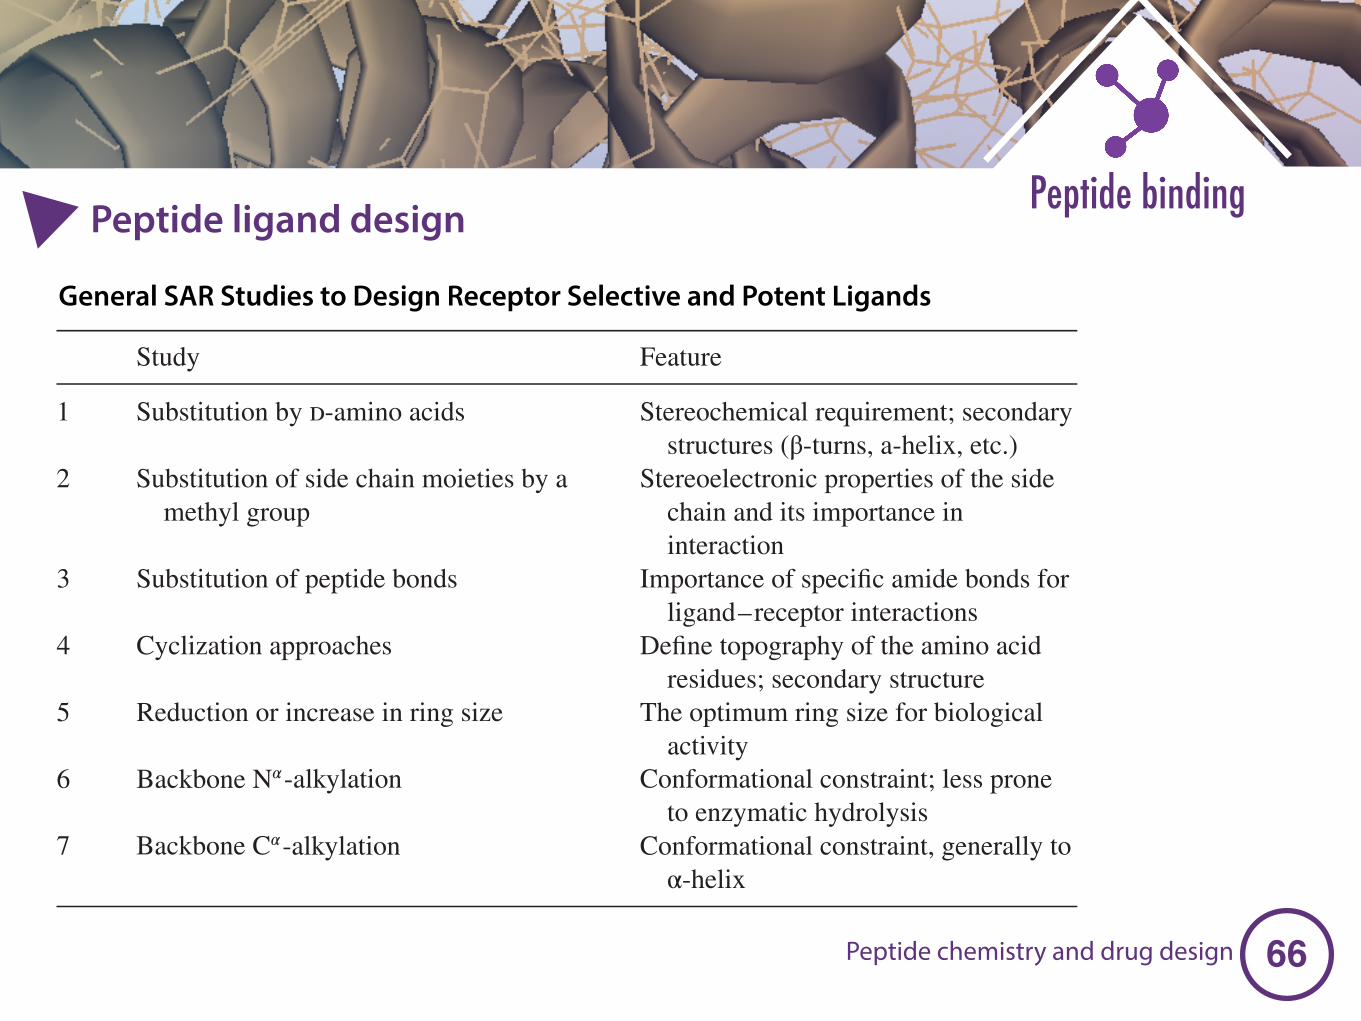
�66
Peptide bindingPeptide ligand design
General SAR Studies to Design Receptor Selective and Potent Ligands
102 PEPTIDE DESIGN STRATEGIES FOR G-PROTEIN COUPLED RECEPTORS (GPCRs)
TABLE 3.3 General SAR Studies to Design Receptor Selective and Potent Ligands.
Study Feature
1 Substitution by d-amino acids Stereochemical requirement; secondarystructures (β-turns, a-helix, etc.)
2 Substitution of side chain moieties by amethyl group
Stereoelectronic properties of the sidechain and its importance ininteraction
3 Substitution of peptide bonds Importance of specific amide bonds forligand–receptor interactions
4 Cyclization approaches Define topography of the amino acidresidues; secondary structure
5 Reduction or increase in ring size The optimum ring size for biologicalactivity
6 Backbone N!-alkylation Conformational constraint; less proneto enzymatic hydrolysis
7 Backbone C!-alkylation Conformational constraint, generally toα-helix
peptide, the energy associated with ligand structural conversion can be minimizedand, therefore, the ligand potency can be enhanced by decreasing the overall energyrequired by the system. With that rationale, a common approach to restricting con-formational freedom of a peptide is the incorporation of cyclization strategies. Thesecyclization approaches can include side chain to side chain, backbone to backbone,and side chain to backbone. A common cyclization strategy used by nature is thedisulfide bridge, but the synthetic opportunities to create different types of cycliza-tions in peptides are only limited by the creativity of the investigator and the availableorthogonal synthetic strategies. One of the most common synthetic cyclization thathas historically been incorporated into peptides is the lactam bridge. This has beenprimarily due to the same chemistry as the typical amide bond formation of a grow-ing peptide chain. Backbone cyclization (BC) is one of the approaches that utilizesatoms in the backbone (N and/or C) of a target linear peptide through a linker toform a ring and shown to dramatically enhance the metabolic stability and pharma-cological stability of peptides [96]. Advantage of BC over other peptide cyclizationmethods is that they use the backbone atoms leaving the side chain intact, which areessential for biological activity at the receptor. Utilizing this approach, Hess et al.[96] have synthesized a library of backbone cyclic analogs where the bridge wasformed connecting the N-terminus to the N! of the C-terminal Gly building unit bya dicarboxylic acid spacer. All the peptides in the library consist of the same par-ent sequence, but differ in ring size. From this study, they found that the compoundBL3020-1, which was selective for the MC4R, had favorable metabolic and phar-macokinetic properties. In another example of cyclization approach, Ahn et al. [97]have used positional cyclization scanning approach to identify the bioactive confor-mation of glucagon. Once hypotheses regarding a particular peptide pharmacophore
Peptide chemistry and drug design
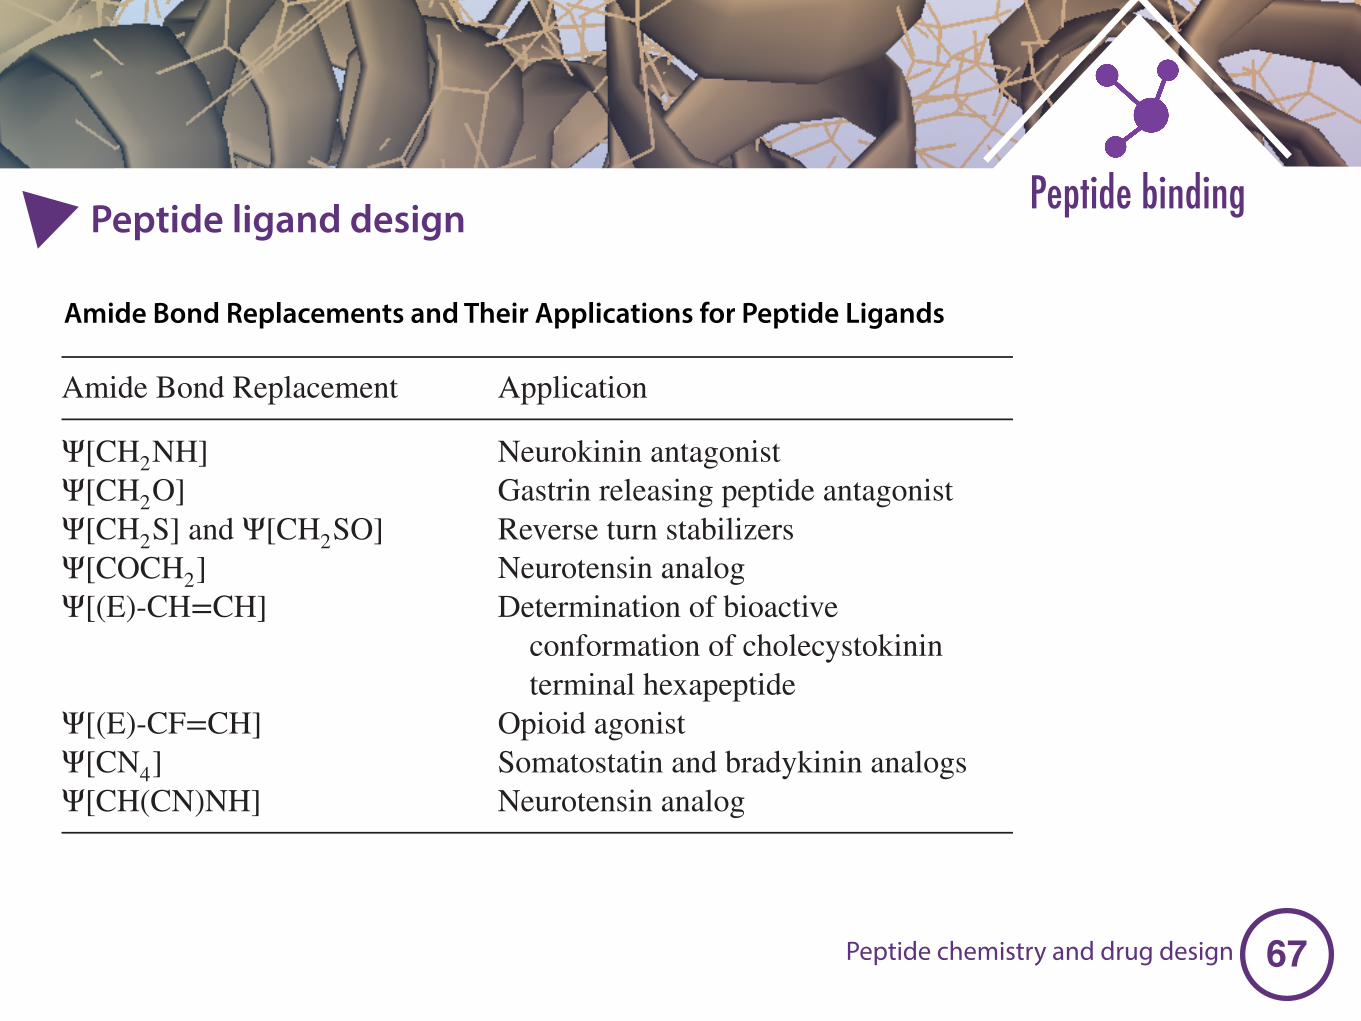
�67
Peptide bindingPeptide ligand design
Amide Bond Replacements and Their Applications for Peptide Ligands
DESIGN APPROACHES FOR GPCR SELECTIVE PEPTIDE LIGANDS 103
TABLE 3.4 Amide Bond Replacements and Their Applications for PeptideLigands [98].
Amide Bond Replacement Application References
Ψ[CH2NH] Neurokinin antagonist [99]Ψ[CH2O] Gastrin releasing peptide antagonist [100]Ψ[CH2S] and Ψ[CH2SO] Reverse turn stabilizers [101]Ψ[COCH2] Neurotensin analog [102]Ψ[(E)-CH=CH] Determination of bioactive
conformation of cholecystokininterminal hexapeptide
[103]
Ψ[(E)-CF=CH] Opioid agonist [104]Ψ[CN4] Somatostatin and bradykinin analogs [105]Ψ[CH(CN)NH] Neurotensin analog [102]
and/or biologically active conformations are generated, a common approach is thento incorporate unusual amino acids in attempts to increase ligand-binding interactionsas well as enhance desired receptor selectivity profiles by restricting the conforma-tional flexibility of the peptide backbone. Constrained amino acids strategy has led tothe discovery of peptides that show increased binding affinity, potency, and selectivitytoward one or more of the receptors.
Peptide backbones consist of amide bonds that are most commonly found in a transconfiguration under normal conditions and are very susceptible to the biodegradation,which limit the ability of peptides to act as therapeutic agents. However, the modifi-cation of the amide backbone can help stabilize a postulated pharmacophore model,add increased enzymatic and biological stability. Modifications of the peptide amidebond with a bioisosteric group that resembles an amide without the drawbacks listedabove, result in the somewhat rigid or locked conformation of the ligand that mayhave enhance binding affinity to specific target. Amide bond surrogates range fromsimple olefinic groups to more sophisticated heterocycles. Table 3.4 lists some of thecommon amide bond isosteres that have been reported to be applicable in the case ofpeptide ligands [106].
3.7.2 Chimeric Peptide Analogs
Another approach is to place key structural moieties into novel templates or linkthem together on alternate templates to produce chimeric analogs to examineselectivity and/or potency. Recent examples in this context are the novel chimericmelanotropin–deltorphin analogs by Han et al. [107]. Chimeric melanocortin-AGRP(agouti-related protein) peptides were synthesized to test the hypothesis that theArg-Phe-Phe motif human agouti-related protein(hAGRP)(111–113) mimics thedPhe-Arg-Trp of the melanocortin agonists in interactions with melanocortinreceptors [108–110].
Peptide chemistry and drug design
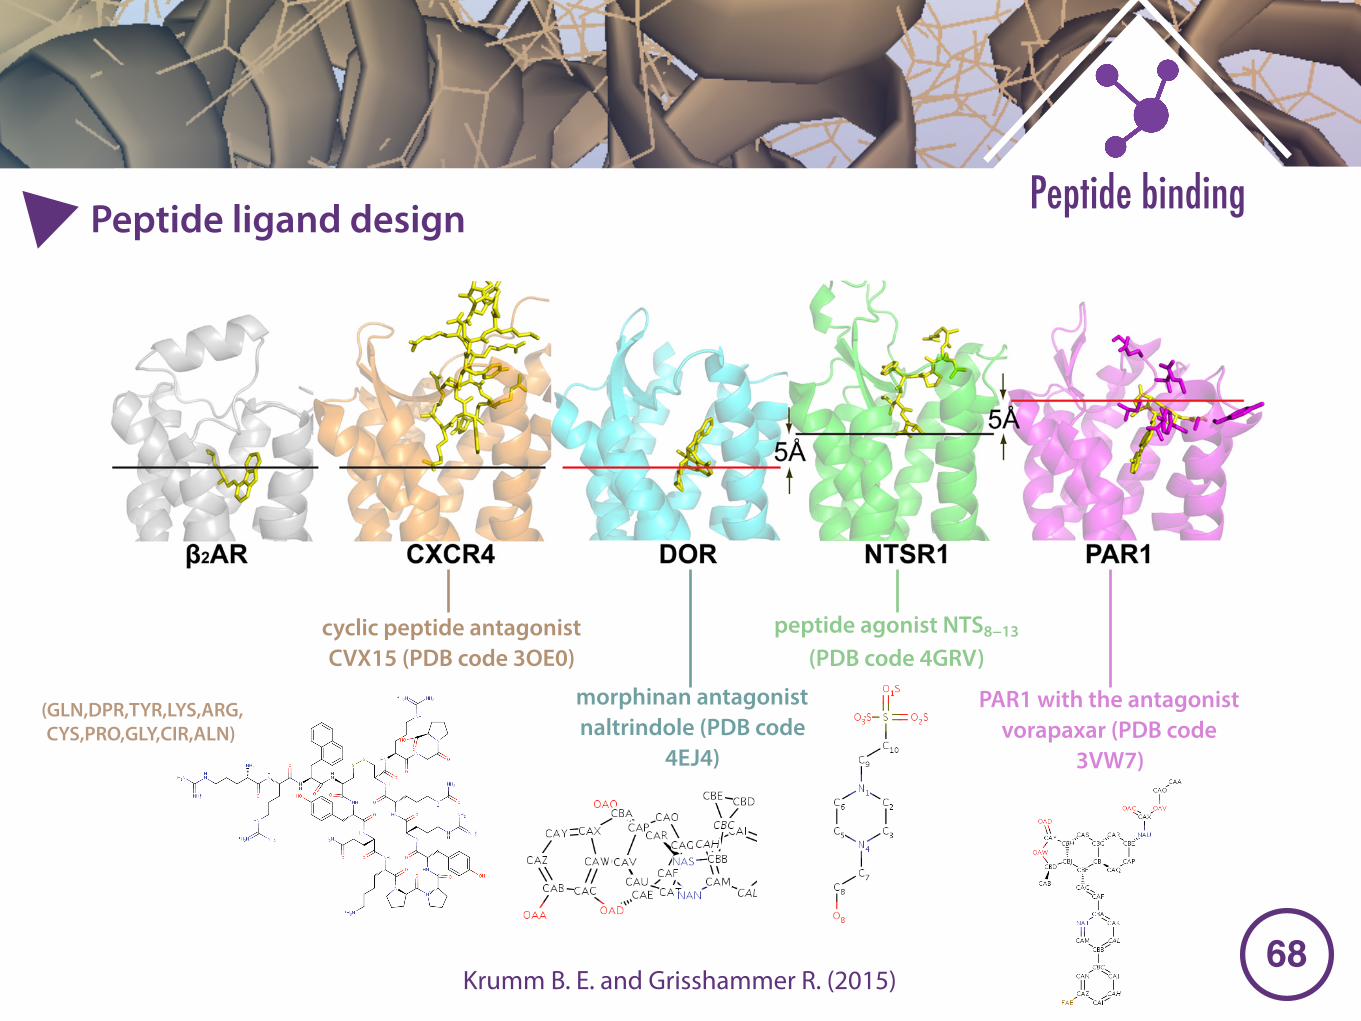
�68
Peptide bindingPeptide ligand design
Krumm B. E. and Grisshammer R. (2015)
Krumm and Grisshammer Peptide GPCRs
FIGURE 1 | Crystal structures of peptide receptors. Receptors werealigned in PyMol. Ligands are shown as yellow sticks, receptors areshown as cartoons. CXCR4 with the cyclic peptide antagonist CVX15(PDB code 3OE0), DOR with the morphinan antagonist naltrindole (PDBcode 4EJ4), NTSR1 with the peptide agonist NTS8−13 (PDB code 4GRV),and PAR1 with the antagonist vorapaxar (PDB code 3VW7). For
comparison, the α group member β2-adrenergic receptor with the partialinverse agonist carazolol (PDB code 2RH1) is shown. Red lines indicatethe putative depth of peptide ligand binding as discussed in the review;black lines indicate the depth of ligand binding as seen in the respectivestructures. Residues of PAR1, implicated in tethered ligand binding, areshown as purple sticks.
rim of the binding site, whereas the negatively charged car-boxylate of Leu13 resides in an electropositive environment.There are also extensive van der Waals interactions betweenNTS8−13 and the receptor; key NTSR1 residues are in con-tact with NTS via hydrogen bonds and salt bridges. It isremarkable that only three out of eight hydrogen bonds aremade between the side chains of NTS8−13 and the receptor,with the bulk of receptor-ligand contacts being van der Waalsinteractions.
Opioid Receptors (DOR, KOR, MOR,NOP)
The classical opioid receptors DOR, KOR, and MOR, and therelated NOP, play important roles in the central nervous sys-tem, regulating pain perception and mood (Pasternak, 2014). Thestructures of all four opioid GPCRs, in complex with subtypespecific non-peptide antagonists, have been determined in theirinactive conformations (Granier et al., 2012; Manglik et al., 2012;Thompson et al., 2012; Wu et al., 2012; Fenalti et al., 2014). Theligand binding pockets are wide open and solvent exposed, withthe lower part being highly conserved among opioid receptors,and the upper part being diverse conferring subtype specificity.Thus the opioid receptor structures provided insight into the‘message-address’ concept (Lipkowski et al., 1986) in which theligand consists of two distinct parts with information aboutefficacy (message, in contact with the lower portion of thebinding pocket) and selectivity (address, upper part of bind-ing pocket). Many opioid antagonists (DOR specific naltrindole,KOR specific JDTic; MOR specific β-funaltrexamine) displaycommon features such as a phenolic hydroxyl in close prox-imity to a positive charge (Granier et al., 2012; Manglik et al.,2012; Wu et al., 2012) resembling the N-terminal tyrosineresidue of endogenous opioid peptides, for example endorphins,enkephalins, and dynorphins. The NOP specific compoundC-24 has a benzofuran head group lacking the hydroxyl group(Thompson et al., 2012) reminiscent of the N-terminal pheny-lalanine of the nociceptin peptide. All the determined structureshave an antagonist bound deep within the binding pocket at
similar positions as agonists and antagonists in the β-adrenergicreceptor, forming ionic interactions with an aspartate residue(Asp3.32) conserved in all opioid receptors, suggesting an essen-tial role of Asp3.32 in anchoring positively charged ligands(Wu et al., 2012). Additional interactions between binding pocketresidues and antagonists involve a water-mediated hydrogenbond network linking the antagonist phenolic hydroxyl to aconserved histidine residue (His6.52) in the classical opioidreceptors (Granier et al., 2012; Manglik et al., 2012; Wu et al.,2012).
There are currently no structures of opioid receptors in com-plex with a peptide agonist or peptide antagonist. However, thebindingmode and the similarity of features between non-peptidicantagonists and opioid peptides suggest that the N-termini ofthe opioid peptides might penetrate deeply into their respec-tive receptors (Figure 1). Opioid peptides show great diversityin their chemical properties. For example, enkephalins are shortpeptides lacking charged amino acid side chains, whereas dynor-phins and nociceptin are longer peptides with several Arg andLys residues in their C-termini (Figure 2 inset). Site-directedmutagenesis studies suggest that the MOR selective syntheticpeptide agonist [D-Ala2,N-MePhe4,Gly-ol5] enkephalin makesboth polar and non-polar contacts with the receptor (Seki et al.,1998; Manglik et al., 2012), reflecting the lack of highly chargedsurfaces in the MOR ligand binding site. In contrast, electro-static surface potentials of NOP and KOR reveal striking differ-ences compared to those of DOR and MOR (Figure 2). NOPand KOR have highly acidic patches at the extracellular sidewhich likely form contact points for the basic C-termini ofnociceptin and dynorphins. Molecular docking of the peptideantagonist UFP-101 into the NOP binding pocket corroboratesthat all six basic amino acids of the peptide are in contactwith the acidic residues of ECL2 at the binding pocket entrance(Thompson et al., 2012).
Chemokine Receptors (CXCR4, CCR5)
Chemokine receptors and their peptidic ligands, chemokines, areimplicated in the migration of many cell types and constitute
Frontiers in Pharmacology | www.frontiersin.org 3 March 2015 | Volume 6 | Article 48
peptide agonist NTS8−13 (PDB code 4GRV)
(GLN,DPR,TYR,LYS,ARG,CYS,PRO,GLY,CIR,ALN)
cyclic peptide antagonist CVX15 (PDB code 3OE0)
PAR1 with the antagonist vorapaxar (PDB code
3VW7)
morphinan antagonist naltrindole (PDB code
4EJ4)
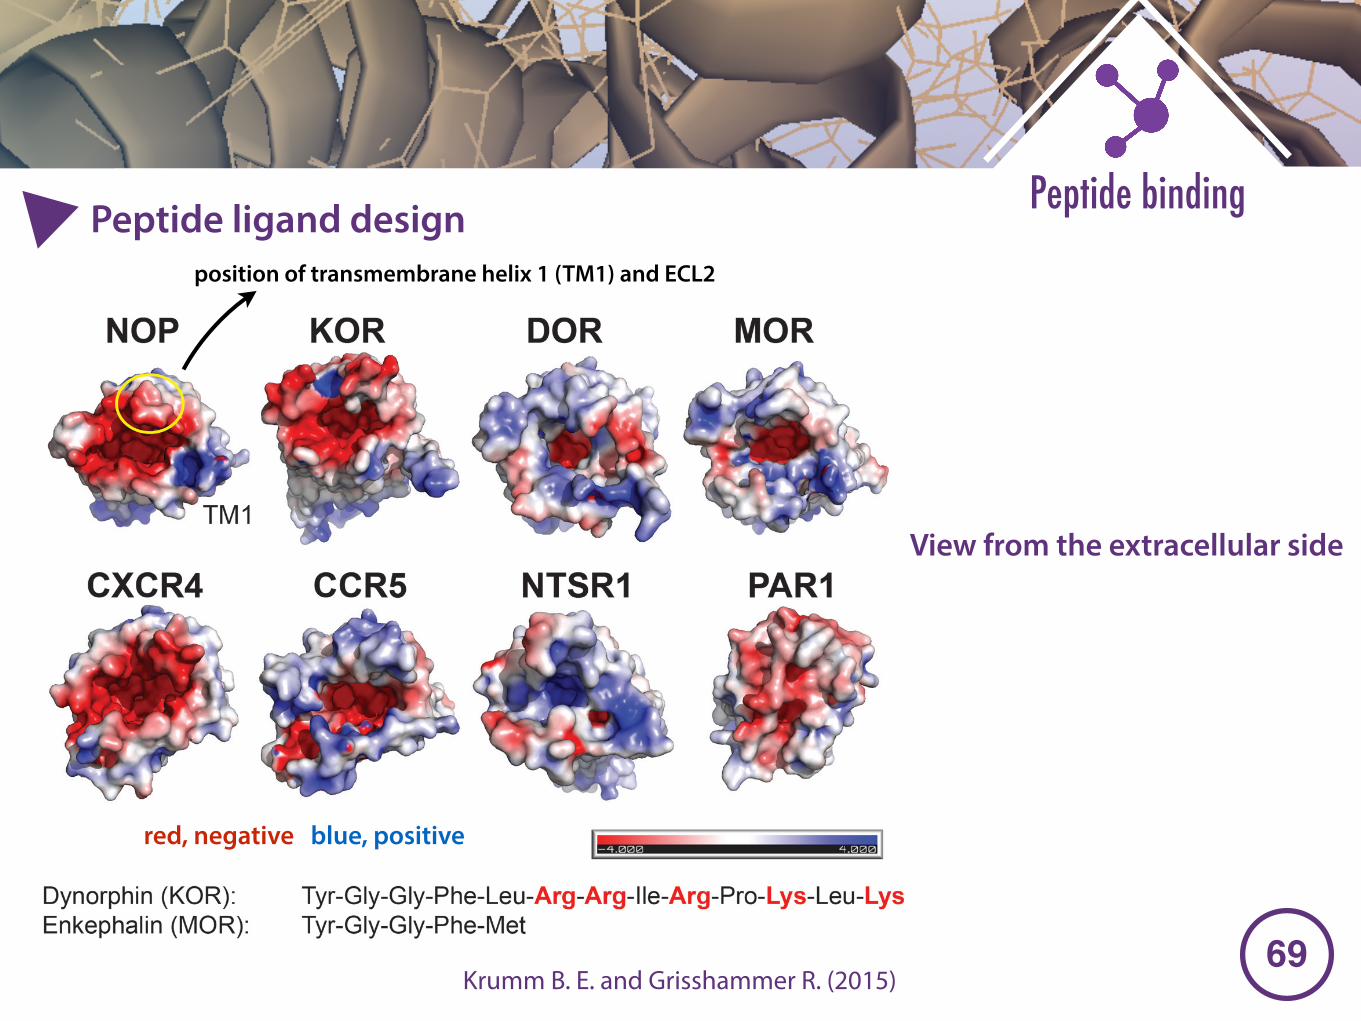
�69
Peptide bindingPeptide ligand design
Krumm B. E. and Grisshammer R. (2015)
Krumm and Grisshammer Peptide GPCRs
FIGURE 2 | Electrostatic surface properties contribute to discriminationbetween peptide ligands. View from the extracellular side. The receptorsurfaces are colored according to their electrostatic potential (scale bar−4 kTe−1 to +4 kTe−1; red, negative; blue, positive; PyMol using APBS tools).NOP (PDP code 4EA3); KOR (PDB code 4DJH); DOR (PDB code 4N6H); MOR
(PDB code 4KDL); CXCR4 (PDB code 3OE0); CCR5 (PDB code 4MBS); NTSR1(PDB code 4GRV); PAR1 (PDB code 3VW7). For orientation, the position oftransmembrane helix 1 (TM1) and ECL2 (circle) are indicated in NOP. Examplesof peptides for opioid receptors highlight the presence or absence of positivecharges.
therapeutic targets owing to their role in many human disorders(Baggiolini, 1998). In addition, the chemokine receptors CXCR4and CCR5 have been identified asHIV-1 co-receptors via the viralenvelope glycoprotein gp120 (Berger et al., 1999). The structuresof CXCR4 (Wu et al., 2010) and CCR5 (Tan et al., 2013) havebeen solved in complex with small drug-like inhibitors; CXCR4has also been crystallized in complex with the 16 residue cyclicpeptide inhibitor CVX15, an analog of the horseshoe crab peptidepolyphemusin. Comparison of the CXCR4 and CCR5 structuresprovide clues about the determinants for chemokine binding andHIV-1 co-receptor selectivity.
CXC chemokine receptor 4 has been co-crystallized with thesmall-molecule antagonist IT1t, an isothiourea derivative, andthe peptide CVX15. The ligand binding cavity is wide openalthough the entrance to the CXCR4 ligand binding pocket is par-tially covered by the receptor N-terminus and ECL2. The overallstructures of CXCR4 with IT1t and with CVX15 are similar; how-ever, the binding of the much larger CVX15 peptide caused someconformational differences compared to the CXCR4-IT1t struc-tures. CXCR4 is activated by the chemokine CXCL12, and a two-site model of chemokine binding has been suggested separatingthe binding and signaling functions of chemokine ligands: thechemokine globular domain is thought to bind the receptor N-terminus and ECLs (site one) defining affinity and specificity,
whereas the disordered N-terminal domain is thought to pene-trate into the receptor helical core (site two) controlling receptorsignaling. The IT1t and CVX15 complexes of CXCR4 may pointto site two, with the CVX15 peptide residues Arg1 and Arg2possibly indicating the depth of binding of the N-terminus ofCXCL12 (Figure 1) whose residue Lys1 has been implicated indirect involvement in receptor activation.
CC chemokine receptor 5 has been co-crystallized with theinhibitor Maraviroc, an approved drug for the treatment of HIV-1 infection. The CCR5 binding pocket is more open than thatof CXCR4. Maraviroc binding is distinct from the proposedmajor recognition sites for chemokines and the viral glycoproteingp120, providing insight into allosteric inhibition of chemokinesignaling and viral entry (Tan et al., 2013).
The third variable loop V3 of gp120 adopts a β-hairpin struc-ture and has been shown to play a major role in cellular tropismand co-receptor specificity (Berger et al., 1999). Several acidicresidues in the binding pocket of CXCR4 have been reported to becritical for HIV-1 infectivity. Interestingly, these acidic residuesare substituted by uncharged residues in CCR5 resulting in dif-ferent electrostatic surface potentials of the structures (Figure 2).This difference may correlate with the different charge propertiesof the V3 loops of X4- and R5-tropic viruses: X4-tropic viruseshave a more positively charged V3 region complementary to
Frontiers in Pharmacology | www.frontiersin.org 4 March 2015 | Volume 6 | Article 48
View from the extracellular side
red, negative blue, positive
position of transmembrane helix 1 (TM1) and ECL2
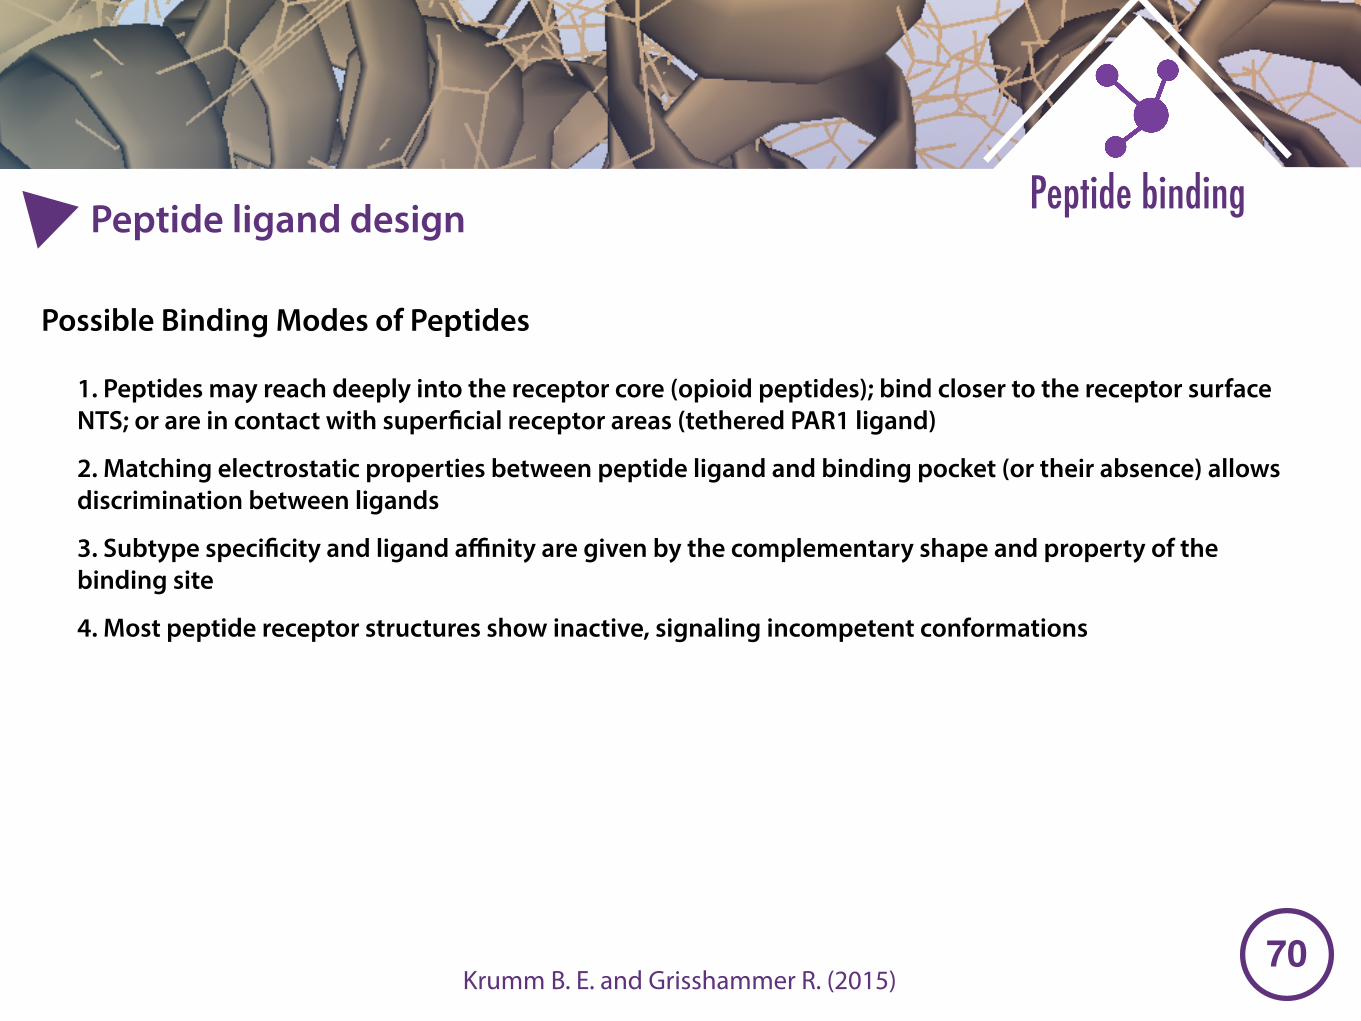
�70
Peptide bindingPeptide ligand design
Krumm B. E. and Grisshammer R. (2015)
Possible Binding Modes of Peptides
1. Peptides may reach deeply into the receptor core (opioid peptides); bind closer to the receptor surface NTS; or are in contact with superficial receptor areas (tethered PAR1 ligand)
2. Matching electrostatic properties between peptide ligand and binding pocket (or their absence) allows discrimination between ligands
3. Subtype specificity and ligand affinity are given by the complementary shape and property of the binding site
4. Most peptide receptor structures show inactive, signaling incompetent conformations

Insights into the world of GPCRs (Adrenergic Receptors)Speaker: Bundit Boonyarit 5814400587
Dept. Biochemistry, Fac. Science, Kasetsart University
2 May, 2016 (11.15 - 12.00 a.m.)
Advanced Protein Biochemistry (01402542)