Embed Size (px)
Citation preview
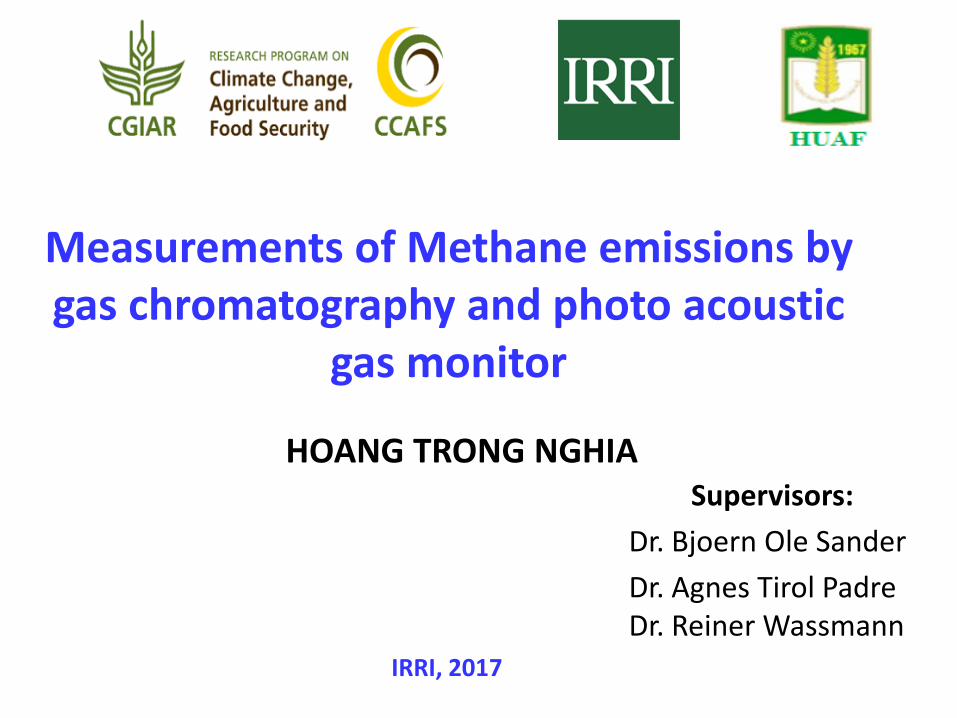
Measurements of Methane emissions by gas chromatography and photo acoustic
gas monitor
HOANG TRONG NGHIASupervisors:
Dr. Bjoern Ole Sander
Dr. Agnes Tirol Padre Dr. Reiner Wassmann
IRRI, 2017
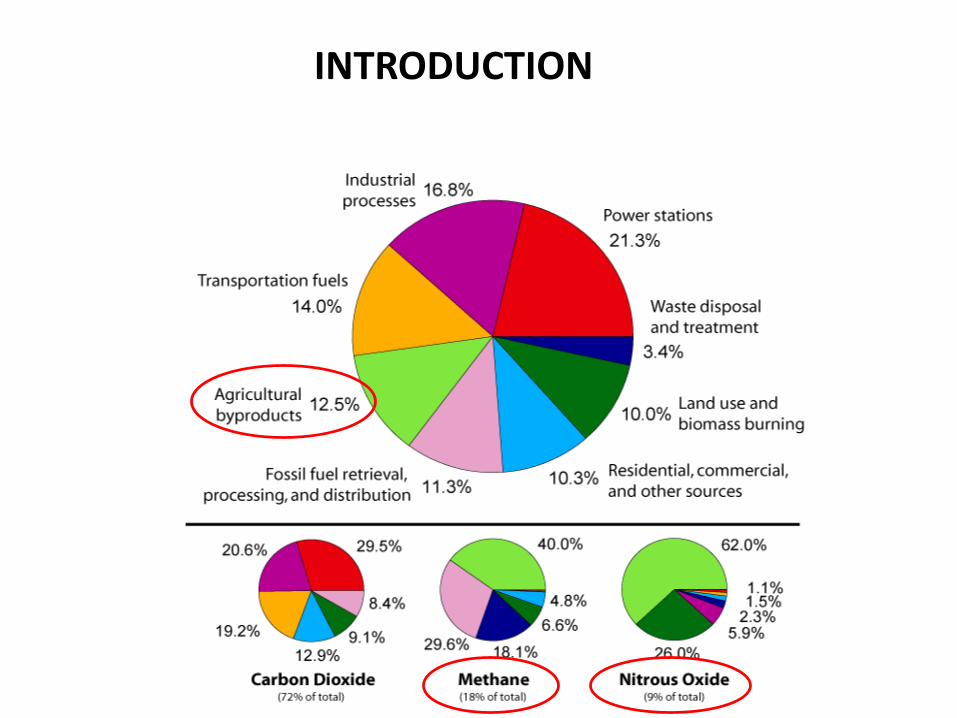
INTRODUCTION
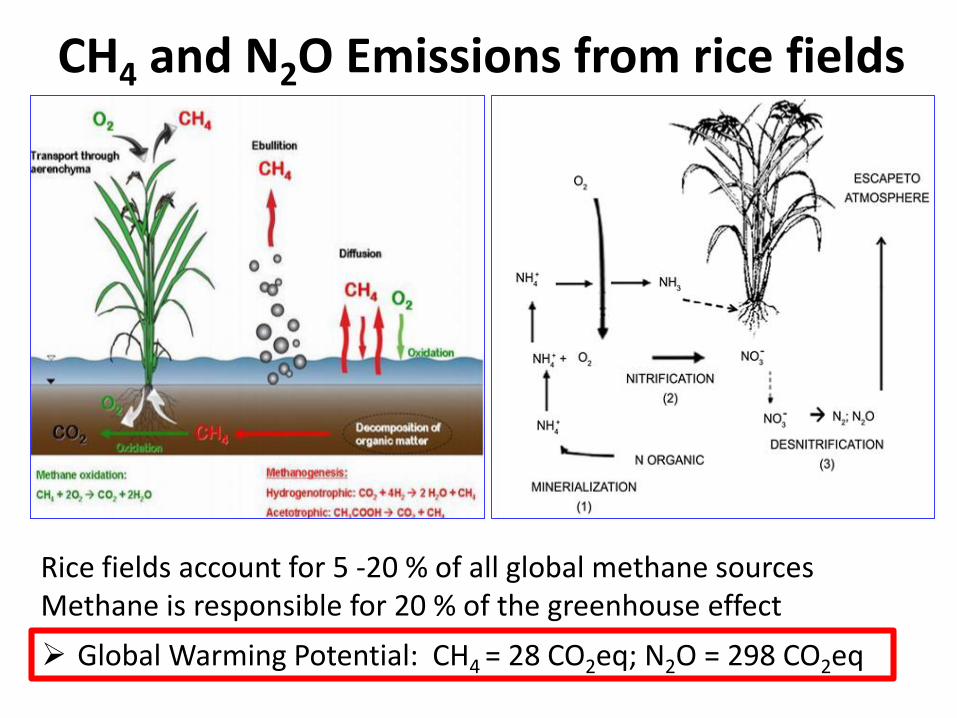
CH4 and N2O Emissions from rice fields
Global Warming Potential: CH4 = 28 CO2eq; N2O = 298 CO2eq
Rice fields account for 5 -20 % of all global methane sourcesMethane is responsible for 20 % of the greenhouse effect
Research objectives
To assess the performance of the semi-automated photo-acoustic gas monitor in tandem with a dew-point generator formeasuring CH4 emissions in a paddy rice field in comparisonwith manual gas sampling and analysis by gas chromatography
To conduct nighttime measurements with static chambers andextended chamber closure time to assess its use for reliableemission assessments, and to define a methodology for high-throughput screening of rice varieties that will vastly reducesampling requirements as compared to daytime
To study the effect of compost on greenhouse gas emission inagriculture production.
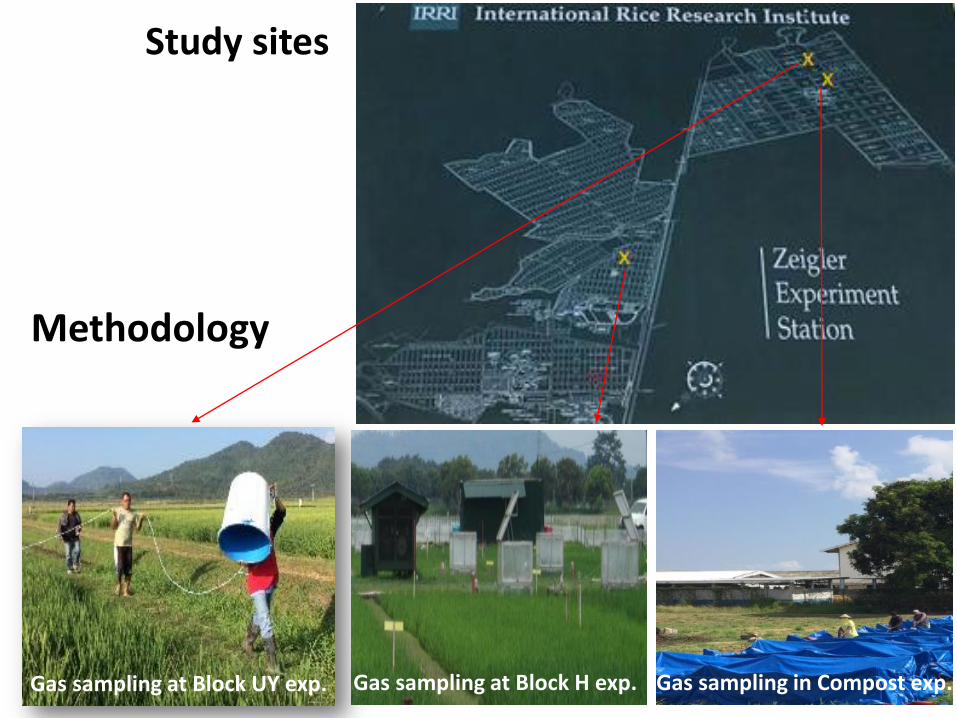
Methodology
Study sites
Gas sampling in Compost exp.Gas sampling at Block UY exp. Gas sampling at Block H exp.
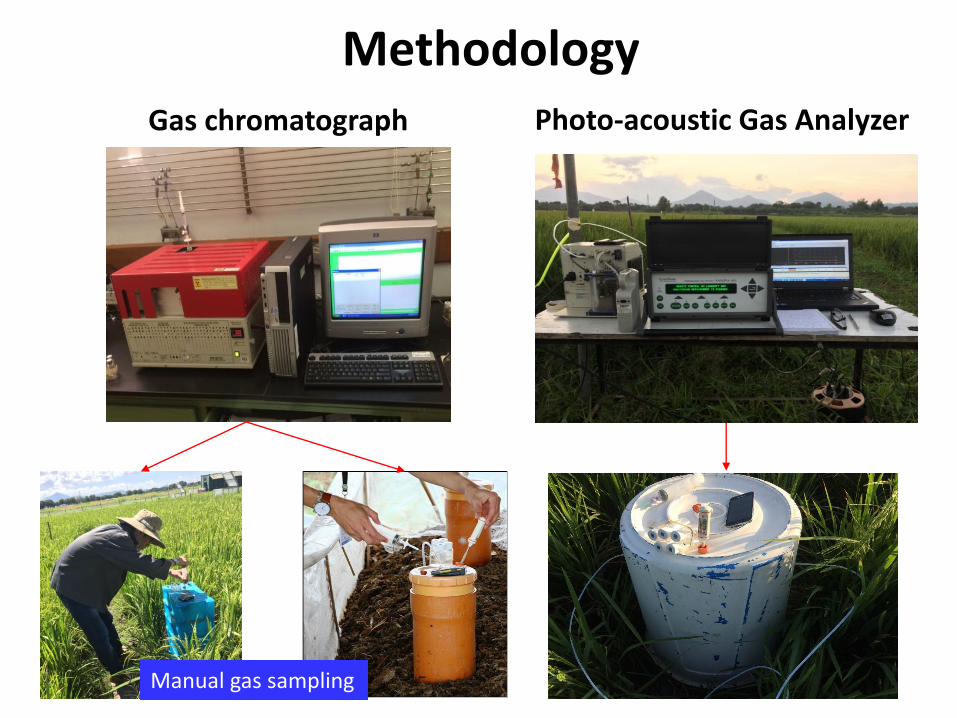
Gas chromatograph Photo-acoustic Gas Analyzer
Methodology
Manual gas sampling
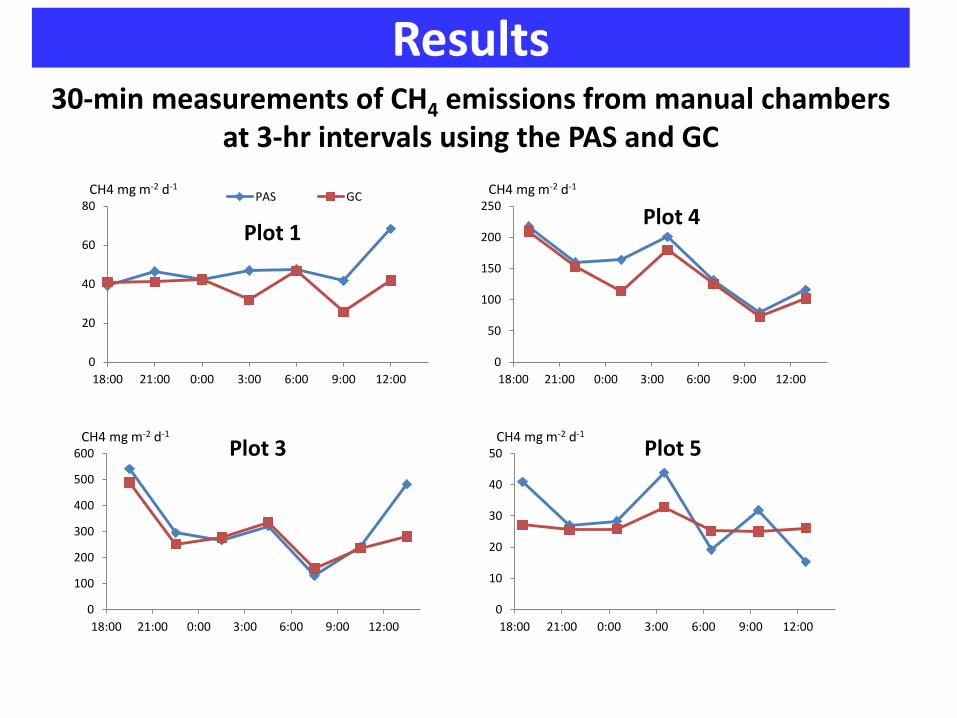
30-min measurements of CH4 emissions from manual chambers at 3-hr intervals using the PAS and GC
Results
0
20
40
60
80
18:00 21:00 0:00 3:00 6:00 9:00 12:00
Plot 1
PAS GCCH4 mg m-2 d-1
0
100
200
300
400
500
600
18:00 21:00 0:00 3:00 6:00 9:00 12:00
Plot 3CH4 mg m-2 d-1
0
50
100
150
200
250
18:00 21:00 0:00 3:00 6:00 9:00 12:00
Plot 4
CH4 mg m-2 d-1
0
10
20
30
40
50
18:00 21:00 0:00 3:00 6:00 9:00 12:00
Plot 5CH4 mg m-2 d-1
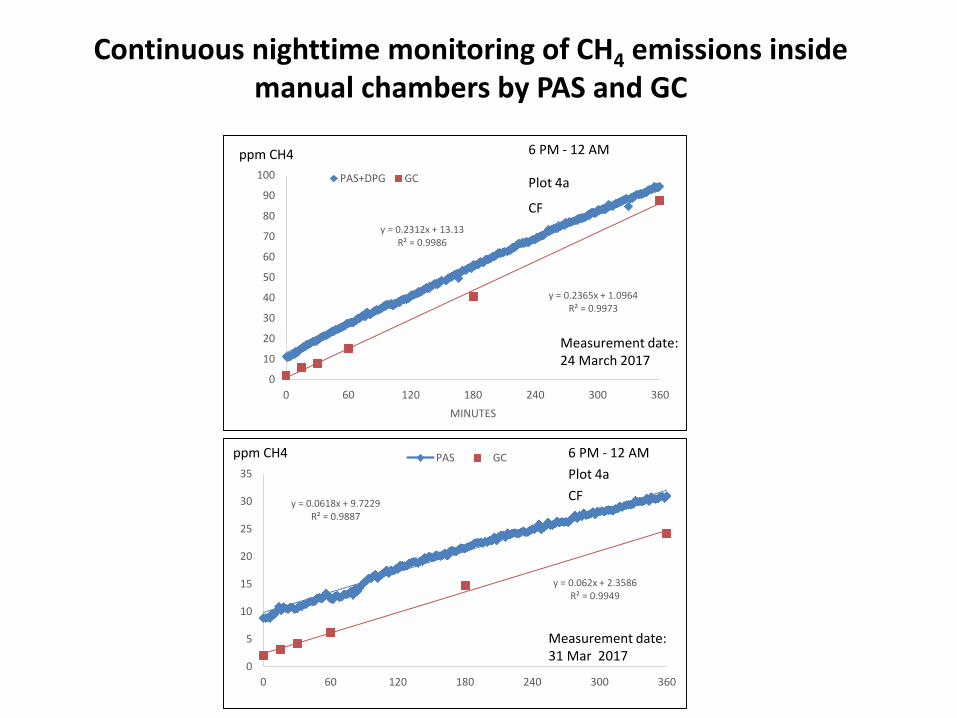
Continuous nighttime monitoring of CH4 emissions inside manual chambers by PAS and GC
y = 0.2312x + 13.13R² = 0.9986
y = 0.2365x + 1.0964R² = 0.9973
0
10
20
30
40
50
60
70
80
90
100
0 60 120 180 240 300 360
MINUTES
PAS+DPG GC
CF
6 PM - 12 AM
Measurement date: 24 March 2017
Plot 4a
ppm CH4
y = 0.0618x + 9.7229R² = 0.9887
y = 0.062x + 2.3586R² = 0.9949
0
5
10
15
20
25
30
35
0 60 120 180 240 300 360
PAS GCppm CH4
Plot 4a
CF
6 PM - 12 AM
Measurement date: 31 Mar 2017
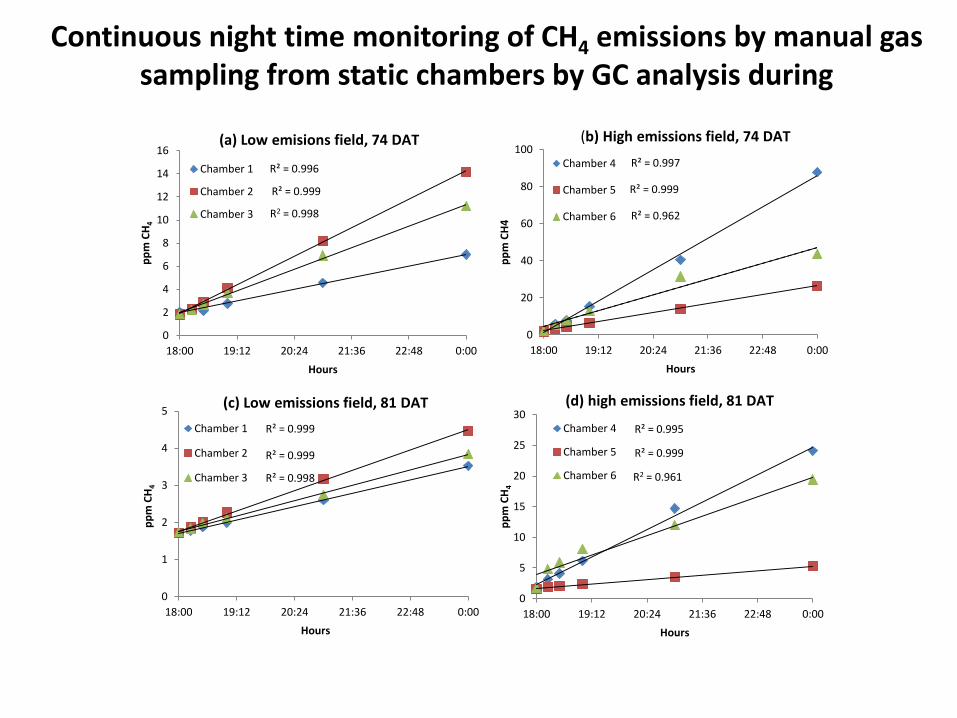
Continuous night time monitoring of CH4 emissions by manual gas sampling from static chambers by GC analysis during
R² = 0.996
R² = 0.999
0
2
4
6
8
10
12
14
16
18:00 19:12 20:24 21:36 22:48 0:00
pp
m C
H4
Hours
Chamber 1
Chamber 2
Chamber 3
(a) Low emisions field, 74 DAT
R2 = 0.998
R² = 0.997
R² = 0.999
R² = 0.962
0
20
40
60
80
100
18:00 19:12 20:24 21:36 22:48 0:00
pp
m C
H4
Hours
Chamber 4
Chamber 5
Chamber 6
(b) High emissions field, 74 DAT
R² = 0.999
R² = 0.999
R² = 0.998
0
1
2
3
4
5
18:00 19:12 20:24 21:36 22:48 0:00
pp
m C
H4
Hours
Chamber 1
Chamber 2
Chamber 3
(c) Low emissions field, 81 DAT
R² = 0.995
R² = 0.999
0
5
10
15
20
25
30
18:00 19:12 20:24 21:36 22:48 0:00
pp
m C
H4
Hours
Chamber 4
Chamber 5
Chamber 6
(d) high emissions field, 81 DAT
R2 = 0.961
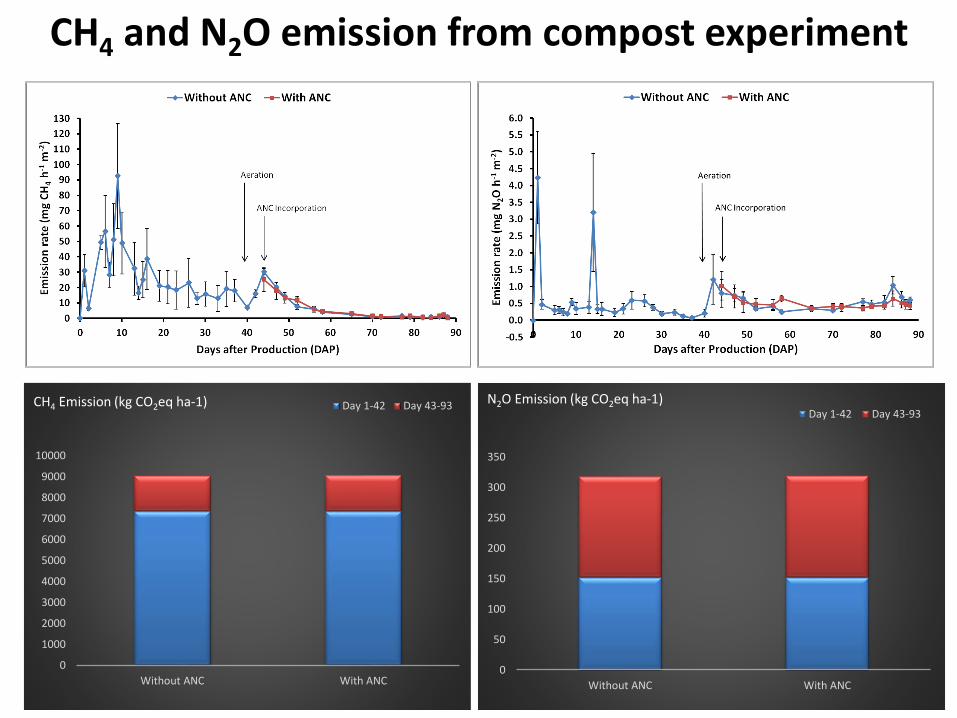
CH4 and N2O emission from compost experiment
0
50
100
150
200
250
300
350
Without ANC With ANC
Day 1-42 Day 43-93N2O Emission (kg CO2eq ha-1)
0
1000
2000
3000
4000
5000
6000
7000
8000
9000
10000
Without ANC With ANC
Day 1-42 Day 43-93CH4 Emission (kg CO2eq ha-1)
Conclusion
• CH4 emission rates measured from rice paddies by PAS intandem with a DPG were comparable with that measured byGC.
• Closure times of the chambers during night time can beexpanded to several hours since a linear increase in CH4
emissions was found from 6 PM to 12 midnight. This entailsmuch higher end concentrations for CH4 and eases the precisedetection of flux rates.
• Composting contributes to GHG emission by 9047 kg CO2-eqha-1 from CH4 Emission, 318 kg CO2-eq ha-1 from N2OEmission. Hence, evaluation of greenhouse gas emission fromcompost is necessary in rice production.
Application
Study can contribute to development of methodologies foradaptation and mitigation research:
• Results show that PAS can be a suitable alternative to GC foreasy but reliable and globally comparable CH4 emissionmeasurements for the improvement GHG mitigationstrategies and eventually for the development of policies formitigating climate change
• Results from the nighttime CH4 emission measurementsprovide proof of concept to define a methodology for high-throughput screening of rice varieties for low CH4 emissionsthat will vastly reduce sampling requirements as compared todaytime measurements.
Output
• 1 publication
• “Screening of methane emission rates for a high number of rice varieties: Improved methodology based on nighttime measurements”
• The paper is under review in PlosOne journal
Acknowledge
I would like to thank:
The CGIAR Research Program on Climate Change,
Agriculture and Food Security (CCAFS), through it is
Samples Program and CLIFF network, and International
Rice Research Institute (IRRI), contribute to this research.
Dr. Bjoern Ole Sander, Dr. Reinner Wassmann and Dr.
Agnes Tirol-Padre for scholastic and guidance from the
beginning to the completion of this research work.
All the staffs of Climate Change unit, CESD for helping me
in gas sampling/ analyzing collected samples of the
experiment.

Thanks for your attention!!!