Embed Size (px)
Citation preview

ANNEX

This publication has been produced thanks to the financial support of the European Union under the ENPI CBC Mediterranean Sea Basin Programme
FOSTEr inMED


Project LeaderUniversity of CagliariDepartment of Civil and EnvironmentalEngineering and Architecture Prof. Antonello Sanna
EditorsMaddalena Achenza(University of Cagliari - Italy)
Giuseppe Desogus(University of Cagliari - Italy)
This collective works gathers and integrates contributions fromall the Technical and Scientific Committee staff.
AnnexGiuseppe Desogus(University of Cagliari - Italy)
with contributions from
David Pifarré(Association of the Mediterranean Chambers of Commerce
and Industry - ASCAME - Spain)
Kamelia Youssef and Mohamed Salah Elsobki(Confederation of Egyptian European Business Associations - Egypt)
Elias Kinab and Talal Salem(Industrial Research Institute - Lebanon)
Firas Alawneh and Laith Basha(Royal Scientific Society - Jordan)
Neji Amaimia(Chamber of Commerce and Industry of Tunis - Tunisia)
Maria Francesca Muru(Regional Government of Sardinia - Italy)
Graphic DesignGiancarlo Murgia
DisclaimerThis document has been produced with the financial assistance of the European Union under the ENPI CBC Mediterranean Sea Basin Programme. The contents of this document are under the respon-sibility of University of Cagliari (UNICA) and FOSTEr in MED project partners and can under no circumstances be regarded as reflecting the position of the European Union or of the Programme’s manage-ment structures.The total budget of FOSTEr in MED project is 4,5 million Euro and it is financed for an amount of 4,05 million Euro by European union through the ENPI CBC Mediterranean Sea Basin Programme (www.enpicbcmed.eu).
Statement about the Programme The 2007-2013 ENPI CBC Mediterranean Sea Basin Programme is a multilateral Cross-Border Cooperation initiative funded by the Eu-ropean Neighborhood and Partnership Instrument (ENPI). The Pro-gramme objective is to promote the sustainable and harmonious co-operation process at the Mediterranean Basin level by dealing with the common challenges and enhancing its endogenous potential. It finances cooperation projects as a contribution to the economic, social, environmental and cultural development of the Mediterrane-an region. The following 14 countries participate in the Programme: Cyprus, Egypt, France, Greece, Israel, Italy, Jordan, Lebanon, Malta, Palestine, Portugal, Spain, Syria (participation currently suspended), Tunisia. The Joint Managing Authority (JMA) is the Autonomous Re-gion of Sardinia (Italy). Official Programme languages are Arabic, En-glish and French (www.enpicbcmed.eu).
General statement on the European UnionEuropean Union is made up of 28 Member States who have decided to gradually link together their know-how, resources and destinies. Together, during a period of enlargement of 50 years, they have built a zone of stability, democracy and sustainable development whilst maintaining cultural diversity, tolerance and individual freedoms. The European Union is committed to sharing its achievements and its values with countries and peoples beyond its borders.

1. Preliminary analysis
on electricity production and use
8
FosterinMED gathers different regions from Mediterranean basin. Each of them has a specific energy background. Some countries are fossil fuels exporter, while other ones are completely depending from abroad. The integration of photovoltaic technology in buildings assumes diffe-rent roles in the different scenarios. The project has carried out a prelimi-nary analysis on electricity production and diffusion by source and use.The main stakeholders of this analysis are decision makers that can af-fect the adoption of BIPV by suitable policies.
1.1 Electricity production. Local fossil fuels and energy import/export
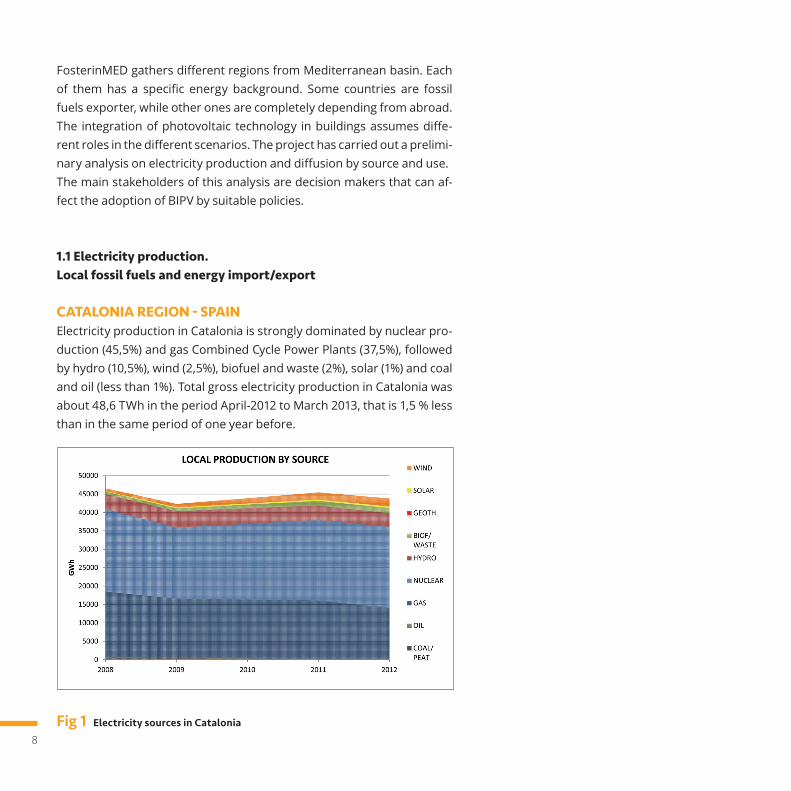
CATALONIA REGION - SPAINElectricity production in Catalonia is strongly dominated by nuclear pro-duction (45,5%) and gas Combined Cycle Power Plants (37,5%), followed by hydro (10,5%), wind (2,5%), biofuel and waste (2%), solar (1%) and coal and oil (less than 1%). Total gross electricity production in Catalonia was about 48,6 TWh in the period April-2012 to March 2013, that is 1,5 % less than in the same period of one year before.
Fig 1 Electricity sources in Catalonia
9
Catalonia is a net electricity importer with approx. 6000 GWh/year co-ming from rest of Spain or France. On average Catalonia imported the 17% of electricity from the rest of Spain and France in the period 2008-09. The importation of primary electrical sources is about the 98% in the same period. The main sup-plier country is Algeria for gas, but also Nigeria, Qatar and Trinidad y Tobago are involved. There are 3 Nuclear Power Plants under operation in Catalonia, with a total power output of 3150 MW. Several CCPP have been connected to the grid in the last 10 years, being the current total power installed of 4400 MW. Both, nuclear and gas CCPP, as well as hydro >50 MW (2000 MW total installed) are included in the ordinary electricity production system in Spain, all of them owned by Spanish big energy production and/or distribution companies (Endesa, Iberdrola, Gas Natural, etc). Cogeneration and renewable energy power plants are included in the especial electricity production system and accounts for approx. 3000 MW, being cogeneration the most representative within this group (1000 MW approx.). Among renewable energies, wind is the most re-levant (900 MW) followed by mini hydro (300 MW of plants < 50 MW each) and PV (200 MW). In most cases, these plants are owned by small independent power producers.The main weakness in electricity production is that Catalonia has a strong dependence on foreign primary energy like natural gas and nu-clear fuel that comes from abroad. The dependence rate has been in-creasing year after year and it seems that this tendency will not change in the near future. Uncertainties about real life span of nuclear power plants and geopolitical situation of some of the source countries whe-re primary energy comes from shows the need to adopt policies to reduce this external dependency.The main strength is that In the last two decades, high efficiency and/or renewable means of energy production have been gaining relevan-ce in the Catalan mix of electricity production. This is the case of coge-neration, CCPP, wind and solar. At the same time some old and highly pollutant power plants using coal and fuel oil have ceased its activity. However, it is still a long way for renewable energy in Catalonia before they become a relevant percentage of electricity production.
10
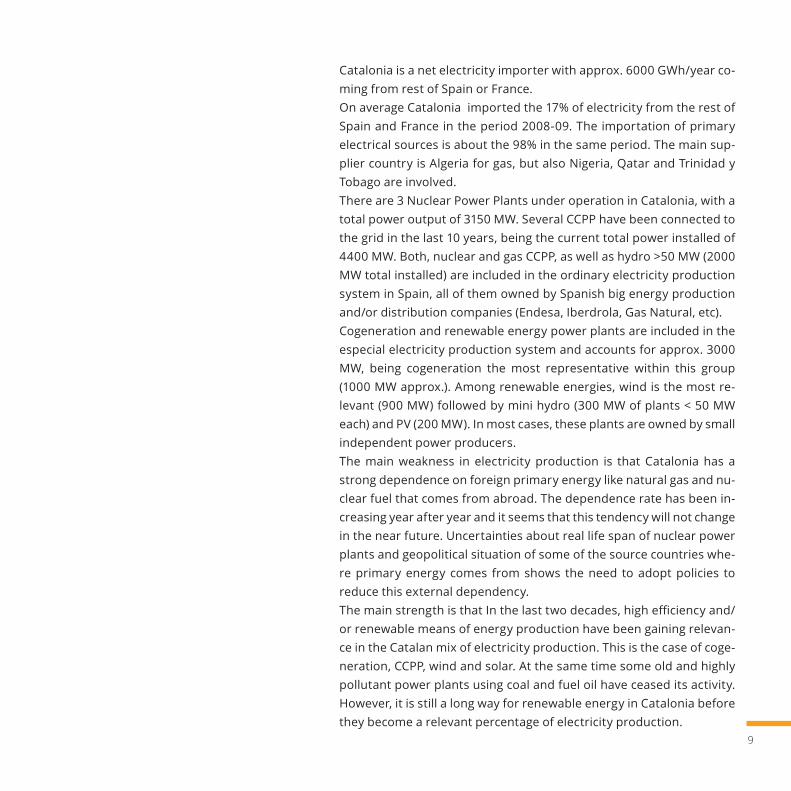
ALEXANDRIA REGION - EGYPTThe electricity generated as of 2011/2012 is 157 TWh with the peak load reaching 25705 MW. The total installed capacity is 29074 MW with ther-mal power plants making up 81% of the total installed capacity, hydro power plants making up 9,6% and renewable sources 2,4% . The private sector holds 7% of the installed capacity in Egypt. Egypt relies on indige-nous generation and not imports.The 88% of the electricity generated comes from thermal power plants, 9,63% from hydro power plants while renewable account only for 2,37% of the electricity generated. There are a total of six electricity production companies and about 46 power stations with more expected to operate in the coming years . The fuel consumption rate is 209 gm/kWh genera-ted. The 82,92% of the fuel consumed in production companies is natural gas, 16,8% use heavy fuel oil with light fuel oil accounting for 0,24% of the fuel consumed. The number of electricity users is 28,1 million and their per capita consumption is 1910 kWh. There are 34 isolated power plants mainly diesel and gas turbine units and one 5MW Wind farm in Hurgha-da installed in remote areas and connected to the distribution networks of their respective areas.
Fig 2 Electricity sources in Egypt
11
The total installed capacity is 29074 MW. Steam generation comprises a capacity of 12684 MW, combined cycle generation comprises a capacity of 10,077 MW, gas cycle generation capacity comprises 2826 MW, hydro generation capacity comprises 2800 MW and finally renewable capacity is 687 MW.The main weakness in electricity production is that Egypt is mostly fossil fuel –gas- dependent. Also, there is almost no renewable energy pro-duction with the break-down being as follows; 9,63% hydro, 1,89% wind and 0,48 % solar. However, the growth rate for RE power plants is not substantial and the hydro resources are fully utilised. Egypt has a high percentage of gas power plants that have a low efficiency. Moreover, the-re is limited marginal generation as compared to the peak load. Coal and nuclear plants are not yet considered.The main strength is that all generating stations are connected to a uni-fied grid and there are growing renewable energy resources.
LEBANONThe electricity production in Lebanon is monopolized by the state-ow-ned electricity company Electricité Du Liban (EDL). Power generation in Lebanon is provided by thermal and hydraulic power plants.
There are seven thermal power plants in the country with a total instal-led capacity of 2040 MW. These plants are currently producing 9630 GWh per year. These are: 1. Zouk: 607 MW installed capacity2. Zahrani: 450 MW installed capacity3. Jieh: 327 MW installed capacity4. Tyre (Sour): 72 MW installed capacity5. Baablbek: 64 MW installed capacity6. Deir Ammar: 450 MW installed capacity7. Al Hyrayche: 70 MW installed capacity
Thirteen small hydraulics power plants adds up 273 MW installed capa-city, with a current yearly production of 918 GWh (approximately 8,7%
12
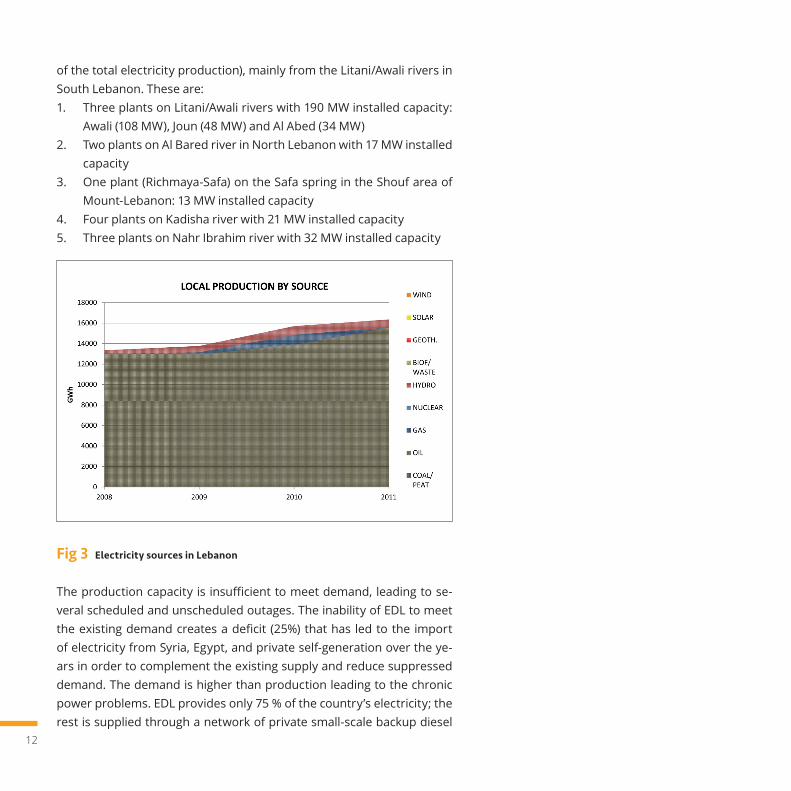
of the total electricity production), mainly from the Litani/Awali rivers in South Lebanon. These are: 1. Three plants on Litani/Awali rivers with 190 MW installed capacity:
Awali (108 MW), Joun (48 MW) and Al Abed (34 MW) 2. Two plants on Al Bared river in North Lebanon with 17 MW installed
capacity3. One plant (Richmaya-Safa) on the Safa spring in the Shouf area of
Mount-Lebanon: 13 MW installed capacity4. Four plants on Kadisha river with 21 MW installed capacity5. Three plants on Nahr Ibrahim river with 32 MW installed capacity
Fig 3 Electricity sources in Lebanon
The production capacity is insufficient to meet demand, leading to se-veral scheduled and unscheduled outages. The inability of EDL to meet the existing demand creates a deficit (25%) that has led to the import of electricity from Syria, Egypt, and private self-generation over the ye-ars in order to complement the existing supply and reduce suppressed demand. The demand is higher than production leading to the chronic power problems. EDL provides only 75 % of the country’s electricity; the rest is supplied through a network of private small-scale backup diesel

13
generators. These private generators are technically illegal and as such are not integrated into a wider regulated system. Most of the power plants are old and deteriorated. They require extensive rehabilitation upgrades or complete replacement of the installed units in order to op-timize the electricity production. And there’s a big lack in regular opera-tions and maintenance. This leads to high operational losses. There’s also a complication in fuel sourcing and electricity import due to political conflicts in surrounding countries. Finally, some thermal plants are located within the cities (i.e. Zouk), creating environmental and he-alth problems due to large amounts of particulate and gas emissions. The sector needs an immediate and complete reform to solve the many problems it is facing.In 2002, a law to restructure and regulate the sector was passed. It is known as “Law 462” or the electricity law. It was meant to replace the exi-sting legal structure that grants EDL the monopoly over the sector and allow the private sector to generate and distribute electricity. However, no action has been taken so far in that regard.
AQABA REGION - JORDANThe energy and electricity sector in the Hashemite Kingdom of Jordan relies on importing more than 97% of its total energy needs. Recent developments in the surrounding regions during the past and current years have put further challenges on the sector. Electricity production in the kingdom mainly relied on gas turbine generators. However, the decline in quantities of natural gas supplied from Egypt to Jordan since 2009 has led to a decrease in the proportion of electricity generated using natural gas from about (90%) in year 2009 to about (20%) in year 2012. This situation required running generating stations using heavy fuel oil and diesel to meet the demand of electric power (NEPCO, 2012). The country’s major generation facilities are the Aqaba Thermal Power Station in the far south, Al-Hussein Thermal Power Station in Zarka near Amman, and Al-Risha near the Iraqi border (Halasa, 2010). The Aqaba Thermal Power Station is the largest in Jordan. It has a total generation capacity of 656 MW, which consists of five steam turbine units (5 x 130 MW), and two hydraulic turbines (2 x 3 MW) (UNFCCC,
14
2006). The power station used to be fuelled by the natural gas supplied through pipelines from Egypt but it is now mostly fuelled by fuel oil (Halasa, 2010).Al Hussein thermal power station, one of the oldest Generating station in Jordan, has a combined generating capacity of 396 MW from 7 con-ventional thermal steam turbine generating units burning heavy fuel oil and diesel (CEGCO, 2014). It is the most expensive because it uses imported oil and also uses air-cooling systems, that consume a quite large amount of energy, to cool the turbines (Halasa, 2010).There are several small units scattered in different districts over the kingdom, such as Marka, Rehab, Karak and other power stations (CE-GCO, 2012). These units are used during peak demands (Halasa, 2010). In regards to the utilizing of local resources for energy available in the kingdom; , Al-Risha power station (150MW) which is located in the ea-stern desert near the Iraqi border works on locally produced natural gas in producing electricity via gas operating turbines. Jordan has mo-dest reserves of natural gas, of 230 billion cubic feet, and has develo-ped one gas field at Al-Risha subordinate to the National Petroleum Company (Halasa, 2010).Hofa and Ibrahimia power stations exploit wind energy to generate ap-proximately 1.5 MW of electrical power (CEGCO, Total Installed Capaci-ty, 2014). Moreover, the largest facility of its kind in Jordan, a 1MWp solar pho-tovoltaic (“PV”) plant was recently completed. The solar PV plant is lo-cated within the Residential Community adjacent to the King Hussein University, one of the clusters of the Ma’an Development Area. The PV plant is expected to generate approximately 2 000MWh of electricity annually, to meet 100% of the student dormitory’s power consump-tion, turning the Residential Community into Jordan’s first zero-energy dormitory and an excellent showcase for PV technology within the kin-gdom. The Ma’an Development Area is considered a solar hub in Jordan with plans to build over 100MW of PV systems by 2015 through solar purchase agreements (PhoenixSolar, 2014).

15
Fig 4 Electricity sources in Jordan (NEPCO, 2012)
The predominant weakness in electricity production in the country lies within the fact that it relies, almost completely, on imported oil from nei-ghbouring countries, which causes a financial burden on the national economy (Halaby & Stephen, 2013). As mentioned previously, the majo-rity of the turbines in the generating stations were fueled by natural gas as we had an old agreement with the Egyptian government on a suitable price for gas imports. However, the discontinuation of the Egyptian gas pushed Jordan to use expensive, heavy fuels and diesel to cover the electricity demand.Due to the country’s dependence on subsidized and low cost natural gas imported from Egypt, Jordan’s government had failed, until 2011, to ini-tiate any meaningful progress in renewable energy field.Today, Jordan finds itself in a very precarious economic situation, given that discounted Egyptian gas supply will not resume at the required quantities and that any resumption is uncertain at best conditions. The increasing cost of power generation as reported by the government, provoked the urgency for renewable energy power generation to spread over the kingdom (Halaby & Stephen, 2013).With the prospects of gas-based power generation, whether from im-
16
ported LNG (Liquefied Natural Gas) or from local supply of natural gas in the Risheh field, the burden of committing to a 25 year RE (renewable energy) power purchase agreement (PPA) seems intimidating, yet neces-sary. The main strengths in electricity production in Jordan are, first of all, the continuous monitoring from the government for the electricity demands in the whole country in order to determine whether we need more generating stations to embrace these demands or not. Following that, the elasticity of governmental rules for giving a link to the huge pri-vate international companies to invest and construct generating stations in different parts of Jordan and to supply the electrical network.The second strength point is the notable increase in the spread of grid-connected solar PV generation installations after the liberation of the Renewable Energy and Efficiency Law (REEL) by the parliament in 2011 and the subsequent bylaws issued by the Electricity Regulatory Commission in early 2012. These bylaws are aimed at facilitating the development and maturation of both distributed and utility-scale Re-newable Energy projects and their interconnection to the national grid. Jordan is expected to highly increase its dependence on solar PV gene-ration systems as the country is considered one of the Sunbelt countries possessing high solar irradiation along the horizontal surface.
TUNISI REGION - TUNISIAThe total installed capacity in Tunisia amounted to 3 995 MW at the end of 2011 against 2 813 in 2001. The capacity of power plants installed by STEG (public company) is about 3 521 MW: it has evolved with 118 MW per year during the 2001-2011 period. Its share in the total gross installed capacity in Tunisia was 88,2% in 2011.The other capacity goes especially to an independent power plant (Car-thage Power Company) with a capacity of 471 MW. The Plants of STEG are composed from combined cycle plants (780 MW) and gas turbines with an installed capacity that has almost doubled in the last ten years: from 813 MW in 2001 to 1 533 MW in 2011.At the end of 2011, the installed capacity of renewable energy power is about 121 MW: a wind farm of 55 MW in the region of Haouaria (North East) and some hydropower plants that totalize a capacity of 66,1 MW.
17
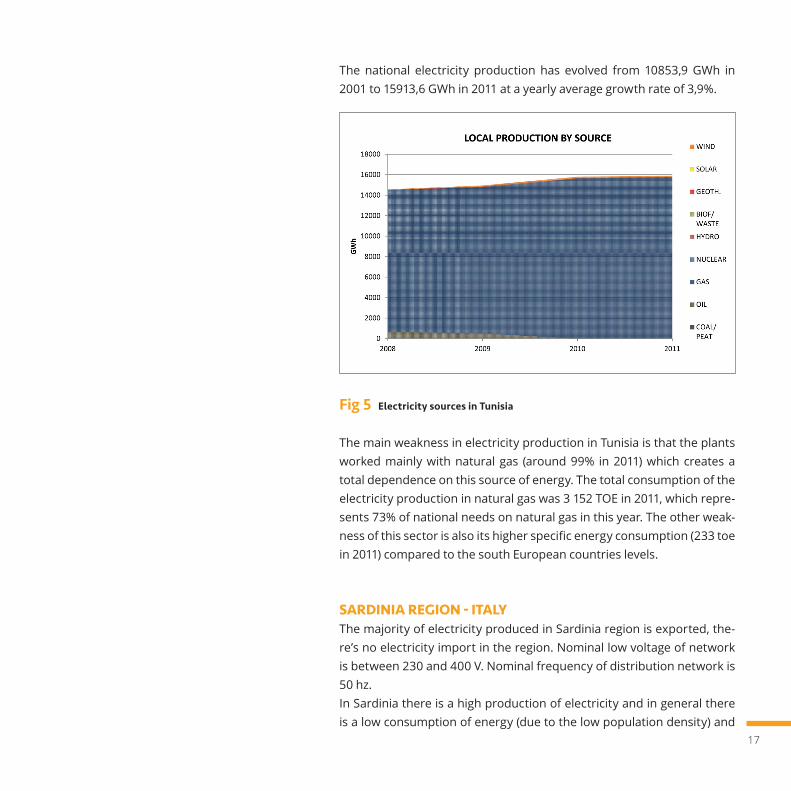
The national electricity production has evolved from 10853,9 GWh in 2001 to 15913,6 GWh in 2011 at a yearly average growth rate of 3,9%.
Fig 5 Electricity sources in Tunisia
The main weakness in electricity production in Tunisia is that the plants worked mainly with natural gas (around 99% in 2011) which creates a total dependence on this source of energy. The total consumption of the electricity production in natural gas was 3 152 TOE in 2011, which repre-sents 73% of national needs on natural gas in this year. The other weak-ness of this sector is also its higher specific energy consumption (233 toe in 2011) compared to the south European countries levels.
SARDINIA REGION - ITALYThe majority of electricity produced in Sardinia region is exported, the-re’s no electricity import in the region. Nominal low voltage of network is between 230 and 400 V. Nominal frequency of distribution network is 50 hz. In Sardinia there is a high production of electricity and in general there is a low consumption of energy (due to the low population density) and
18
an over production of energy that cannot be exported sufficiently due to the bad functioning of the network.Main strength of the region is a high production of energy from re-newable sources and the high potential for electricity export.
1.2 Local electric grid status
CATALONIA REGION - SPAINCatalonia’s main electrical consumer areas are Barcelona Metropolitan Region, the petrochemical complex of Tarragona (150 km south from Barcelona) and the touristic areas of Costa Brava and Costa Daurada due to peak population during summer. Electricity generation facilities are much more distributed than demand. However, location of the main power plants can be explained as follows: Three Nuclear Power Plants are located in Tarragona province, some 50 – 80 km south from the petrochemical complex; CCPP are located mainly following the coast line, between Tarragona and Barcelona, and main hydro power plants are located in the North West, in the Pyrenees area where dams where constructed during the first decades of 20th Century. As a result, Catalonia electricity transport grid is organized in two main paths: one connecting the Tarragona generation area with metropolitan area of Tarragona and Barcelona, and the other connecting the North West (Pyrenees) with metropolitan area of Barcelona. Catalonia is also connected with the rest of Spain and France by means of 400 kV transport lines. This transport grid operates at nominal voltages of 400 or 220 kV. Tran-sport lines feed substations with step down transformers that convert electricity to 25 kV, which is the nominal distribution voltage level in Cata-lonia. Electricity is then distributed locally at this voltage level and finally transformed to low voltage level (220 V) to feed final consumers. The grid percentage of coverage is quite high (99%) both by territory and population. The energy cuts are estimated about 1 hour per year, thus negligible. The peak hours during winter are in the evening, while during summer in the afternoon. This is mainly due to the use of summer air conditioning system. During the year the peak month are still the col-
19
dest. The main weakness of electrical is grid is the age of some electrical infrastructures of transport and distribution that have become obsolete and undersized according to current demand which is much higher than some decades ago, when these infrastructures were designed. The lack of investment in maintenance and update of the grid have be-come critical in some areas that have experienced several power cuts in the last few years, especially in the North of Barcelona (Costa Brava), due to unexpected meteorological phenomenon’s (snow, severe wind, etc.) or simply due to seasonal peak demand during summers.Except for those critical areas where transport and/or distribution grids need to be improved, the rest of territory has a reasonable good quality of service, with distribution grid in a mesh configuration so as to ensure that one substation is fed from two different points, allowing the mana-gement of the local grid in case of failure without affecting the service to population and industry. A new 400 kV line is under construction between Catalonia and France. This new connection will add redundancy and improve capacity of the current electrical system in Catalonia.
ALEXANDRIA REGION - EGYPTThe distribution company is responsible for distribution and selling to customers on medium and low voltage electric power purchased from the Egyptian electricity transmission company and from the Egyptian electricity production companies on medium voltage, and also electric power purchased from industrial and other IPP̀ s exceeding their needs, provided that the approval of EEHC Board is obtained. The total length of transmission cables and lines is 43 634 km and the total power transformer capacity is 91 865 MVA. As for distribution, the total length of MV and LV lines and cables is 405 199 km and the total capacity for the MV&LV distribution transformers is 59 958 MVA.There are nine distribution companies all over Egypt.The main strength is the high electrification rate where there is electri-city access to more than 99% of the population. The main weakness is that the network is radial in a number of regions – mostly rural and the distribution is under capacity in some parts.
20
LEBANONLebanon is a predominantly urban and highly electrified state with ac-cessibility to electricity reaching more than 99% of the population. The distribution of electricity in Lebanon is monopolized by EDL. Two cate-gories of High Tension power lines are used: overhead power lines and underground cables. The total length of both categories of power lines is around 1 615 km.
The overhead power lines are divided into three types of transmission lines according to the voltage value. The total length of lines is 1 336 km divided into:- 290 km for 220 kV- 292 km for 150 kV- 754 km for 66 kV
The underground cables are also divided into three types according to the voltage. The total length of lines is 279 km divided into:- 60 km for 220 kV- 39 km for 150 kV- 180 km for 66 kV
The sector is suffering from high technical losses with an average of 15%, while non technical losses amount to a further 17,8% of the electri-city produced. These high losses are attributed to the lack of rehabili-tation of the power lines and the inadequacy in the number of substa-tions which are used to regulate the voltage across the system.
Peak demand has been growing in the last decade to reach 2 500 MW in 2009. It is expected to continue its growth with a yearly average of 5%.
A recent policy by the Ministry of Energy for the distribution sector has been developed to implement a transitional program with the par-ticipation of the private sector on the basis of the existing legal fra-mework. It aims at investing in planning, constructing, operating and maintaining the distribution activities including metering, billing and collection based on modern and smart systems.
21
Many weaknesses can be highlighted. These are summarized as follows:- The presence of many old rusty steel poles used for the distribution- Incompletion of the 220 kV transmission networks- Illegal connections on the grid- Presence of bottle necks on distribution systems- Absence of electronic accounting programs to organize the flow and
reduce losses- Lack of periodic maintenance operations
It is worth mentioning here the recent effort taken by EDL to reduce non-technical losses by regaining control over its operations and by ad-dressing more efficiently billing and collection weaknesses.
AQABA REGION - JORDANThe electricity network in Jordan divided into three main sectors:
Generation SectorThis sector is responsible for electricity generation from power plants and providing it to Transmission Grid, it includes the following com-panies:
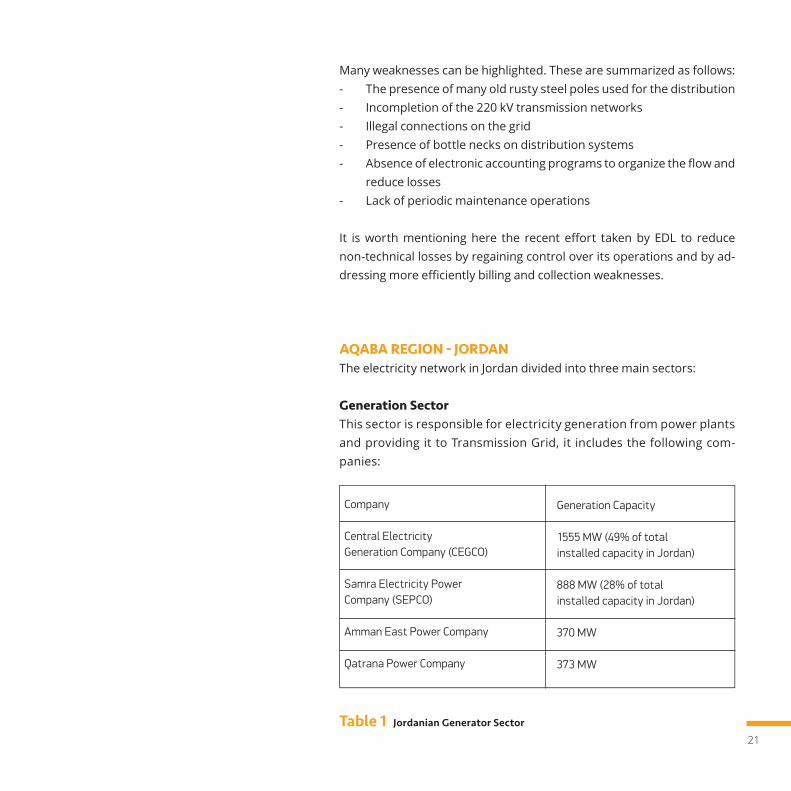
Table 1 Jordanian Generator Sector
1Company
Central Electricity Generation Company (CEGCO)
Samra Electricity Power Company (SEPCO)
Amman East Power Company
Qatrana Power Company
Generation Capacity
1555 MW (49% of totalinstalled capacity in Jordan)
888 MW (28% of totalinstalled capacity in Jordan)
370 MW
373 MW
22
The rapid growth in the demand for power every year meant large-scale investments were necessary to expand the number of power stations and the power grid.The installed capacity grew at a rapid growth rate to meet the demand and to provide sufficient reserve. Currently, the total installed power ge-nerating capacity in Jordan is about 3 366MW. The system’s peak load is about 2 770 MW. The production of electrical energy grew at an ave-rage growth rate of about 10% during the last 20 years where the total generated energy in the kingdom amounted to 14 647 GWh in 2011 (NE-PCO, 2012). The portfolio of generation in the country mainly includes fuel oil-fired steam generating units, gas fired combustion turbines, die-sel-fired combustion turbines and diesel engines. These units generate electric power at 13,2kV, and then this voltage is converted to 132kV via step-up transformers. Some wind generators in the country provide the HV voltages (33 KV) directly.
Transmission Sector This sector includes only National Electric Power Company (NEPCO), whi-ch is 100% state owned. NEPCO operates the bulk power network in Jordan, which is composed principally of 400 and 132 kV circuits. The transmission system is axially structured on the north-south axis of Jordan. It is essentially a radial sy-stem with no looping except for a small ring around the main load centre of Amman. It serves both the distribution network and the direct service bulk customers at 132 kV. In terms of dimensions and proportions, 77% of the total networks are currently operated at 132 kV covered via about 3200 circuit-km of tran-smission lines. The rest are operated at 400 kV by means of 904 circu-it-km of transmission lines (NEPCO, 2012). NEPCO also operates the main substations to provide services to the va-rious distribution networks, which have an aggregate capacity of about 10303 MVA (NEPCO, 2012).
Distribution SectorThis sector’s electricity supply is taken from the National Electric Power Company’s network at 33 kV and reduced to 11 kV or 6,6 kV through a
23
network of main substations. Distribution substations further reduce the electricity supply to levels that meet the customers’ home or busi-ness requirements. The customers are supplied with a single phase or with three phases of electrical power depending on their demands.This sector is responsible for distributing electricity to final consumers categorized into Households, Commercial and Industrial and it includes the following companies:
• Jordan Electric Power Company (JEPCO) which distributes electri-city in the central part of Jordan. JEPCO operates a network that serves about 3 million people across 5000 square kilometres. The network is made up of more than 5600 main and distribution sub-stations bounded together by 19 000 kilometres of underground and overhead lines. The concession area of the company consists of five districts (JEPCO, 2011); JEPCO is responsible for the transfer and distribution of electrical power in a region extending from Wadi Al-Dleil in the North to Theiban in the south and from the Mowagar in the East to the Thresholds of the Jordan Valley (Al-Aghwar) in the west (ERC, 2013).
• Irbid District Distribution Company (IDECO) which distributes electricity in the northern part of Jordan. The concession area of the company includes the governorates of Mafraq, Irbid, Jerash, Ajloun, and some parts of the Balqa governorate. It covers an area of about 23,000 square kilometers which embodies about (25,6%) of the Kin-gdom’s geographical area (ERC, 2013).
• Electricity Distribution Company (EDCO) which distributes electrici-ty in the southern part of Jordan.
The company’s concession covers wide, highly populated areas, which amount to (77%) of the kingdom’s size. EDCO reached (95%) in electric power sales, (48%) in the electric networks lengths, and (42%) in the number of consumer relative to the whole country. Currently, all distri-bution companies are owned by the private sector. In addition, the Jordanian Power System is interconnected with the
24
Egyptian Power System through a 13-km, 400- kV submarine cable with exchange capabilities of 550 MW crossing the Gulf of Aqaba in the southern part of Jordan. Furthermore, in the north Jordan is connected with the Syrian Power System through a 400- kV overhead single circuit transmission line of 58 km with exchange capabilities of 1 000 MW.In conclusion, the interconnected system in Jordan consists of the main generating power stations, 132 kV and 400 kV transmission network, this transmission network interconnects the power stations with the load centers and different areas in the kingdom. The system also includes 400 kV tie lines with Syria and Egypt and the distribution networks which serve about (99,9 %) of the total population in Jordan. Currently, the total system installed capacity is about 3 186 MW. The total length of 132 kV network and above is about (4121) km- circuit and the total installed capacity of the substations is (10 303) MVA (NEPCO, 2012).The principal weakness in the electrical distribution system is the cost of delivering electricity to establishments located far from the main distri-bution network in rural areas or in remote areas in the desert. In such cases, the customer is legally responsible for paying all of the required expenditures. Additionally, there is a minor issue where chaotic and messy distribution wires can sometimes be visibly clustered in develo-ping areas. This can be fixed with some tiding and pre-planning of the distribution system layout of the consumer voltage level.
TUNISI REGION - TUNISIAThe transport network (HVB) electricity in Tunisia has a length of 5 950 km with a grew of more than 200 km per year in the last ten years.The electricity distribution network extends to 149 100 km at the end of 2011 with an increase of 3,9% per year. It’s composed from 51 700 km of medium voltage (HVA) lines and about 97 400 km of low voltage (LV) lines. The number of substations HVA / LV STEG has reached 62 127 in 2011. The transited by the HVB / HVA power stations (80 stations) has increased at a rate of 5% per year (14 866,7 GWh in 2011).The number of connections to the network Low Voltage was 3 283 000 at the end of 2011 (annual growth rate of 4%). The number of customers HV is 20 against 16 488 connected to the medium voltage.
25
However, the main weakness of the in electricity distribution are:• The higher level of losses of the electricity transmission and
distribution totalled 2185 GWh in 2011, equivalent to a rate of 14,3% which.
• The limits of the network interconnections and the electrici-ty exchange with neighbours countries. With Algeria there are 5 electric lines of interconnection 90 kV and 225 Tajerouine – Aoui-net, 90 kV Fernana – El Kaala, 150 kV Metlaoui – J.Onk and 400 kV Jendouba – Chafia (end 2013) with zero balance of trade (2010 - 19 GWh; 2011 + 16 GWh). With Libya there are 3 electric lines of inte-connection; 2 electric lines 225 kV Mednine- Aboukmmech and 1 Ligne 225 kV Tataouine – Rowies; All of them are not yet fully opera-tional.
SARDINIA REGION - ITALYRegional energy system is connected with national electric system through two submarine cables, the first named SAPEI (1000 MVA) and the second SACOI (300 MVA). The SAPEI cable (Sardinia-mainland) repre-sents the largest electricity infrastructure ever built in Italy, with 750 mil-lion euros invested. SAPEI’s numbers are record-breaking: its placement at 1640 meters below sea level is the deepest in the world, its 435 km in length make it the longest 1000 MW submarine cable in the world. with its double 500 kV DC submarine cable, SAPEI will provide 1000 megawatt of capacity.The HVDC Italy–Corsica–Sardinia is an HVDC interconnection used for the exchange of electric energy between the Italian mainland, Corsica and Sardinia. The scheme consists of three overhead line sections: one on the Italian mainland with a length of 22 kilometers, one on Corsica with a length of 156 kilometers and one on Sardinia with a length of 86 kilometers. The overhead line sections use twin conductors (each rated at 1000 Adc) connected in parallel. Each conductor has an aluminum con-ductor cross section of 628 mm² in Sardinia and Italy, and 755 mm² on Corsica. In addition to this, there are two submarine cable sections: 105 kilometers, between Italy and Corsica and 16 kilometers between Sardi-nia and Corsica.
26
The cables have conductor cross-sections of 1080 mm2 on land and 420 mm2 for the sea cables.Electric system is connected with interchange system named SARCO with Corsica electric system. Electric transmission structure is constitu-ted by only one high voltage backbone (380 kV) used for interconnecting the two main consumption and production poles of the island. It has been necessary to improve the transmission network due to the increa-se of RES production.The proliferation of production system distributed on the territory has impacted the distribution network, by creating major problems related to the quality of the service in case of further increases. It would be ne-cessary to improve the interconnections of power grid.As the Sardinia electric system is half-closed it could become an expe-rimental platform for the implementation of smart grid with the aim of improve energy performance of energy distribution.
1.3 Local appliances distribution
CATALONIA REGION - SPAINAll the households in Catalonia have at least one kind of electric applian-ces, whether “white goods” or “brown goods”. Among “white goods”, the fridge is the most common in the region (pre-sence of 99%), followed by washing machine (92,5%), microwave (90%) and electric oven (77%).Among “brown goods” TV is the most widespread appliance in the re-gion with almost 100% of the households, followed by DVD player (85%) and PC’s, present in near 70% of the region households considering both, desktop and laptop PC’s although the first ones are still more common. Actually, the average rate of “brown goods” per household is 6,9, being more than 2 if considering only TV.

27
Fig 6, Fig 7 Distribution of heating and DHW system in Catalonia.
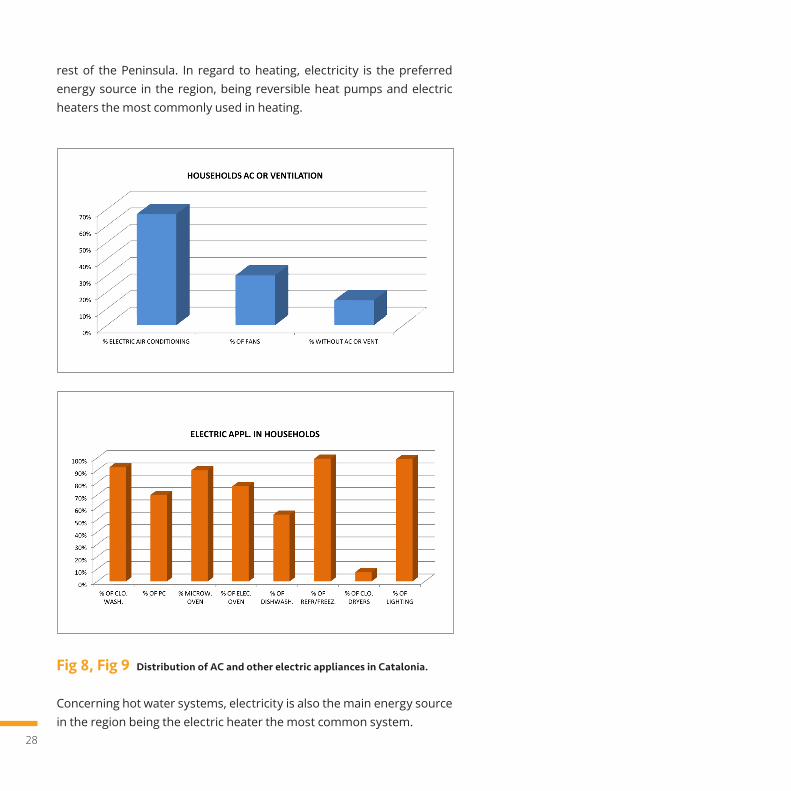
Concerning heaters, boilers and HVAC systems Catalonia (and Spanish Mediterranean area in general) has some differences with respect the
28
rest of the Peninsula. In regard to heating, electricity is the preferred energy source in the region, being reversible heat pumps and electric heaters the most commonly used in heating.
Fig 8, Fig 9 Distribution of AC and other electric appliances in Catalonia.
Concerning hot water systems, electricity is also the main energy source in the region being the electric heater the most common system.
29
However, the most significant difference between Catalonia (Spanish Mediterranean areas in general) and the rest of the Peninsula is the use of air conditioning systems, being the Mediterranean strip the most equipped region in the country. 67% of households have some kind of air conditioning system and, among them, 83% are equipped with rever-sible heat pump. Households average electrical consumption in the region is above the national average due to two main reasons: the rate of electrical applian-ces per household is higher than the national average and the presence of electrical air conditioning systems (in addition to high humidity that makes thermodynamic cycles to be more demanding in terms of power consumption) that is also much higher than anywhere else in Spain.The main weakness of current electric appliances distribution is the high rate in households as well as the dominant presence of HVAC systems in the region makes domestic economies much more exposed to negative effects due to a raise of electricity rates.However due to continuous growth of energy rates in the last years, pe-ople are becoming more conscious about the importance of buying effi-cient appliances in terms of energy consumption. Currently, 44% of households declare to be aware of the existence of high efficiency electrical appliances (label A, A+, A++). Among these hou-seholds, high efficiency fridges, washing machines and dishwashers are present in 50% of the cases. Moreover, low-energy bulbs are also increasing their presence in the re-gion households. Although still less used than common bulbs, the num-ber of low-energy bulbs in an average household in the region (7,6) is almost the same of conventional bulbs (8,0).
ALEXANDRIA REGION - EGYPTAll the households in Egypt have at least one kind of electric appliances, whether “white goods” or “brown goods”. Among “white goods”, the washing machine is the most common in the region (presence of 99%), followed by the fridge or freezer (93%), fans/vents (93%) and water heaters (47%).
30
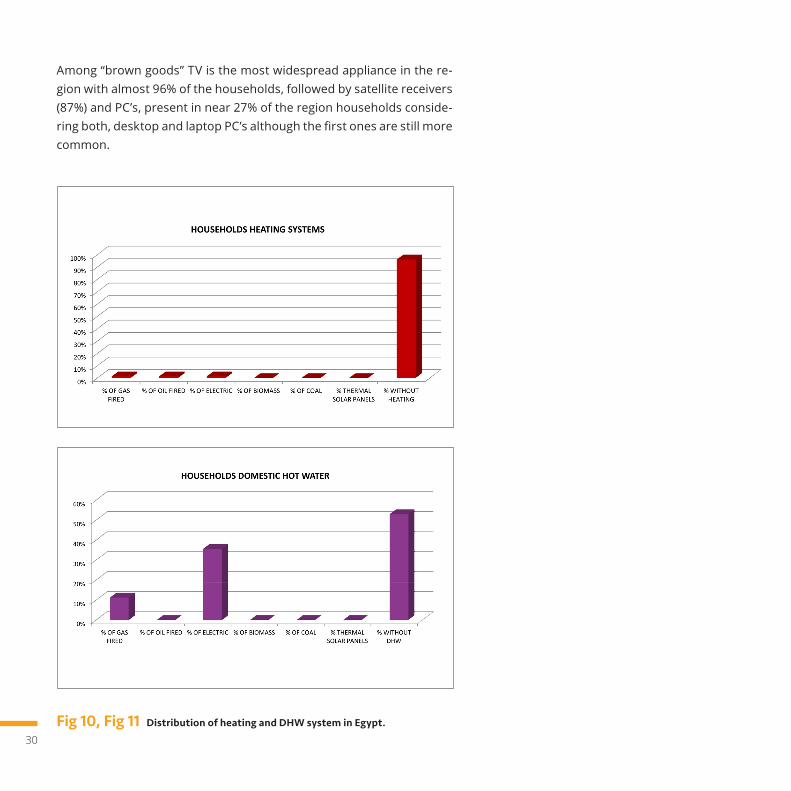
Among “brown goods” TV is the most widespread appliance in the re-gion with almost 96% of the households, followed by satellite receivers (87%) and PC’s, present in near 27% of the region households conside-ring both, desktop and laptop PC’s although the first ones are still more common.
Fig 10, Fig 11 Distribution of heating and DHW system in Egypt.
31
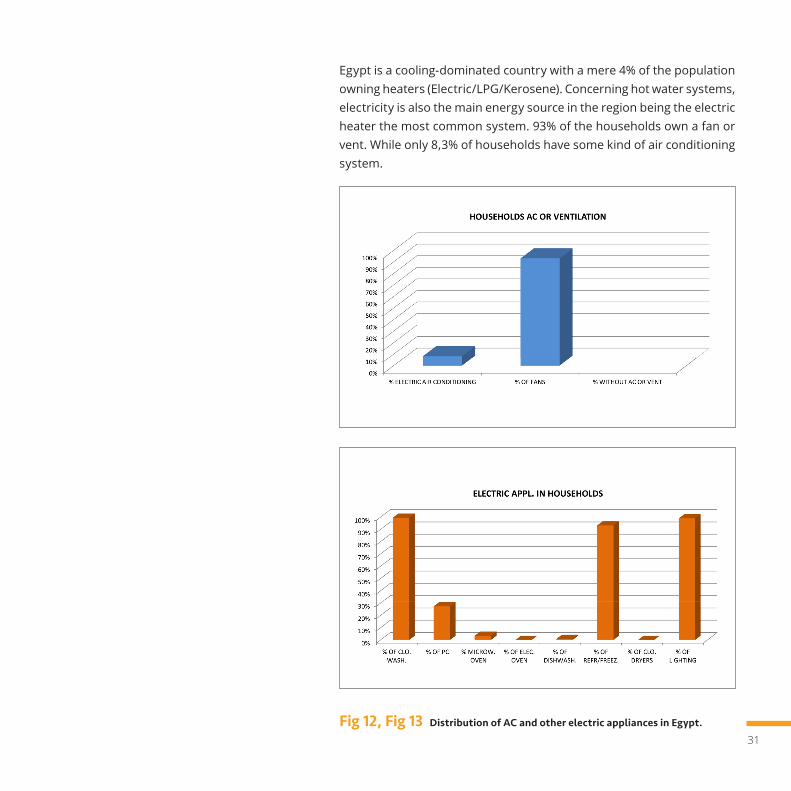
Egypt is a cooling-dominated country with a mere 4% of the population owning heaters (Electric/LPG/Kerosene). Concerning hot water systems, electricity is also the main energy source in the region being the electric heater the most common system. 93% of the households own a fan or vent. While only 8,3% of households have some kind of air conditioning system.
Fig 12, Fig 13 Distribution of AC and other electric appliances in Egypt.

32
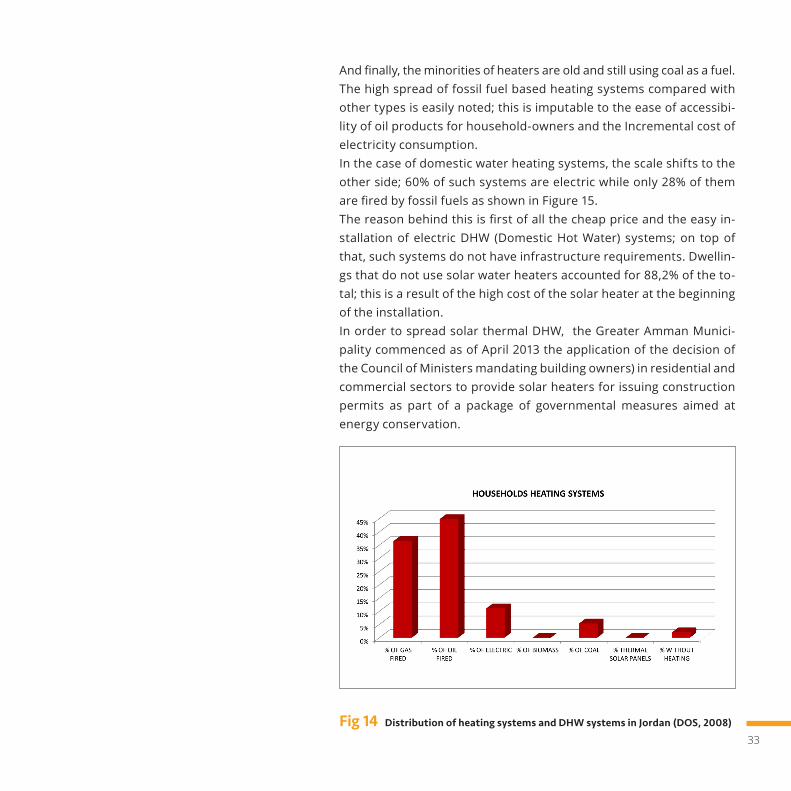
AQABA REGION - JORDANFor a clear perspective of the significance of the residential sector, the MEMR annual report in 2012 (MEMR, 2012) proclaims that the percen-tage rate of households’ electrical consumption during 2008-2012 re-ached 43% of the total electrical energy consumption of the Kingdom.First of all, lighting loads are considered; the use of fluorescent lighting accounted for 88% of the total lighting devices use in local dwellings, followed by the normal bulb, which accounted for 7% and finally ener-gy-saving bulbs at a percentage of 5%. Notably, the lowest percentage goes to the use of energy-saving bulbs due to the high cost of this type of lighting. During the past few years, the National Strategy for Electrici-ty has focused on the use of devices and tools that save electric power through spreading awareness along with reducing the cost of purchase. Subsequently, this ratio must have increased since 2012 and still conti-nuously increasing. Households with a lighting daily usage rate of 6,5 hours in the summer accounted for 73,9% of the total local households, while the percentage was 65,8% in the winter.Regarding heating loads, the percentage of households using heating systems reached 97,7% of the total households in the Kingdom. Most lo-cal dwellings employ decentralized heating devices that mainly depend on oil and gas. The wide spread of heating devices in the country is logically justified by the easy access to different types of petroleum products (kerosene, die-sel and gas) in addition to the incremental cost of electricity consump-tion and the high cost of the infrastructure required for the installation of central heating systems. The percentage of central heating systems, including conventional radiator-based systems and modern floor-built-in systems, reaches around 9%. This number is considered minor when compared to the spread of decentralized petroleum-dependent heating devices. As illustrated in Figure 14, local heating systems mainly depend on oil and gas with percentages of 45% and 37% respectively. Electric heaters are not very popular in the kingdom with a distribution percentage of only 11%; they are used at a rate of 4,5 hours per day in households containing this type of heaters.
33
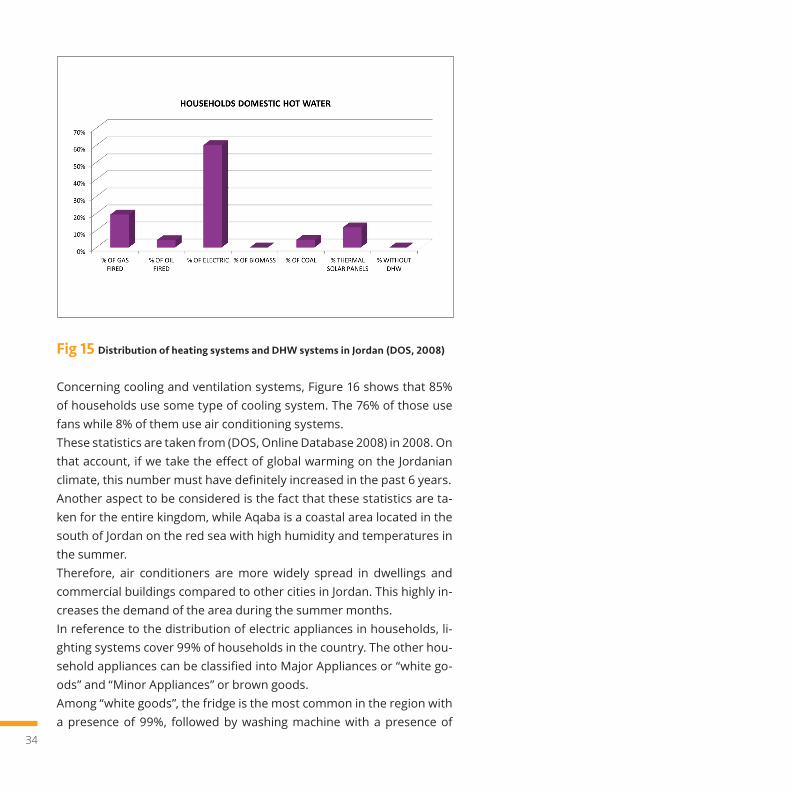
And finally, the minorities of heaters are old and still using coal as a fuel. The high spread of fossil fuel based heating systems compared with other types is easily noted; this is imputable to the ease of accessibi-lity of oil products for household-owners and the Incremental cost of electricity consumption.In the case of domestic water heating systems, the scale shifts to the other side; 60% of such systems are electric while only 28% of them are fired by fossil fuels as shown in Figure 15. The reason behind this is first of all the cheap price and the easy in-stallation of electric DHW (Domestic Hot Water) systems; on top of that, such systems do not have infrastructure requirements. Dwellin-gs that do not use solar water heaters accounted for 88,2% of the to-tal; this is a result of the high cost of the solar heater at the beginning of the installation. In order to spread solar thermal DHW, the Greater Amman Munici-pality commenced as of April 2013 the application of the decision of the Council of Ministers mandating building owners) in residential and commercial sectors to provide solar heaters for issuing construction permits as part of a package of governmental measures aimed at energy conservation.
Fig 14 Distribution of heating systems and DHW systems in Jordan (DOS, 2008)
34
Fig 15 Distribution of heating systems and DHW systems in Jordan (DOS, 2008)
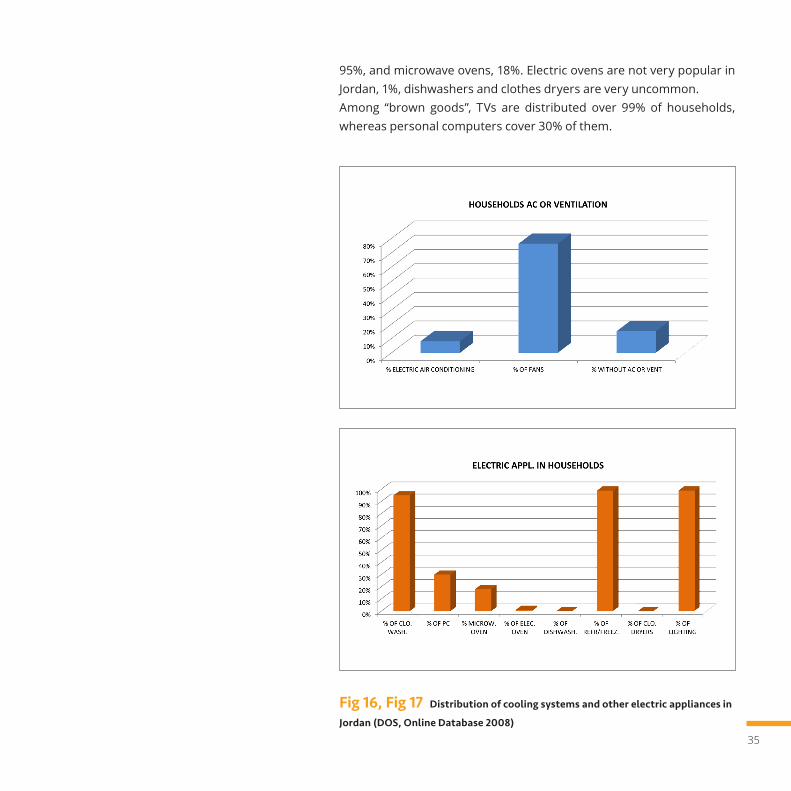
Concerning cooling and ventilation systems, Figure 16 shows that 85% of households use some type of cooling system. The 76% of those use fans while 8% of them use air conditioning systems. These statistics are taken from (DOS, Online Database 2008) in 2008. On that account, if we take the effect of global warming on the Jordanian climate, this number must have definitely increased in the past 6 years.Another aspect to be considered is the fact that these statistics are ta-ken for the entire kingdom, while Aqaba is a coastal area located in the south of Jordan on the red sea with high humidity and temperatures in the summer.Therefore, air conditioners are more widely spread in dwellings and commercial buildings compared to other cities in Jordan. This highly in-creases the demand of the area during the summer months.In reference to the distribution of electric appliances in households, li-ghting systems cover 99% of households in the country. The other hou-sehold appliances can be classified into Major Appliances or “white go-ods” and “Minor Appliances” or brown goods. Among “white goods”, the fridge is the most common in the region with a presence of 99%, followed by washing machine with a presence of
35
95%, and microwave ovens, 18%. Electric ovens are not very popular in Jordan, 1%, dishwashers and clothes dryers are very uncommon.Among “brown goods”, TVs are distributed over 99% of households, whereas personal computers cover 30% of them.
Fig 16, Fig 17 Distribution of cooling systems and other electric appliances in
Jordan (DOS, Online Database 2008)

36
The main weakness taking part in the increase of electricity consumption is the use of inefficient old technologies for daily practices.For instance, looking at lighting systems, fluorescent lights constitute 88% of lighting systems and conventional lamps constitute 7%, whereas energy-saving lamps constitute only 5% of the total. The same applies for the heating and air conditioning appliances which waste a large amount of energy when over-sized for smaller areas or when the using inefficient technologies. In addition to the inefficient operation of old technologies, by using an electrical device for long periods of time, its performance degrades and it starts wasting more and more energy.
Fig 18 Distribution of lighting systems in Jordan (DOS, Online Database 2008)
On the other hand, awareness campaigns have been and are still being held on the efficient use of electric appliances and on the importance of buying efficient appliances in terms of energy consumption. Further-more, a new energy efficiency labelling scheme has been launched 3 ye-ars ago in response to the government strategy and directives for 2020 aiming to reduce energy consumption and reduce its economic effects on the Kingdom. The project was also established to meet the urgent priorities and global trends for reducing emissions of greenhouse gases.
37
This project establishes a labelling system for energy efficiency and mini-mum specifications for the household appliances (refrigerators, washing machines, freezers, and air conditioners) used in Jordan, whether locally produced or imported. The labels provide a brief educational descrip-tion on the performance of the device (energy performance and cost of energy) in addition to the classification of the appliances based on their energy efficiency performance.
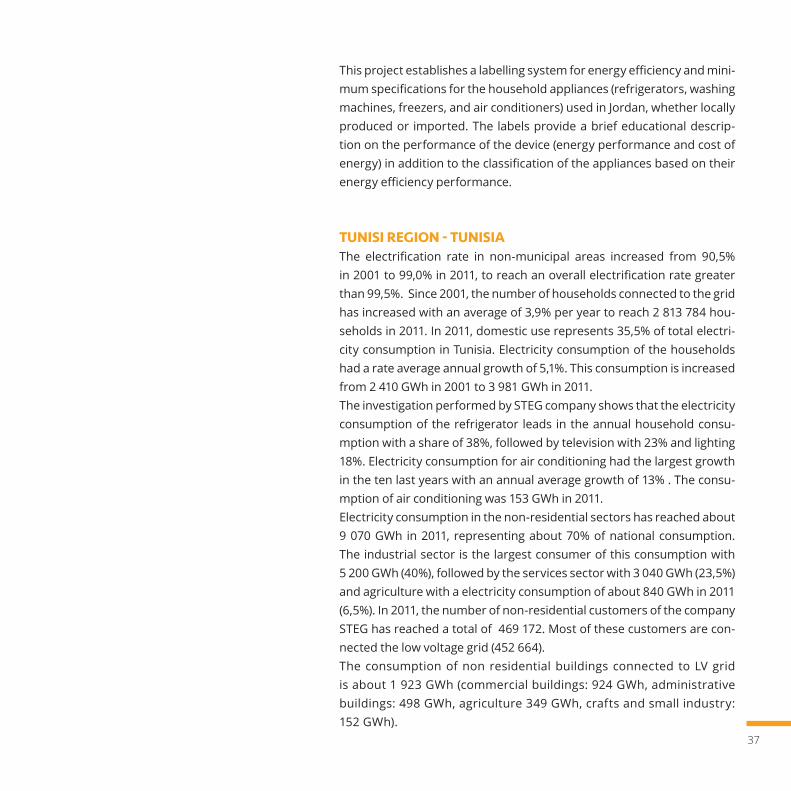
TUNISI REGION - TUNISIAThe electrification rate in non-municipal areas increased from 90,5% in 2001 to 99,0% in 2011, to reach an overall electrification rate greater than 99,5%. Since 2001, the number of households connected to the grid has increased with an average of 3,9% per year to reach 2 813 784 hou-seholds in 2011. In 2011, domestic use represents 35,5% of total electri-city consumption in Tunisia. Electricity consumption of the households had a rate average annual growth of 5,1%. This consumption is increased from 2 410 GWh in 2001 to 3 981 GWh in 2011.The investigation performed by STEG company shows that the electricity consumption of the refrigerator leads in the annual household consu-mption with a share of 38%, followed by television with 23% and lighting 18%. Electricity consumption for air conditioning had the largest growth in the ten last years with an annual average growth of 13% . The consu-mption of air conditioning was 153 GWh in 2011.Electricity consumption in the non-residential sectors has reached about 9 070 GWh in 2011, representing about 70% of national consumption. The industrial sector is the largest consumer of this consumption with 5 200 GWh (40%), followed by the services sector with 3 040 GWh (23,5%) and agriculture with a electricity consumption of about 840 GWh in 2011 (6,5%). In 2011, the number of non-residential customers of the company STEG has reached a total of 469 172. Most of these customers are con-nected the low voltage grid (452 664). The consumption of non residential buildings connected to LV grid is about 1 923 GWh (commercial buildings: 924 GWh, administrative buildings: 498 GWh, agriculture 349 GWh, crafts and small industry: 152 GWh).
38
The most important part of the power consumption of non-residential buildings is that of customers connected to medium voltage network. The electricity consumption of 16 488 buildings connected to the MV network reached 5 988 GWh in 2011. Approximately 56% of this consu-mption has affected the industrial sector (mainly the chemical, textile and food).However, Tunisian electricity sector suffers from the capacity problem at the peak consumption on the summer due to air conditioning. In fact the rate of the households equipped with air conditioning has evolved from 7% in 2005 to 14% in 2011.The information in the following figures are approximated and need to be confirmed by field surveys.
Fig 19 Distribution of heating and DHW system in Tunisia
39
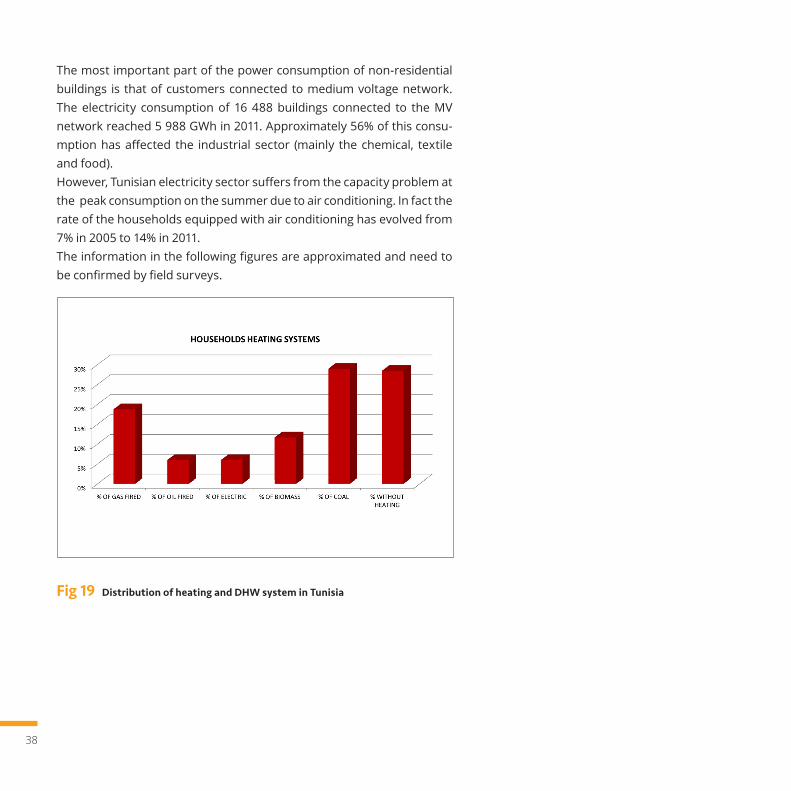
Fig 20 Distribution of heating and DHW system in Tunisia
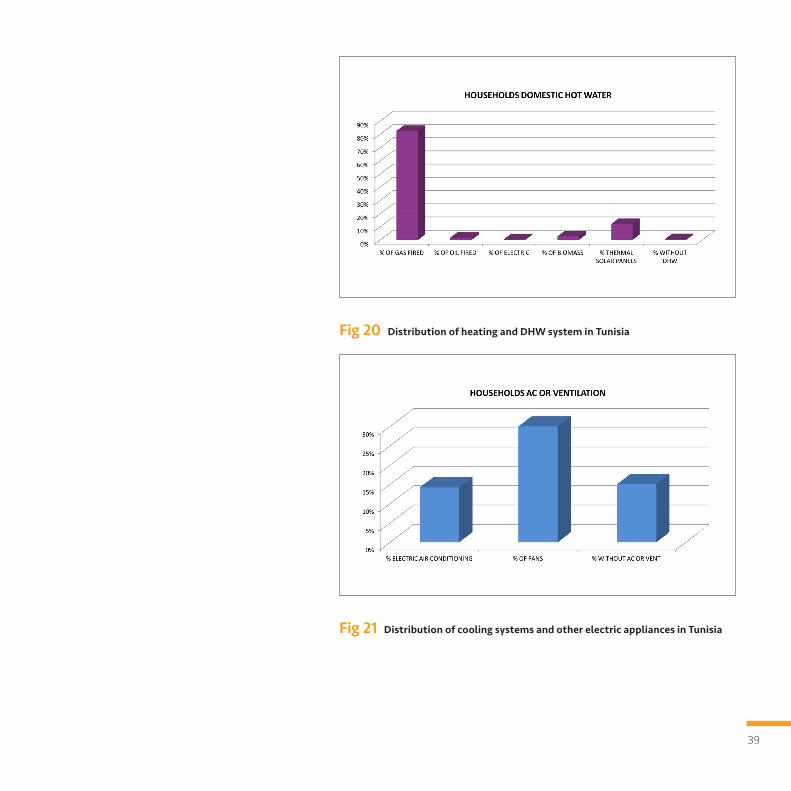
Fig 21 Distribution of cooling systems and other electric appliances in Tunisia
40
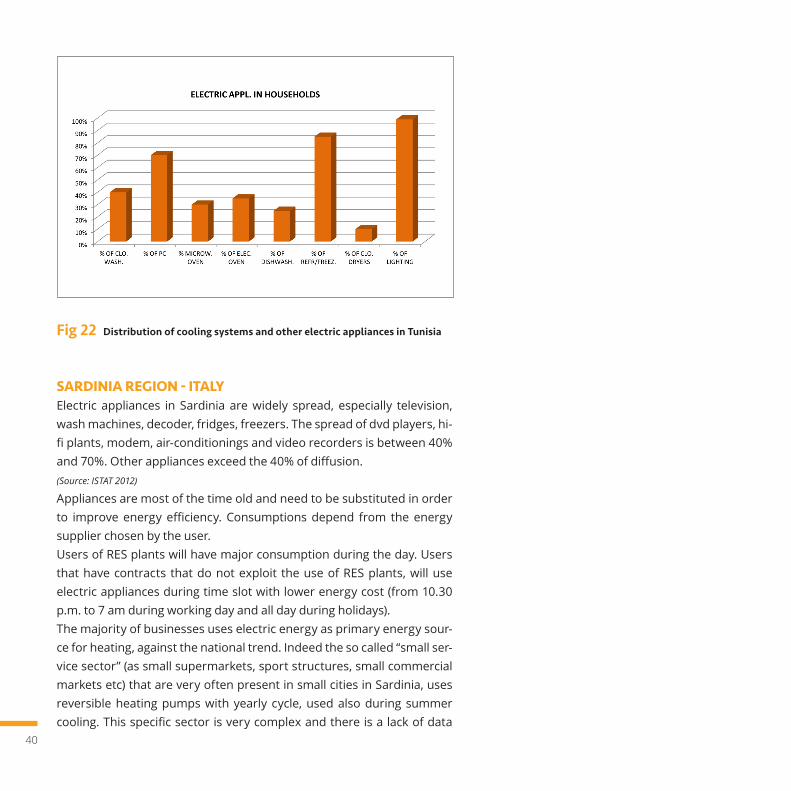
Fig 22 Distribution of cooling systems and other electric appliances in Tunisia
SARDINIA REGION - ITALYElectric appliances in Sardinia are widely spread, especially television, wash machines, decoder, fridges, freezers. The spread of dvd players, hi-fi plants, modem, air-conditionings and video recorders is between 40% and 70%. Other appliances exceed the 40% of diffusion.(Source: ISTAT 2012)
Appliances are most of the time old and need to be substituted in order to improve energy efficiency. Consumptions depend from the energy supplier chosen by the user. Users of RES plants will have major consumption during the day. Users that have contracts that do not exploit the use of RES plants, will use electric appliances during time slot with lower energy cost (from 10.30 p.m. to 7 am during working day and all day during holidays).The majority of businesses uses electric energy as primary energy sour-ce for heating, against the national trend. Indeed the so called “small ser-vice sector” (as small supermarkets, sport structures, small commercial markets etc) that are very often present in small cities in Sardinia, uses reversible heating pumps with yearly cycle, used also during summer cooling. This specific sector is very complex and there is a lack of data
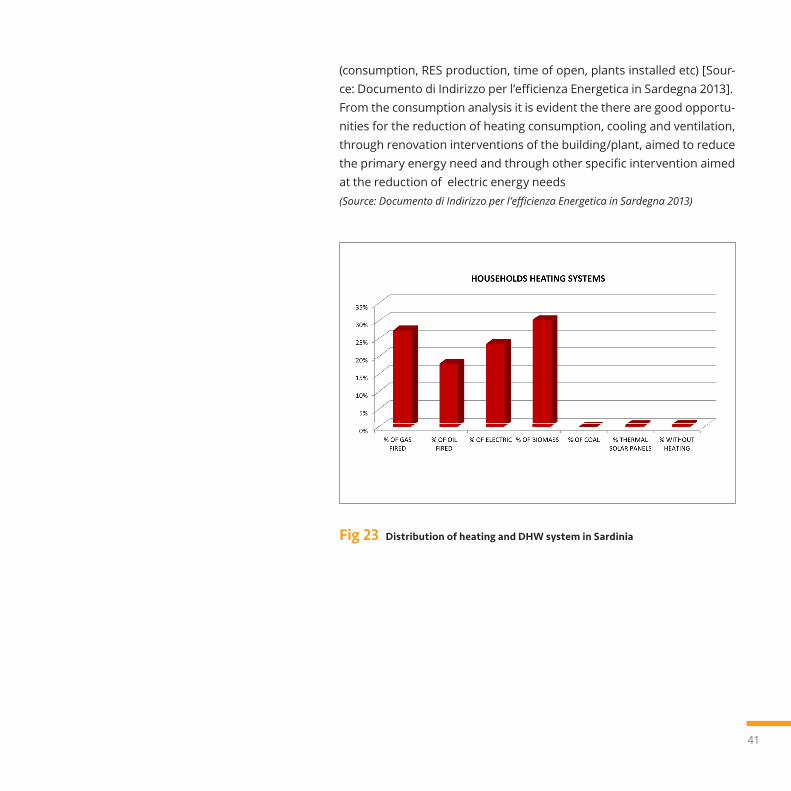
41
(consumption, RES production, time of open, plants installed etc) [Sour-ce: Documento di Indirizzo per l’efficienza Energetica in Sardegna 2013].From the consumption analysis it is evident the there are good opportu-nities for the reduction of heating consumption, cooling and ventilation, through renovation interventions of the building/plant, aimed to reduce the primary energy need and through other specific intervention aimed at the reduction of electric energy needs(Source: Documento di Indirizzo per l’efficienza Energetica in Sardegna 2013)
Fig 23 Distribution of heating and DHW system in Sardinia
42
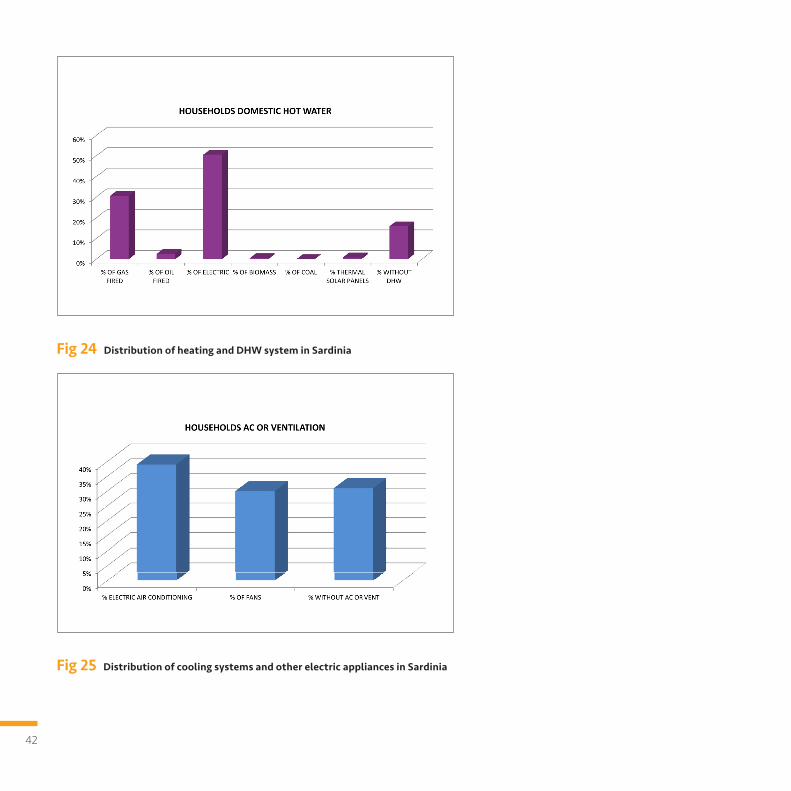
Fig 24 Distribution of heating and DHW system in Sardinia
Fig 25 Distribution of cooling systems and other electric appliances in Sardinia
43
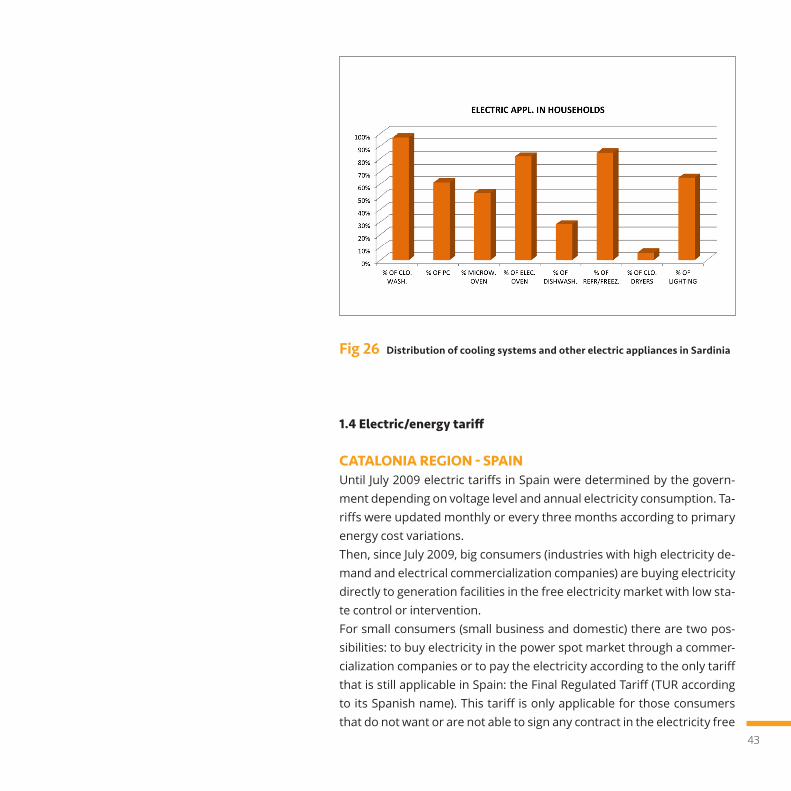
Fig 26 Distribution of cooling systems and other electric appliances in Sardinia
1.4 Electric/energy tariff
CATALONIA REGION - SPAINUntil July 2009 electric tariffs in Spain were determined by the govern-ment depending on voltage level and annual electricity consumption. Ta-riffs were updated monthly or every three months according to primary energy cost variations. Then, since July 2009, big consumers (industries with high electricity de-mand and electrical commercialization companies) are buying electricity directly to generation facilities in the free electricity market with low sta-te control or intervention. For small consumers (small business and domestic) there are two pos-sibilities: to buy electricity in the power spot market through a commer-cialization companies or to pay the electricity according to the only tariff that is still applicable in Spain: the Final Regulated Tariff (TUR according to its Spanish name). This tariff is only applicable for those consumers that do not want or are not able to sign any contract in the electricity free

44
market and have a contracted power less than 10 kW (Low Voltage), that is to say, almost all domestic consumers. The Final Regulated Tariff is intended to provide a reasonable cost of electricity for those people who are allowed to take it and don’t want to sign a contract with distribution companies. Current values for this tariff are as follows.
Table 2 Electricity tariffs in Catalonia
Although the aim of the free electricity market is to enhance price competition and improve quality of the service, the real life after a few years of implementation is that prices of electricity in Spain are in continuous growth due to various reasons: State is using tolls on the electricity consumption to introduce some taxes like nuclear morato-rium, renewable aids, cost due to generation in Spanish islands, etc. Advantages of being in the free market are that companies / indivi-duals are free to choose their own distribution companies and chan-ge if necessary after a period of one year of service regardless of the
1am - 7am
21,893189 €/kW/year
0,138658 €/kWh0,167658 €/kWh0,057190 €/kWh0,167658 €/kWh0,069460 €/kWh0,049695 €/kWh
P1P2P1
Winter1pm - 11pm12pm - 10pm
0am - 12pm10pm - 0am
0am - 1pm11pm - 0am
1pm - 11pm0am - 1am7am - 1pm
11pm - 0am
Summer
Winter and Summer
P2P3
Power factorPower factorEnergy factorOnly one period
P1P2
P1P2
P3
Two period
Three period
Two period time schedule
Three period time schedule

45
city / autonomy of the consumer. Final Regulated Tariff allows any consumer (in low voltage, up to 10 kW) to pay a reasonable price for electricity at a fixed rate (revisable) with no need to buy electricity in the free market. Moreover some discounts rates on these prices are also applicable for those people that are under specific conditions like unemploy-ment, retired, families of more than 4 individuals, etc.
ALEXANDRIA REGION - EGYPTTariffs are based on the service voltage level for EHV, HV and MV the price varies from one type of industry to the other and the cost is flat rate except for energy intensive industries, the price varies from peak to off-peak hours. The tariffs for the different end-users are set by the state. The resi-dential and commercial costs follow the increasing block rate to pro-mote energy efficiency. The residential electricity cost system has six tiers while the commercial has five tiers. End user tariffs reflect electricity subsidies.At the moment average electricity tariffs are below the cost of ser-vice. The current energy market is a state monopoly with the state controlling generation, distribution and transmission.
Table 3 Electricity tariffs for residential use in Alexandria region
Residential Tariff System (€/kWh)Block123456
From kWh1502003506501000
To kWh5020035065010001000+
Fee (€/kWh) 0,00550,01310,02080,03170,05800,0733
46
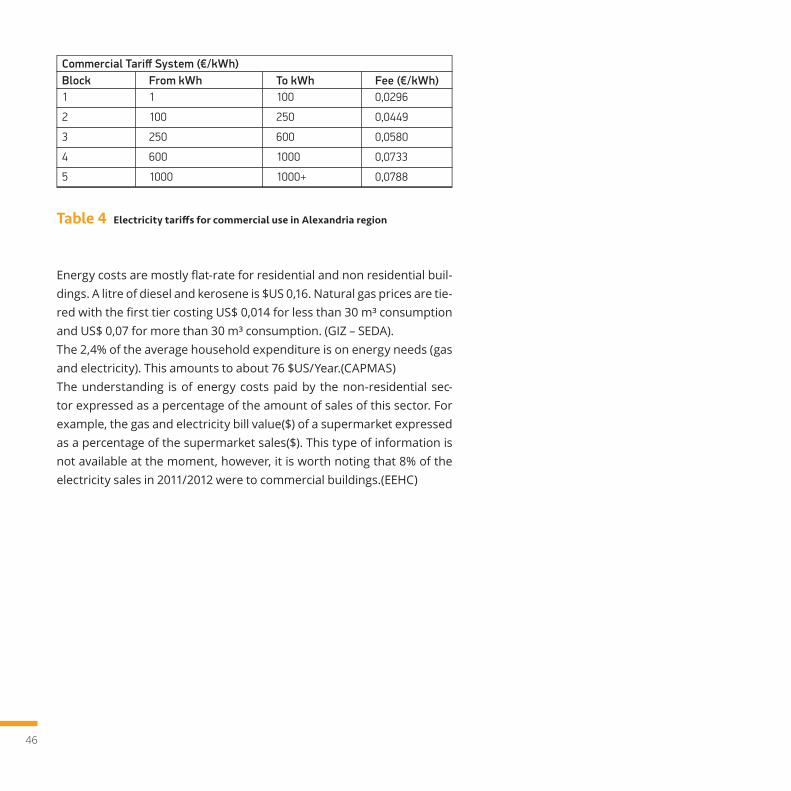
Table 4 Electricity tariffs for commercial use in Alexandria region
Energy costs are mostly flat-rate for residential and non residential buil-dings. A litre of diesel and kerosene is $US 0,16. Natural gas prices are tie-red with the first tier costing US$ 0,014 for less than 30 m³ consumption and US$ 0,07 for more than 30 m³ consumption. (GIZ – SEDA).The 2,4% of the average household expenditure is on energy needs (gas and electricity). This amounts to about 76 $US/Year.(CAPMAS)The understanding is of energy costs paid by the non-residential sec-tor expressed as a percentage of the amount of sales of this sector. For example, the gas and electricity bill value($) of a supermarket expressed as a percentage of the supermarket sales($). This type of information is not available at the moment, however, it is worth noting that 8% of the electricity sales in 2011/2012 were to commercial buildings.(EEHC)
Commercial Tariff System (€/kWh)Block1
2
3
4
5
From kWh1
100
250
600
1000
To kWh100
250
600
1000
1000+
Fee (€/kWh) 0,0296
0,0449
0,0580
0,0733
0,0788
47
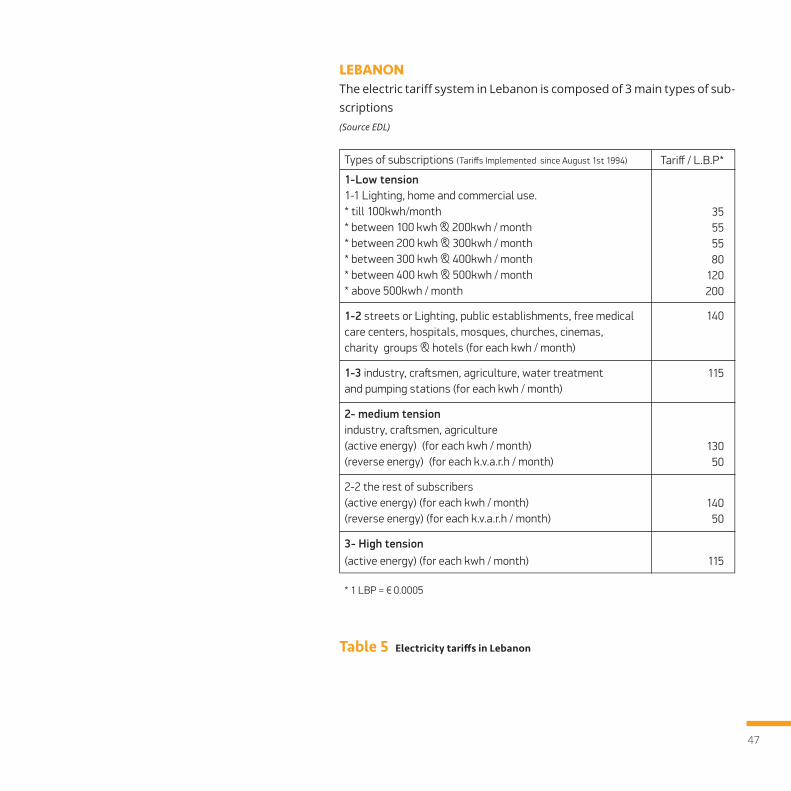
LEBANONThe electric tariff system in Lebanon is composed of 3 main types of sub-scriptions(Source EDL)
Table 5 Electricity tariffs in Lebanon
* 1 LBP = € 0.0005
Types of subscriptions (Tariffs Implemented since August 1st 1994)
1-Low tension1-1 Lighting, home and commercial use. * till 100kwh/month* between 100 kwh & 200kwh / month* between 200 kwh & 300kwh / month* between 300 kwh & 400kwh / month* between 400 kwh & 500kwh / month* above 500kwh / month
1-2 streets or Lighting, public establishments, free medical care centers, hospitals, mosques, churches, cinemas, charity groups & hotels (for each kwh / month)
1-3 industry, crastsmen, agriculture, water treatment and pumping stations (for each kwh / month)
2- medium tensionindustry, crastsmen, agriculture(active energy) (for each kwh / month)(reverse energy) (for each k.v.a.r.h / month)
2-2 the rest of subscribers(active energy) (for each kwh / month)(reverse energy) (for each k.v.a.r.h / month)
3- High tension(active energy) (for each kwh / month)
Tariff / L.B.P*
35555580
120200
140
115
13050
14050
115
48
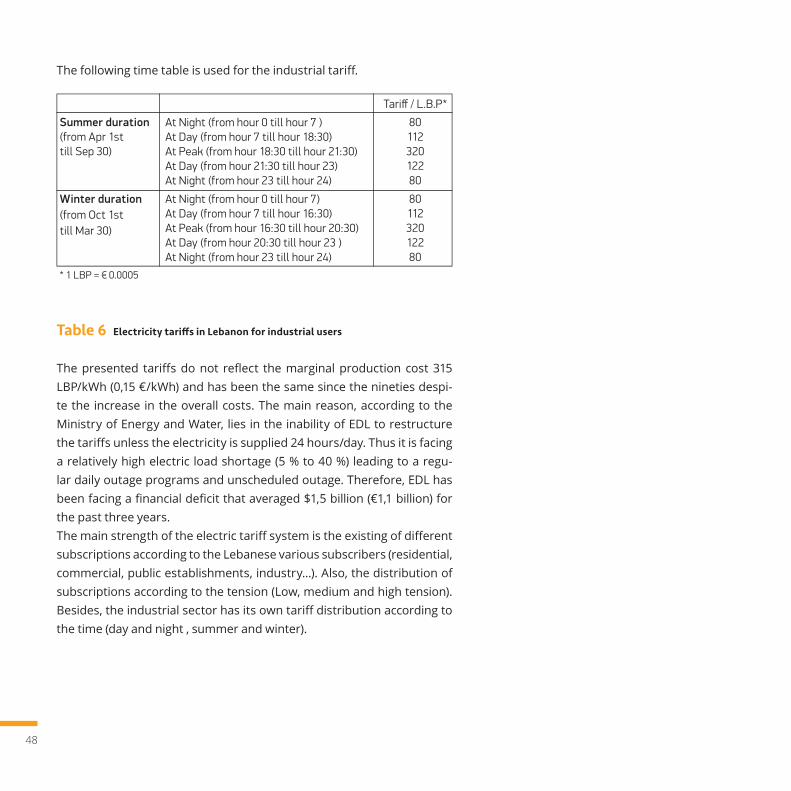
The following time table is used for the industrial tariff.
Table 6 Electricity tariffs in Lebanon for industrial users
The presented tariffs do not reflect the marginal production cost 315 LBP/kWh (0,15 €/kWh) and has been the same since the nineties despi-te the increase in the overall costs. The main reason, according to the Ministry of Energy and Water, lies in the inability of EDL to restructure the tariffs unless the electricity is supplied 24 hours/day. Thus it is facing a relatively high electric load shortage (5 % to 40 %) leading to a regu-lar daily outage programs and unscheduled outage. Therefore, EDL has been facing a financial deficit that averaged $1,5 billion (€1,1 billion) for the past three years. The main strength of the electric tariff system is the existing of different subscriptions according to the Lebanese various subscribers (residential, commercial, public establishments, industry...). Also, the distribution of subscriptions according to the tension (Low, medium and high tension). Besides, the industrial sector has its own tariff distribution according to the time (day and night , summer and winter).
* 1 LBP = € 0.0005
Tariff / L.B.P*
Summer duration(from Apr 1st till Sep 30)
8011232012280
At Night (from hour 0 till hour 7 )At Day (from hour 7 till hour 18:30)At Peak (from hour 18:30 till hour 21:30)At Day (from hour 21:30 till hour 23)At Night (from hour 23 till hour 24)
Winter duration (from Oct 1sttill Mar 30)
8011232012280
At Night (from hour 0 till hour 7)At Day (from hour 7 till hour 16:30)At Peak (from hour 16:30 till hour 20:30)At Day (from hour 20:30 till hour 23 )At Night (from hour 23 till hour 24)
49
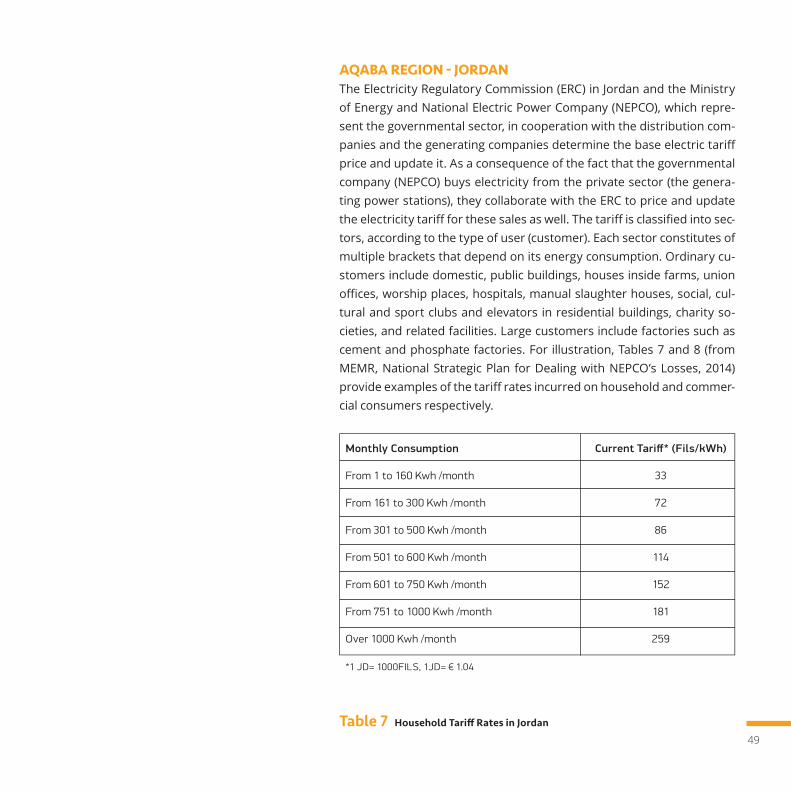
AQABA REGION - JORDANThe Electricity Regulatory Commission (ERC) in Jordan and the Ministry of Energy and National Electric Power Company (NEPCO), which repre-sent the governmental sector, in cooperation with the distribution com-panies and the generating companies determine the base electric tariff price and update it. As a consequence of the fact that the governmental company (NEPCO) buys electricity from the private sector (the genera-ting power stations), they collaborate with the ERC to price and update the electricity tariff for these sales as well. The tariff is classified into sec-tors, according to the type of user (customer). Each sector constitutes of multiple brackets that depend on its energy consumption. Ordinary cu-stomers include domestic, public buildings, houses inside farms, union offices, worship places, hospitals, manual slaughter houses, social, cul-tural and sport clubs and elevators in residential buildings, charity so-cieties, and related facilities. Large customers include factories such as cement and phosphate factories. For illustration, Tables 7 and 8 (from MEMR, National Strategic Plan for Dealing with NEPCO’s Losses, 2014) provide examples of the tariff rates incurred on household and commer-cial consumers respectively.
Table 7 Household Tariff Rates in Jordan
7 *1 JD= 1000FILS, 1JD= € 1.04
Monthly Consumption
From 1 to 160 Kwh /month
From 161 to 300 Kwh /month
From 301 to 500 Kwh /month
From 501 to 600 Kwh /month
From 601 to 750 Kwh /month
From 751 to 1000 Kwh /month
Over 1000 Kwh /month
Current Tariff* (Fils/kWh)
33
72
86
114
152
181
259
50
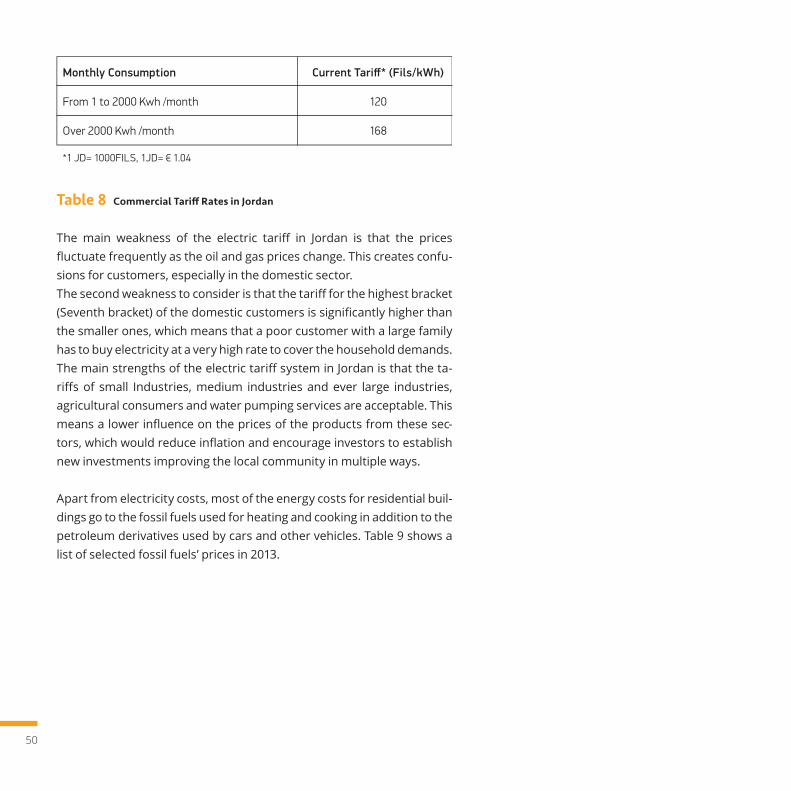
Table 8 Commercial Tariff Rates in Jordan
The main weakness of the electric tariff in Jordan is that the prices fluctuate frequently as the oil and gas prices change. This creates confu-sions for customers, especially in the domestic sector.The second weakness to consider is that the tariff for the highest bracket (Seventh bracket) of the domestic customers is significantly higher than the smaller ones, which means that a poor customer with a large family has to buy electricity at a very high rate to cover the household demands. The main strengths of the electric tariff system in Jordan is that the ta-riffs of small Industries, medium industries and ever large industries, agricultural consumers and water pumping services are acceptable. This means a lower influence on the prices of the products from these sec-tors, which would reduce inflation and encourage investors to establish new investments improving the local community in multiple ways.
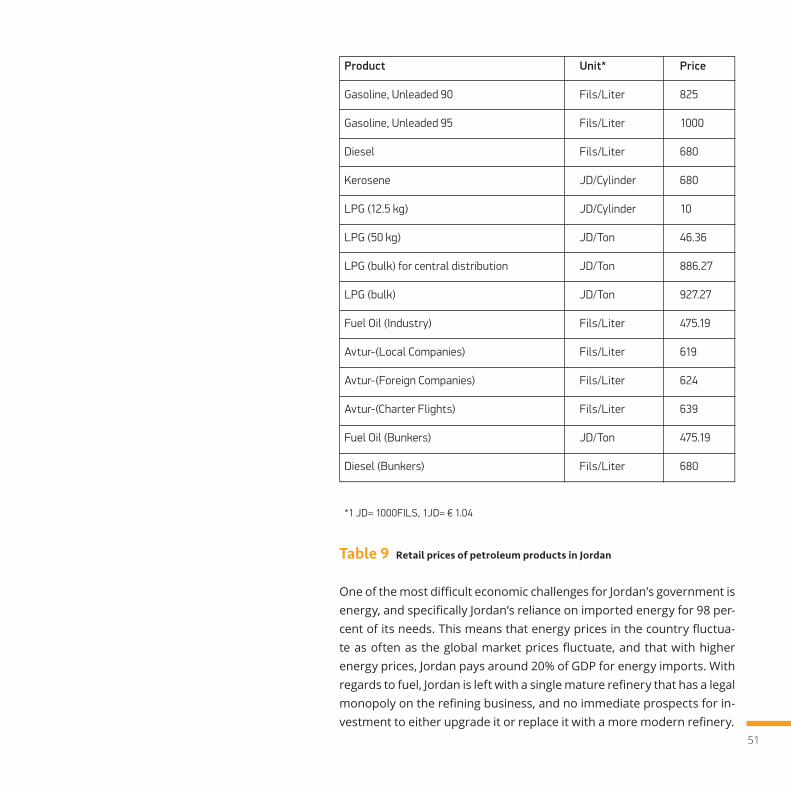
Apart from electricity costs, most of the energy costs for residential buil-dings go to the fossil fuels used for heating and cooking in addition to the petroleum derivatives used by cars and other vehicles. Table 9 shows a list of selected fossil fuels’ prices in 2013.
*1 JD= 1000FILS, 1JD= € 1.04
Monthly Consumption
From 1 to 2000 Kwh /month
Over 2000 Kwh /month
Current Tariff* (Fils/kWh)
120
168
51
Table 9 Retail prices of petroleum products in Jordan
One of the most difficult economic challenges for Jordan’s government is energy, and specifically Jordan’s reliance on imported energy for 98 per-cent of its needs. This means that energy prices in the country fluctua-te as often as the global market prices fluctuate, and that with higher energy prices, Jordan pays around 20% of GDP for energy imports. With regards to fuel, Jordan is left with a single mature refinery that has a legal monopoly on the refining business, and no immediate prospects for in-vestment to either upgrade it or replace it with a more modern refinery.
9
*1 JD= 1000FILS, 1JD= € 1.04
Product
Gasoline, Unleaded 90
Gasoline, Unleaded 95
Diesel
Kerosene
LPG (12.5 kg)
LPG (50 kg)
LPG (bulk) for central distribution
LPG (bulk)
Fuel Oil (Industry)
Avtur-(Local Companies)
Avtur-(Foreign Companies)
Avtur-(Charter Flights)
Fuel Oil (Bunkers)
Diesel (Bunkers)
Unit*
Fils/Liter
Fils/Liter
Fils/Liter
JD/Cylinder
JD/Cylinder
JD/Ton
JD/Ton
JD/Ton
Fils/Liter
Fils/Liter
Fils/Liter
Fils/Liter
JD/Ton
Fils/Liter
Price
825
1000
680
680
10
46.36
886.27
927.27
475.19
619
624
639
475.19
680
52
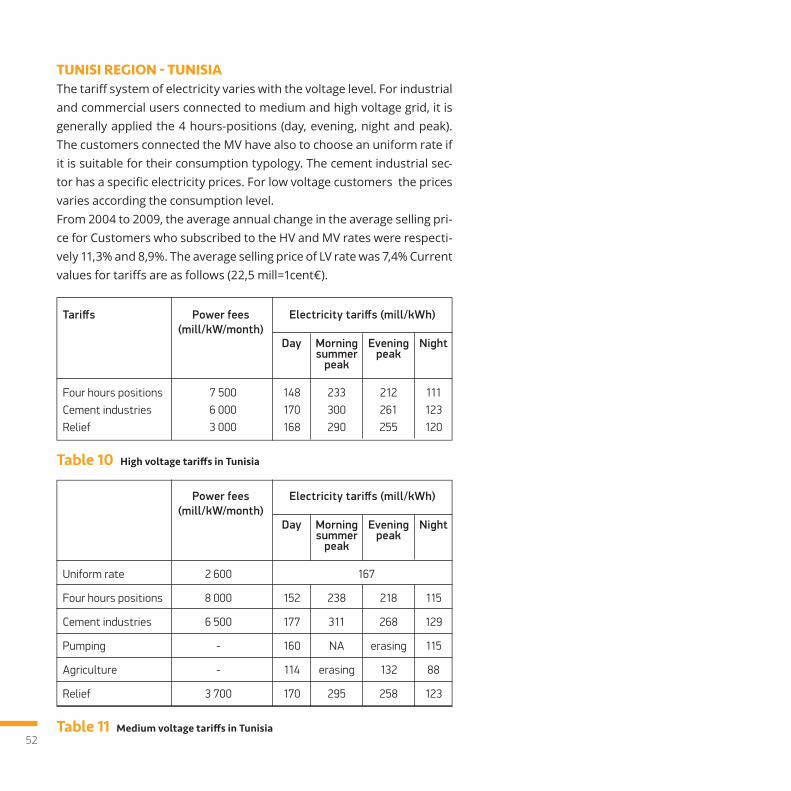
TUNISI REGION - TUNISIAThe tariff system of electricity varies with the voltage level. For industrial and commercial users connected to medium and high voltage grid, it is generally applied the 4 hours-positions (day, evening, night and peak). The customers connected the MV have also to choose an uniform rate if it is suitable for their consumption typology. The cement industrial sec-tor has a specific electricity prices. For low voltage customers the prices varies according the consumption level.From 2004 to 2009, the average annual change in the average selling pri-ce for Customers who subscribed to the HV and MV rates were respecti-vely 11,3% and 8,9%. The average selling price of LV rate was 7,4% Current values for tariffs are as follows (22,5 mill=1cent€).
Tariffs Power fees(mill/kW/month)
Four hours positionsCement industriesRelief
7 5006 0003 000
148170168
233300290
212261255
111123120
Day NightMorningsummer
peak
Evening peak
Electricity tariffs (mill/kWh)
Power fees(mill/kW/month)
Uniform rate
Four hours positions
Cement industries
Pumping
Agriculture
Relief
2 600
8 000
6 500
-
-
3 700
167
152
177
160
114
170
238
311
NA
erasing
295
218
268
erasing
132
258
115
129
115
88
123
Day NightMorningsummer
peak
Evening peak
Electricity tariffs (mill/kWh)
Table 10 High voltage tariffs in Tunisia
Table 11 Medium voltage tariffs in Tunisia
53
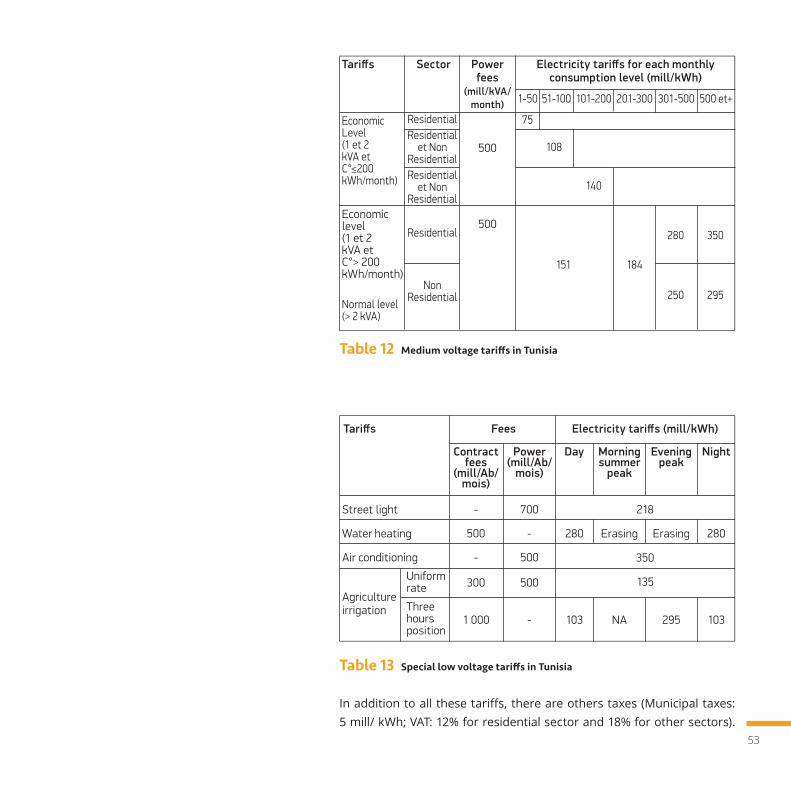
Table 12 Medium voltage tariffs in Tunisia
Table 13 Special low voltage tariffs in Tunisia
In addition to all these tariffs, there are others taxes (Municipal taxes: 5 mill/ kWh; VAT: 12% for residential sector and 18% for other sectors).
1-50
75
108
140
151 184
280 350
250 295
51-100 101-200 201-300 301-500 500 et+
Electricity tariffs for each monthly consumption level (mill/kWh)
Powerfees
(mill/kVA/month)
Tariffs Sector
500
500
ResidentialResidential
et Non ResidentialResidential
et Non Residential
Residential
NonResidential
Economic Level (1 et 2 kVA et C°≤200 kWh/month)
Normal level(> 2 kVA)
Economic level (1 et 2 kVA et C°> 200 kWh/month)
Fees
Contractfees
(mill/Ab/mois)
Power(mill/Ab/
mois)
Tariffs
Street light
Water heating
Air conditioning
Agricultureirrigation
Uniformrate
Three hoursposition
-
500
-
300
1 000
280
103
Erasing
NA
Erasing
295
280
103
700
-
500
500
-
218
350
135
Day NightMorningsummer
peak
Evening peak
Electricity tariffs (mill/kWh)
54
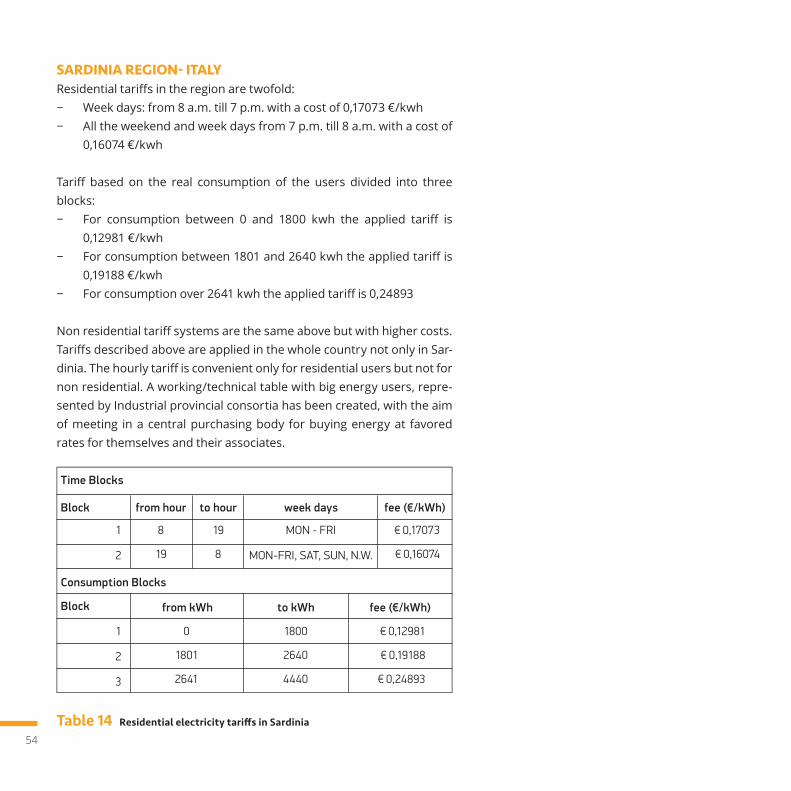
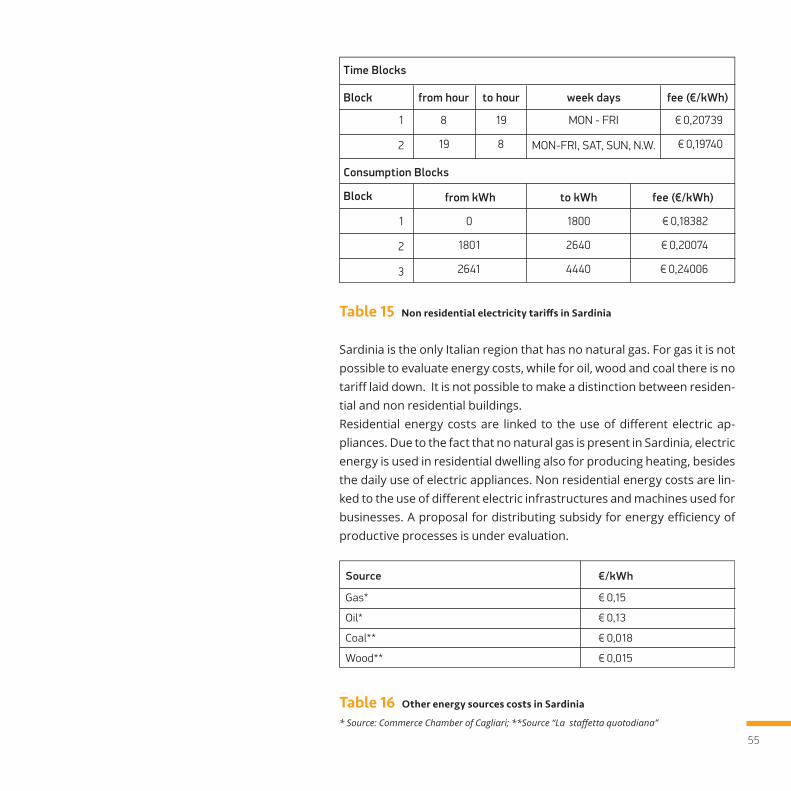
SARDINIA REGION- ITALYResidential tariffs in the region are twofold: − Week days: from 8 a.m. till 7 p.m. with a cost of 0,17073 €/kwh − All the weekend and week days from 7 p.m. till 8 a.m. with a cost of
0,16074 €/kwh
Tariff based on the real consumption of the users divided into three blocks: − For consumption between 0 and 1800 kwh the applied tariff is
0,12981 €/kwh− For consumption between 1801 and 2640 kwh the applied tariff is
0,19188 €/kwh − For consumption over 2641 kwh the applied tariff is 0,24893
Non residential tariff systems are the same above but with higher costs. Tariffs described above are applied in the whole country not only in Sar-dinia. The hourly tariff is convenient only for residential users but not for non residential. A working/technical table with big energy users, repre-sented by Industrial provincial consortia has been created, with the aim of meeting in a central purchasing body for buying energy at favored rates for themselves and their associates.
from hour to hour
from kWh to kWh
Time Blocks
Block
Consumption Blocks
Block
1
2
8
19
19
8
MON - FRI
MON-FRI, SAT, SUN, N.W.
€ 0,17073
€ 0,16074
1
2
3
0
1801
2641
1800
2640
4440
€ 0,12981
€ 0,19188
€ 0,24893
week days fee (€/kWh)
fee (€/kWh)
Table 14 Residential electricity tariffs in Sardinia
55
Table 15 Non residential electricity tariffs in Sardinia
Sardinia is the only Italian region that has no natural gas. For gas it is not possible to evaluate energy costs, while for oil, wood and coal there is no tariff laid down. It is not possible to make a distinction between residen-tial and non residential buildings. Residential energy costs are linked to the use of different electric ap-pliances. Due to the fact that no natural gas is present in Sardinia, electric energy is used in residential dwelling also for producing heating, besides the daily use of electric appliances. Non residential energy costs are lin-ked to the use of different electric infrastructures and machines used for businesses. A proposal for distributing subsidy for energy efficiency of productive processes is under evaluation.
Table 16 Other energy sources costs in Sardinia
* Source: Commerce Chamber of Cagliari; **Source “La staffetta quotodiana”
from hour to hour
from kWh to kWh
Time Blocks
Block
Consumption Blocks
Block
1
2
8
19
19
8
MON - FRI
MON-FRI, SAT, SUN, N.W.
€ 0,20739
€ 0,19740
1
2
3
0
1801
2641
1800
2640
4440
€ 0,18382
€ 0,20074
€ 0,24006
week days fee (€/kWh)
fee (€/kWh)
16Source
Gas*
Oil*
Coal**
Wood**
€ 0,15
€ 0,13
€ 0,018
€ 0,015
€/kWh

2. Preliminary analysis
on PV technology current status
58
The different regions involved in FOsterinMED have different policies and standards for photovoltaic technology. Even if integrated solutions do not seem to be largely widespread, with few exceptions in Sardinia and Catalonia, the photovoltaic in general is already present in all the partner regions. This section is aimed to give a quick overview of the current diffusion of photovoltaic system and their features. The main stakeholders of this analysis are decision makers that can af-fect the widespread of BIPV by suitable policies.
2.1 Technical standards and laws
CATALONIA REGION - SPAINThe following certificates related with products are currently required during permitting process:
For solar modules: - CE certificate according to 73/23 EEC, 93/68 EEC and 89/336 EEC.- Certificate of compliance with IEC 61215:2005 “Crystalline silicon ter-
restrial photovoltaic modules. Design qualification and type appro-val” or
- Certificate of compliance with IEC 61646 “Thin-film terrestrial pho-tovoltaic (PV) modules - Design qualification and type approval”
Concerning PV inverters: - CE certificate according to 2006/95/CE and 2004/108/CE. - Inverter has the required anti-islanding protection.- Inverter has the required relay preventing operation in nonstan-
dard voltage and frequency conditions. - Inverter has galvanic isolation (except for those transformerless in-
verters).
The installation safety requirements are summarized in Spanish Royal Decree 1699/2011 and are essentially as follows: - A general switch disconnector, permanently accessible to electri-
cal distribution grid personnel, allowing complete PV plant discon-
59
nection of the grid in case it may be required by the distribution Company.
- Differential switch (or Residual Current Device, RCD) in the AC side preventing users from electrical danger due to eventual ground fau-lts.
- Automatic relay (included in the inverter or external device) preven-ting the installation from feeding electrical power to the grid beyond standard voltage (1.15·Vnom and 0,85 Vnom) and frequency (max of 50,5 Hz and min of 48 Hz) conditions.
In general, PV plants are requested to preserve the safe and reliable ope-ration of electrical grid and should not introduce any disturbance as well as should not allow the islanding operation under eventual grid discon-nection (for maintenance purpose for example).According to Spanish regulations any small electricity producer must sign an agreement with grid operator where all technical and economic con-ditions are described and defined. This agreement must be signed even for those installations intended for net metering (self-consumption). Thus grid operation approval is subject to compliance of the following points: - Signature of the above mentioned agreement. - Installation must meet the requirements of Spanish Royal Decree
1110/2007 concerning the technical conditions of metering devices. - Installation must meet the safety requirements as previously de-
scribed.For those existing buildings aiming to include solar PV systems in their roofs, Barcelona City Council would ask for a specific works license in-cluding: - Basic technical project showing PV generator general layout and si-
tuation of inverters and main electrical switchboards. - Technical report assessing the capability of the roof with the new lo-
ads and, eventually, modifications to be done to reinforce the roof. - In some historical buildings some visual and aesthetic requirements
could be also required.
60
ALEXANDRIA REGION - EGYPTCurrently the “Technical Requirements for Connecting Small Scale PV (ssPV) Systems to Low Voltage distribution Networks” are in force.It defines the main requirements that a grid connected system must ful-fil. These regards:− Utility compatibility− System Parameters− Voltage Range of Operation− Normal frequency operating range− Flicker− Harmonics and waveform distortion− Power factor− DC injection− Synchronization− Safety and protection− Safety disconnect from utility network− Disconnection switching unit− Overvoltage, under voltage and frequency− Prevention of islanding− Response to utility recovery− Isolation− Earthing− Short-circuit protection− Metering− Metering schemes− Types of meter
LEBANONCurrently, there are no required certificates for PV products in Lebanon. There are, however, some installation safety requirements, that are li-sted in the technical specifications and guidelines form of the net mete-ring forms published by EDL. It consists of the following points: - External safety switch- Voltage surge protection
61
- Earthing system ~30 ohms - EDL service entrance voltage at EDL revenue meter- Equipments designations- The system datasheet /technical specifications- Site plan • Location of EDL meter, • DG system disconnect means switch • Main AC panel • Related subpanel • Inverter- EDL incoming pole and line.
AQABA REGION - JORDANConcerning products certification, there are currently no certificates re-quired in the permitting process.However the following international standards are currently under con-sideration for adoption in the near future:• IEC 61215: “Crystalline silicon terrestrial photovoltaic modules. Desi-
gn qualification and type approval”• IEC 61646 “Thin-film terrestrial photovoltaic (PV) modules - Design
qualification and type approval”• Other IEC standards for Balance-Of-System components used in
photovoltaic power systems, which include standards related to PV inverters, charge controllers, cables and batteries.
Technical specifications required for the safety of installation of re-newable energy systems according to the National Building Code num-ber 45/2012 are summarized as follows:1. Grounding of the metal structure that supports the PV modules.2. Grounding of the PV module’s body.3. Grounding of the inverter.4. DC grounding system should be separate from the AC grounding
system.5. Calibration of the inverter according to the following specifications: • Small-scale systems: BS ENA G83/1-1
62
• Large-scale systems: BS ENA G59/2-26. Use of specialized PV cables for connecting PV modules with the in-
verter. The cables should have proper lengths and cross-sectional areas that match the PV modules’ power.
7. Providing a DC breaker preceding the inverter with a suitable power rating.
8. Use of AC cables with proper lengths and cross-sectional areas that match the inverter’s power.
9. Installation of a breaker for the separation of the phase(s) and neu-tral connections of the inverter. It is connected directly following the inverter and should be rated to match the inverter’s power.
10. Installation of a residual current circuit breaker (RCCB) after the afo-rementioned breaker with the proper rating that matches the inver-ter’s power.
11. Installation of a breaker for the separation of the phase(s) and neu-tral connections after the network breaker and before the load at the PV system’s side, such that the aforementioned breaker is easily reachable next to the electricity meter. The beaker should have the proper rating matching the network breaker’s power.
Jordan has issued all the laws, bylaws, and directives necessary for regu-lating the integration of renewable energy resources with the grid:
General Electricity Law (GEL) Number 64/2002 issues generation licenses as follows: • Generation Capacity > 5MW - must apply for a license • Generation Capacity range from 1MW to 5MW - might be exempted
from applying for a license • Generation Capacity < 1MW does not need to apply for a license.For those existing buildings aiming to include solar PV systems on their roofs, city council approval in not required.
63
TUNISI REGION - TUNISIAIn Tunisia, the legal framework allows private power generation only through concession agreements with the government. The legal framework also allows the private sector to generate electri-city from PV systems for their own consumption with the possibility of injecting the surplus to the network, within the limits of 30% of the electricity generated each year, at a price equal to the sales price of electricity by the National Company (STEG).However, a law is being discussed to encourage independent green electricity generators to sell their production to the network through purchase rates displayed and guaranteed by the government for wind, solar PV and biomass energy. This new law allows also the export of electricity generated by renewable energy resources.According the technical standards, PV panels must be tested, certifica-tes in support, by an approved laboratory. They must be conforming to international standards: IEC 61215 (crystalline silicon performance) and IEC-61646 ( thin film performance). Solar inverters less than 5 kVA must be equipped with an integrated decoupling protection system according to the specifications of the German standard DIN VDE0126. In any case the PV panels sold in Tunisia must be agreed by the ANME (National Agency for Energy Conservation) and the inverters by STEG (Electricity Company).The main safety requirements in Tunisia are:- For PV projects connected to LV: Eligibility of installers and technical
specifications eligibility installations (ANME - February 2009)- For PV projects connected to MV and HV: Chapter II (Safety guideli-
nes) of the Minister of Industry and Technology (dated 12 May 2011) Order. This chapter consists of three Articles:
• The operating instructions and safety • Security teams operating on the connection • Interventions in the substation
And the main requirements to approve the on-grid PV installation by the grid operator are:- Solar PV connected to the LV grid: • Preliminary agreement of the operator (verification of solar
64
power to be installed) / signing of a electricity exchange contract.- Solar PV connected to MV and HV grid: • Respect of the specifications relating to the technical conditions
of connection and evacuation of the electric power of the coge-neration and renewable energy fittings over the national electric network. (Order of the Minister of Industry and Technology da-ted 12 May 2011);
• Signing of a contract for the sale of surplus electricity produced by PV systems (Law n° 2009-7 dated 9 February 2009).
According the big projects of producing electricity from renewable ener-gies, they must be approved by decision of the Minister in charge of ener-gy on a proposal from the consultative technical commission.(Law n° 2009-7 dated 9 February 2009).
SARDINIA REGION - ITALYThe inter-ministerial decrees 19/02/07 and 06/08/10 established that, to have access to the incentive rates, is necessary to certificate the complian-ce of the photovoltaic modules to the following norms, in relation to the technological specifications used (monocrystalline or polycrystalline sili-con modules, thin-film modules or concentrated photovoltaic modules): • CEI EN 61215: Crystalline silicon photovoltaic modules for land appli-
cation - Project qualification and type uniformity;• CEI EN 61646: Thin-film photovoltaic modules for land application -
Project qualification and type uniformity; • CEI EN 62108: Concentrated photovoltaic modules - Project qualifi-
cation and type approval;
The laboratories able to release a certification shall be accredited, in con-formity with the norm UNI CEI EN ISO/IEC 17025, of Accredited Organi-sms members of EA (European cooperation for Accreditation), or that have established mutual recognizance agreements with the EA or in sco-pe with ILAC (International Laboratory Accreditation Cooperation) (Source: www.gse.it)
65
The following categories of photovoltaic arrays have access to the incen-tive rates without the registration obligation: a. photovoltaic arrays of power non superior to 12 kW;b. photovoltaic arrays integration with innovative characteristics
(BIPV);c. concentrated photovoltaic arrays (CPV);d. photovoltaic arrays realized by the public entities according to their
own legal capabilities and procedures;e. photovoltaic arrays of power up to 50 kW realized on buildings, with
modules installed on roofs guaranteeing a complete substitution of roof structures where eternit or asbestos are present.
f. photovoltaic arrays of power between 12kW and 20kW, including the arrays realized on restructure processes , and also the develop-ment, meaning and increase of the power of the system over 12kW and non over 20kW, that may request for a rate reduction of 20% in respect to the expected one.
For any other type of array is necessary the registration to the big array register. [Source: www.gse.it/]
The local authorization/license title that is to say one of the following titles:- unique authorization;- declaration of activities start, or declaration of simplified licensed
procedure;- copy of the communication related with the construction activities
on private means;- copy of the authorization actions;- copy of the communication of activities start “CIA” or the certified
advise of activities start “SCIA”
For the arrays installed on agricultural areas (presentation of the request of unique authorization to the region in charge, or the province in charge or with the presentation of the DIA or the PAS to the local authorities, territorially in charge). (Source- GSE: Regole applicative per il riconoscimento delle tariffe incentivanti)
66
2.2 PV and BIPV plants widespread in the region
CATALONIA REGION - SPAINPV technology has shown an amazing evolution in Spain in the last de-cade. In 2003 cumulative PV power installed in Spain was only 37 MWp. Nowadays is about 4200 MWp, roughly 270 of those being installed in Catalonia. PV technology has been encouraged in Spain under the framework of the Feed in Tariff system starting from Royal Decree 2818/1998 and until Royal Decree RDL 1/2012. During first years of FiT program there was neither quotas nor limita-tions to total installed PV plants. Moreover, tariffs were attractively high for this technology thus allowing a rapid growth of installed PV power, being ground installations the most common configuration. As cumulative installed PV power reached the figure of 1000 MW in Au-gust 2008, a new system was implemented based on quotas of new PV installed power under Energy Ministry supervision. The Ministry of Energy launched a limited quota of PV power per each round. Every time demanded PV power overcomes the quota of offered PV power the tariffs were recalculated in order to decrease the tariff and balance the market. Thus tariffs for PV technology were decreasing stea-dily along the period comprised between 2008 and 2012. During that period the Government tried to balance the PV plants distri-bution from big ground PV plants to small roof top PV plants by setting up a higher tariff for roof top plants. Finally, Spanish Royal Decree 1/2012 (January 2012) was launched to defi-nitively cancel the FiT program thus preventing PV plants from receiving a fixed tariff. Instead, the new PV plants are only authorized to sell their production to the pool (electricity market) with no regulated tariffs. In parallel, Royal Decree 1699/2011 (November 2011) has paved the road to Net Metering implementation in Spain. However, there is still no defi-nitive regulation on this subject since some drafts have been launched but are still awaiting final approval from Energy Ministry. Taxes and costs of the system to be paid by final consumers are main points of discus-sion.

67
Fig 27 Number of PV plants currently installed in Catalonia.
LEBANONPhotovoltaic electricity generation is still a new and expensive technolo-gy. The total installed capacity in 2011 was about 85 kWp. One of the lar-gest PV installations (400 m2) was established at the Lebanese University Campus Hadath, on the roof of the Industrial Research Institute building, with a capacity of 50 kWp. Another Important PV installation (12 kWp) was set up in 2008 at the Monastery of Saints Sarkis and Bakhos under the RAMseS (Renewable Energy Agriculture Multi-purpose System for Farmers) project supported by the European Commission’s Framework 6th Program. The main use of photovoltaic system arises when the national electricity grid does not reach rural areas. Although this is not the case with Leba-nese villages, municipalities supported by NGOs utilized this approach for street lighting purposes. Therefore, the high initial cost of PV systems cannot currently compete with the existing oil-based method to produce electricity in Lebanon. A new project “Beirut River Solar Snake (BRSS)” (expected to be done within the next five years) consists of installing a 10 MW PV farm that will be connected to the national grid. The project costs $40 Million and it will be funded by the Lebanese Ministry of Energy and Water.
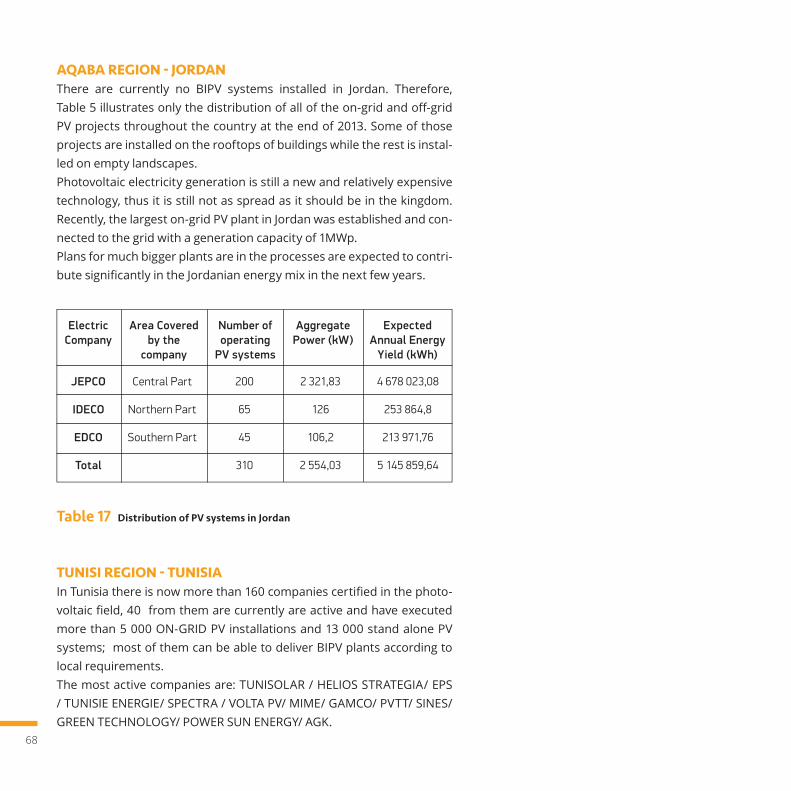
68
AQABA REGION - JORDANThere are currently no BIPV systems installed in Jordan. Therefore, Table 5 illustrates only the distribution of all of the on-grid and off-grid PV projects throughout the country at the end of 2013. Some of those projects are installed on the rooftops of buildings while the rest is instal-led on empty landscapes.Photovoltaic electricity generation is still a new and relatively expensive technology, thus it is still not as spread as it should be in the kingdom. Recently, the largest on-grid PV plant in Jordan was established and con-nected to the grid with a generation capacity of 1MWp.Plans for much bigger plants are in the processes are expected to contri-bute significantly in the Jordanian energy mix in the next few years.
Table 17 Distribution of PV systems in Jordan
TUNISI REGION - TUNISIAIn Tunisia there is now more than 160 companies certified in the photo-voltaic field, 40 from them are currently are active and have executed more than 5 000 ON-GRID PV installations and 13 000 stand alone PV systems; most of them can be able to deliver BIPV plants according to local requirements. The most active companies are: TUNISOLAR / HELIOS STRATEGIA/ EPS / TUNISIE ENERGIE/ SPECTRA / VOLTA PV/ MIME/ GAMCO/ PVTT/ SINES/ GREEN TECHNOLOGY/ POWER SUN ENERGY/ AGK.
17
ElectricCompany
JEPCO
IDECO
EDCO
Total
Area Coveredby the
company
Central Part
Northern Part
Southern Part
Number ofoperating
PV systems
200
65
45
310
AggregatePower (kW)
ExpectedAnnual Energy
Yield (kWh)
2 321,83
126
106,2
2 554,03
4 678 023,08
253 864,8
213 971,76
5 145 859,64
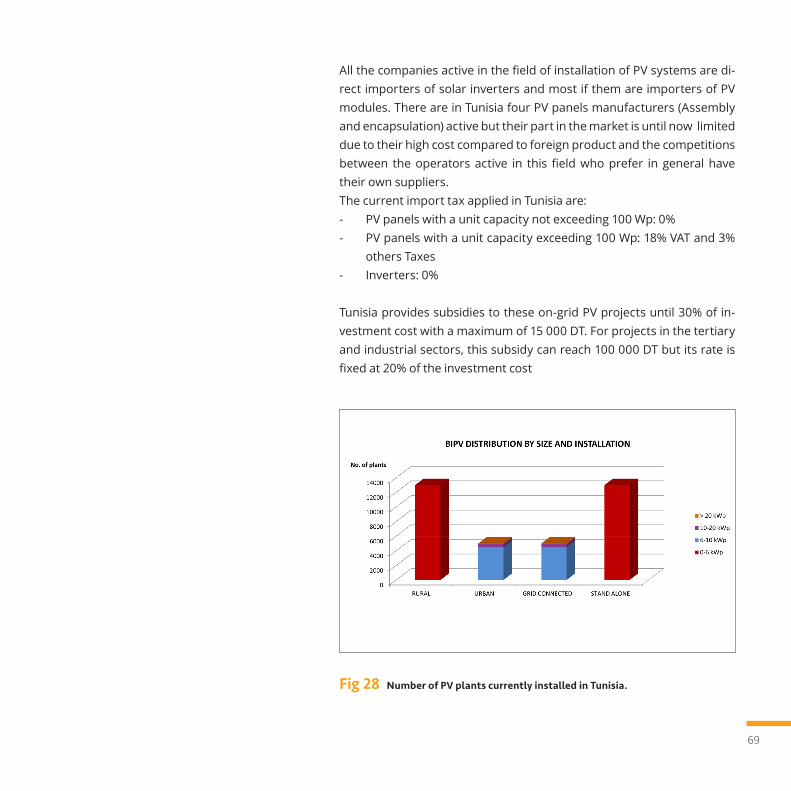
69
All the companies active in the field of installation of PV systems are di-rect importers of solar inverters and most if them are importers of PV modules. There are in Tunisia four PV panels manufacturers (Assembly and encapsulation) active but their part in the market is until now limited due to their high cost compared to foreign product and the competitions between the operators active in this field who prefer in general have their own suppliers. The current import tax applied in Tunisia are:- PV panels with a unit capacity not exceeding 100 Wp: 0%- PV panels with a unit capacity exceeding 100 Wp: 18% VAT and 3%
others Taxes- Inverters: 0%
Tunisia provides subsidies to these on-grid PV projects until 30% of in-vestment cost with a maximum of 15 000 DT. For projects in the tertiary and industrial sectors, this subsidy can reach 100 000 DT but its rate is fixed at 20% of the investment cost
Fig 28 Number of PV plants currently installed in Tunisia.
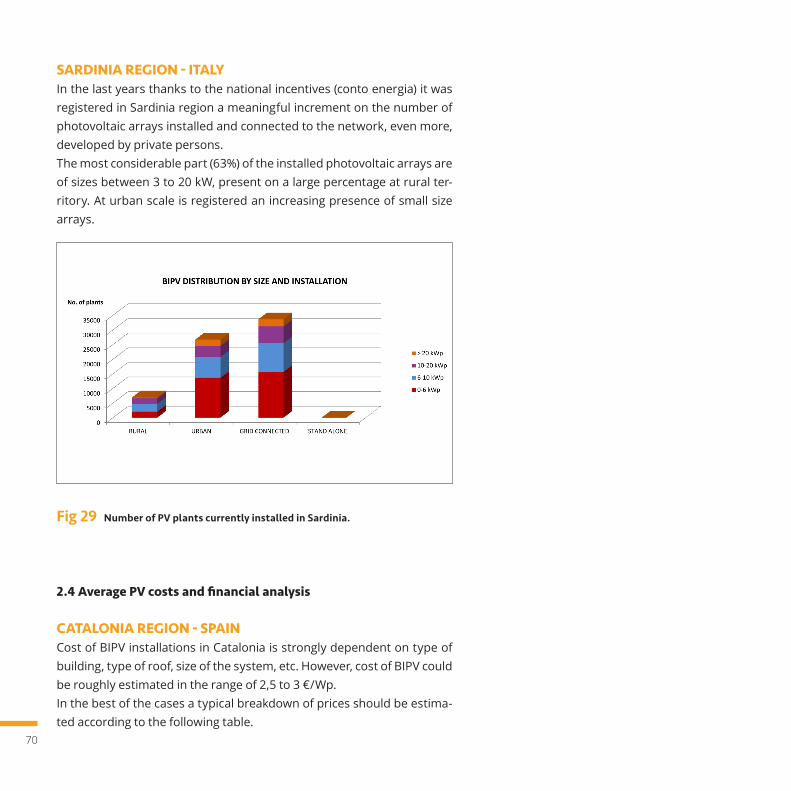
70
SARDINIA REGION - ITALYIn the last years thanks to the national incentives (conto energia) it was registered in Sardinia region a meaningful increment on the number of photovoltaic arrays installed and connected to the network, even more, developed by private persons.The most considerable part (63%) of the installed photovoltaic arrays are of sizes between 3 to 20 kW, present on a large percentage at rural ter-ritory. At urban scale is registered an increasing presence of small size arrays.
Fig 29 Number of PV plants currently installed in Sardinia.
2.4 Average PV costs and financial analysis
CATALONIA REGION - SPAINCost of BIPV installations in Catalonia is strongly dependent on type of building, type of roof, size of the system, etc. However, cost of BIPV could be roughly estimated in the range of 2,5 to 3 €/Wp.In the best of the cases a typical breakdown of prices should be estima-ted according to the following table.
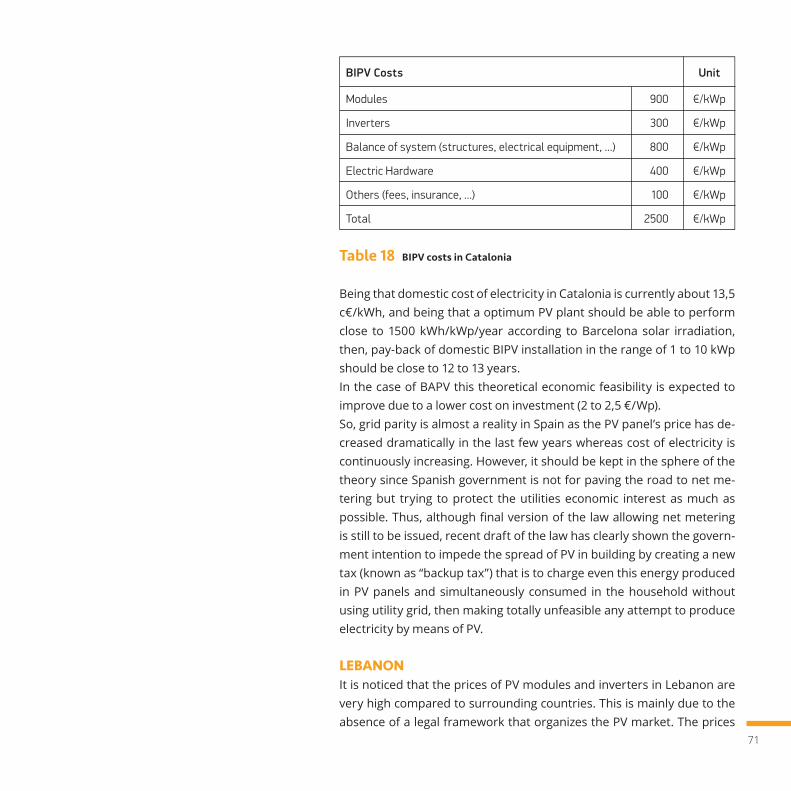
71
Table 18 BIPV costs in Catalonia
Being that domestic cost of electricity in Catalonia is currently about 13,5 c€/kWh, and being that a optimum PV plant should be able to perform close to 1500 kWh/kWp/year according to Barcelona solar irradiation, then, pay-back of domestic BIPV installation in the range of 1 to 10 kWp should be close to 12 to 13 years. In the case of BAPV this theoretical economic feasibility is expected to improve due to a lower cost on investment (2 to 2,5 €/Wp). So, grid parity is almost a reality in Spain as the PV panel’s price has de-creased dramatically in the last few years whereas cost of electricity is continuously increasing. However, it should be kept in the sphere of the theory since Spanish government is not for paving the road to net me-tering but trying to protect the utilities economic interest as much as possible. Thus, although final version of the law allowing net metering is still to be issued, recent draft of the law has clearly shown the govern-ment intention to impede the spread of PV in building by creating a new tax (known as “backup tax”) that is to charge even this energy produced in PV panels and simultaneously consumed in the household without using utility grid, then making totally unfeasible any attempt to produce electricity by means of PV.
LEBANONIt is noticed that the prices of PV modules and inverters in Lebanon are very high compared to surrounding countries. This is mainly due to the absence of a legal framework that organizes the PV market. The prices
BIPV Costs
Modules
Inverters
Balance of system (structures, electrical equipment, ...)
Electric Hardware
Others (fees, insurance, ...)
Total
900
300
800
400
100
2500
Unit
€/kWp
€/kWp
€/kWp
€/kWp
€/kWp
€/kWp
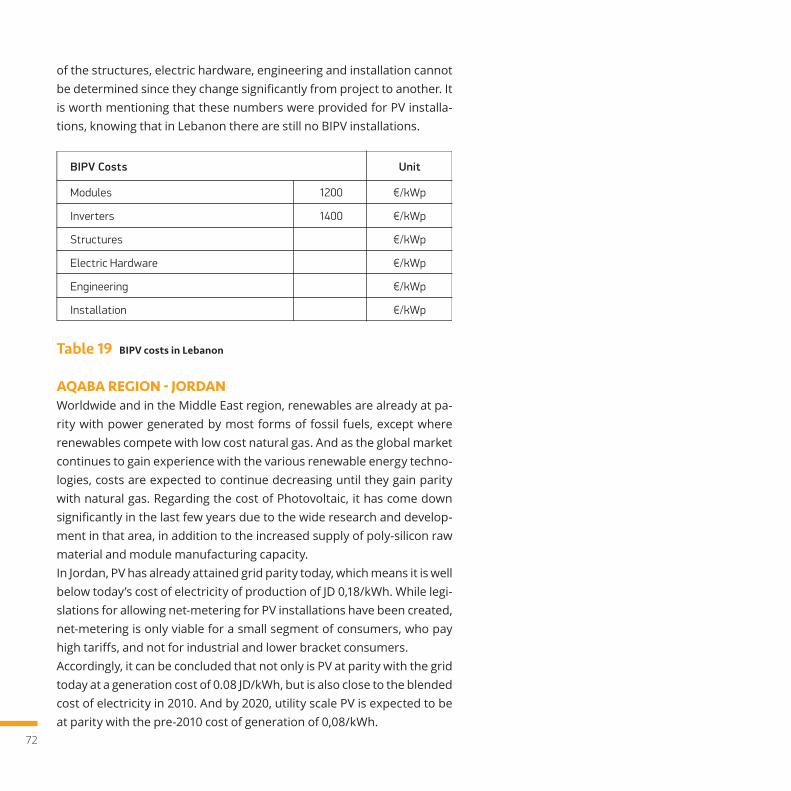
72
of the structures, electric hardware, engineering and installation cannot be determined since they change significantly from project to another. It is worth mentioning that these numbers were provided for PV installa-tions, knowing that in Lebanon there are still no BIPV installations.
Table 19 BIPV costs in Lebanon
AQABA REGION - JORDANWorldwide and in the Middle East region, renewables are already at pa-rity with power generated by most forms of fossil fuels, except where renewables compete with low cost natural gas. And as the global market continues to gain experience with the various renewable energy techno-logies, costs are expected to continue decreasing until they gain parity with natural gas. Regarding the cost of Photovoltaic, it has come down significantly in the last few years due to the wide research and develop-ment in that area, in addition to the increased supply of poly-silicon raw material and module manufacturing capacity.In Jordan, PV has already attained grid parity today, which means it is well below today’s cost of electricity of production of JD 0,18/kWh. While legi-slations for allowing net-metering for PV installations have been created, net-metering is only viable for a small segment of consumers, who pay high tariffs, and not for industrial and lower bracket consumers.Accordingly, it can be concluded that not only is PV at parity with the grid today at a generation cost of 0.08 JD/kWh, but is also close to the blended cost of electricity in 2010. And by 2020, utility scale PV is expected to be at parity with the pre-2010 cost of generation of 0,08/kWh.
BIPV Costs
Modules
Inverters
Structures
Electric Hardware
Engineering
Installation
1200
1400
Unit
€/kWp
€/kWp
€/kWp
€/kWp
€/kWp
€/kWp
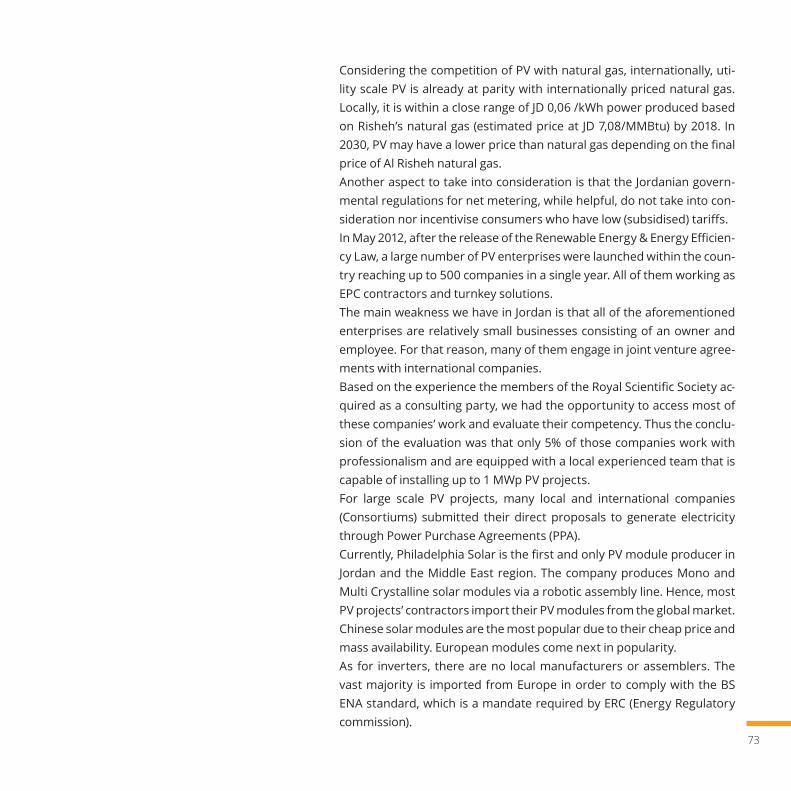
73
Considering the competition of PV with natural gas, internationally, uti-lity scale PV is already at parity with internationally priced natural gas. Locally, it is within a close range of JD 0,06 /kWh power produced based on Risheh’s natural gas (estimated price at JD 7,08/MMBtu) by 2018. In 2030, PV may have a lower price than natural gas depending on the final price of Al Risheh natural gas.Another aspect to take into consideration is that the Jordanian govern-mental regulations for net metering, while helpful, do not take into con-sideration nor incentivise consumers who have low (subsidised) tariffs.In May 2012, after the release of the Renewable Energy & Energy Efficien-cy Law, a large number of PV enterprises were launched within the coun-try reaching up to 500 companies in a single year. All of them working as EPC contractors and turnkey solutions. The main weakness we have in Jordan is that all of the aforementioned enterprises are relatively small businesses consisting of an owner and employee. For that reason, many of them engage in joint venture agree-ments with international companies. Based on the experience the members of the Royal Scientific Society ac-quired as a consulting party, we had the opportunity to access most of these companies’ work and evaluate their competency. Thus the conclu-sion of the evaluation was that only 5% of those companies work with professionalism and are equipped with a local experienced team that is capable of installing up to 1 MWp PV projects.For large scale PV projects, many local and international companies (Consortiums) submitted their direct proposals to generate electricity through Power Purchase Agreements (PPA).Currently, Philadelphia Solar is the first and only PV module producer in Jordan and the Middle East region. The company produces Mono and Multi Crystalline solar modules via a robotic assembly line. Hence, most PV projects’ contractors import their PV modules from the global market.Chinese solar modules are the most popular due to their cheap price and mass availability. European modules come next in popularity.As for inverters, there are no local manufacturers or assemblers. The vast majority is imported from Europe in order to comply with the BS ENA standard, which is a mandate required by ERC (Energy Regulatory commission).
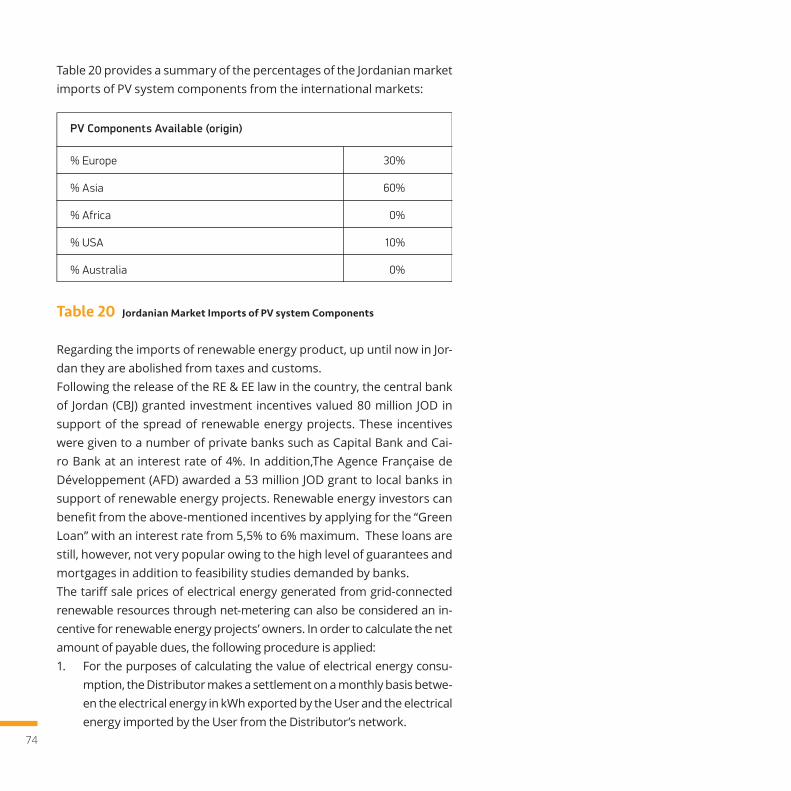
74
Table 20 provides a summary of the percentages of the Jordanian market imports of PV system components from the international markets:
Table 20 Jordanian Market Imports of PV system Components
Regarding the imports of renewable energy product, up until now in Jor-dan they are abolished from taxes and customs.Following the release of the RE & EE law in the country, the central bank of Jordan (CBJ) granted investment incentives valued 80 million JOD in support of the spread of renewable energy projects. These incentives were given to a number of private banks such as Capital Bank and Cai-ro Bank at an interest rate of 4%. In addition,The Agence Française de Développement (AFD) awarded a 53 million JOD grant to local banks in support of renewable energy projects. Renewable energy investors can benefit from the above-mentioned incentives by applying for the “Green Loan” with an interest rate from 5,5% to 6% maximum. These loans are still, however, not very popular owing to the high level of guarantees and mortgages in addition to feasibility studies demanded by banks.The tariff sale prices of electrical energy generated from grid-connected renewable resources through net-metering can also be considered an in-centive for renewable energy projects’ owners. In order to calculate the net amount of payable dues, the following procedure is applied:1. For the purposes of calculating the value of electrical energy consu-
mption, the Distributor makes a settlement on a monthly basis betwe-en the electrical energy in kWh exported by the User and the electrical energy imported by the User from the Distributor’s network.
20
PV Components Available (origin)
% Europe
% Asia
% Africa
% USA
% Australia
30%
60%
0%
10%
0%
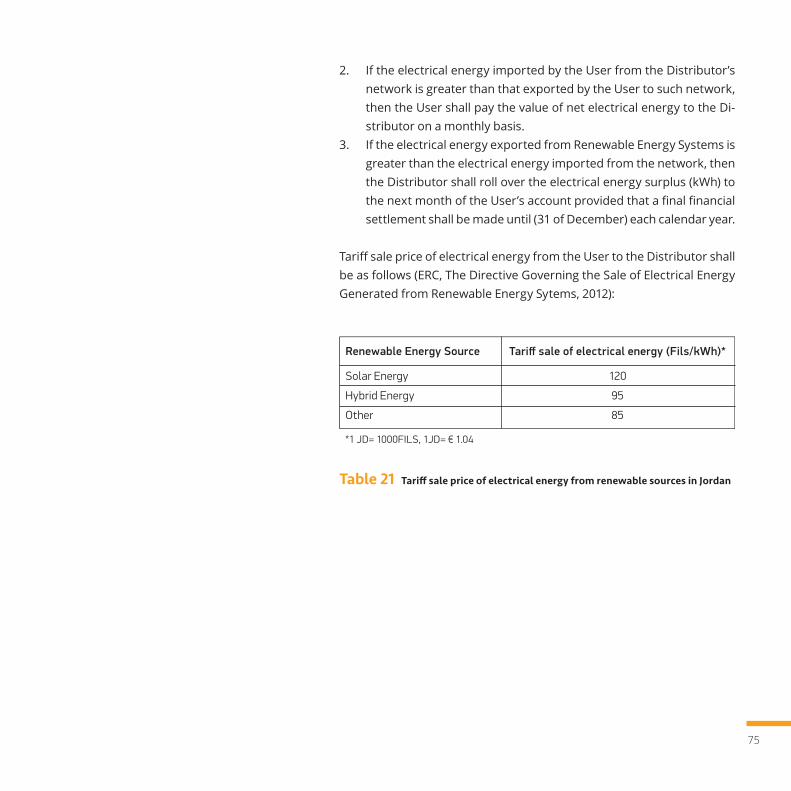
75
2. If the electrical energy imported by the User from the Distributor’s network is greater than that exported by the User to such network, then the User shall pay the value of net electrical energy to the Di-stributor on a monthly basis.
3. If the electrical energy exported from Renewable Energy Systems is greater than the electrical energy imported from the network, then the Distributor shall roll over the electrical energy surplus (kWh) to the next month of the User’s account provided that a final financial settlement shall be made until (31 of December) each calendar year.
Tariff sale price of electrical energy from the User to the Distributor shall be as follows (ERC, The Directive Governing the Sale of Electrical Energy Generated from Renewable Energy Sytems, 2012):
Table 21 Tariff sale price of electrical energy from renewable sources in Jordan
Renewable Energy Source
Solar Energy
Hybrid Energy
Other
Tariff sale of electrical energy (Fils/kWh)*
120
95
85
*1 JD= 1000FILS, 1JD= € 1.04

76
The User shall continue to pay the incurred costs, including meter wages, rural electrification files based on quantities of electrical energy impor-ted from the Distributor’s network. Therefore, Incentive mechanisms in terms of bank loans and electric ta-riffs are present in the kingdom, but the population is still unaware of the benefits of these incentives and they are still not using them to their full potential.
Overall, the payback period of a PV system can be estimated as follows, taking into consideration the electric subscription sector type:− For residential subscribers: 3-12 years, depending on monthly con-
sumptions.− For commercial subscribers: 5-6 years− For industrial and agricultural subscribers: 10-12 years, depending
on tariff and monthly consumptions.
Although PV is not suitable to satisfy base load capacity, it can be used as an energy efficiency solution until such time as storage solutions be-come cost effective. Therefore, the logic for Jordan now is to support and prioritise the quick and aggressive implementation of PV projects consi-dering both the economic and security of supply perspectives.In order for this to be achieved, a phased approach based on good econo-mic study and technology innovation must be followed, obstacles should be removed and a strategy for facilitating on-going projects should be considered in addition to engaging rural communities with the spread of PV technology within the country.
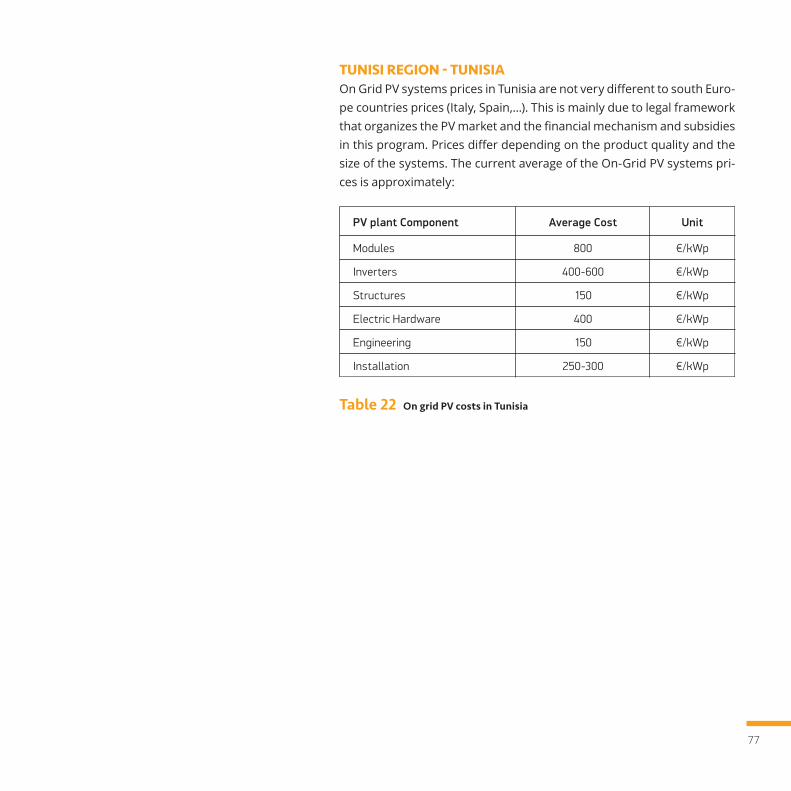
77
TUNISI REGION - TUNISIAOn Grid PV systems prices in Tunisia are not very different to south Euro-pe countries prices (Italy, Spain,...). This is mainly due to legal framework that organizes the PV market and the financial mechanism and subsidies in this program. Prices differ depending on the product quality and the size of the systems. The current average of the On-Grid PV systems pri-ces is approximately:
Table 22 On grid PV costs in Tunisia
PV plant Component
Modules
Inverters
Structures
Electric Hardware
Engineering
Installation
800
400-600
150
400
150
250-300
Unit
€/kWp
€/kWp
€/kWp
€/kWp
€/kWp
€/kWp
Average Cost

Project Management OfficeUNICA - DICAAR
Via Marengo 2 - 09123 Cagliari Tel. +39 070 6755811email: [email protected]
www.fosterinmed.eu
FOSTEr inMED
We are social!http://twitter.com/fosterinmed
http://slideshare.net/fosterinmedhttp://youtube.com/fosterinmedhttp://facebook.com/fosterinmed
For more information, please contact: