Embed Size (px)
Citation preview
Enzymes
Lecture outlines•Catalysis
•Activation energy & its profile
•Enzyme & substrate
•How enzymes bind to substrates
•Lock & Key model
•Induced-fit model
•Enzyme assay
Lecture outcomes
• At the end of this lecture, students are able to:
• Define the catalyst
• Understand how enzymes work as catalysts, the concept of activation energy and enzymes-substrate binding
• Explain different theories of the relation between enzymes and substrates
Catalysis
• It is probably the most important function of all proteins
• Most reactions in biological systems would take place far too slowly in the absence of catalyst
• The catalysts that serve this function in organisms are called enzymes
• All other enzymes are globular proteins (with the exception of some RNAs (ribozymes) that have catalytic activity)
Continue• Enzymes can increase the rate of a reaction by
factor of up to 1020 over uncatalyzed reactions
• Non-enzymatic catalysts typically enhance the rate of the reaction by factors of 102 to 104
• Catalysts are substances that speed up the rate of a chemical reaction
• Biocatalysts or enzymes are biological catalysts that speed up the metabolic reactions that occur in the body
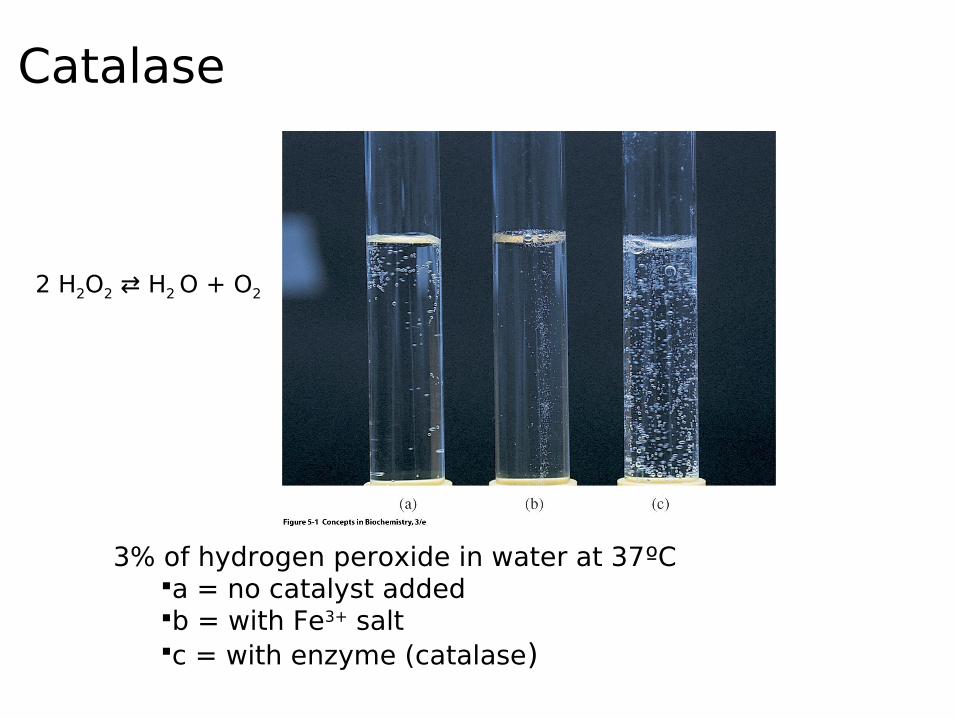
Catalase
3% of hydrogen peroxide in water at 37ºCa = no catalyst addedb = with Fe3+ saltc = with enzyme (catalase)
2 H2O2 ⇄ H2 O + O2
Hydrogen peroxide
• Hydrogen peroxide is a waste product of metabolism, and if it left in the cell, it would initiate the formation of free radical
Activation energy
• The amount of energy that must be acquired by reactant molecules before they can be converted to a product
• It shows the intermediate stages of a reaction, those between the initial and final states.
• It directly affects the rate of reactions.
• It speeds up a reaction by changing the mechanism and thus lowering the activation energy
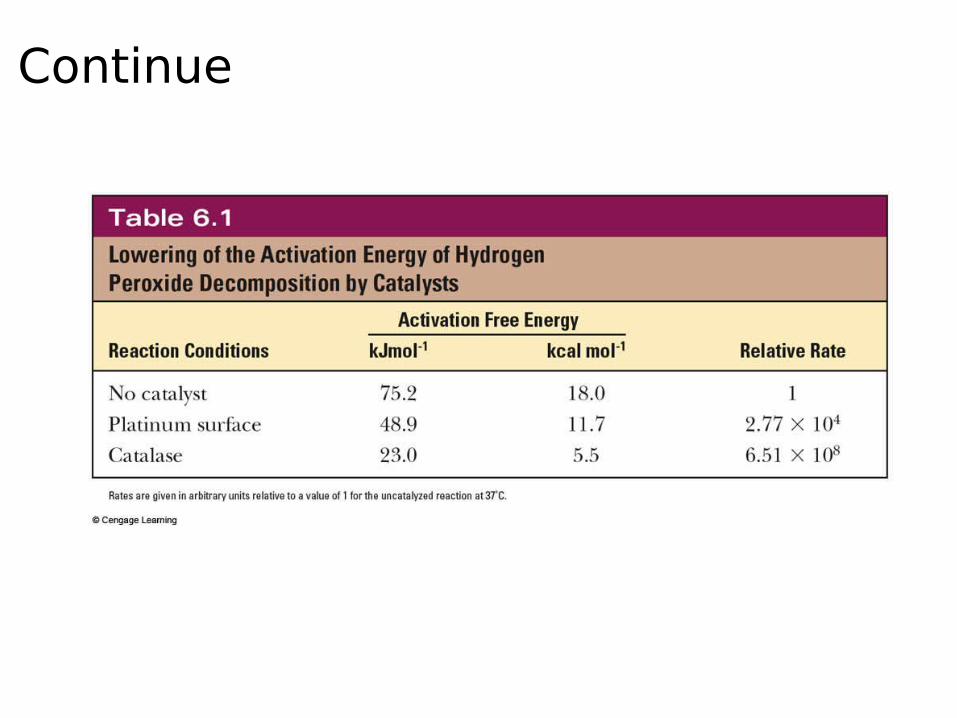
Continue
Continue
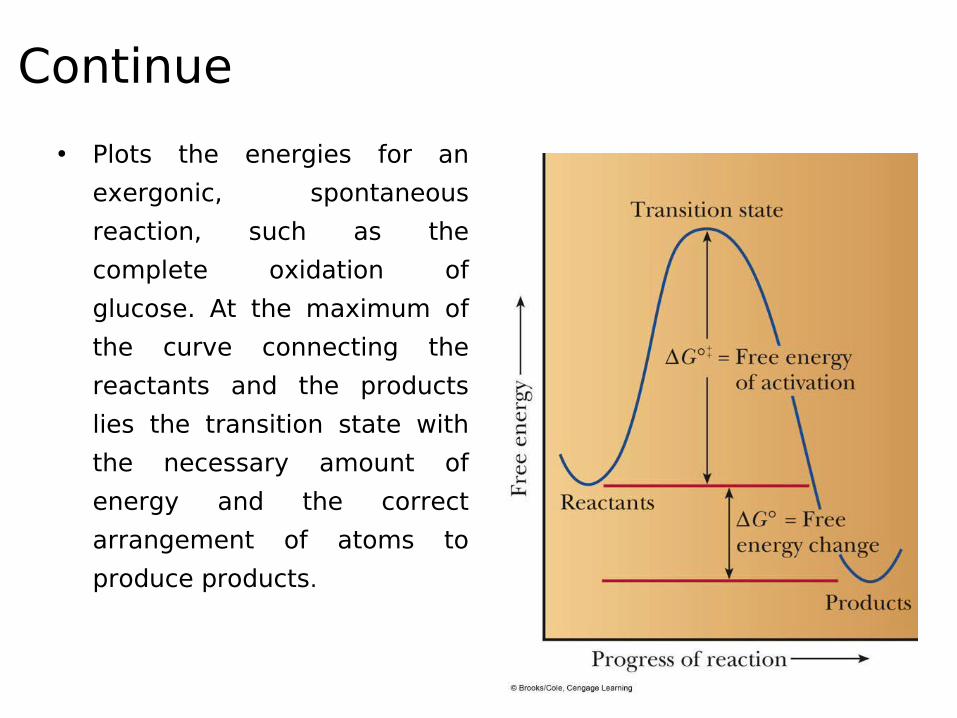
• Plots the energies for an
exergonic, spontaneous
reaction, such as the
complete oxidation of
glucose. At the maximum of
the curve connecting the
reactants and the products
lies the transition state with
the necessary amount of
energy and the correct
arrangement of atoms to
produce products.
Continue
• The activation energy can also be seen as the amount of free energy required to bring the reactants to the transition state.
• The change in energy corresponds to the change in elevation, and the progress of the reaction corresponds to the distance traveled
Continue
• Considerable effort has gone into elucidating the intermediate stages in reactions of interest chemists and biochemists and determining the pathway or reaction mechanism that lies between the initial and final states.
• Reaction dynamics, the study of the intermediate stages of reaction mechanism, is currently a very active field of research
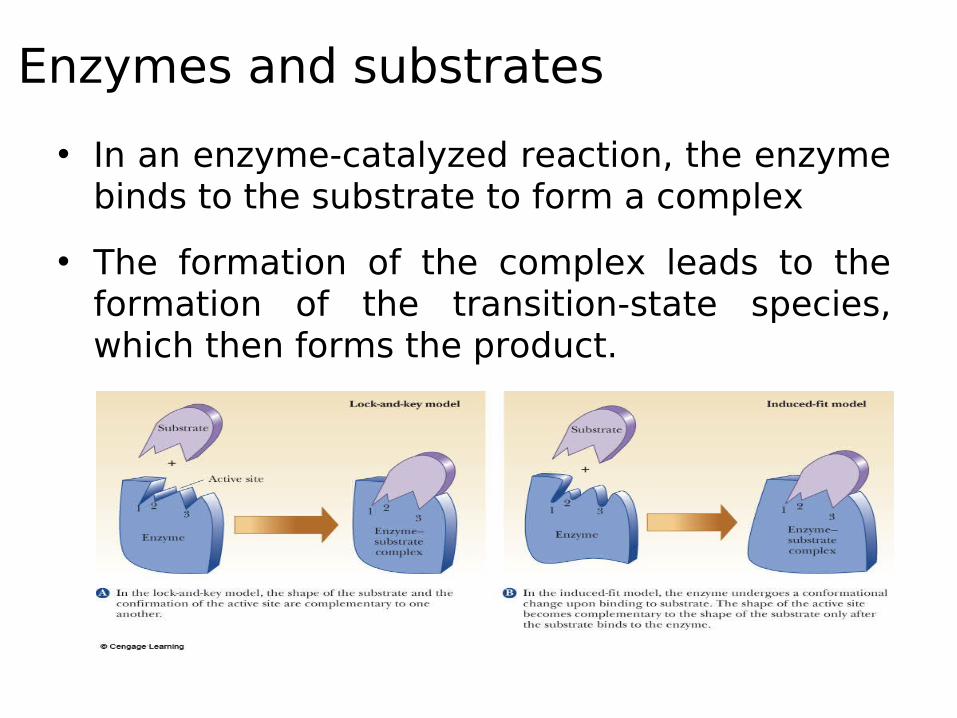
Enzymes and substrates
• In an enzyme-catalyzed reaction, the enzyme binds to the substrate to form a complex
• The formation of the complex leads to the formation of the transition-state species, which then forms the product.
Enzymes-substrate binding
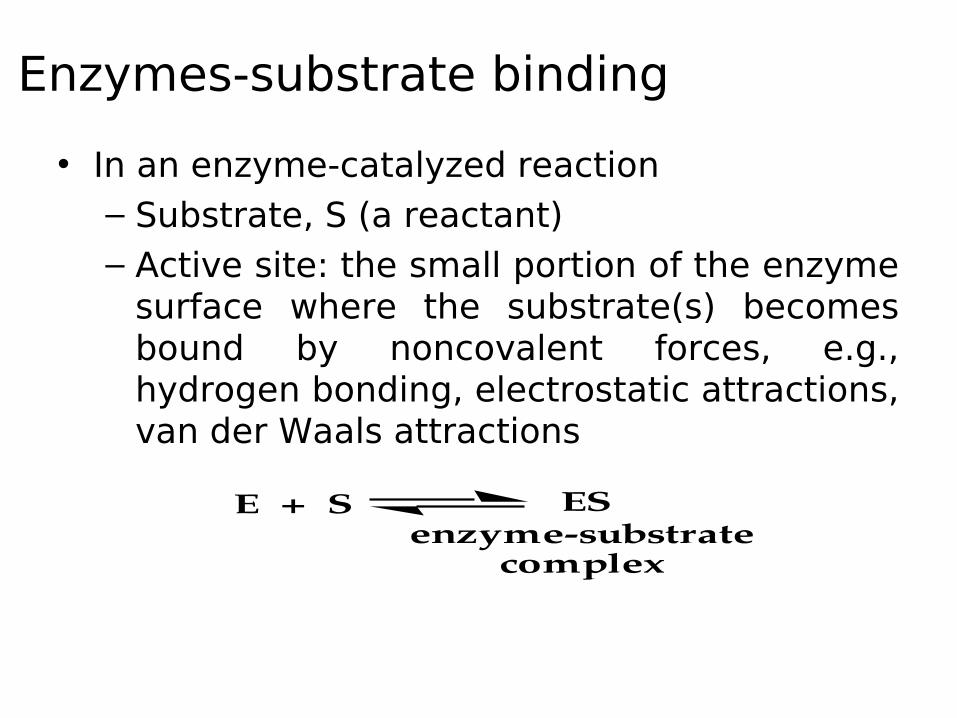
• In an enzyme-catalyzed reaction– Substrate, S (a reactant)– Active site: the small portion of the enzyme
surface where the substrate(s) becomes bound by noncovalent forces, e.g., hydrogen bonding, electrostatic attractions, van der Waals attractions
E + S ESenzymesubstrate
complex
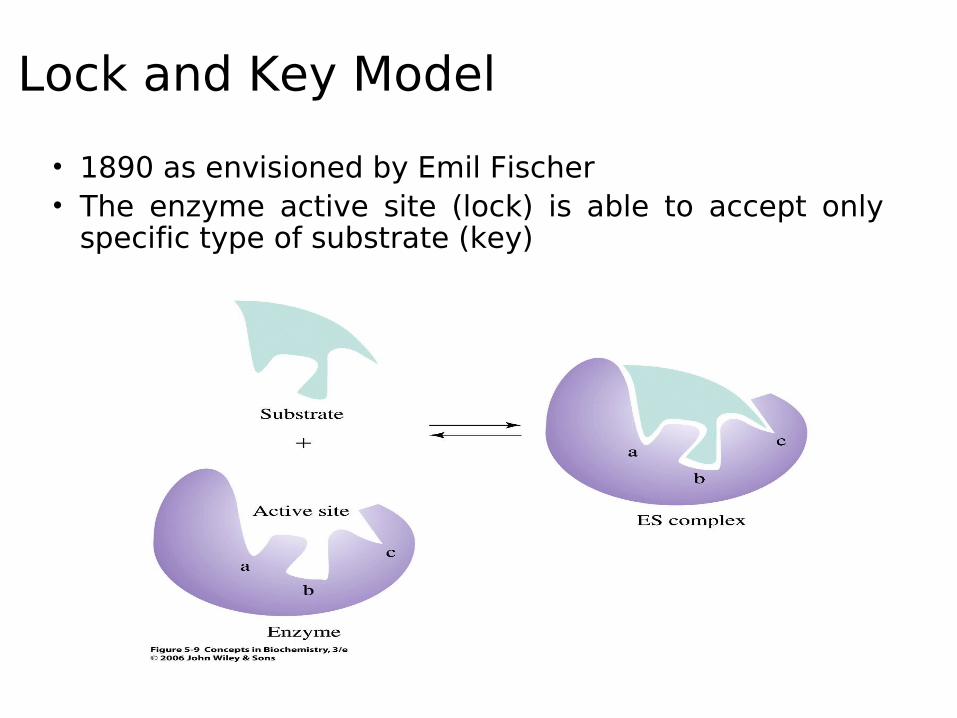
Lock and Key Model
• 1890 as envisioned by Emil Fischer• The enzyme active site (lock) is able to accept only
specific type of substrate (key)
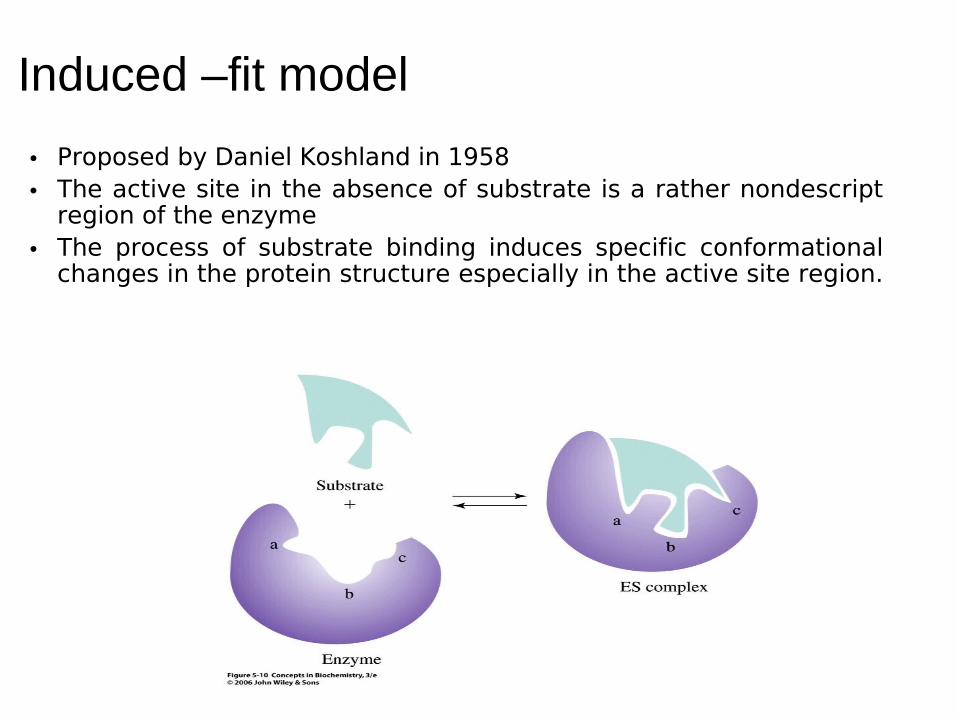
Induced –fit model
• Proposed by Daniel Koshland in 1958• The active site in the absence of substrate is a rather nondescript
region of the enzyme• The process of substrate binding induces specific conformational
changes in the protein structure especially in the active site region.
Continue
• The final shape and charge characteristics of the active site are not in place until the substrate is completely bound.
Enzyme Assay
• The amount of product formed in a given time period.
• The concentration of enzyme in a test sample can be determined by comparing its activity to a standard curve.