Embed Size (px)
Citation preview

El Niño/La Niña and its impact on summer monsoon precipitation over Indian
subcontinent
Seminar: II Course: AGM-692
Speaker: Jitendra Kumar Meher, Ph.D. 4th Semester
Department of Agricultural meteorology and Physics Faculty of Agriculture
Bidhan Chandra Krishi Viswavidyalay West Bengal-741252, India

Contents Slide 1
• Some Technical terms related to El Nino and La Nina
Introduction
• Historical chronology of events Review of Literature
• Development, identification, Global Impact, Impact on monsoon rainfall of India, Prediction tools
Objective
• Summary Summary
• References
References and Acknowledgement

Contents Slide 2
•Introduction
•Review of Literature
•Objective
•Conclusion
•References

Introduction Why is El Niño and La Niña are interesting??
Slide 3

Introduction Why is El Niño and La Niña are interesting?? Global Impacts
Figure 1
Slide 3
http://www.physicalgeography.net/fundamentals/7z.html

Introduction Why is El Niño and La Niña are interesting?? Global Impacts Mysterious history
Figure 1 Figure 2
Slide 3
https://en.wikipedia.org/wiki/Late_Victorian_Holocausts

Introduction
1.Anomaly The difference between value of a climatic variable (for e.g. Precipitation) at a given location and its long term average at that location. 2014 1961-1990 X Average of variable=Y • Anomaly of 2014= (x-y)
Some technical terms
Figure 3
Slide 4
https://www.ncdc.noaa.gov/sotc/global/201013

Introduction
2.Climatology Quantitative description of values of a variable (for e.g. Rainfall) averaged over a long period of time Year Average Daily rainfall 1979 x1 1978 x2 . . . . 2010 X30 climatology= Average(x1,x2,…,x30)
Some technical terms
Figure 4
Slide 5
https://climatedataguide.ucar.edu/climate-data/gpcp-monthly-global-precipitation-climatology-project

Introduction Some technical terms
3.Convection Transfer of heat from one place to another by the movement of fluids. More specifically, it refers to motion associated with a rising current of air.
Figure 5
Slide 6
http://www.esrl.noaa.gov/psd/outreach/education/science/convection/Sky.html

Introduction Some technical terms
4.Equatorial Upwelling Upward motion of
subsurface water toward the surface of the ocean.
This is often a source of cold and nutrient rich water.
Strong upwelling occurs along the equator where easterly winds are present.
Figure 6
Slide 7
http://www.lternet.edu/research/keyfindings/upwelling-matters

Introduction Some technical terms
5.Thermocline Thin but distinct layer in a Ocean/Lake in which temperature changes more rapidly with depth than it does in the layers above or below
Forms when water at the surface of an ocean or lake is heated up, while the water below stays cool
Figure 7
Slide 8
http://staff.concord.org/~btinker/GL/web/water/water_temperatures.html

Introduction Some technical terms
6.Trade winds/Equatorial Easterlies Blowing from the subtropical
highs (30° latitude) toward the low pressure region of the equator.
Northern Hemisphere: NE Trade Winds Southern Hemisphere: SE Trade Winds
Figure 8
Slide 9
https://www.aip.org/history/climate/xGenCirc.htm

Introduction Some technical terms
7.Teleconnections Climate anomalies being strongly and statistically related to each other at large distances (typically thousands of kilometers). Example: Linkage of sea-level pressure at Tahiti(Pacific) and Darwin, Australia, which defines the Southern Oscillation.
Figure 9
Slide 10
http://eesc.columbia.edu/courses/ees/climate/lectures/enso.html

El Niño La Niña
"El Niño“ in Spanish refers to “the Christ Child”-appear in Christmas
"La Niña" is Spanish refers to "the girl"
Introduction Some technical terms
Figure 11 Figure 10
Table 1
Slide 13

El Niño La Niña
"El Niño“ in Spanish refers to “the Christ Child”-appear in Christmas
"La Niña" is Spanish refers to "the girl"
Periodic warming in SST across the central and east-central equatorial Pacific.
Periodic cooling of SST across the central and east-central equatorial Pacific.
Introduction Some technical terms
Table 1
Slide 13
Figure 11 Figure 10

El Niño La Niña
"El Niño“ in Spanish refers to “the Christ Child”-appear in Christmas
"La Niña" is Spanish refers to "the girl"
Periodic warming in SST across the central and east-central equatorial Pacific.
Periodic cooling of SST across the central and east-central equatorial Pacific.
El Niño occurs every 3 to 5 years and lasts about 1 year
La Niña appear every 4-5 years and last for 1-2 years
Introduction Some technical terms
Table 1
Slide 13
Figure 11 Figure 10

Literature Review Slide 14
•Introduction
•Review of Literature
•Objective
•Conclusion
•References

Author Work Findings Eguigúren, 1894
Variety of primary and secondary sources. 1. Books: Histories and geographies of the
New World written by Spanish colonists and scholars.
2. contemporary descriptions of the coastal areas of northern Peru.
Analysed reports of rains in northern Peru Provided: Intensity index of these events for the period 1791–189 Connection between rainfall and the warm El Niño current
Literature Review
Table 2
Slide 15

Author Work Findings Eguigúren, 1894
Variety of primary and secondary sources. 1. Books: Histories and geographies of the
New World written by Spanish colonists and scholars.
2. contemporary descriptions of the coastal areas of northern Peru.
Analysed reports of rains in northern Peru Provided: Intensity index of these events for the period 1791–189 Connection between rainfall and the warm El Niño current
Walker, 1924
The relation/Teleconnection between Southern Oscillation and mean summer monsoon rainfall over India.
El Niño or warm Pacific event : India tends to experience a below-normal monsoon La Niña or cold Pacific event: Above-normal monsoon.
Walker and Bliss, 1932
Interannual variation of atmospheric patterns in connection with variations of the Indian monsoons.
Southern Oscillation Pressure: High over the pacific ocean Low over the Indian Ocean and converse.
Literature Review
Table 2
Slide 15

Author Work Findings Bjerknes, 1969
Connection between the El Niño and the Southern Oscillation.
1. Trade wind system over the tropical Pacific Ocean driven in part by the large-scale gradient of SST, cold in the east and warm in the west.
2. Warm water is normally driven westward by the surface winds. Warm surface water in the west promote ascending motion and convective rainfall, and the cold surface in the east promotes subsidence and stability in the atmosphere.
Literature Review
Table 2
Slide 16

Author Work Findings Bjerknes, 1969
Connection between the El Niño and the Southern Oscillation.
1. Trade wind over the tropical Pacific Ocean driven by the large-scale gradient of SST, cold in the east and warm in the west.
2. Warm water: driven westward by the surface winds.
Warm western Pacific: Ascending motion of air and convective rainfall Cold eastern Pacific: Subsidence and stability in the atmosphere
Quinn et al. 1978
El Niño type events and their intensities for the period 1861-1976. SOI record was used along with environmental data
1. Heavy precipitation: central and western equatorial Pacific
2. Droughts: Indonesia Closely associated with El Niño type events.
Literature Review
Table 2
Slide 16

Author Work Findings Kiladis & Diaz, 1989
Temperature and precipitation (1877-1988) anomalies of 1045 stations globally are calculated during various stage of an event in the southern oscillation.
El Niño is a local warming of surface waters that takes place in the entire equatorial zone of the central and eastern Pacific Ocean of the Peruvian coast and which affects the atmospheric circulation worldwide
Literature Review
Table 2
Slide 18

Author Work Findings Kiladis & Diaz, 1989
Temperature and precipitation (1877-1988) anomalies of 1045 stations globally are calculated during various stage of an event in the southern oscillation.
El Niño is a local warming of surface waters that takes place in the entire equatorial zone of the central and eastern Pacific Ocean of the Peruvian coast and which affects the atmospheric circulation worldwide
McPhaden, 1999
Identifying why it is so strong challenges our understanding of the physical mechanism responsible for El Niño.
Pacific Decadal Oscillation, the Madden-Julian Oscillation/the chaotic nature of atmosphere might produce ENSO
McPhaden et al., 1999
Genesis and Evolution of the 1997–1998 El Niño TOGA (Tropical Ocean Global Atmosphere)
The greatest success of TOGA program was the successful prediction and monitoring of the 1997-1998 El Niño.
Literature Review
Table 2 Figure 13
Slide 18
https://johncarlosbaez.wordpress.com/2014/08/18/el-nino-project-part-7/

Objective Slide 19
•Introduction
•Review of Literature
•Objective
•Conclusion
•References

To understand the mechanism of development of El Niño and La Niña
1
Objective Slide 20

To understand the mechanism of development of El Niño and La Niña
1
To identify an El Niño/La Niña episode? 2
Objective Slide 20

To understand the mechanism of development of El Niño and La Niña
1
To identify an El Niño/La Niña episode? 2
To visualise the Global Impact of El Niño 3
Objective Slide 20

To understand the mechanism of development of El Niño and La Niña
1
To identify an El Niño/La Niña episode? 2
To visualise the Global Impact of El Niño 3
To study the Impact of El Niño on monsoon rainfall of India
4
Objective Slide 20

To understand the mechanism of development of El Niño and La Niña
1
To identify an El Niño/La Niña episode? 2
To visualise the Global Impact of El Niño 3
To study the Impact of El Niño on monsoon rainfall of India
4
5 To study the prediction tools of El Niño and La Niña
Objective Slide 20

Mechanism of development of El Niño and La Niña
Objective 1 Slide 21

Mechanism (How??) What happens during these events?
Normal Year El Niño Year La Niña Year Pressure
Low pressure over western Pacific. High pressure over South America.
Pressure change =SO Higher pressure over western Pacific. Lower pressure over South America.
Lower than normal air pressure over the western Pacific. Higher than normal air pressure over South America.
Table 3
Slide 22
http://www.chm.bris.ac.uk/webprojects2002/yung/mechanisms.htm

Mechanism (How??) What happens during these events?
Normal Year El Niño Year La Niña Year Pressure
Low pressure over western Pacific. High pressure over South America.
Pressure change =SO Higher pressure over western Pacific. Lower pressure over South America.
Lower than normal air pressure over the western Pacific. Higher than normal air pressure over South America.
Table 3
Slide 22
http://www.chm.bris.ac.uk/webprojects2002/yung/mechanisms.htm Figure 14

Mechanism (How??) What happens during these events?
Normal Year El Niño Year La Niña Year Pressure
Low pressure over western Pacific. High pressure over South America.
Pressure change =SO Higher pressure over western Pacific. Lower pressure over South America.
Lower than normal air pressure over the western Pacific. Higher than normal air pressure over South America.
Table 3
Slide 22
http://www.chm.bris.ac.uk/webprojects2002/yung/mechanisms.htm Figure 14 Figure 15

Mechanism (How??) What happens during these events?
Normal Year El Niño Year La Niña Year Pressure
Low pressure over western Pacific. High pressure over South America.
Pressure change =SO Higher pressure over western Pacific. Lower pressure over South America.
Lower than normal air pressure over the western Pacific. Higher than normal air pressure over South America.
Flow of trend wind
Trade winds blow east to west.
Trade winds weaken or blow west to east.
Trade winds increase in strength and blow even stronger than normal from east to west
Table 3
Slide 22
http://www.chm.bris.ac.uk/webprojects2002/yung/mechanisms.htm
Figure 16

Mechanism (How??) What happens during these events?
Normal Year El Niño Year La Niña Year Pressure
Low pressure over western Pacific. High pressure over South America.
Pressure change =SO Higher pressure over western Pacific. Lower pressure over South America.
Lower than normal air pressure over the western Pacific. Higher than normal air pressure over South America.
Flow of trend wind
Trade winds blow east to west.
Trade winds weaken or blow west to east.
Trade winds increase in strength and blow even stronger than normal from east to west
Table 3
Slide 22
http://www.chm.bris.ac.uk/webprojects2002/yung/mechanisms.htm
Figure 16 Figure 17

Mechanism (How??) What happens during these events?
Normal Year El Niño Year La Niña Year Pressure
Low pressure over western Pacific. High pressure over South America.
Pressure change =SO Higher pressure over western Pacific. Lower pressure over South America.
Lower than normal air pressure over the western Pacific. Higher than normal air pressure over South America.
Flow of trend wind Trade winds blow east to west. Trade winds weaken or blow west to east. Trade winds increase in strength and blow even stronger than normal from east to west
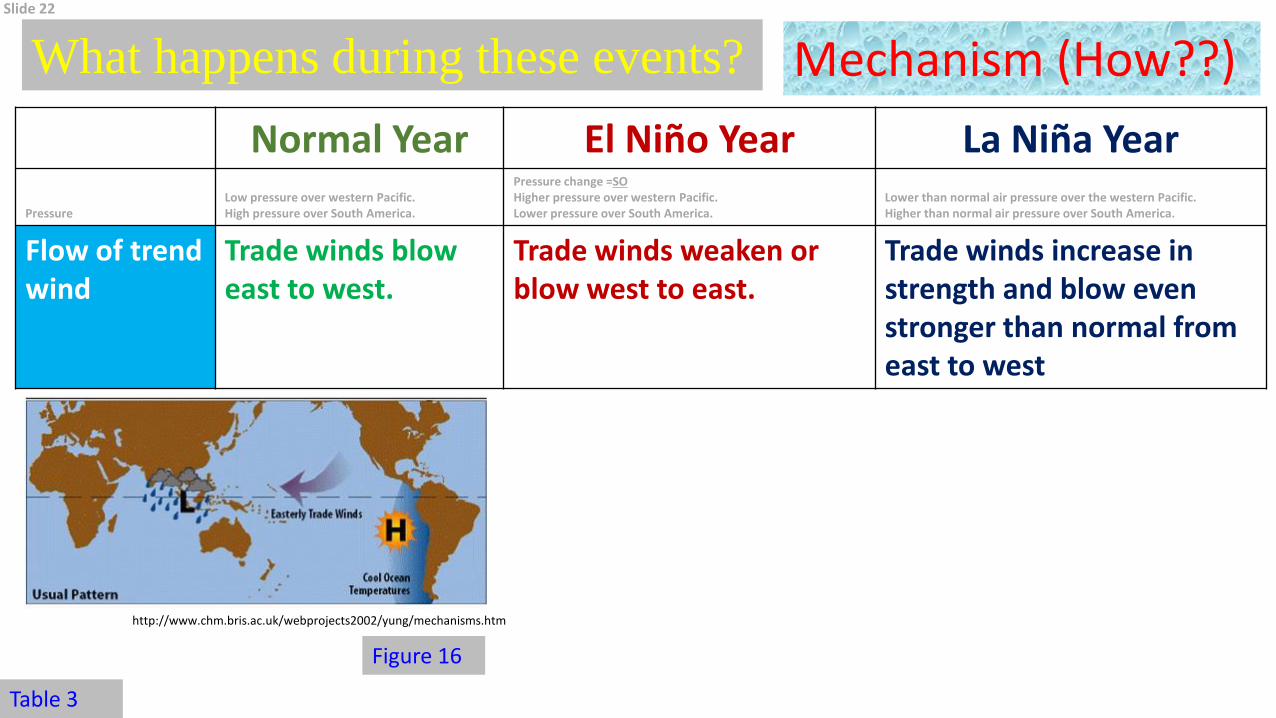
Position of thermocline
Shallow thermocline along South America. Deeper thermocline near western Pacific.
Deep themocline along South America Shallow thermocline along western Pacific.
Shallow thermocline along South America More than normal deeper thermocline near western Pacific.
Table 3
Slide 22
http://www.physicalgeography.net/fundamentals/7z.html
Figure 18
Mechanism (How??) What happens during these events?
Normal Year El Niño Year La Niña Year Pressure
Low pressure over western Pacific. High pressure over South America.
Pressure change =SO Higher pressure over western Pacific. Lower pressure over South America.
Lower than normal air pressure over the western Pacific. Higher than normal air pressure over South America.
Flow of trend wind Trade winds blow east to west. Trade winds weaken or blow west to east. Trade winds increase in strength and blow even stronger than normal from east to west
Position of thermocline
Shallow thermocline along South America. Deeper thermocline near western Pacific.
Deep themocline along South America Shallow thermocline along western Pacific.
Shallow thermocline along South America More than normal deeper thermocline near western Pacific.
Table 3
Slide 22
http://www.physicalgeography.net/fundamentals/7z.html
Figure 18 Figure 19

Mechanism (How??) What happens during these events?
Normal Year El Niño Year La Niña Year Pressure
Low pressure over western Pacific. High pressure over South America.
Pressure change =SO Higher pressure over western Pacific. Lower pressure over South America.
Lower than normal air pressure over the western Pacific. Higher than normal air pressure over South America.
Flow of trend wind Trade winds blow east to west. Trade winds weaken or blow west to east. Trade winds increase in strength and blow even stronger than normal from east to west
Position of thermocline Shallow thermocline along South America. Deeper thermocline near western Pacific.
Deep themocline along South America Shallow thermocline along western Pacific.
Shallow thermocline along South America More than normal deeper thermocline near western Pacific.
Upwelling lots of upwelling, cold water at surface.
little upwelling, warmer water at surface
More than normal upwelling brings cold, nutrient-rich waters to the surface.
Table 3
Slide 22

Mechanism (How??) What happens during these events?
Normal Year El Niño Year La Niña Year Pressure
Low pressure over western Pacific. High pressure over South America.
Pressure change =SO Higher pressure over western Pacific. Lower pressure over South America.
Lower than normal air pressure over the western Pacific. Higher than normal air pressure over South America.
Flow of trend wind Trade winds blow east to west. Trade winds weaken or blow west to east. Trade winds increase in strength and blow even stronger than normal from east to west
Position of thermocline Shallow thermocline along South America. Deeper thermocline near western Pacific.
Deep themocline along South America Shallow thermocline along western Pacific.
Shallow thermocline along South America More than normal deeper thermocline near western Pacific.
Upwelling lots of upwelling, cold water at surface. little upwelling, warmer water at surface More than normal upwelling brings cold, nutrient-rich waters to the surface.
Temperature of surface water
Warm ocean waters, clouds and moisture are pushed away from North America
Western Pacific Ocean: Colder Eastern Pacific near the coast of South America: Warmer Warm surface water sloshes back along equatorial Pacific
Western Pacific Ocean: Warmer Eastern Pacific near the coast of South America: Colder Warm ocean waters, clouds and moisture are pushed away from North America
Table 3
Slide 22

Cartoon of wind circulation during Normal/La Nina and El Niño
Mechanism (How??) What happens during these events?
Figure 20
Slide 23
Normal Condition El Nino Condition http://klimat.czn.uj.edu.pl/media/archive/3294.gif

Cartoon of wind circulation during Normal, El Niño and La Niña condition
Mechanism (How??) What happens during these events?
Figure 21
Slide 24
http://www.pmel.noaa.gov/tao/proj_over/diagrams/

Cartoon of upwelling, SST, and flow of water during Normal, El Niño and La Niña condition
Tropical Atmosphere Ocean project Mechanism (How??) What happens during these events?
Figure 22
Slide 25
http://www.pmel.noaa.gov/tao/proj_over/diagrams/

Trends since 1982-2010
Figure 23 Le and McPhaden, 2010
Slide 26

Mechanism (Why??..Still a mystery) Why does El Niño and La Niña occur??
Exact reason for why does they occur is still not understood.
Slide 26

Mechanism (Why??..Still a mystery) Why does El Niño and La Niña occur??
Exact reason for why does they occur is still not understood. They results from interaction between the surface layers of the ocean and the overlying atmosphere in tropical Pacific.
Slide 26

Mechanism (Why??..Still a mystery) Why does El Niño and La Niña occur??
Exact reason for why does they occur is still not understood. They results from interaction between the surface layers of the ocean and the overlying atmosphere in tropical Pacific. It is the internal dynamics of the coupled ocean-atmosphere system that determine the onset and termination of El Niño events.
Slide 26

Mechanism (Why??..Still a mystery) Why does El Niño and La Niña occur??
Exact reason for why does they occur is still not understood. They results from interaction between the surface layers of the ocean and the overlying atmosphere in tropical Pacific. It is the internal dynamics of the coupled ocean-atmosphere system that determine the onset and termination of El Niño events. The physical processes are complicated, but they involve unstable air-sea interaction and planetary scale oceanic waves. The system oscillates between warm (El Niño) to neutral (or cold) conditions with a natural periodicity of roughly 3-4 years.
Slide 26

Mechanism (Why??..Still a mystery) Why does El Niño and La Niña occur??
Exact reason for why does they occur is still not understood. They results from interaction between the surface layers of the ocean and the overlying atmosphere in tropical Pacific. It is the internal dynamics of the coupled ocean-atmosphere system that determine the onset and termination of El Niño events. The physical processes are complicated, but they involve unstable air-sea interaction and planetary scale oceanic waves. The system oscillates between warm (El Niño) to neutral (or cold) conditions with a natural periodicity of roughly 3-4 years. External forcing from volcanic eruptions (submarine or terrestrial) have no connection with El Niño. Nor do sunspots as far as we know. TAO
Slide 26

How to identify which is an El Niño/La Niña episode?
Objective 2 Slide 27

Different Nino regions
NINO1+2 (0-10S, 80-90W). Typically warms first when an El Niño event develops.
http://iridl.ldeo.columbia.edu/maproom/ENSO/ENSO_Info.html#tabs2
Figure 24
Slide 28
https://www.ncdc.noaa.gov/teleconnections/enso/indicators/sst.php

Different Nino regions
NINO1+2 (0-10S, 80-90W): Typically warms first when an El Niño event develops. NINO3 (5S-5N; 150W-90W): Largest variability in sea-surface temperature on El Niño time scales.
http://iridl.ldeo.columbia.edu/maproom/ENSO/ENSO_Info.html#tabs2
Slide 28
Figure 24

Different Nino regions
NINO1+2 (0-10S, 80-90W): Typically warms first when an El Niño event develops. NINO3 (5S-5N; 150W-90W): Largest variability in sea-surface temperature on El Niño time scales. NINO3.4 (5S-5N; 170W-120W) • Closer (than NINO3) to the region where
changes in local sea-surface temperature are important for shifting rainfall
• Typically located in the far western Pacific.
http://iridl.ldeo.columbia.edu/maproom/ENSO/ENSO_Info.html#tabs2
Slide 28
Figure 24

Different Nino regions
NINO1+2 (0-10S, 80-90W): Typically warms first when an El Niño event develops. NINO3 (5S-5N; 150W-90W): Largest variability in sea-surface temperature on El Niño time scales. NINO3.4 (5S-5N; 170W-120W). • Closer (than NINO3) to the region where
changes in local sea-surface temperature are important for shifting rainfall
• Typically located in the far western Pacific. NINO4 (5S-5N: 160E-150W): Changes of SST lead to 27.50C. 27.50 :Important threshold in producing rainfall
http://iridl.ldeo.columbia.edu/maproom/ENSO/ENSO_Info.html#tabs2
Slide 28
Figure 24

Year
Oceanic Nino Index (ONI): De-facto standard, NOAA ONI calculation: Running 3-month mean SST anomaly for the Niño 3.4 region (i.e., 5oN-5oS, 120o-170oW).
El Niño and La Niña events since 1950 to 2015, 8-El
Niños and 5 El-Niñas
Identify an El Niña/La Niña episode?
Slide 29
Figure 25

Year
Oceanic Nino Index (ONI): De-facto standard, NOAA ONI calculation: Running 3-month mean SST anomaly for the Niño 3.4 region (i.e., 5oN-5oS, 120o-170oW). Events: 5 consecutive overlapping 3-month periods at or above/below 0.50 anomaly as El Niño/La Niña.
El Niño and La Niña events since 1950 to 2015, 8-El
Niños and 5 El-Niñas
Identify an El Niña/La Niña episode?
Slide 29
Figure 25

Year
Oceanic Nino Index (ONI): De-facto standard, NOAA ONI calculation: Running 3-month mean SST anomaly for the Niño 3.4 region (i.e., 5oN-5oS, 120o-170oW). Events: 5 consecutive overlapping 3-month periods at or above/below 0.50 anomaly as El Niño/La Niña. Categorised by SST anomaly Weak: 0.5 to 0.9 Moderate: 1.0 to 1.4 SST anomaly Strong: 1.5 to 1.9 SST anomaly Very Strong: ≥ 2.0 SST anomaly
El Niño and La Niña events since 1950 to 2015, 8-El
Niños and 5 El-Niñas
Identify an El Niña/La Niña episode?
Slide 29
Figure 25

Sustained negative value of SOI below −8 : El Niño Sustainted positive values of SOI above +8 : La Niña
Identify an El Niña/La Niña episode?
Figure 26
Slide 30
http://www.bom.gov.au/climate/glossary/soi.shtml

Sustained negative value of SOI below −8 : El Niño Sustainted positive values of SOI above +8 : La Niña
Long term average 1933 to 1992
Identify an El Niña/La Niña episode?
Figure 26
Figure 27
Slide 30
http://www.bom.gov.au/climate/glossary/soi.shtml

Cartoon of global SST anomaly during El Niño(1997) and La Niña (1988) condition
El Niño La Niña
Identify an El Niña/La Niña episode?
Figure 28
Slide 31
https://www.nc-climate.ncsu.edu/climate/patterns/ENSO.html

Global impact of El Niño and La Niña
Objective 3 Slide 32

Global Impact
Brush Fire
Hurricanes Anchovy population
Flood Figure 29 Figure 31
Figure 30 Figure 32 Table 4
Slide 33

El Niño La Niña El Niño conditions tend to suppress the development of tropical storms and hurricanes in the Atlantic, but increase the number of tropical storms over the eastern and central Pacific Ocean.
La Niña's cooling of the equatorial Pacific tend to favor hurricane formation in the western Atlantic
Global Impact of El Niño
Table 5
Slide 34

El Niño La Niña El Niño conditions tend to suppress the development of tropical storms and hurricanes in the Atlantic, but increase the number of tropical storms over the eastern and central Pacific Ocean.
La Niña's cooling of the equatorial Pacific tend to favor hurricane formation in the western Atlantic
Increased rainfall across the southern tier of the US and in Peru, destructive flooding, and drought in the West Pacific, Monsoon failure in India, sometimes associated with devastating brush fires in Australia
La Niña usually brings colder winters to the Canadian west and Alaska, and drier, warmer weather to the American southeast.
Global Impact of El Niño
Table 5
Slide 34

Global Impact of El Niño
Author Work Findings Ropelewski and Halpert, 1987
Global and Regional Scale Precipitation Patterns Associated with the El Niño/Southern Oscillation
El Niño years generally bring drought in northeastern Brazil, southern Africa, and the western Pacific, and wetter conditions to southern Brazil, Uruguay, Peru, and equatorial East Africa
Table 6
Slide 35

Global Impact of El Niño
Author Work Findings Ropelewski and Halpert, 1987
Global and Regional Scale Precipitation Patterns Associated with the El Niño/Southern Oscillation
El Niño years generally bring drought in northeastern Brazil, southern Africa, and the western Pacific, and wetter conditions to southern Brazil, Uruguay, Peru, and equatorial East Africa
Canby, 1984 Studied on multiple cyclones stroked to French Polynesia on 1982-83
In the South Pacific during the 1982–1883 El Niño, ocean surface warming allowed six cyclones to strike French Polynesia, a region not usually prone to experiencing intense tropical storms.
Glantz, 2001 El Ni˜no’s Impact on Climate and Society (Book) collapse of the Peruvian anchoveta fishery following the 1972–1973 El Niño
Table 6 Figure 33
Slide 35

Author Work Findings Sharon E. Nicholson and Jeeyoung Kim, 1997
Comprehensive study of the rainfall response over Africa to ENSO episodes in the Pacific for the period 1901-1990
ENSO modulates rainfall over much of the African continent. The strongest signals are in the areas of eastern equatorial and south-eastern Africa. ENSO episodes that influence rainfall over Africa are those which are manifested as SST variation in the low-latitude Atlantic & western Indian Oceans
Global Impact of El Niño
Table 6
Slide 36

Author Work Findings Sharon E. Nicholson and Jeeyoung Kim, 1997
Comprehensive study of the rainfall response over Africa to ENSO episodes in the Pacific for the period 1901-1990
ENSO modulates rainfall over much of the African continent. The strongest signals are in the areas of eastern equatorial and south-eastern Africa. ENSO episodes that influence rainfall over Africa are those which are manifested as SST variation in the low-latitude Atlantic & western Indian Oceans
Sponberg, 1999
Studied on the climatologically impact of 1997-98 El Niño
Weather-related disasters and disease outbreaks during 1997-98 El Niño claimed over 2.2 Lakh lives worldwide and caused US$36 billion dollars in economic losses.
Supplee, 1999; WMO, 1999
Studied on the climatologically impact of 1997-98 El Niño
1997-98 El Niño was also responsible for severe droughts in Papua New Guinea, Indonesia, Central America, and northeastern Brazil.
Global Impact of El Niño
Table 6
Slide 36

Author Work Findings Changnon, 1999 WMO, 1999
Impacts of the 1997–1998 El Niño-Generated Weather in the US Scientific and Technical Retrospective on 1997-98 El Niño
For the US as a whole, the 1997–1998 El Niño produced a net economic gain of about $16 billion dollars and resulted in 650 fewer deaths than would have otherwise occurred Atlantic hurricanes significantly reduced to 1. US Midwest and grate lakes: Mildest (Warmer) winter in over 100 year, Reduced heating bills. Shrimp catch increased off the coast of Ecuador, with export revenues rising by 40% in 1997.
Global Impact of El Niño
Table 6
Slide 37

Author Work Findings Changnon, 1999 WMO, 1999
Impacts of the 1997–1998 El Niño-Generated Weather in the US Scientific and Technical Retrospective on 1997-98 El Niño
For the US as a whole, the 1997–1998 El Niño produced a net economic gain of about $16 billion dollars and resulted in 650 fewer deaths than would have otherwise occurred Atlantic hurricanes significantly reduced to 1. US Midwest and grate lakes: Mildest (Warmer) winter in over 100 year, Reduced heating bills. Shrimp catch increased off the coast of Ecuador, with export revenues rising by 40% in 1997.
McPhaden, 2000
Causes and Global Consequences of El Niño and La Niña
La Niña weather impacts include an increased probability of unusually rainy conditions in southern Africa and northeastern Brazil, and in the monsoon regions of India, Indonesia and Northern Australia.
Global Impact of El Niño
Table 6
Slide 37

Author Work Findings Nicholson et al. 2001
Identified characteristic differences between those episodes during which drought occurs and those in which it does not occur over Botswana Evolution of the Southern Oscillation index (SOI) and of SSTs in key sectors of the Atlantic, Pacific, and Indian Oceans during ENSO episodes between 1946 and 1992 is examined.
In the Pacific there is weaker and less consistent warming in the wet Botswana composite than in the dry Botswana composite, especially in the central and western Pacific probability of a wet season is very low at any time during the second half of an ENSO episode, but it is particularly low for the April–June (AMJ) season (i.e., AMJ of the post-ENSO year)
Global Impact of El Niño
Table 6
Slide 38

Author Work Findings Nicholson et al. 2001
Identified characteristic differences between those episodes during which drought occurs and those in which it does not occur over Botswana Evolution of the Southern Oscillation index (SOI) and of SSTs in key sectors of the Atlantic, Pacific, and Indian Oceans during ENSO episodes between 1946 and 1992 is examined.
In the Pacific there is weaker and less consistent warming in the wet Botswana composite than in the dry Botswana composite, especially in the central and western Pacific probability of a wet season is very low at any time during the second half of an ENSO episode, but it is particularly low for the April–June (AMJ) season (i.e., AMJ of the post-ENSO year)
Wang et al. 2007
The impacts of El Niño and La Niña on the U.S. climate during northern summer (1901-2004).
Continental-scale anomalous high dominates over most of North America during La Niña events and leads to hot and dry summers over the central United States. However, the impacts of El Niño over North America are weaker and more variable.
Global Impact of El Niño
Table 6
Slide 38

Impact of El Niño and La Niña on monsoon rainfall of
India
Objective 4 Slide 39

Sir G. Walker: Quantity of rainfall in the Indian subcontinent was often negligible in the years of high pressure at Darwin (and low pressure at Tahiti).
ENSO relation with MSLP at Darwin and Tahiti Slide 40

Sir G. Walker: Quantity of rainfall in the Indian subcontinent was often negligible in the years of high pressure at Darwin (and low pressure at Tahiti).
Conversely, low pressure at Darwin bode well for the precipitation quantity in India. Thus he established the relationship of Southern Oscillation with quantities of Monsoon rains in India.
The ENSO is known to have a pronounced effect on the strength of SW Monsoon over India with the Monsoon being weak (causing droughts in India) during the El Niño years
La Niña years had particularly good Monsoon strength over India.
ENSO relation with MSLP at Darwin and Tahiti Slide 40

Plot of standardized, all-India summer monsoon rainfall and summer Niño3 anomaly index. Severe drought and drought free
years during El Niño events (standardized Niño3 anomalies >1) are shown in red and green, respectively
Years with moderate to extreme cold states (Niño3 index < -1), have had abundant monsoon rains without exception. On the other hand, years of moderate to extreme warm states (Niño3 Index > -1) have not been reliably dry.
Figure 34
Slide 41
Gadgil, 2014

Plot of standardized, all-India summer monsoon rainfall and summer Niño3 anomaly index. Severe drought and drought free
years during El Niño events (standardized Niño3 anomalies >1) are shown in red and green, respectively
Years with moderate to extreme cold states (Niño3 index < -1), have had abundant monsoon rains without exception. On the other hand, years of moderate to extreme warm states (Niño3 Index > -1) have not been reliably dry. The six leading droughts since 1871 have occurred along with a standardized Niño3 index > +1, but the presence of El Niños has not guaranteed drought.
Figure 34
Slide 41
Gadgil, 2014

Plot of standardized, all-India summer monsoon rainfall and summer Niño3 anomaly index. Severe drought and drought free
years during El Niño events (standardized Niño3 anomalies >1) are shown in red and green, respectively
Years with moderate to extreme cold states (Niño3 index < -1), have had abundant monsoon rains without exception. On the other hand, years of moderate to extreme warm states (Niño3 Index > -1) have not been reliably dry. The six leading droughts since 1871 have occurred along with a standardized Niño3 index > +1, but the presence of El Niños has not guaranteed drought. No simple association describes the relation between the Indian monsoon and Niño3 SSTs when moderate to strong El Niño conditions exist
Figure 34
Slide 41
Gadgil, 2014

All-India summer monsoon rainfall (1871-2014)
http://www.tropmet.res.in/~kolli/MOL/Monsoon/Historical/aismr1871-2014.pdf
All-India area-weighted mean summer monsoon rainfall, based on a homogeneous rainfall data set of 306 rain gauges, developed by the IITM, Pune
Figure 35
Slide 42

El Niño Vs Drought, La Niña Vs Flood (1871-2014)
http://www.tropmet.res.in/~kolli/MOL/Monsoon/Historical/aismr1871-2014.pdf
Drought Year (El Niño) 1873, 1877, 1899, 1901, 1904, 1905, 1911, 1918, 1920, 1941, 1951, 1965, 1966, 1968, 1972, 1974, 1979, 1982, 1985, 1986, 1987, 2002,
2004, 2009. Exception: El Niño still no deficit of rainfall
1900, 1944, 1976, 1997, 1906
Slide 43

El Niño Vs Drought, La Niña Vs Flood (1871-2014)
http://www.tropmet.res.in/~kolli/MOL/Monsoon/Historical/aismr1871-2014.pdf
Drought Year (El Niño) 1873, 1877, 1899, 1901, 1904, 1905, 1911, 1918, 1920, 1941, 1951, 1965, 1966, 1968, 1972, 1974, 1979, 1982, 1985, 1986, 1987, 2002,
2004, 2009. Exception: El Niño still no deficit of rainfall
1900, 1944, 1976, 1997, 1906
Flood Year (La Niña) 1874, 1878, 1892, 1893, 1894, 1910, 1916, 1917, 1933, 1942, 1947,
1956, 1959, 1961, 1970, 1975, 1983, 1988, 1994. Exception: La Niña still not more than normal rainfall
1999, 2000
Slide 43

Parameter
Indian Summer Monsoon Rainfall, 1880-2008
Deficit
< - 1.0
Below Normal
- 0.5 to 0.5
Near Normal
-0.5 to 0.5
Above Normal
0.5 to 1.0
Excess
> 1.0
Total
El Niño 7 5 5 0
1
18
Normal 14 13 39 14 6 86
La Niña 0 0 7 7 10 24
Total 21 18 51 21 17 128
Niño /La Niño association with all-India summer monsoon rainfall
anomalies during 1880-2008.
Table 7
Slide 44

Parameter
Indian Summer Monsoon Rainfall, 1880-2008
Deficit
< - 1.0
Below Normal
- 0.5 to 0.5
Near Normal
-0.5 to 0.5
Above Normal
0.5 to 1.0
Excess
> 1.0
Total
El Niño
7 5 5 0 1
(1944) 18
Normal 14 13 39 14 6 86
La Niña 0 0 7 7 10 24
Total 21 18 51 21 17 128
Niño /La Niño association with all-India summer monsoon rainfall
anomalies during 1880-2008.
Table 7
Slide 45

Prediction tools of El Niño and La Niña
Objective 5 Slide 46

prediction tools of El Niño and La Niña 1. Computer models and
statistical/Numerical based methods 2. Ocean and atmosphere measuring
devices • For example : Moored and drifting buoys
and satellites.
Measures...
• Air and SST
• Water currents
• Winds
• Salinity
• Air pressure Figure 36
Slide 47

prediction tools of El Niño and La Niña 1. Computer models and
statistical/Numerical based methods 2. Ocean and atmosphere measuring
devices • For example : Moored and drifting buoys
and satellites.
Measures...
• Air and SST
• Water currents
• Winds
• Salinity
• Air pressure
• Oceans: 70% of the earth’s surface • Ships, buoys and other in situ
instruments can’t possible cover that much space
• Measure wind, waves, temperature of the sea surface, ocean color, ocean surface currents, and tides.
Figure 30 Figure 37
Slide 48
prediction tools of El Niño and La Niña
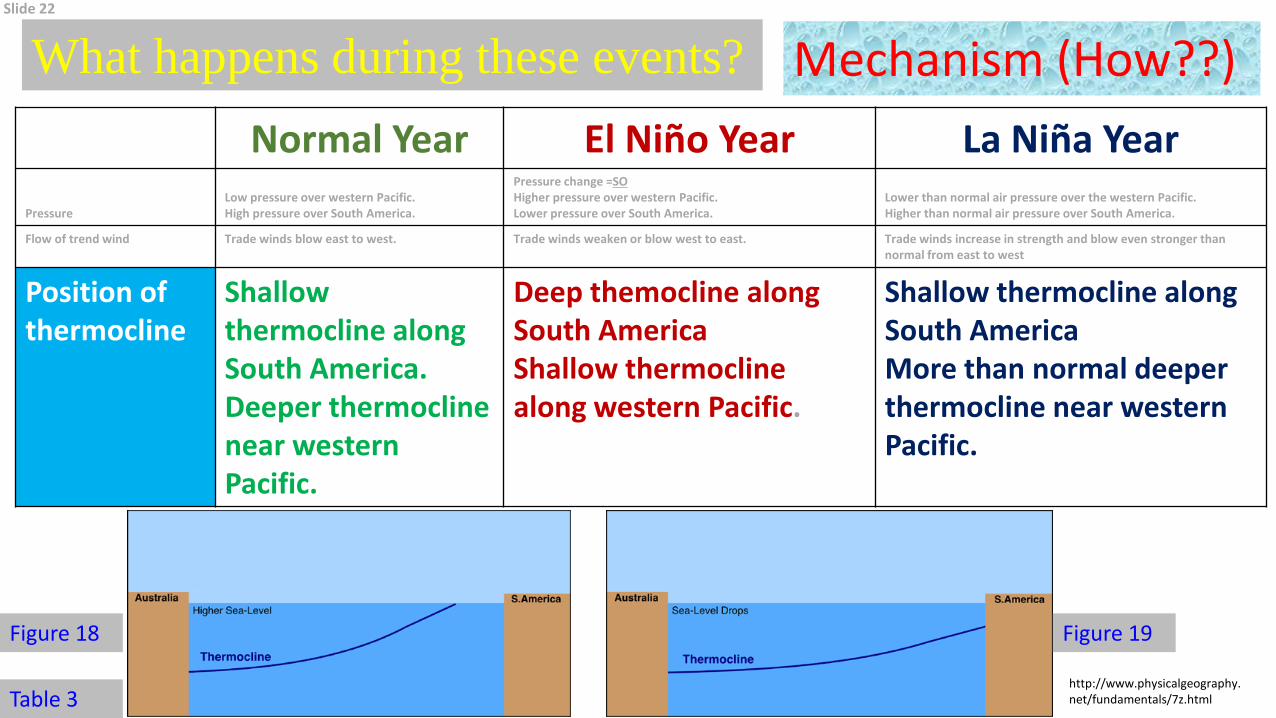
Example: TOPEX/Poseidon (T/P)
• August 10, 1992-Jan 18, 2006 • Must Successful: 1997-98 El Niño • Joint satellite mission between NASA and
CNES, the French space agency, to map ocean surface topography.
• Covers earth in 10 days • Measures: Satellite's distance from the
ocean's surface and tells about the ocean's surface currents, winds, and wave heights.
• Jason-2 (Successor of T/P), June 20, 2008-Till data
Figure 38
Slide 49

Summary Slide 50
•Introduction
•Review of Literature
•Objective
•Summary
•References

El Niño and La Niña both develop due to large-scale interaction of Ocean and atmosphere. SST and Sea surface pressure are the main drivers of these processes.
Slide 51
Summary

El Niño and La Niña both develop due to large-scale interaction of Ocean and atmosphere. SST and Sea surface pressure are the main drivers of these processes.
El Niño and La Niña can be identified from the ONI and SOI.
Slide 51
Summary

El Niño and La Niña both develop due to large-scale interaction of Ocean and atmosphere. SST and Sea surface pressure are the main drivers of these processes.
El Niño and La Niña can be identified from the ONI and SOI. Both of them have significant impact on a global scale due to
teleconnection. The Impact are more devastating than fortunate.
Slide 51
Summary

El Niño and La Niña both develop due to large-scale interaction of Ocean and atmosphere. SST and Sea surface pressure are the main drivers of these processes.
El Niño and La Niña can be identified from the ONI and SOI. Both of them have significant impact on a global scale due to
teleconnection. The Impact are more devastating than fortunate. El Niño episode is characterised by deficient/less than normal rainfall in
Indian subcontinent.
Slide 51
Summary

El Niño and La Niña both develop due to large-scale interaction of Ocean and atmosphere. SST and Sea surface pressure are the main drivers of these processes.
El Niño and La Niña can be identified from the ONI and SOI. Both of them have significant impact on a global scale due to
teleconnection. The Impact are more devastating than fortunate. El Niño episode is characterised by deficient/less than normal rainfall in
Indian subcontinent. La Niña episode is characterised by more than normal rainfall in the
Indian subcontinent. Prediction of El Niño and La Niña can be easily done by modern
techniques such as Bouys and Satellites as well as numerical models.
Slide 51
Summary

References Slide 52
•Introduction
•Review of Literature
•Objective
•Conclusion
•References

References Bjerknes, J. (1969). Atmospheric teleconnections from the equatorial pacific 1.Monthly Weather Review, 97(3), 163-172.Canby, T Y (1984). El Niño’s Ill Wind, Natl. Geogr., 165(2), 144–183 Changnon, S A (1999). Impacts of the 1997–1998 El Niño-Generated Weather in the US, Bull. Am. Meteorl. Soc., 80, 1819–1827. Diaz, K and Markgraf, V. (1998). Flood Data, in El Niño – Historical and Paleoclimatic Aspects of the Southern Oscillation, eds Cambridge University Press, Cambridge, 119–149. Eguigúren, V. (1894). Las lluvias en Piura. Bol. Soc. Geogr. Lima, 4, 241–258. Glantz, M H (2001). Currents of Change: El Niño’s Impact on Climate and Society, Cambridge University Press, Cambridge, 1–252. Kiladis, G. N., & Diaz, H. F. (1989). Global climatic anomalies associated with extremes in the Southern Oscillation. Journal of Climate, 2(9), 1069-1090. McPhaden, M J (1999). Genesis and Evolution of the 1997–1998 El Ni˜no, Science, 283, 950–954 McPhaden, M. J. (1999) El Niño and La Niña: Causes and Global Consequences, The Earth system: physical and chemical dimensions of global environmental change, 1:pp 353–370 McPhaden, M. J. (1999). El Niño: The child prodigy of 1997-98. Nature, 398(6728), 559-562. Nicholson, S. E., & Kim, J. (1997). The relationship of the El Niño-Southern oscillation to African rainfall. International Journal of Climatology, 17(2), 117-135. Nicholson, S. E., Leposo, D., & Grist, J. (2001). The relationship between El Niño and drought over Botswana. Journal of Climate, 14(3), 323-335. Quinn, W H (1992). A Study of Southern Oscillation-related Climatic Activity for AD 622–1900 Incorporating Nile River Quinn, W H, Neal, V T, and Antunez de Mayolo, S E (1987). El Niño Occurrences over the Past Four and a Half Centuries, J. Geophys. Res., 92, 14 449–14 461. Quinn, W. H., D. O. Zorf, K. S. Short, and R. T. W.Kao Yang, (1978). Historical trends and statistics of the Southern Oscillation, El Niño, and Indonesian droughts. Fish. Bull., 76, 663–678. Ropelewski, C F & Halpert, M (1987). Global and Regional Scale Precipitation Patterns Associated with the El Niño/Southern Oscillation, Mon. Weather Rev., 115, 1606–1626 Sponberg, K (1999). Compendium of Climatological Impacts, National Oceanic and Atmospheric Administration, Washington DC, 62 Sulochana Gadgil, 2014. El Niño and the summer monsoon of 2014. CURRENT SCIENCE. 106:10. Supplee, C (1999). El Niño/La Niña, Nat. Geo., 195(3), 72–95. WALKER, G. T. (924). World Weather II. Mem. India Meteor. Dep. 24:275-332 Walker, G. T., & Bliss, E. W. (1932). World weather. V. Mem. Roy. Meteor. Soc., 4, 53 Wang, Z., Chang, C. P., & Wang, B. (2007). Impacts of El Niño and La Niña on the US climate during northern summer. Journal of climate, 20(10), 2165-2177. WMO (1999). The 1997–1998 El Niño Event: a Scientific and Technical Retrospective, WMO No. 905,World Meteorological Organization, Geneva, Switzerland, 93 Lee, T., & McPhaden, M. J. (2010). Increasing intensity of El Niño in the central‐equatorial Pacific. Geophysical Research Letters, 37(14).
Slide 53

Acknowledgement
Declaration •This work is solely related to educational purpose
•I acknowledge all the website authorities from where the figures and tables are taken. •The works or scientific papers cited in this presentation are highly acknowledged for making them online.
Slide 54