Embed Size (px)
Citation preview
Dot plot interpretationDot plot interpretation
Submitted by:Shweta KumariRoll no: 21M.Sc Bioinformatics2nd semesterSession: 2014-16
ContentContent Introduction Principle Example Dot plot interpretation Analysis of dot plot matrix
Identical sequence Direct repeat Inverted repeat Palindromic sequence Frame shifts Low complexity region
Application Limitation Dot plot software References
IntroductionIntroduction
In bioinformatics a dot plot is a graphical method that allows the comparison of two biological sequences and identify regions of close similarity between them.
Introduced by GIBBS and MCLNTYE in 1970.
It is the one way to visualize that similarity between two protein and nucleotide sequences by uses a similarity matrix.
PrinciplePrinciple
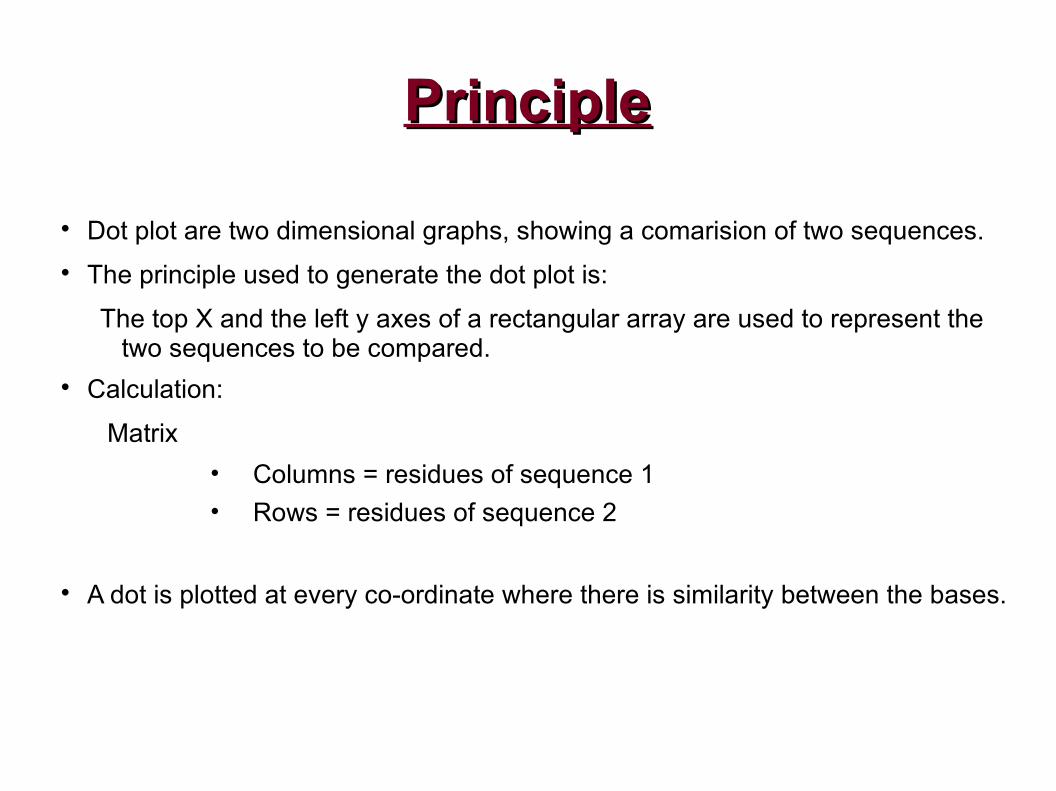
Dot plot are two dimensional graphs, showing a comarision of two sequences.
The principle used to generate the dot plot is:
The top X and the left y axes of a rectangular array are used to represent the two sequences to be compared.
Calculation:
Matrix
• Columns = residues of sequence 1
• Rows = residues of sequence 2
A dot is plotted at every co-ordinate where there is similarity between the bases.
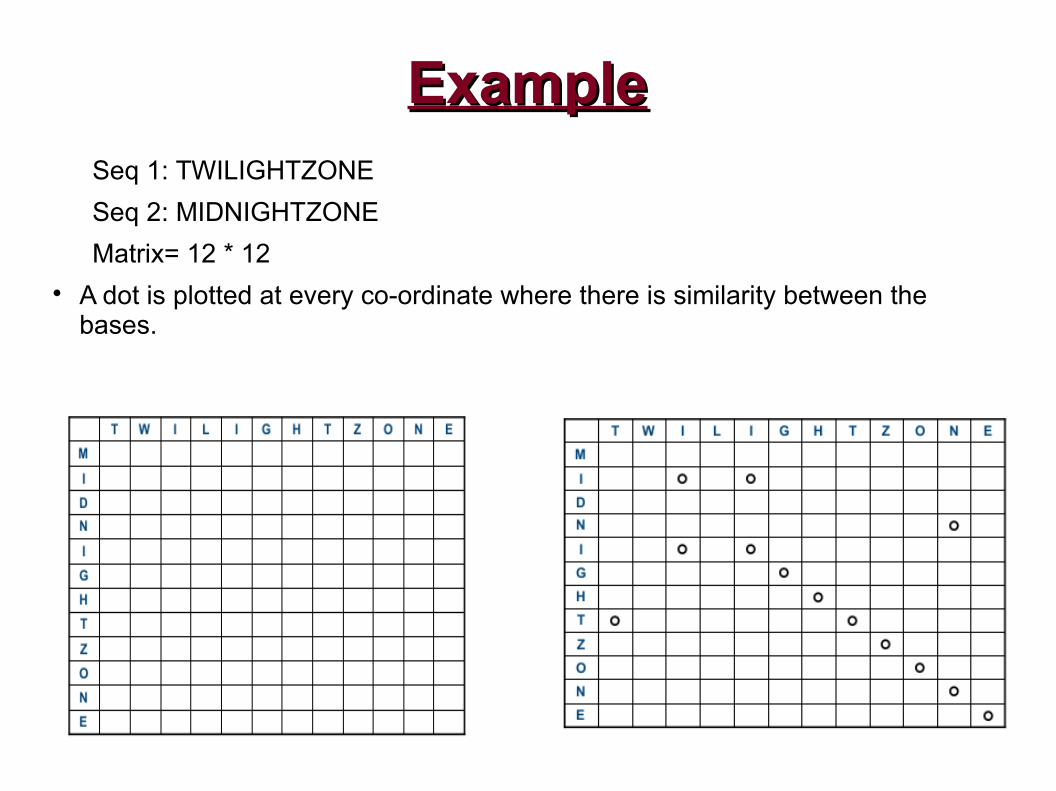
ExampleExampleSeq 1: TWILIGHTZONE
Seq 2: MIDNIGHTZONE
Matrix= 12 * 12 A dot is plotted at every co-ordinate where there is similarity between the
bases.
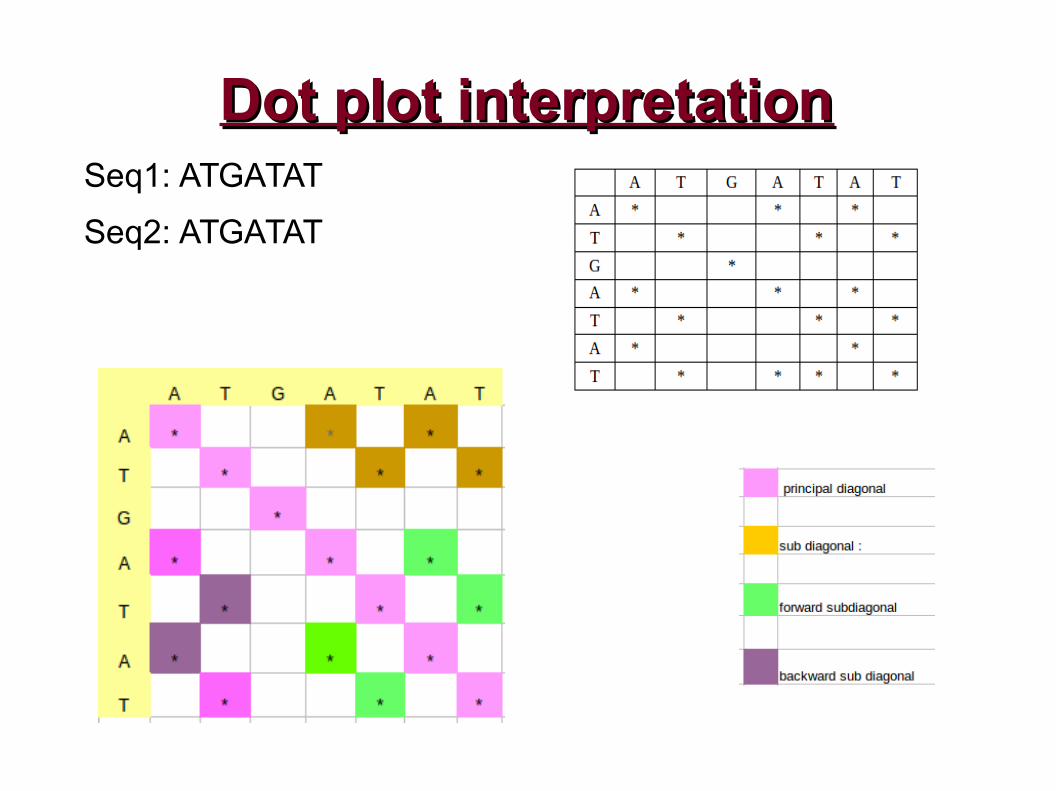
Dot plot interpretationDot plot interpretationSeq1: ATGATAT
Seq2: ATGATAT
Analysis of dot plot matrixAnalysis of dot plot matrix
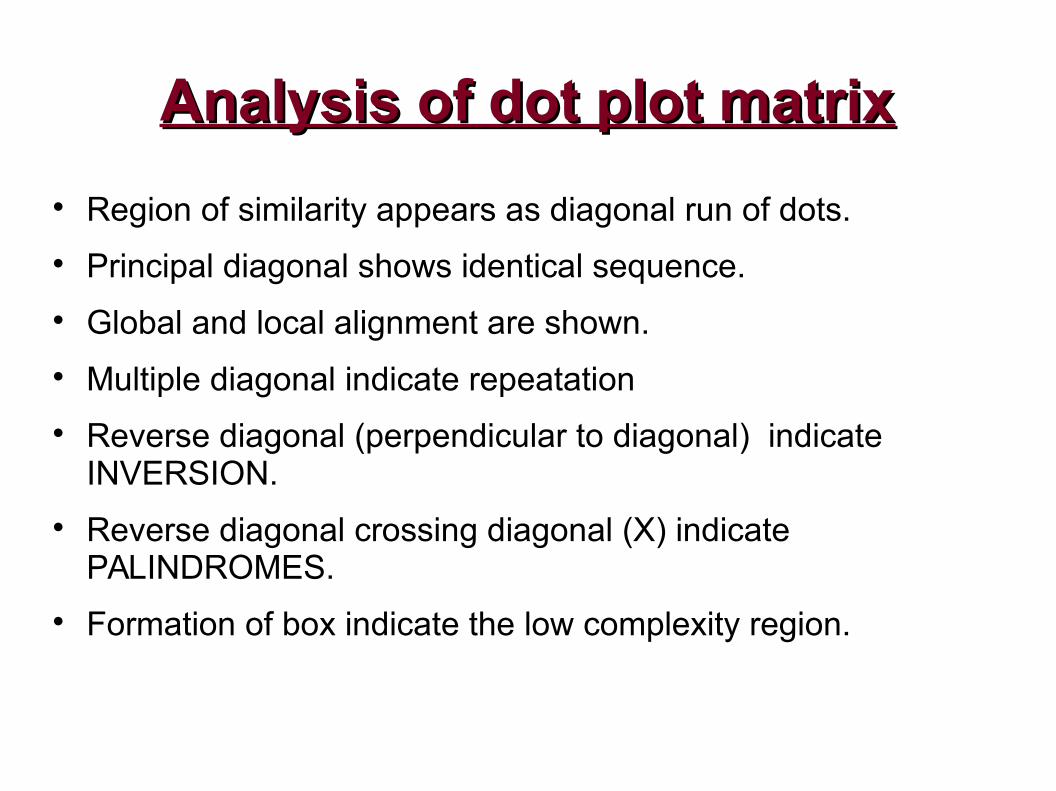
Region of similarity appears as diagonal run of dots.
Principal diagonal shows identical sequence.
Global and local alignment are shown.
Multiple diagonal indicate repeatation
Reverse diagonal (perpendicular to diagonal) indicate INVERSION.
Reverse diagonal crossing diagonal (X) indicate PALINDROMES.
Formation of box indicate the low complexity region.
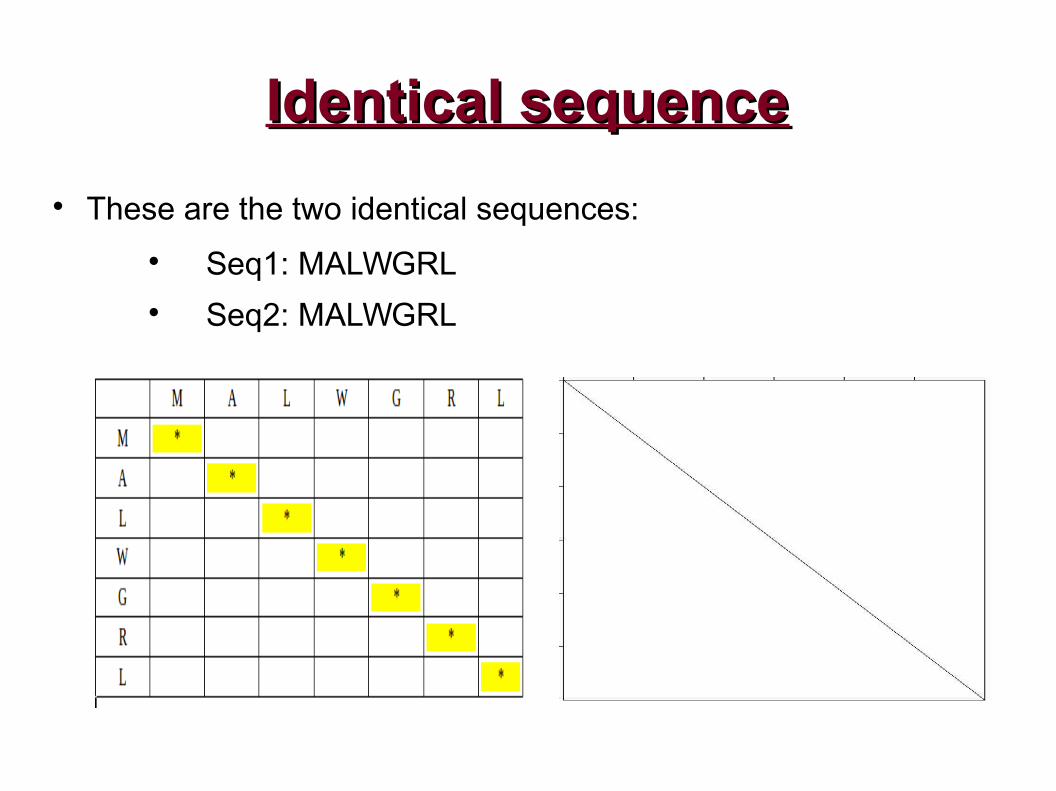
Identical sequenceIdentical sequence
These are the two identical sequences:
Seq1: MALWGRL Seq2: MALWGRL
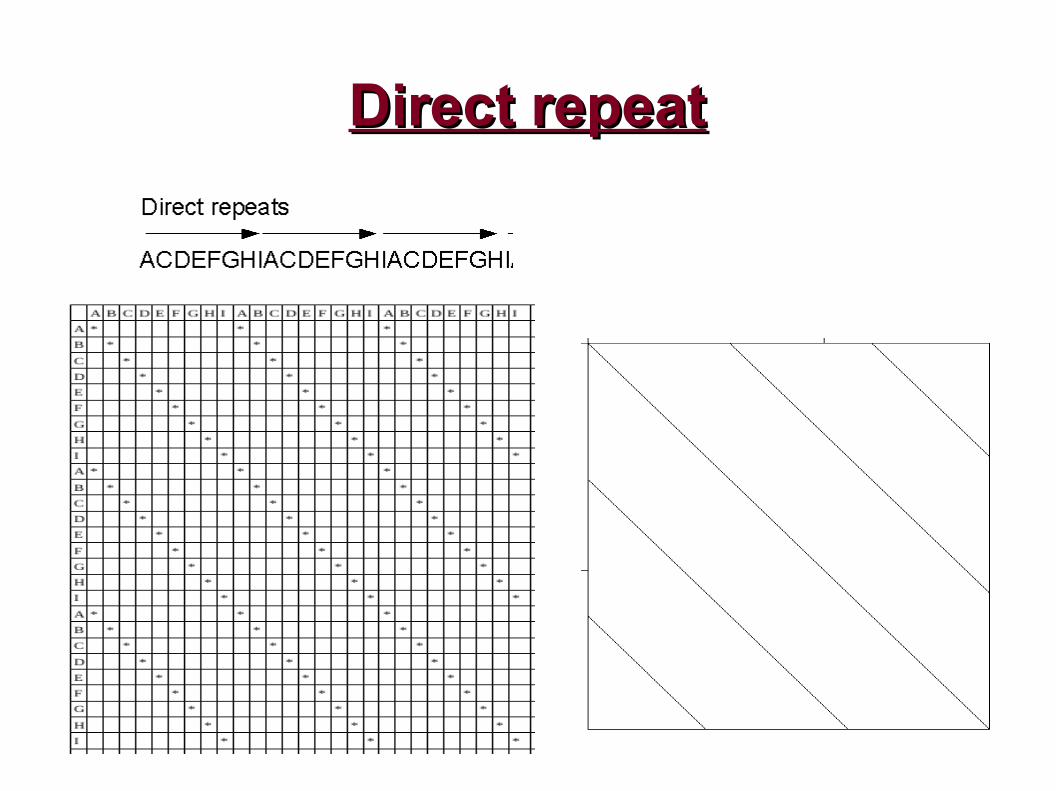
Direct repeatDirect repeat
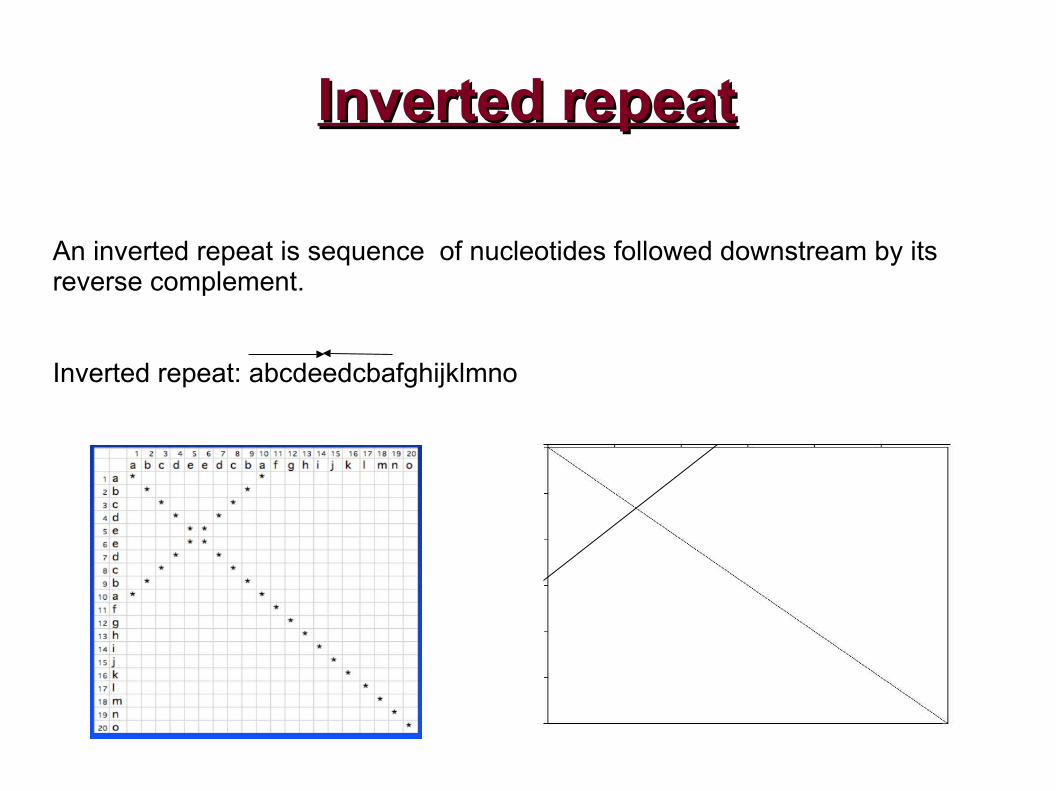
Inverted repeatInverted repeat
An inverted repeat is sequence of nucleotides followed downstream by its reverse complement.
Inverted repeat: abcdeedcbafghijklmno
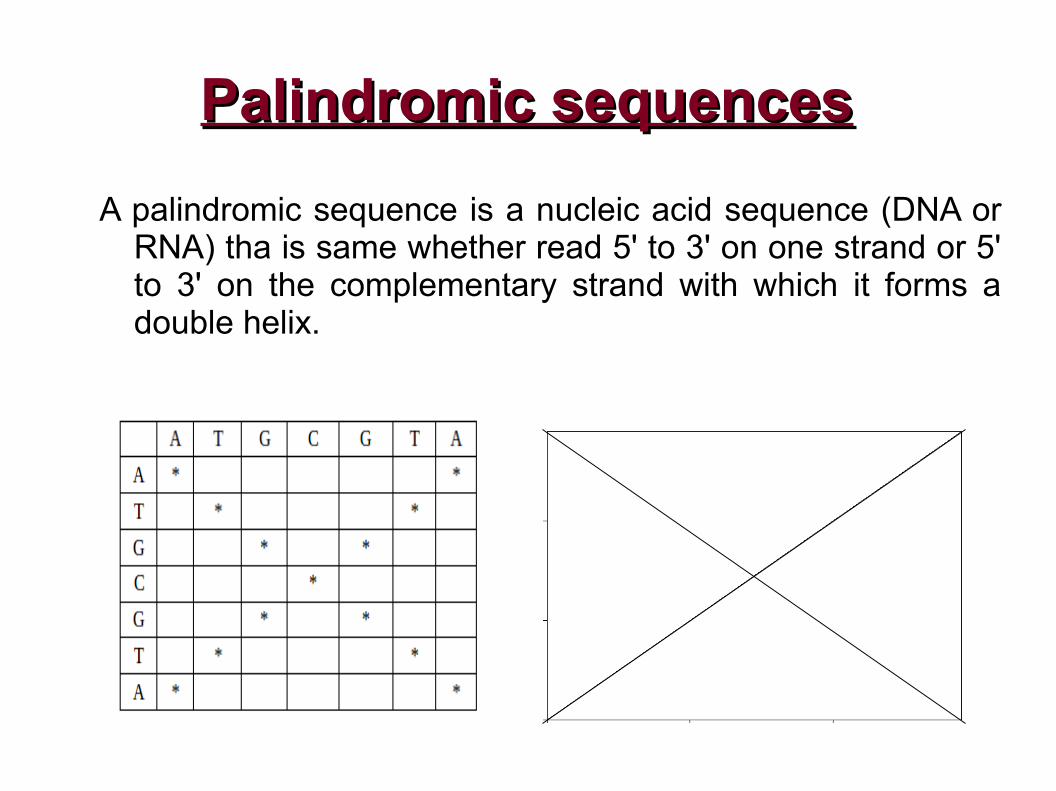
Palindromic sequencesPalindromic sequences
A palindromic sequence is a nucleic acid sequence (DNA or RNA) tha is same whether read 5' to 3' on one strand or 5' to 3' on the complementary strand with which it forms a double helix.
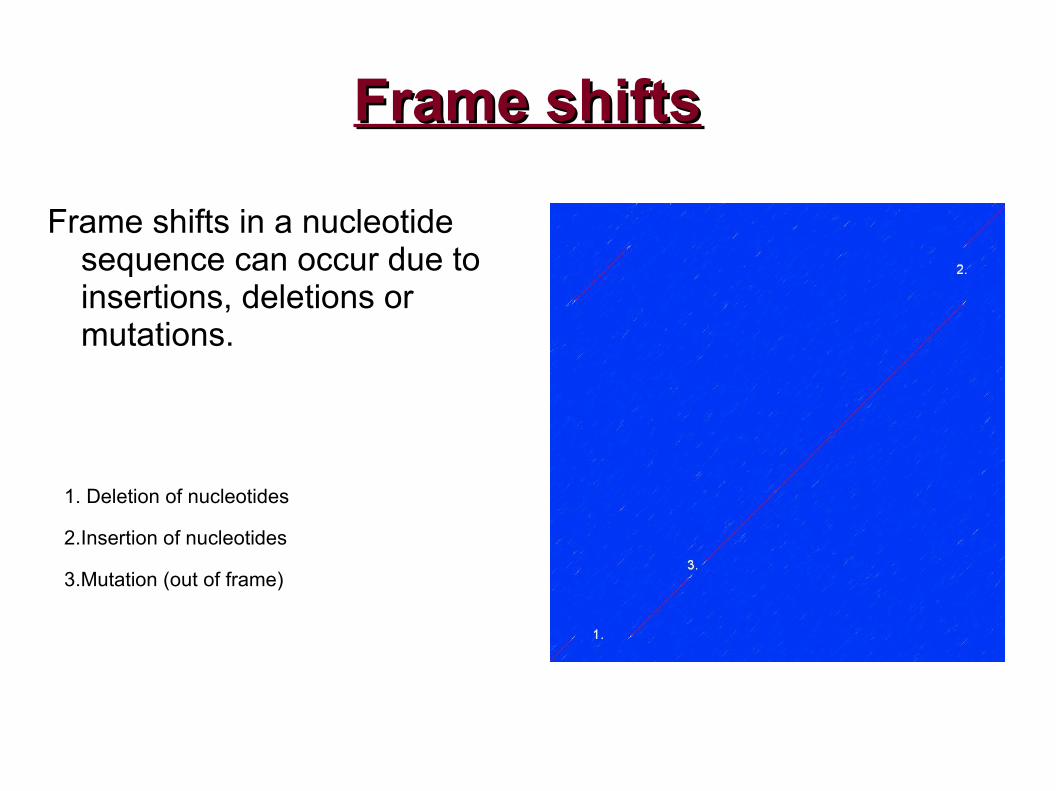
Frame shiftsFrame shifts
Frame shifts in a nucleotide sequence can occur due to insertions, deletions or mutations.
1. Deletion of nucleotides
2.Insertion of nucleotides
3.Mutation (out of frame)
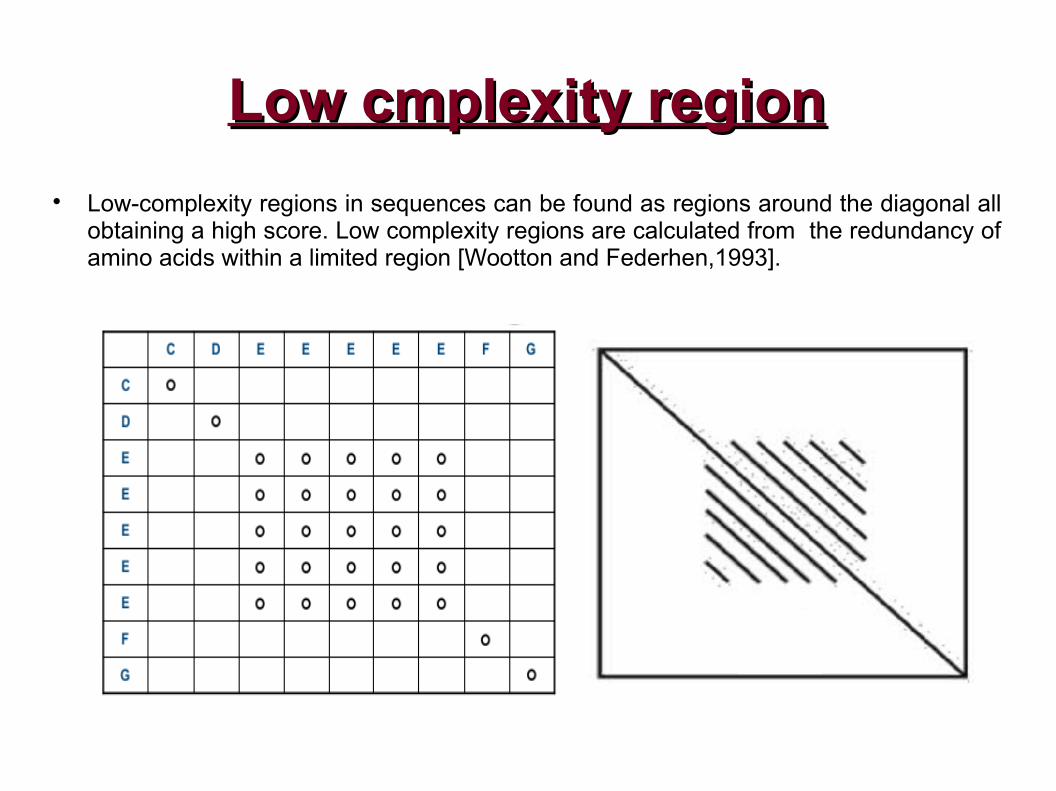
Low cmplexity regionLow cmplexity region
Low-complexity regions in sequences can be found as regions around the diagonal all obtaining a high score. Low complexity regions are calculated from the redundancy of amino acids within a limited region [Wootton and Federhen,1993].
ApplicationApplication
Shows the all possible alignment between two nucleic acid and amino acid sequences.
All kind of local and global aligment can be traped.
Help to recognise large region of simiarity.
To find self base pairing of RNA (eg, tRNA) by comparing a sequence to itself complemented and reverse.
An excellent approach for finding sequence transposition.
To find the location of genes between two genomes.
To find the non sequential alignment.
LimitationLimitation
For longer sequence, memory required for the graphical representation is very high. So long sequnece can not be aligned.
Lots of insignifcant matches makes it noisy (so many off diagonal appear).
Time required to compare two sequences is proportional to the product of length of the squences time of the search window.
i.e, higher efficiency of short sequence. Low efficiency of long sequence.
Dot plot softwareDot plot software
GCG is a commercial software, hence not possible to use all the time.
Instead of this, we can use the EMBOSS package, which are followig:
Dotmatcher Dotpath Polydot Dottup
(http://emboss.bioinformatics.nl/cgi-bin/emboss/dottup)
ReferencesReferences● Bioinformatics Principal and Applications by Zhumur Ghosh
and Bibekanand Mallick
● Bioinformatics concepts, skill & applications, second edition by S.C.Rastogi, Namita Mendriatta, Parag Rastogi
http://en.wikipedia.org/wiki/Dot_plot_%28bioinformatics%29
http://www.code10.info/index.php?option=com_content&view=article&id=64:inroduction-to-dot-plots&catid=52:cat_coding_algorithms_dot-plots&Itemid=76
http://lectures.molgen.mpg.de/Pairwise/DotPlots/
https://ugene.unipro.ru/wiki/pages/viewpage.action?pageId=4227426
http://www.clcsupport.com/clcgenomicsworkbench/650/Examples_interpretations_dot_plots.html