Embed Size (px)
Citation preview
MIT –Biology Science Outreach
1
DNA Microarray Technology.What is it and how is it useful?
Mandana Sassanfar and Graham WalkerDepartment of Biology
Massachusetts Institute of TechnologyCambridge, MA
NOTE: The following material was developed for high school audiences familiar with the structureof DNA and the central dogma of molecular biology.
THE AUTHORS:
Mandana Sassanfar received her Ph.D from Cornell University and is currently an Instructor inbiology and the science outreach coordinator for the Department of Biology at MIT.
GrahamWalker received his PhD from the University of Illinois. He is a Professor of Biology, anAmerican Cancer Society Research Professor, a Howard Hughes Medical Institute Professor and theHoward Hughes Medical Institute Undergraduate Education Program Director at MIT.
The material presented here can be used alone or as a complement to a lecture given by Eric Lander,Professor of Biology at MIT and director of the MIT/Whitehead Genome Center, at the HowardHughes Medical Institute in 2002.
The lecture by Professor Eric Lander “Human Genomics: A New Guide For Medicine” isavailable on a DVD produced by the Howard Hughes Medical Institute as part of the 2002 HHMIHoliday lecture series “Scanning Life’s Matrix ; genes, proteins, and small molecules” .
The concepts covered in chapter 20-29 of lecture 3 “Human Genomics: A New Guide ForMedicine” are particularly relevant to the interactive class activity described in part D.
A free copy of the DVD lecture can be obtained through HHMI's online catalog(http://www.hhmi.org/biointeractive/order.html)
Copyright 2003 MIT Dept of Biology
MIT –Biology Science Outreach
2
TABLE of CONTENT
A. What students must already know:This part provides a list of concepts that students should be familiar with in order to
comprehend DNA microarray technology and its application.
B. DNA Microarray Technology: This part provide a description and discussion of the DNA microarray technology, how to
prepare a DNA chip, and how to use it to follow the activity of many genes simultaneously in
a cell.
C. DNA microarray technology flow chartThis color flow chart shows the various steps required to compare gene expression between 2
populations of cells using DNA microarrays
D. Interactive Class Exercise on DNA Microarray and Medicine:This is an interactive classroom activity in which students mimic genes on a DNA chip.Students do not need to understand the details of the DNA microarray technology to do this
activity. Rather students must be able to observe a common pattern of gene expression forvarious cancer patients and decide if a specific drug would be effective for the treatment of
various patients with different subtype of cancers.
Copyright 2003 MIT Dept of Biology
MIT –Biology Science Outreach
3
A. What students must already know.
• The structure of DNA and the definition of a gene.
• The central dogma of molecular biology: DNA is transcribed into mRNA which in turn is
translated into proteins which have enzymatic activity and make things happen in the cell.
• What information one can obtain from sequencing a gene:
The sequence of the protein it encodesCan guess the function of the geneCan look for the presence of mutationsCan compare the gene sequence and the protein it encodes in different animal species.Can study the evolution of genes
• Gene expression: The sequence of a gene does not give information about it’s activity. A
gene must be transcribed into mRNA to be expressed (or turned ON). The level ofexpression (or activity) of a gene can therefore be studied by measuring how much
corresponding mRNA is made (transcribed) from a particular gene.
• The sequence of a gene is complementary to the sequence of its mRNA. Therefore the
mRNA can base pair (or hybridize) to the DNA strand it was copied from (template strand).Scientists study gene expression by measuring the amount of mRNA for different genes.
• Humans are diploid and have two sets of each gene, one from Mom and one from Dad.
The two copies can be identical or different . Mutations can be inherited or accumulate
during our lifetime.
• ALL of our cells contain the exact same DNA sequence. All cells arose from a single cell(the egg). However different type of cells in the body express different sets of genes. For
example, a liver cell expresses some of the same genes expressed in lung cells or skin cells
but also expresses genes that no other cell type expresses (liver-specific genes). As a resultliver cells look different from other cells in the body and do things that no other cell can do.
• Reversetranscriptase is an enzyme found in retroviruses. It can make DNA from RNA.
Copyright 2003 MIT Dept of Biology
MIT –Biology Science Outreach
4
B. DNA MICROARRAY TECHNOLOGY
Usefulness of the DNA microarray technology;
• Can follow the activity of MANY genes at the same time.
• Can get a lot of results fast
• Can COMPARE the activity of many genes in diseased and healthy cells
• Can categorize diseases into subgroups
Drawback:
• Too much data all at once. Can take quite a while to analyze all the results.
• The results may be too complex to interpret
• The results are not always reproducible
• The results are not always quantitative enough
• The technology is still too expensive
How to set up for a Microarray experiment. (See low diagram on page 6)
There are three parts to the experiments:
I. Preparing a DNA chip (or buying one)
II. Carrying out the reaction (isolate mRNA, process the mRNA and hybridize to DNA chip)
III. Collecting and analyzing the results
I. Preparing a DNA chip
• You must know the sequence (or part of the sequence) of all the genes you want to
study.• You must synthesize a piece of each gene as a short single strand DNA (oligonucleotide)
about 25 bases long. This 25-base sequence will be sufficient to hybridize specifically toa complementary sequence of RNA or DNA.
• You must fix the short DNA sequences for each gene on a tiny spot on a glass slide
(usually the DNA fragments are synthesized directly on the slide or can be linked to the
Copyright 2003 MIT Dept of Biology
MIT –Biology Science Outreach
5
slide after synthesis). You can fit 10,000 different genes (10,000 tiny spots) on a single
slide (DNA chip). Each spot represent one single gene and has billions of copies of thesame 25-base sequence.
II. Carrying out the reaction
• You first need to choose what cells or tissue you want to study and grow them under specificconditions.
For example you may wonder:
1. How gene expression changes when cells are irradiated with UV light or exposed to atoxic chemical?
2. What happens to the activity of various genes in yeast cells when the cells are shiftedfrom 25 ºC to 37 ºC?
3. What genes are only expressed in fish embryos and not in adult fish?
4. What genes have increased expression in cancer cells compared to normal cells?
• You isolate total mRNA from the cells you are studying (both normal and treated orcancerous cells)
• You want to be able to count how many copies of each mRNA there is in the cell in order todetermine the activity of each gene. So you need to label the mRNA (so that you can detect
it and count how much of each mRNA sequence there is). The easiest way to do that is to
reverse transcribe the mRNA into cDNA and introduce modified fluorescent bases into theDNA. In order to distinguish later between the mRNAs coming from the normal cells and
those coming from the treated or diseased cells you label the two cDNAs populations withdifferent fluorescent colors (such as green and red)
• You mix the two populations of fluorescently labeled cDNAs and hybridize them to thesame DNA chip in a special chamber. You then wash away all the unbound cDNA.
III. Collecting and analyzing the results
• Using a scanner hooked to a computer you measure how much of each labeled cDNA (green
and red) is bound to each spot on the slide. The more label on a spot the more active theCopyright 2003 MIT Dept of Biology

MIT –Biology Science Outreach
6
gene is. BUT remember! You are comparing two populations of cells. So what counts isnot how much total cDNA binds to each spot but how much of each color bind to the same
spot. The color intensities are subtracted from each other.
• By measuring the difference of intensity between the two colors for each spot you can
determine for example if a gene is more active or less active in a cancer cell compared to anormal cell.
• You generate a grid that uses a color code to show the change in activity for each gene
• You try to figure out if there is a pattern in gene expression that is clearly visible, andreproducible.
Copyright 2003 MIT Dept of Biology
MIT –Biology Science Outreach
7
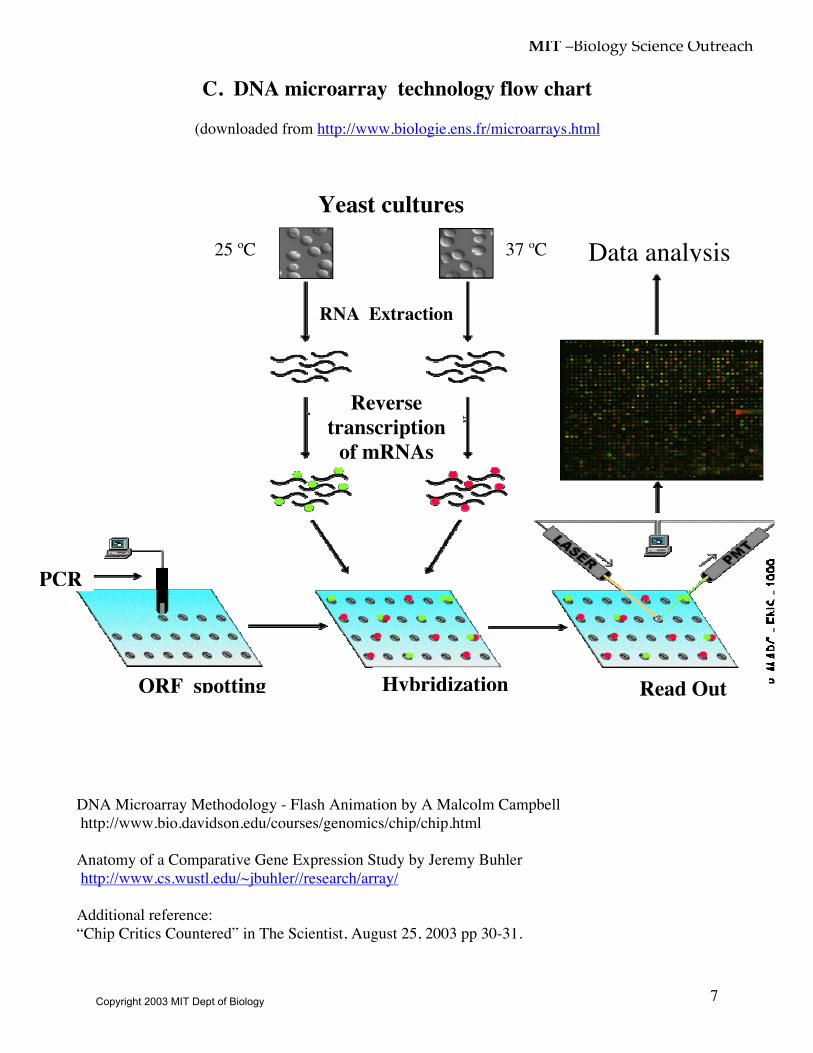
C. DNA microarray technology flow chart
(downloaded from http://www.biologie.ens.fr/microarrays.html
DNA Microarray Methodology - Flash Animation by A Malcolm Campbell http://www.bio.davidson.edu/courses/genomics/chip/chip.html
Anatomy of a Comparative Gene Expression Study by Jeremy Buhler http://www.cs.wustl.edu/~jbuhler//research/array/
Additional reference:“Chip Critics Countered” in The Scientist, August 25, 2003 pp 30-31.
RNA Extraction
PCR
Hybridization Read Out
Data analysis
ORF spotting
Reversetranscription
of mRNAs
Yeast cultures
25 ºC 37 ºC
Copyright 2003 MIT Dept of Biology
MIT –Biology Science Outreach
8
D. Interactive Class Exercise on DNA Microarray and Medicine
Note to teachers.The exercise does not require students to know the details of the DNA microarray technology but
rather to understand what type of data one gets from DNA microarray experiments and how thisdata can be useful in the diagnosis and treatment of human diseases.
Goal of this exercise:To make students realize that the power of DNA microarray technology in medical applications
relies principally on observing a common change in gene expression pattern in patients with thesame type of diseases. Students will have to recognize common patterns of gene expression and
realize the usefulness of such observation. To simplify the exercise you can decrease the number of
genes studied.You can also provide additional guidance to the students and ask them to reorder the genes in a
specific pattern to facilitate the observation.More advanced students may think about the function of some of the genes whose activity are
required to prevent cancer or whose activity are required to develop cancer.
Brief overview:Students will mimic individual genes on DNA chips. The number of genes on a chip will depend onthe class size. Each DNA chip will be used to test the gene expression profile for one cancer
patient, and should contain at least 10 genes to make it significant.
• If the gene is ON (or increased gene activity) the student will stand up (or raise their hand).
• If the gene is OFF (or decreased gene activity) the student will sit down.
In order for students to observe a specific pattern of gene expression associated with a disease, there
need to be at least 4 DNA chips, one for each cancer patient. Students representing genes on aDNA chip will each receive a card that indicates the state of their gene (ON [black circle] or OFF
[white circle]) for individual patients. Students representing genes will line up (with a chair behind
them). The students will act out gene expression for the first patient, then the next and so on.
Copyright 2003 MIT Dept of Biology
MIT –Biology Science Outreach
9
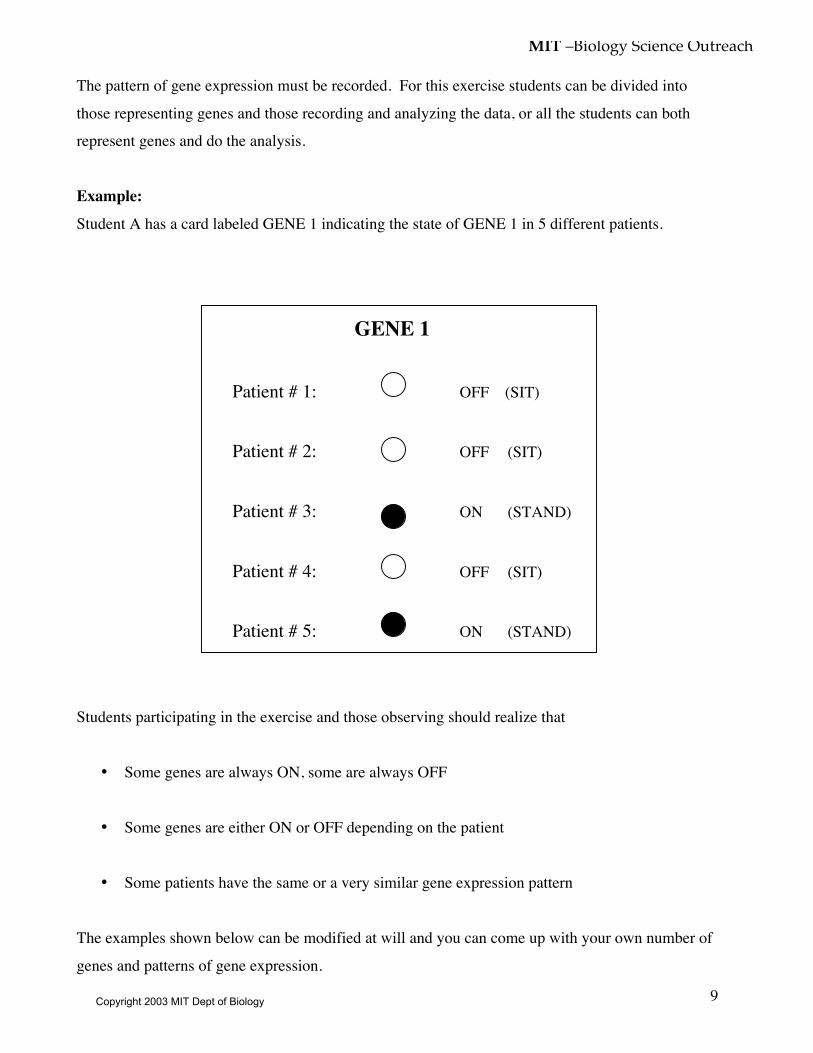
The pattern of gene expression must be recorded. For this exercise students can be divided into
those representing genes and those recording and analyzing the data, or all the students can bothrepresent genes and do the analysis.
Example:Student A has a card labeled GENE 1 indicating the state of GENE 1 in 5 different patients.
GENE 1
Patient # 1: OFF (SIT)
Patient # 2: OFF (SIT)
Patient # 3: ON (STAND)
Patient # 4: OFF (SIT)
Patient # 5: ON (STAND)
Students participating in the exercise and those observing should realize that
• Some genes are always ON, some are always OFF
• Some genes are either ON or OFF depending on the patient
• Some patients have the same or a very similar gene expression pattern
The examples shown below can be modified at will and you can come up with your own number of
genes and patterns of gene expression.
Copyright 2003 MIT Dept of Biology
MIT –Biology Science Outreach
10
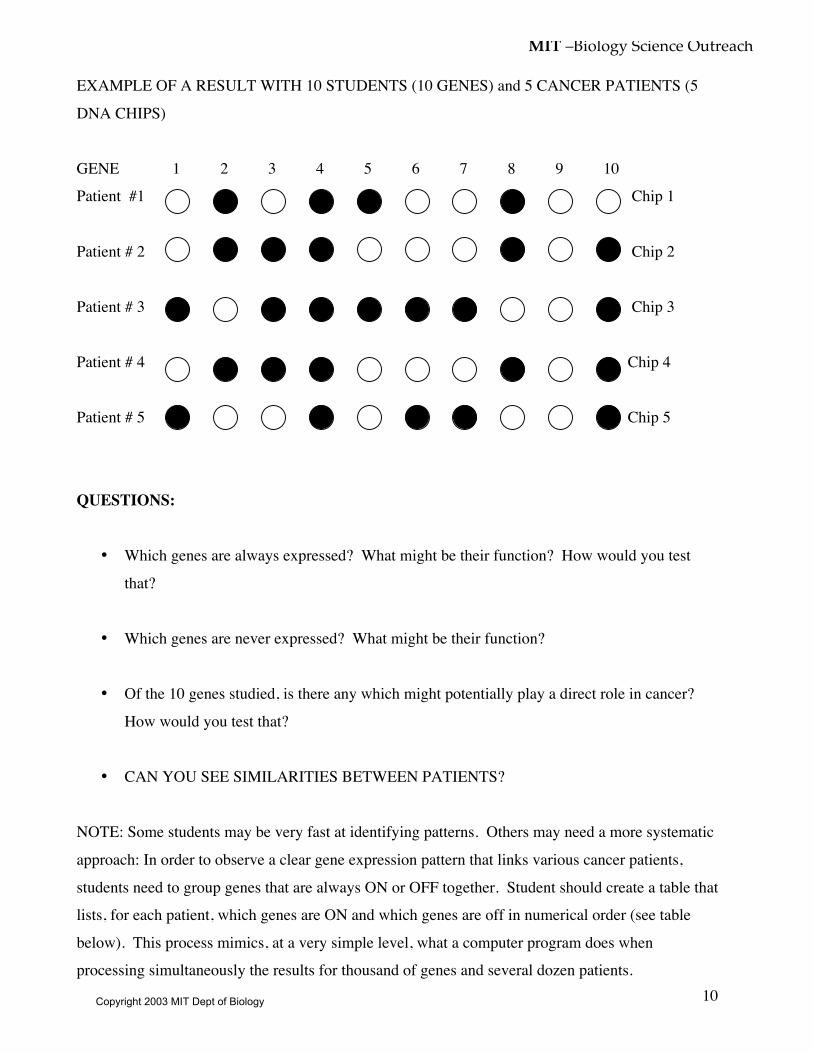
EXAMPLE OF A RESULT WITH 10 STUDENTS (10 GENES) and 5 CANCER PATIENTS (5
DNA CHIPS)
GENE 1 2 3 4 5 6 7 8 9 10Patient #1 Chip 1
Patient # 2 Chip 2
Patient # 3 Chip 3
Patient # 4 Chip 4
Patient # 5 Chip 5
QUESTIONS:
• Which genes are always expressed? What might be their function? How would you test
that?
• Which genes are never expressed? What might be their function?
• Of the 10 genes studied, is there any which might potentially play a direct role in cancer?
How would you test that?
• CAN YOU SEE SIMILARITIES BETWEEN PATIENTS?
NOTE: Some students may be very fast at identifying patterns. Others may need a more systematic
approach: In order to observe a clear gene expression pattern that links various cancer patients,
students need to group genes that are always ON or OFF together. Student should create a table thatlists, for each patient, which genes are ON and which genes are off in numerical order (see table
below). This process mimics, at a very simple level, what a computer program does whenprocessing simultaneously the results for thousand of genes and several dozen patients.
Copyright 2003 MIT Dept of Biology
MIT –Biology Science Outreach
11
Patient # 1 2 3 4 5
Genes ON 2 2 1 2 1
4 3 3 3 45 4 4 4 6
8 8 5 8 7
10 6 10 107
10
Genes OFF 1 1 2 1 2
3 5 8 5 36 6 9 6 5
7 7 7 8
9 9 9 910
• Based on the results presented in the table you can GROUP BOTH PATIENTS AND
GENES to show the two main patterns of gene expression.
GENE 1 6 7 9 2 8 4 10 3 5
Patient # 1
Patient # 2
Patient # 4
Patient # 3Patient # 5
Copyright 2003 MIT Dept of Biology
MIT –Biology Science Outreach
12
1. Is the function of gene 4 potentially required for cancer? What additional experiment do you
need to do to test this?
2. What about gene 9?
3. Are the patterns of expression for genes 3, 5 and 10 relevant?
EXERCISE:
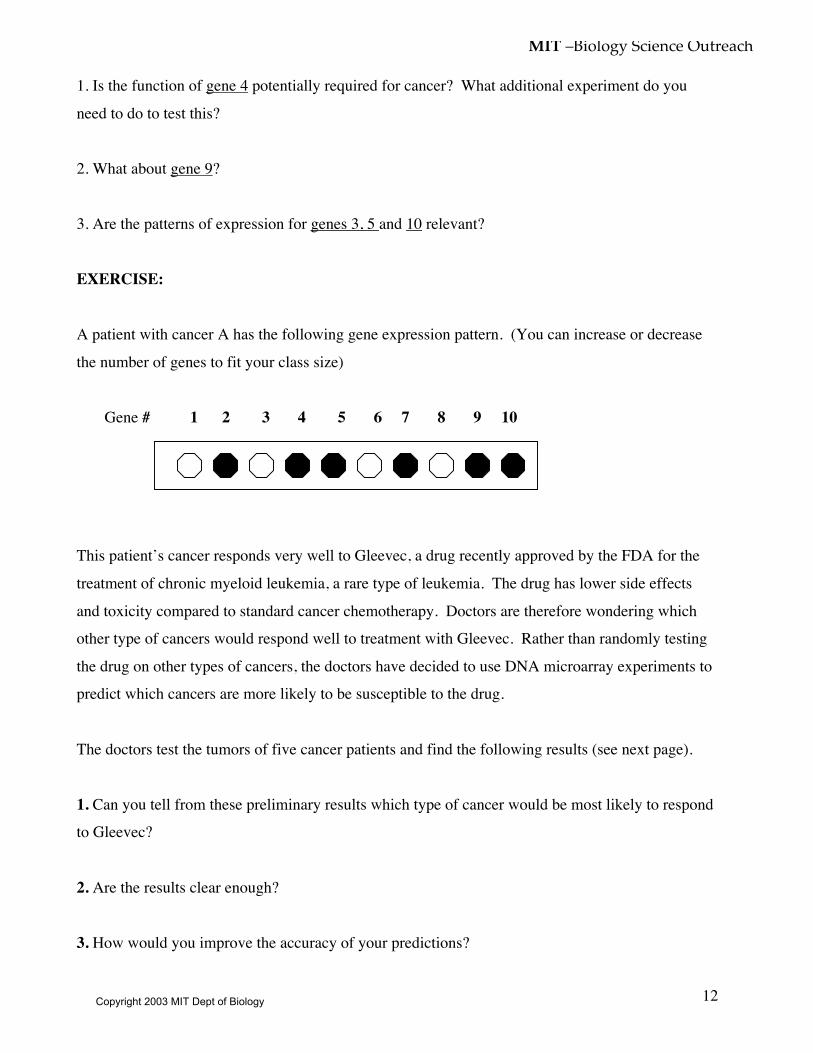
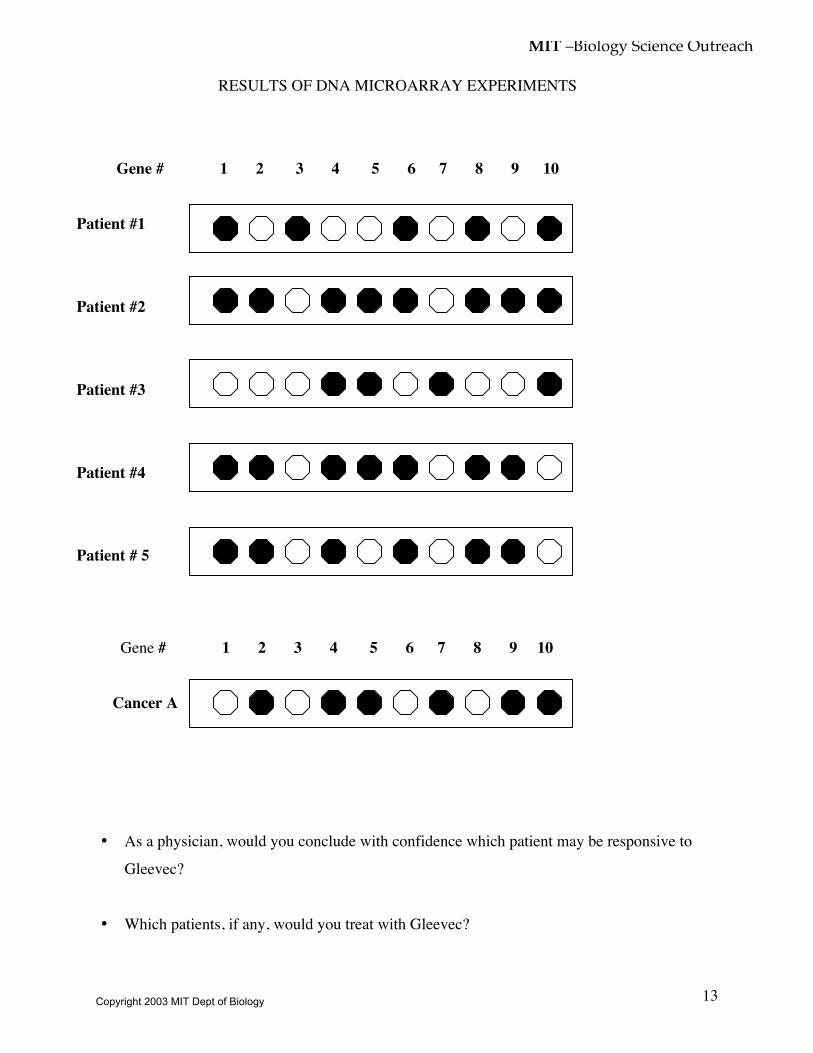
A patient with cancer A has the following gene expression pattern. (You can increase or decrease
the number of genes to fit your class size)
Gene # 1 2 3 4 5 6 7 8 9 10
This patient’s cancer responds very well to Gleevec, a drug recently approved by the FDA for the
treatment of chronic myeloid leukemia, a rare type of leukemia. The drug has lower side effects
and toxicity compared to standard cancer chemotherapy. Doctors are therefore wondering whichother type of cancers would respond well to treatment with Gleevec. Rather than randomly testing
the drug on other types of cancers, the doctors have decided to use DNA microarray experiments topredict which cancers are more likely to be susceptible to the drug.
The doctors test the tumors of five cancer patients and find the following results (see next page).
1. Can you tell from these preliminary results which type of cancer would be most likely to respondto Gleevec?
2. Are the results clear enough?
3. How would you improve the accuracy of your predictions?
Copyright 2003 MIT Dept of Biology
MIT –Biology Science Outreach
13
RESULTS OF DNA MICROARRAY EXPERIMENTS
Gene # 1 2 3 4 5 6 7 8 9 10
Patient #1
Patient #2
Patient #3
Patient #4
Patient # 5
Gene # 1 2 3 4 5 6 7 8 9 10
Cancer A
• As a physician, would you conclude with confidence which patient may be responsive to
Gleevec?
• Which patients, if any, would you treat with Gleevec?
Copyright 2003 MIT Dept of Biology
MIT –Biology Science Outreach
14
USE THESE BLANK ARRAYS TO DESIGN YOUR OWN EXERCISE
Gene # 1 2 3 4 5 6 7 8 9 10
Patient #1
Patient #2
Patient #3
Patient #4
Patient # 5
Patient # 6
Copyright 2003 MIT Dept of Biology