Embed Size (px)
Citation preview
GRNmap and GRNsight: Open Source Software for Dynamical Systems Modeling and Visualization of Medium-Scale Gene Regulatory Networks
Kam D. Dahlquist, Ph.D.
Department of Biology
Loyola Marymount University
January 31, 2015
Southern California Systems Biology Conference
Outline
• Yeast respond to cold shock by changing gene expression.• But little is known about which transcription factors regulate
the response.
• GRNmap models the dynamics of “medium-scale” gene regulatory networks using differential equations.• A penalized least squares approach was used successfully to
estimate parameters from cold shock microarray data.
• GRNsight automatically generates weighted network graphs from the spreadsheets produced by GRNmap.• This facilitates visualization of the relative influence of each
transcription factor in controlling the cold shock response.
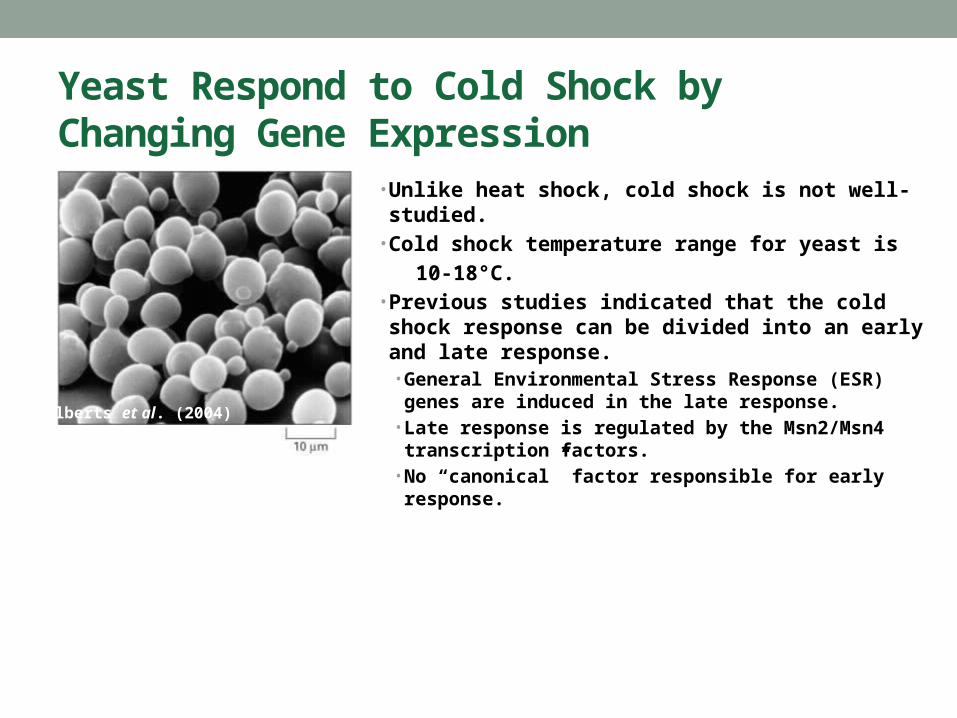
Yeast Respond to Cold Shock by Changing Gene Expression
Alberts et al. (2004)
• Unlike heat shock, cold shock is not well-studied.• Cold shock temperature range for yeast is
10-18°C.• Previous studies indicated that the cold shock
response can be divided into an early and late response.• General Environmental Stress Response (ESR)
genes are induced in the late response.• Late response is regulated by the Msn2/Msn4
transcription factors.• No “canonical” factor responsible for early
response.
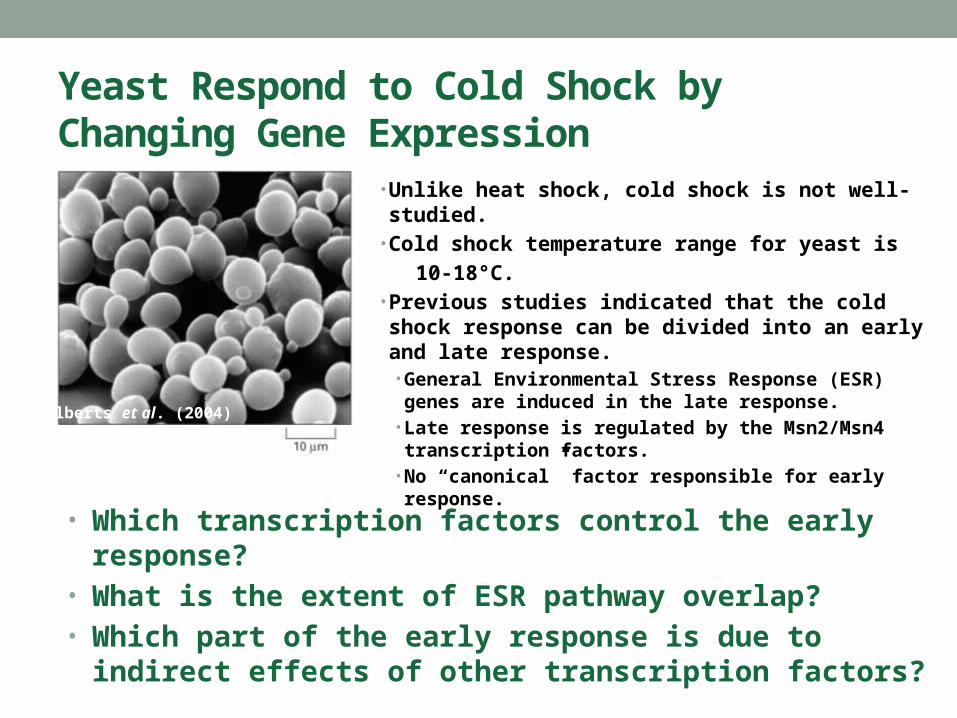
Yeast Respond to Cold Shock by Changing Gene Expression
Alberts et al. (2004)
• Which transcription factors control the early response?• What is the extent of ESR pathway overlap?• Which part of the early response is due to indirect
effects of other transcription factors?
• Unlike heat shock, cold shock is not well-studied.• Cold shock temperature range for yeast is
10-18°C.• Previous studies indicated that the cold shock
response can be divided into an early and late response.• General Environmental Stress Response (ESR)
genes are induced in the late response.• Late response is regulated by the Msn2/Msn4
transcription factors.• No “canonical” factor responsible for early
response.
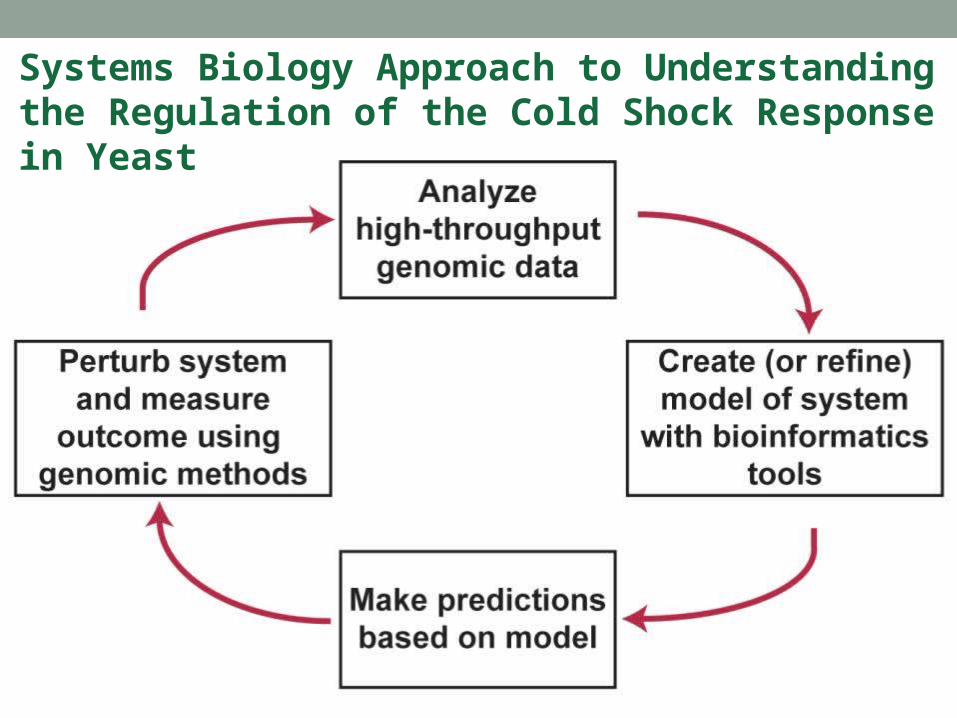
Systems Biology Approach to Understanding the Regulation of the Cold Shock Response in Yeast
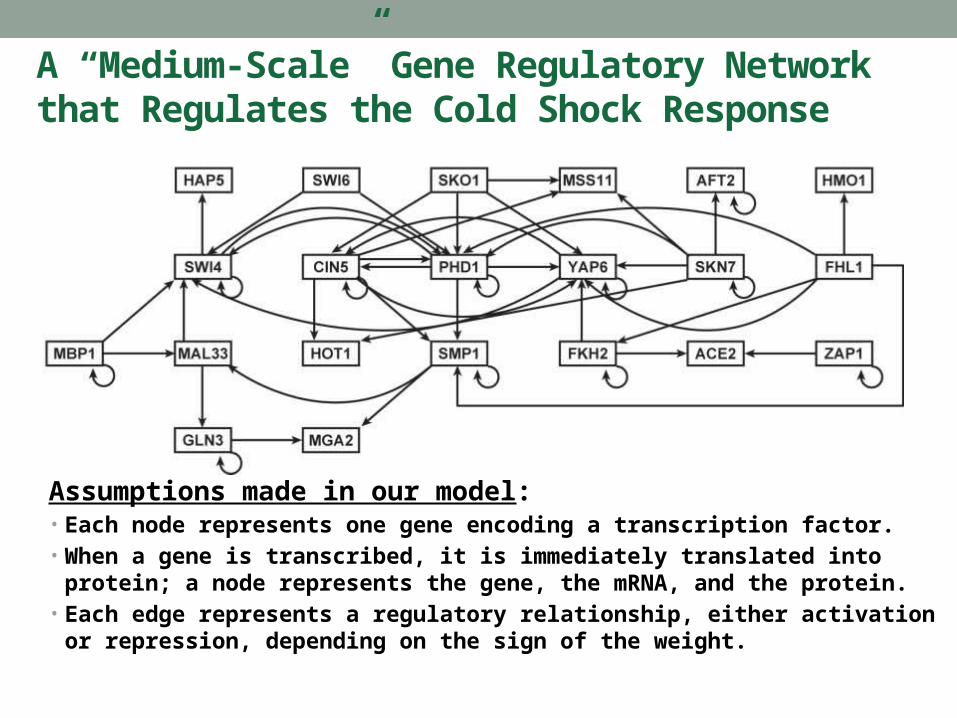
A “Medium-Scale” Gene Regulatory Network that Regulates the Cold Shock Response
Assumptions made in our model:• Each node represents one gene encoding a transcription factor.• When a gene is transcribed, it is immediately translated into protein;
a node represents the gene, the mRNA, and the protein.• Each edge represents a regulatory relationship, either activation or
repression, depending on the sign of the weight.
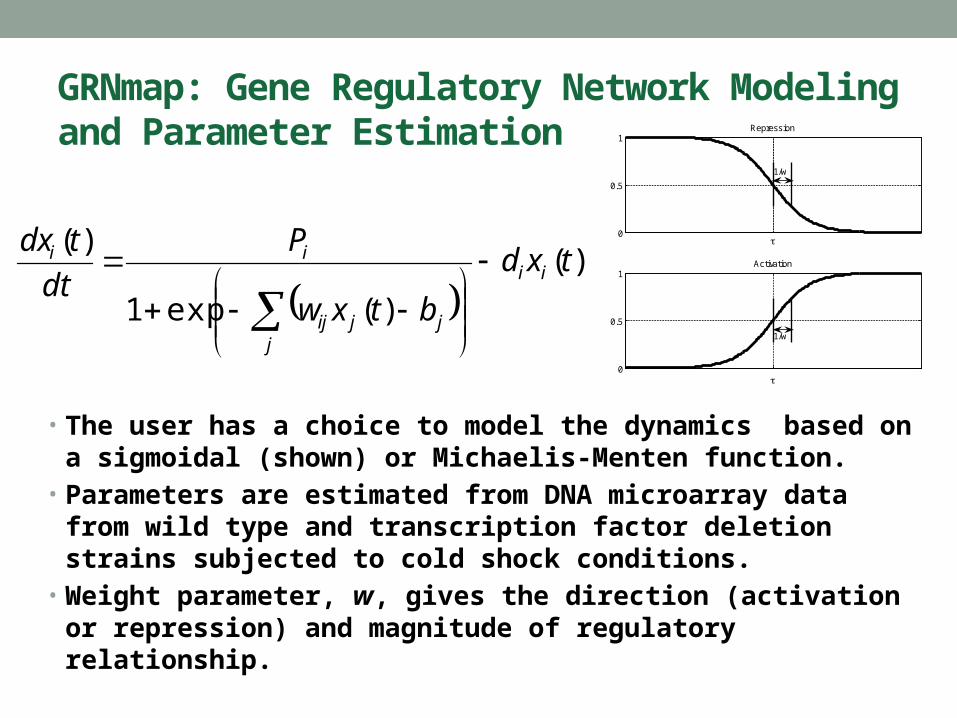
GRNmap: Gene Regulatory Network Modeling and Parameter Estimation
• The user has a choice to model the dynamics based on a sigmoidal (shown) or Michaelis-Menten function.
• Parameters are estimated from DNA microarray data from wild type and transcription factor deletion strains subjected to cold shock conditions.
• Weight parameter, w, gives the direction (activation or repression) and magnitude of regulatory relationship.
0
0.5
1Activation
1/w
0
0.5
1Repression
1/w
)(
)(exp1
)(txd
btxw
P
dt
tdxii
jjjij
ii
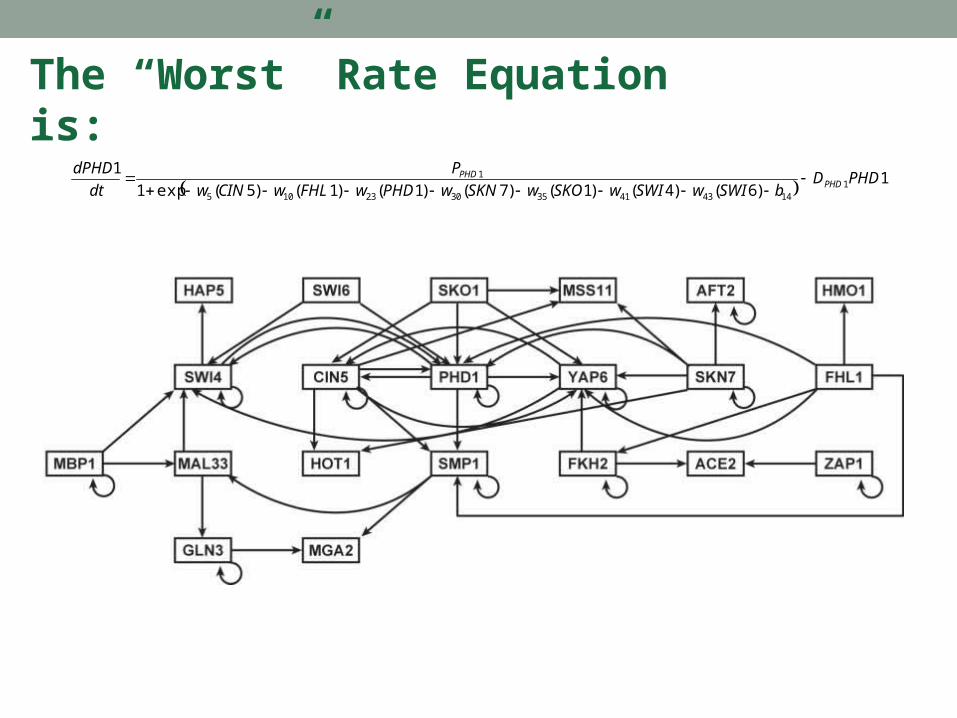
The “Worst” Rate Equation is:
1)6()4()1()7()1()1()5(exp1
11
144341353023105
1 PHDDbSWIwSWIwSKOwSKNwPHDwFHLwCINw
P
dt
dPHDPHD
PHD
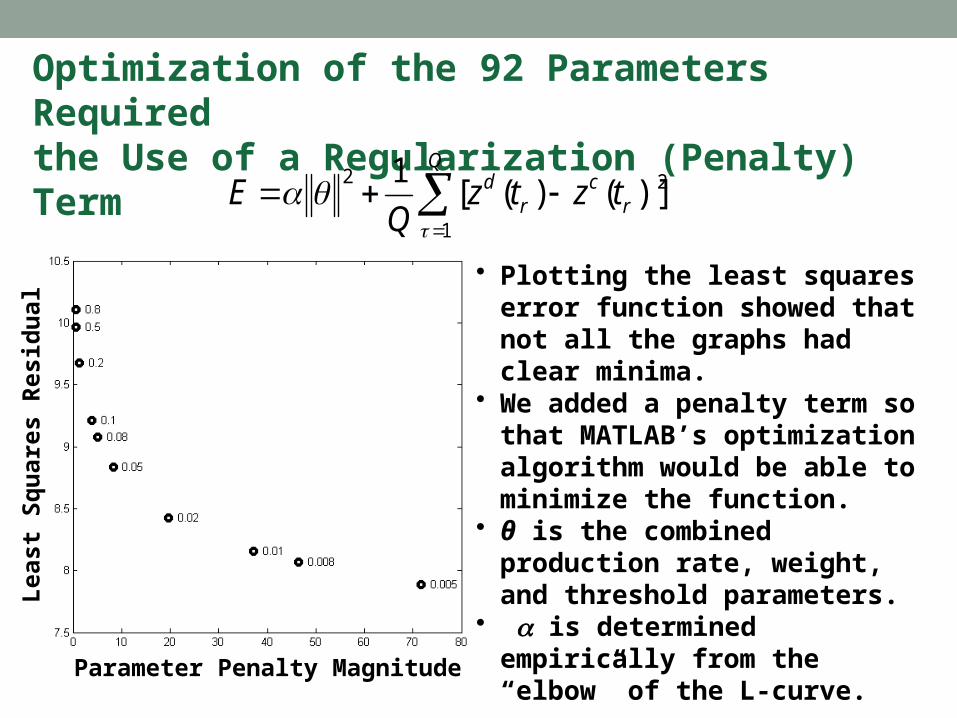
Optimization of the 92 Parameters Requiredthe Use of a Regularization (Penalty) Term
• Plotting the least squares error function showed that not all the graphs had clear minima.
• We added a penalty term so that MATLAB’s optimization algorithm would be able to minimize the function.
• θ is the combined production rate, weight, and threshold parameters.
• a is determined empirically from the “elbow” of the L-curve.
Q
rc
rd tztz
QE
1
22)]()([
1
Parameter Penalty Magnitude
Lea
st S
qu
ares
Res
idu
al
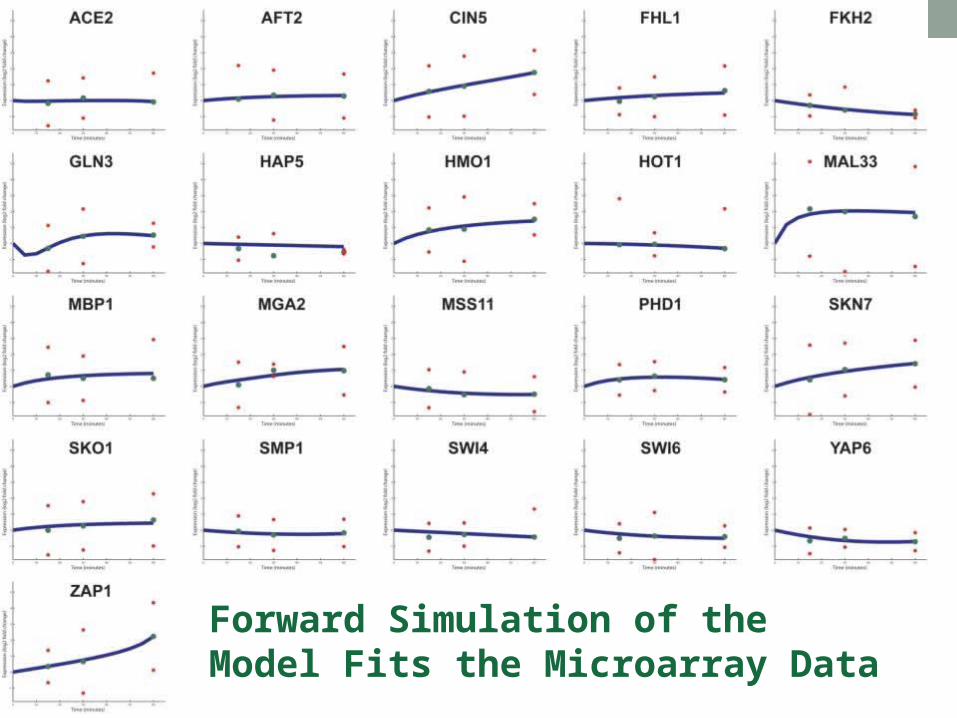
Forward Simulation of the Model Fits the Microarray Data
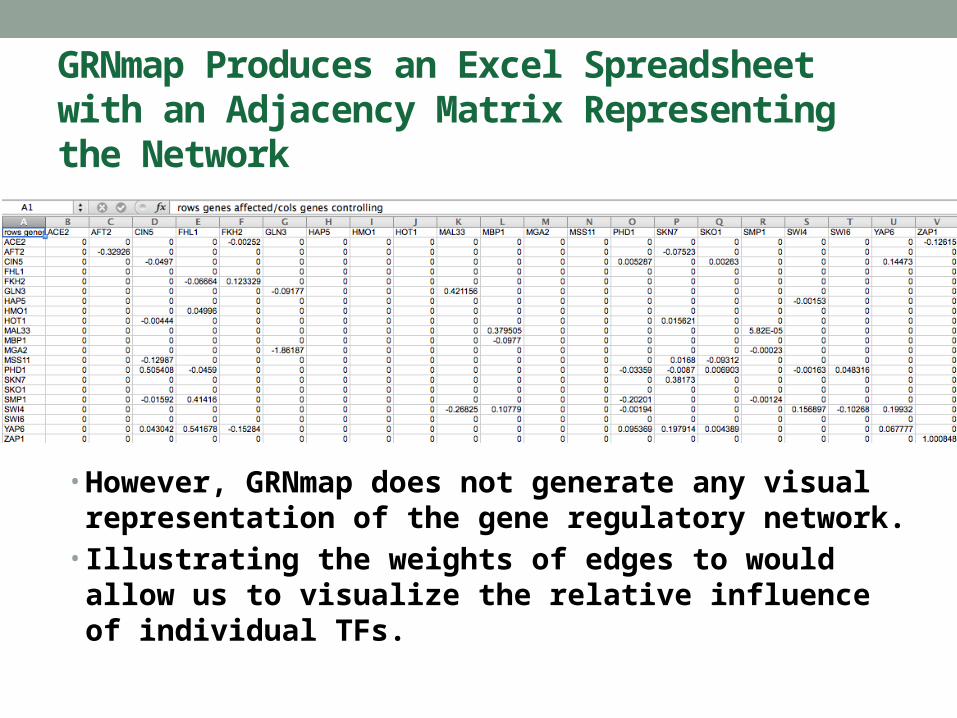
GRNmap Produces an Excel Spreadsheet with an Adjacency Matrix Representing the Network
• However, GRNmap does not generate any visual representation of the gene regulatory network.
• Illustrating the weights of edges to would allow us to visualize the relative influence of individual TFs.
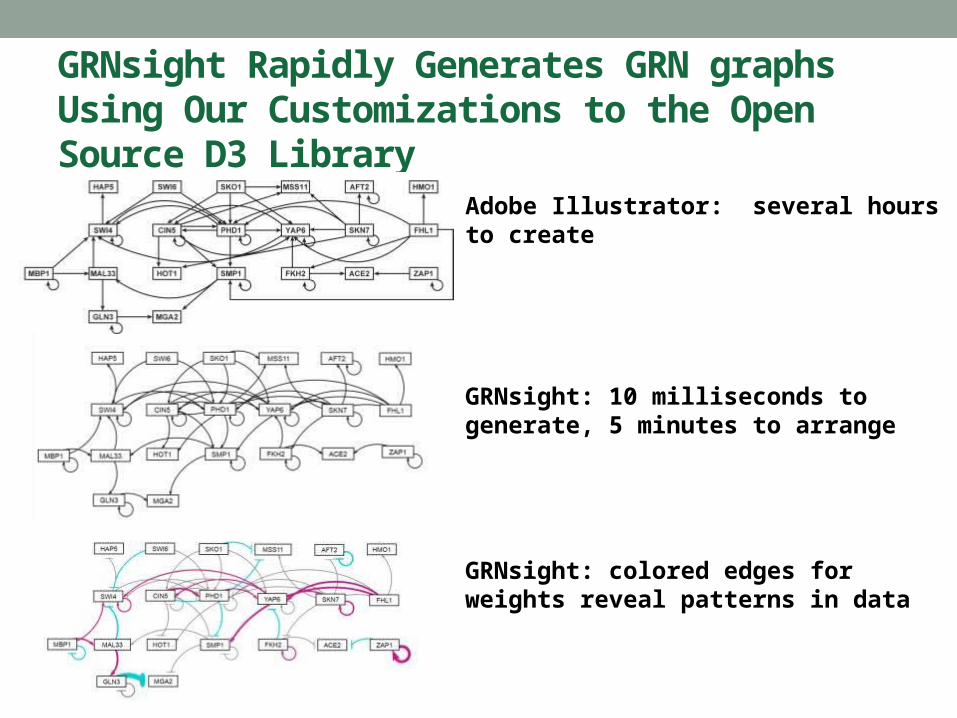
GRNsight Rapidly Generates GRN graphs Using Our Customizations to the Open Source D3 Library
GRNsight: 10 milliseconds to generate, 5 minutes to arrange
Adobe Illustrator: several hours to create
GRNsight: colored edges for weights reveal patterns in data
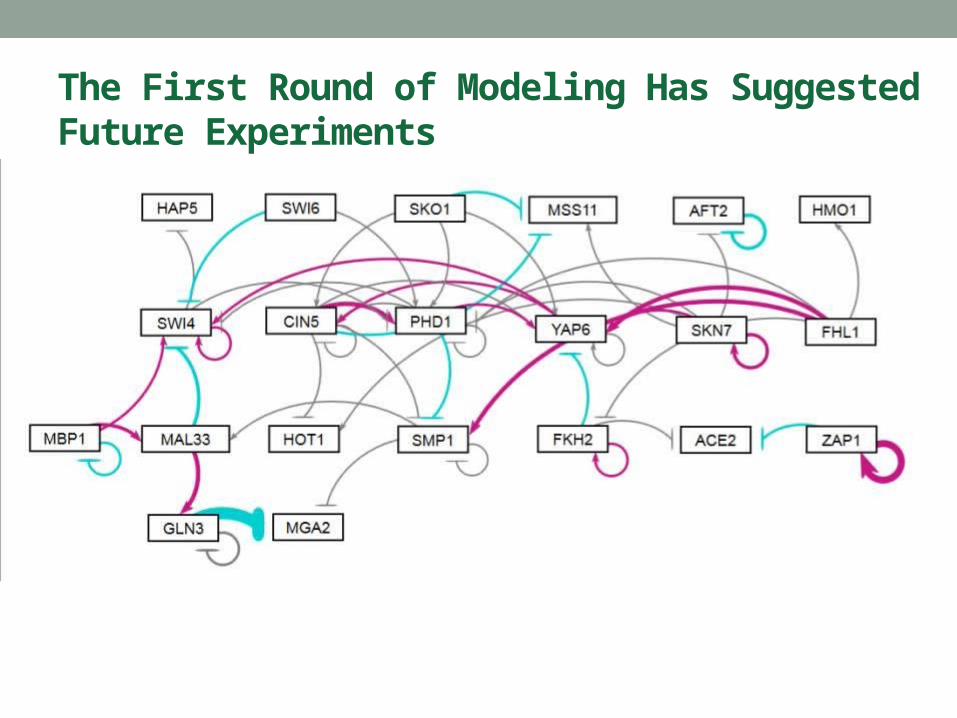
The First Round of Modeling Has Suggested Future Experiments
Summary
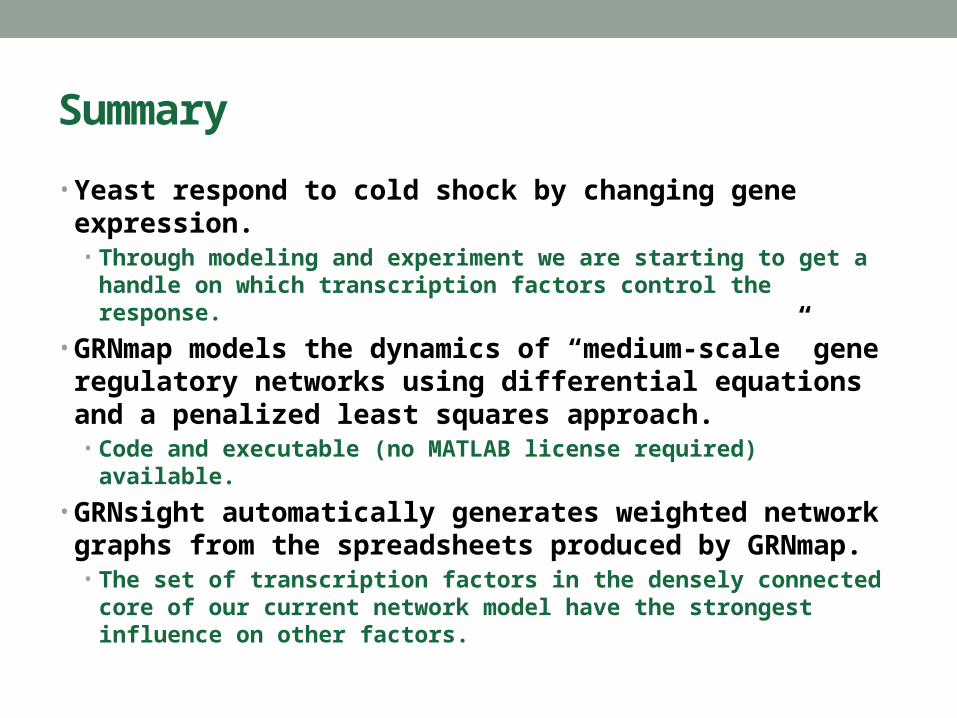
• Yeast respond to cold shock by changing gene expression.• Through modeling and experiment we are starting to get a
handle on which transcription factors control the response.
• GRNmap models the dynamics of “medium-scale” gene regulatory networks using differential equations and a penalized least squares approach.• Code and executable (no MATLAB license required) available.
• GRNsight automatically generates weighted network graphs from the spreadsheets produced by GRNmap.• The set of transcription factors in the densely connected core
of our current network model have the strongest influence on other factors.
GRNsight: http://dondi.github.io/GRNsight/GRNmap: http://kdahlquist.github.io/GRNmap/
• Faculty Collaborators• Dr. John David N. Dionisio, (LMU EE/CS)• Dr. Ben G. Fitzpatrick, (LMU Math)
• GRNsight• Nicole A. Anguiano ’16• Britain J. Southwick ’14• Anindita Varshneya ’17
• GRNmap• Juan S. Carrillo ’16• Nicholas A. Rohacz ’13• Katrina Sherbina ’14
• NSF-RUI 0921038
• Microarray Data• Cybele Arsan ’11• Wesley Citti ’08• Kevin Entzminger ’09• Andrew Herman ’12• Heather King ’06• Lauren Kubeck ’11• Stephanie Kuelbs ’09• Elizabeth Liu ’08• Matthew Mejia ’07• Kenny Rodriguez ’09• Olivia Sakhon ’08• Alondra Vega ’12
•New Lab Members• Monica Hong ’17• Grace Johnson ’17• Trixie Roque ’17• Natalie Williams ’17• Kevin Wyllie ’16


![SUSTAINABILITY OUTCOMES - PRI...Asset allocation [SO 8, SO 9, SO 10] 36 SO 8 36 SO 9 38 SO 10 40 Investee engagement including voting [SO, 11, SO 12, SO 13, SO 14, SO 15, SO 16, SO](https://img.pdfslide.us/doc/110x75/60ab44e1705ab15da878b452/sustainability-outcomes-pri-asset-allocation-so-8-so-9-so-10-36-so-8-36.jpg)


![Literatur - link.springer.com3A978-3-642-56191-7%2F… · rical Integration of Ordinary Differential Equations. Math. Scand. 4: 33-53. [Dah63] Dahlquist G. (1963) A Special Stability](https://img.pdfslide.us/doc/110x75/5f3ef9e8a49a417ab30dbb7a/literatur-link-3a978-3-642-56191-72f-rical-integration-of-ordinary-differential.jpg)