Embed Size (px)
Citation preview

Comparative framework for activity-travel
diary collection systems
A. C. Prelipcean1, G. Gidofalvi1, Y. Susilo2
1Division of Geoinformatics2Division of Transportation Science
Dept. of Urban Planning and EnvironmentKTH Royal Institute of Technology
@Adi Prelipcean
03 June 2015

Outline
This presentation will be about:
1. Activity-travel diaries– Definition and uses– Collection methods
2. Comparing activity-travel diaries collected by differentsources
– Identifying the difficulties– Tackling the problems
3. A small case study– Experimental setup– Results
4. Summary and conclusions
2

Activity-travel diaries
What are they?
A way of summarizing where, why and how a user traveledduring a defined time frame by specifying:
I The destination of a trip
I The trip’s purposeI The means of transportation, i.e., trip legs
Img: http://soarministries.com/hp_wordpress/wp-content/uploads/2011/08/Destinations-Icon.jpg 3

Activity-travel diaries
What are they?
A way of summarizing where, why and how a user traveledduring a defined time frame by specifying:
I The destination of a tripI The trip’s purpose
I The means of transportation, i.e., trip legs
Img: https://cdn2.vox-cdn.com/thumbor/93Yaxs7y3Tb8tzFfppyRsSn_yN8=/1020x0/cdn0.vox-cdn.com/
uploads/chorus_asset/file/2509782/confused_man.0.jpg
3

Activity-travel diaries
What are they?
A way of summarizing where, why and how a user traveledduring a defined time frame by specifying:
I The destination of a tripI The trip’s purposeI The means of transportation, i.e., trip legs
Img: https://d3ui957tjb5bqd.cloudfront.net/images/screenshots/products/4/42/42990/
white-transportation-icons-300x200.jpg
3

Activity-travel diaries
Why are we using them?
For various reasons such as:
I to investigate the reasons and mechanisms that underliean individual’s activity-travel decision making processes,
I to predict the effect of implementing new transportationpolicies or changing the transportation infrastructure, or
I to understand the dynamic of transportation movementwithin study areas.
4

Activity-travel diaries
How to collect them?
I Traditionally - Users declare what they have done in asurvey, e.g., PP or CATI
I New methods - E.g., GPS collection + Web and MobileGIS based interaction
Img: http://www.schoolsurveyexperts.co.uk/i/photos/paper_survey.jpg
5

Activity-travel diaries
How to collect them?
I Traditionally - Users declare what they have done in asurvey, e.g., PP or CATI
I New methods - E.g., GPS collection + Web and MobileGIS based interaction
5

Potential problems
Scenario
We have data collected with (at least) two different systemson the same persons during the same time period.
Problems
I How to determine which system is better?
I How to identify trips that were recorded by both systems?
I How to identify trips that were missed by either system?
I How to treat trips that have different characteristic ineither system?
I What is ground truth?
6

Tackling the problems
What are the entities and which are their attributes thatshould be contained within an activity-travel diary?
7

Tackling the problems
How to match the trips captured by both systems?Trips can be matched based on:
I temporal co-occurrence - start and stop time of atrip from one system have to be within a threshold ofthe start and stop time of a trip from another system
I identical purpose - to avoid one-to-many types ofmatches based on temporal co-occurrence (this is usefulfor short trips whose start and stop time fall within theconsidered temporal threshold)
8

Tackling the problems
What information is captured by a system?
We propose two types of measures for the amount ofinformation captured by a system:
I Intrinsically - how “well” does one system capture anentity?
I Extrinsically - how “well” do both systems agree on thecapture of an entity?
9

Intrinsic indicators
How “well” does one system capture an entity?
Applicable to the spatio-temporal sequence of the locationsthat form the route.
I spatial indicators: the percentage of distance betweenconsecutive locations that was recorded at an expectedspatial resolution
10

Intrinsic indicators
How “well” does one system capture an entity?
Applicable to the spatio-temporal sequence of the locationsthat form the route.
I temporal indicators: the percentage of durationbetween consecutive locations that was recorded at anexpected temporal resolution
10
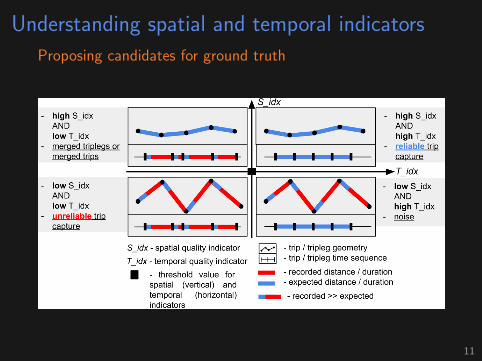
Understanding spatial and temporal indicators
Proposing candidates for ground truth
11

Possible subset analysis
I Trips captured inboth systems
I Trips filtered outvia a low spatialand / or temporalindicator value
I Trip informationdiscrepancies
I Trip ground truthcandidates
12

Usages of the framework
When to use this framework?
I For different activity-travel diary collection systemscomparison, to identify the strengths and weaknessesof each system
I For application-driven development, to observe thedimensions along which a product needs improvement
Now...A short illustration of when and how to use this framework viaa case study.
13

Stockholm case study
Identify if a semi-automated travel diary collection system canreplace or supplement traditional systems
For this study, data were collected using two systems:
I A traditional activity-travel diary collection system,Paper and Pen, further referred to as PP (on Monday,29th September 2014)
I A modern collection system built using the MobilityCollector framework(a smartphone application thatcollects GPS data fused with accelerometer values + aweb interface that allows users to annotate their GPStraces), further referred to as MEILI (between Monday,29th September 2014 and Sunday, 5th October 2014)
A. C. Prelipcean, G. Gidofalvi and Y.O. Susilo. ”Mobility Collector”, In Journal of Location Based Services,volume 8, issue 4, pp. 229–255, 2014
14

Stockholm case study
Overview of collected data
I PP contains 116 declared trips (104 of which weredeclared by users who also used MEILI)
I MEILI contains 87 trips for the same period as the PPcollection
I MEILI contains 1055 trips, out of which 718 wereannotated, for the entire collection duration
15

Matched subsetsI 43 trips present in both PP and MEILII 43 trips present only in PP, due to:
– MEILI did not collect data or the users forgot theirsmartphones at home during trips (∼ 25%)
– Trips were mistakenly missed due to faulty stop detection(∼ 20%)
– MEILI collection was started late (∼ 15%)– incomplete PP data for matching trips (∼ 10%) - e.g.,
missing destination, missing start / stop time.– other reasons (∼ 30%)
I 36 trips present only in MEILI, due to:– PP missed trips (∼ 80%)– trips were chained together by one of the systems (∼ 10%)– other reasons (∼ 10%)
I 8 trips were partially matched, where the trips occurredduring similar periods and close to one another but haddifferent purposes declared in each system.
16

Data summary
Statistics computed on intersection set are similar. MEILI offers moreinformation, i.e., waiting time and spatial and temporal indicator values.
17

Data summary
PP only trips have a shorter length, but the same duration, indicatingmovement with slow to medium speed transportation modes.
17

Data summary
MEILI only trips have a shorter length, usually with onetransportation mode and very short waiting time, indicating the
usage of a private transportation mode.
17

Some interesting results
Trend in time difference: if the user overestimates the start time, sheusually overestimates the end time also.
18

Some interesting results
People tend to overestimate the lengths of trips.The average length difference is 1000m ± 900m, except 4 cases where
the length was more than 4000m.18

Some interesting results
The disagreement between MEILI declared / derived from trajectoriesorigins and destinations and PP origins and destinations suggests errors
in geocoding and / or address declaration.
18

Some interesting results
MEILI captures tripleg-level information, and identifies potentialproblems with the collection.
18

Some interesting results
Clear distinction between walking as a mean of transportation (seldomthe main mode of transportation), and car / train (usually the main
mode of transportation).
18

Some interesting results
The difference between the time a user has to wait for ”personal”transportation modes and public transportation modes.
When waiting for public transportation modes, the time spent waitingaccounts for roughly 10-20% of the whole trip duration.
18

Some interesting results
Most transportation modes are sufficiently well recorded, with theexception of subways, which were expected to be troublesome to record.This observation does not hold for modes that have been recorded in few
instances.
18

What do we gain from using modern methods?
Lesons learned
I Half of the trips are captured by both PP and MEILII The number of trips captured only by MEILI is roughly
the same with the number of trips captured only by PPI MEILI captures more information about trip legsI The spatial and temporal indicators allow us to assess
the quality of the collected MEILI data and proposeground truth candidates
I The trajectory data agrees with the user annotateddata more than with the address specified in PP, whichadds to the reliability of the proposed ground truthcandidates
Beware of user bias!
19

What do we gain from using modern methods?
Lesons learned
I Half of the trips are captured by both PP and MEILII The number of trips captured only by MEILI is roughly
the same with the number of trips captured only by PPI MEILI captures more information about trip legsI The spatial and temporal indicators allow us to assess
the quality of the collected MEILI data and proposeground truth candidates
I The trajectory data agrees with the user annotateddata more than with the address specified in PP, whichadds to the reliability of the proposed ground truthcandidates
Beware of user bias!19

Summary
We have proposed a new framework that:
I Compares activity-travel diary collection systems
I Uses new spatial and temporal indicators to clearlydistinguish between the capture of entities that can beregarded as either error or ground truth candidates
I Successfully identifies the strengths and weaknessesof each activity-travel diary collection system, andindicates developmental / implementation prospects forimproving the collection.
The utility of the framework was tested and shown in a smallcase study performed in Stockholm.
20
Thank you for your attention!Questions and Discussions
Adrian C. PrelipceanPhd StudentDivision of GeoinformaticsKTH, Royal Institute of [email protected]@Adi Prelipcean