Embed Size (px)
Citation preview
CLASSIFYING COMMON WETLAND PLANTS USING HYPERSPECTRAL DATA TO
IDENTIFY OPTIMAL SPECTRAL BANDS FOR SPECIES MAPPING USING A SMALL UNMANNED AERIAL SYSTEMS– A CASE
STUDY
Sathishkumar Samiappan, Gray Turnage, Lee Hathcock, Haibo Yao, Russel Kincaid, Robert Moorhead, and Steve Ashby
Outline
• Wetland Ecosystem
• Motivation
• Goals
• Hyperspectral Data Collection
• Multispectral UAS data collection
• Classification
• Results
• Summary
Wetland Ecosystem
Wetlands perform a dazzling array of ecological function.
Water purification, flood protection, shoreline stabilization, ground water recharge, fish & wildlife habitat and many more.
Wetland ecosystems are threatened by humans and invasive species.
Wetlands are not indestructible. If we want wetlands to continue to perform their ecological functions, then we have to do our part to protect them.
Wetland Threats
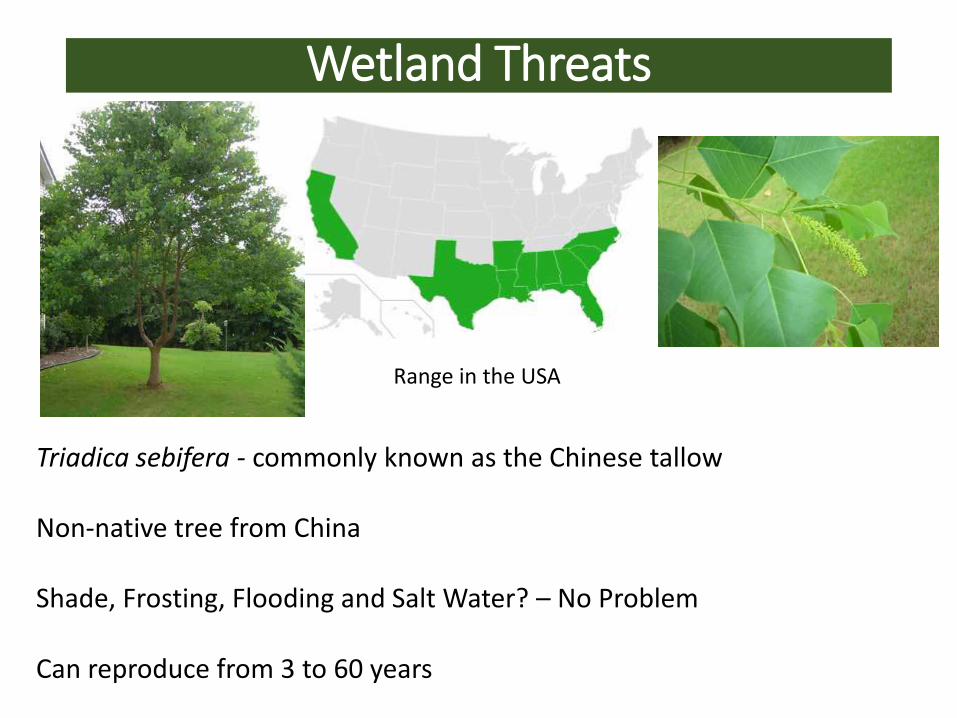
Triadica sebifera - commonly known as the Chinese tallow
Non-native tree from China
Shade, Frosting, Flooding and Salt Water? – No Problem
Can reproduce from 3 to 60 years
Range in the USA
Wetland Threats
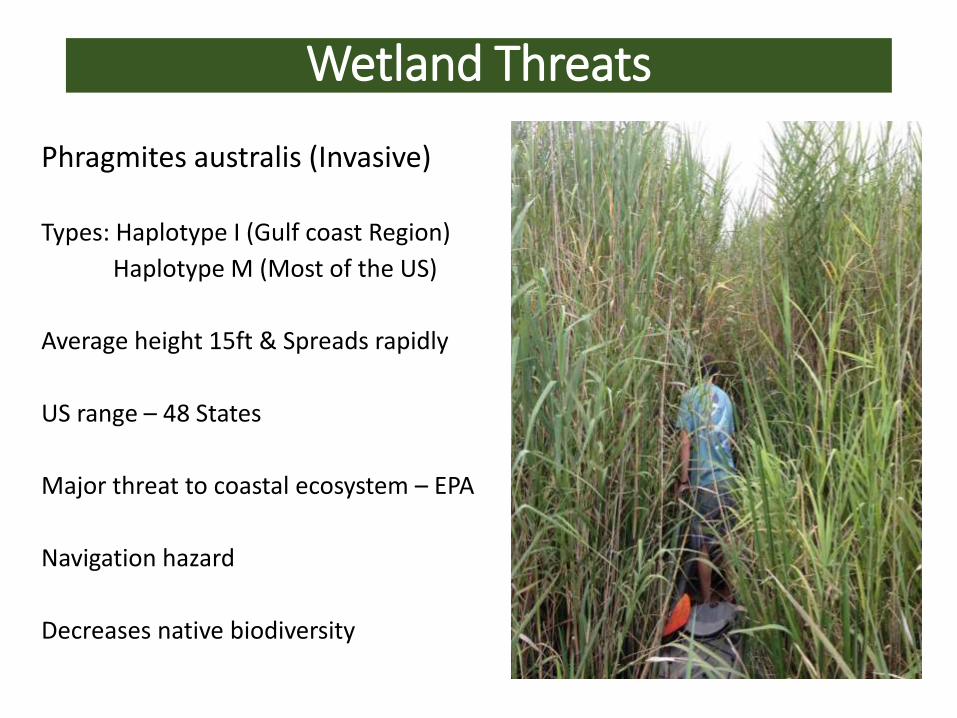
Phragmites australis (Invasive)
Types: Haplotype I (Gulf coast Region)
Haplotype M (Most of the US)
Average height 15ft & Spreads rapidly
US range – 48 States
Major threat to coastal ecosystem – EPA
Navigation hazard
Decreases native biodiversity
Motivation
Quickly and accurately classifying wetland plant species is critical and challenging.
Wetland plants has similar spectral and ecological characteristics.
Current identification methods involve extensive field work.
With the increased use of unmanned aerial systems and mounted camera payloads, the surveying process is becoming easier/quicker to conduct.
Collect HSI of common wetland plants (both invasive and natives) to create library of reflectance signatures.
Identify the wavelengths or regions of the spectrum that can be useful for distinguishing these plant species.
Identify a commercially available multispectral sensor that closely matches the required specifications.
Collect multispectral imagery over a field site using a small UAS to verify the effectiveness of identified bands to make critical resource management decisions.
Goals
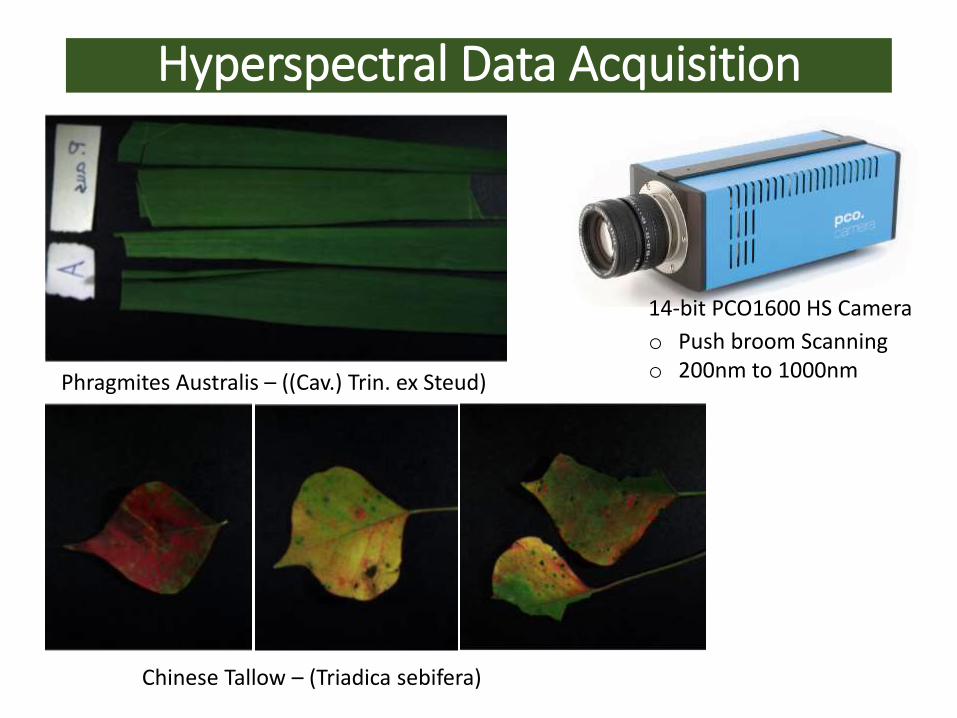
Hyperspectral Data Acquisition
14-bit PCO1600 HS Camera
Phragmites Australis – ((Cav.) Trin. ex Steud)
Chinese Tallow – (Triadica sebifera)
o Push broom Scanningo 200nm to 1000nm
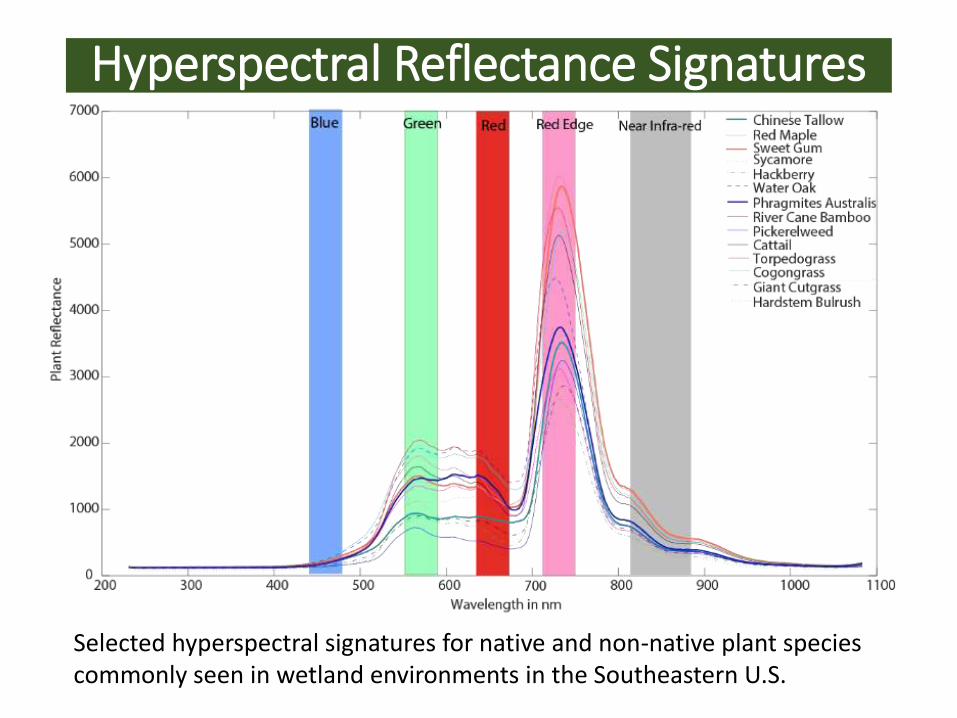
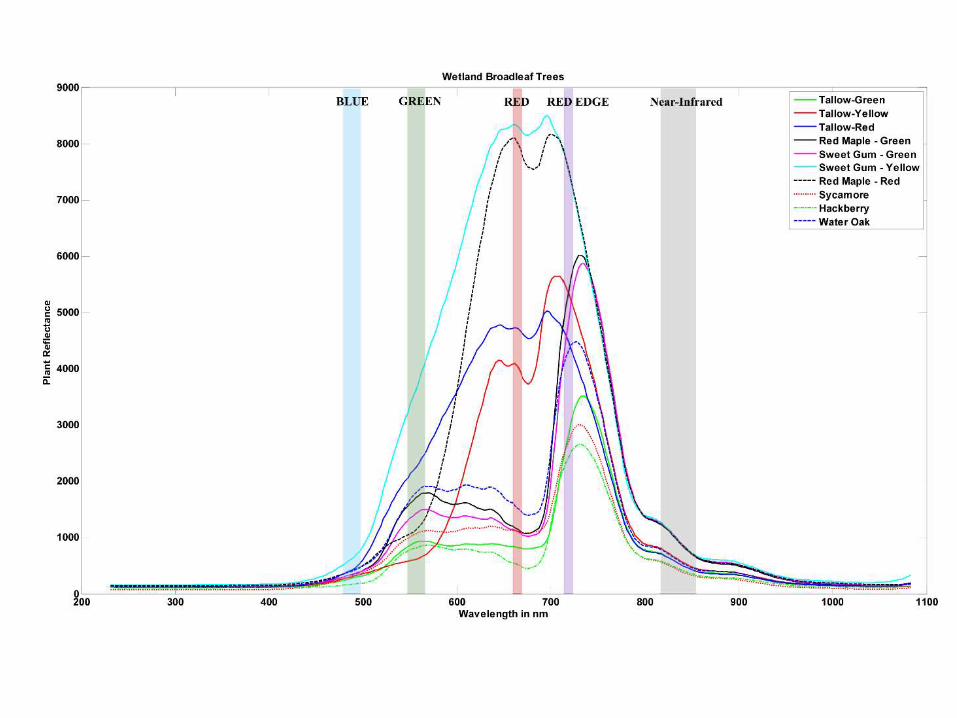
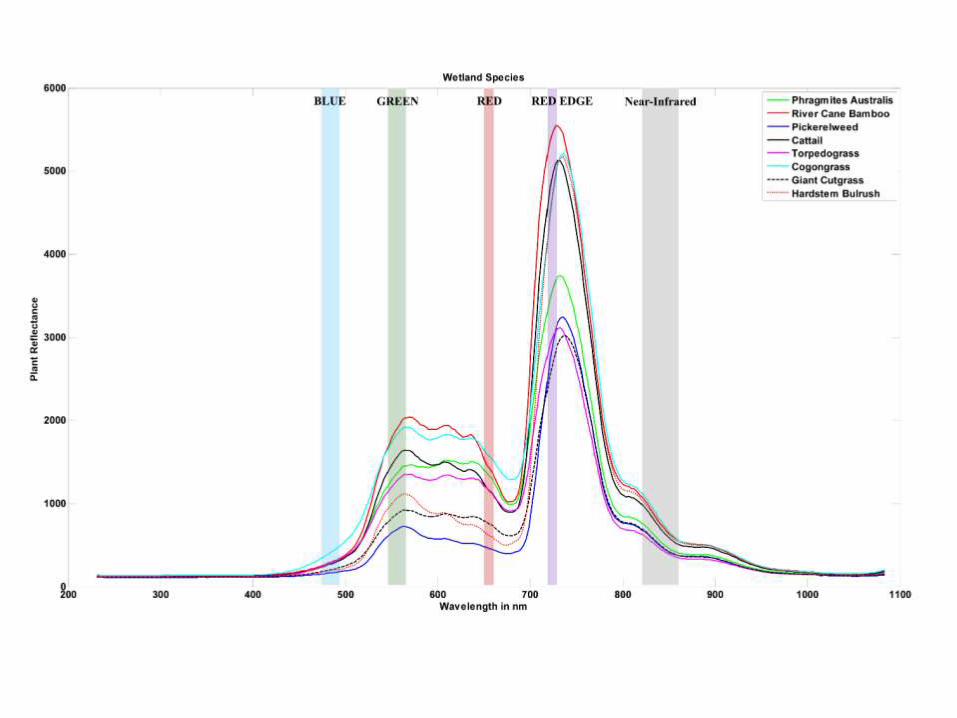
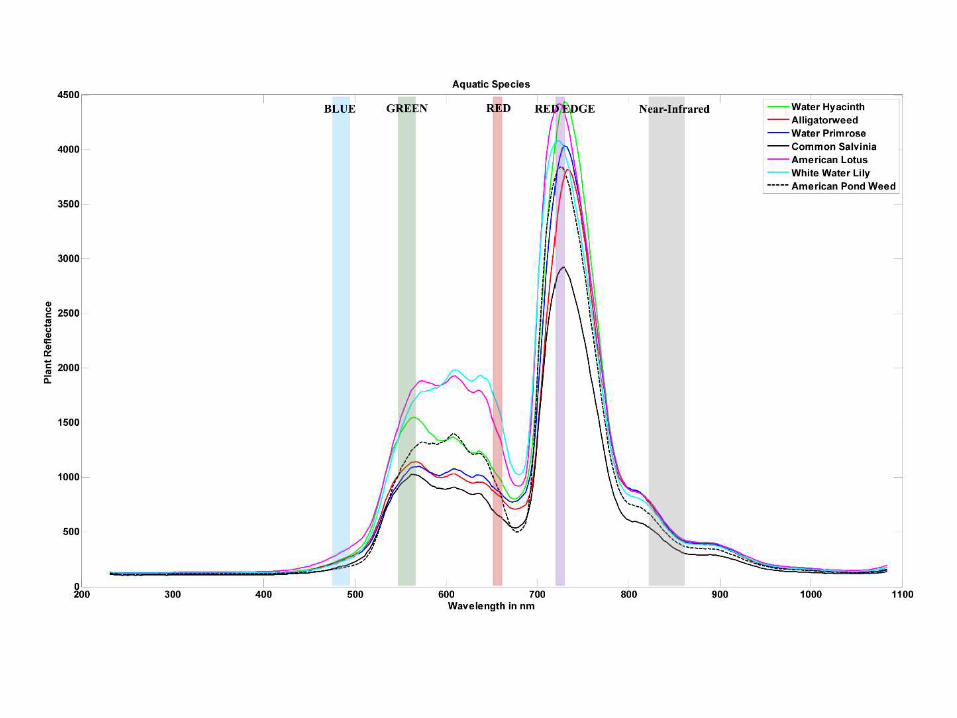
Hyperspectral Reflectance Signatures
Selected hyperspectral signatures for native and non-native plant species commonly seen in wetland environments in the Southeastern U.S.
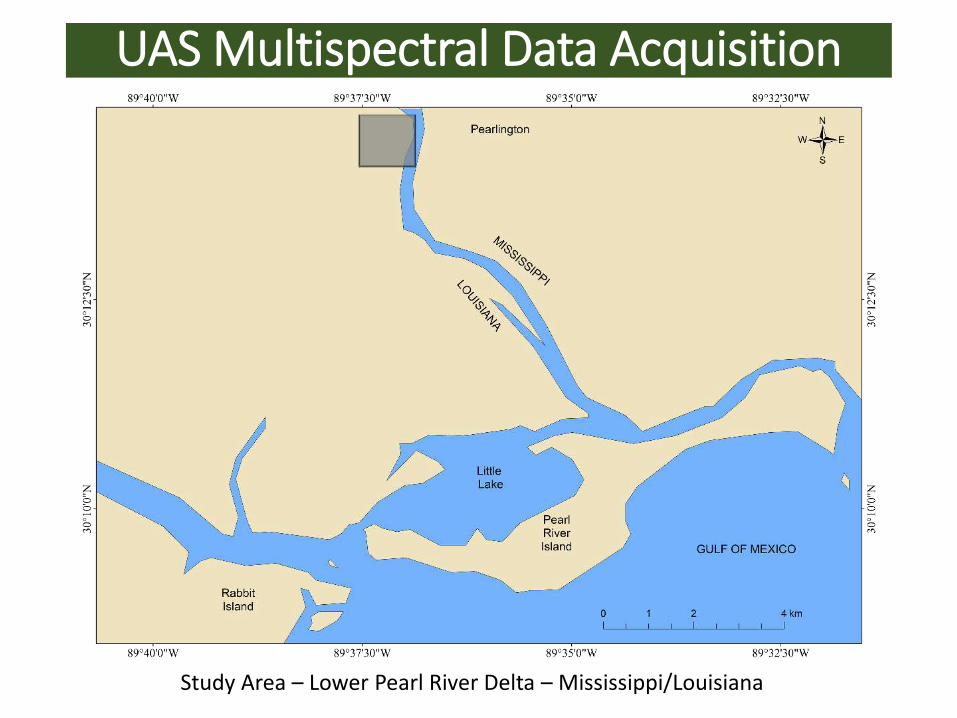
UAS Multispectral Data Acquisition
Study Area – Lower Pearl River Delta – Mississippi/Louisiana
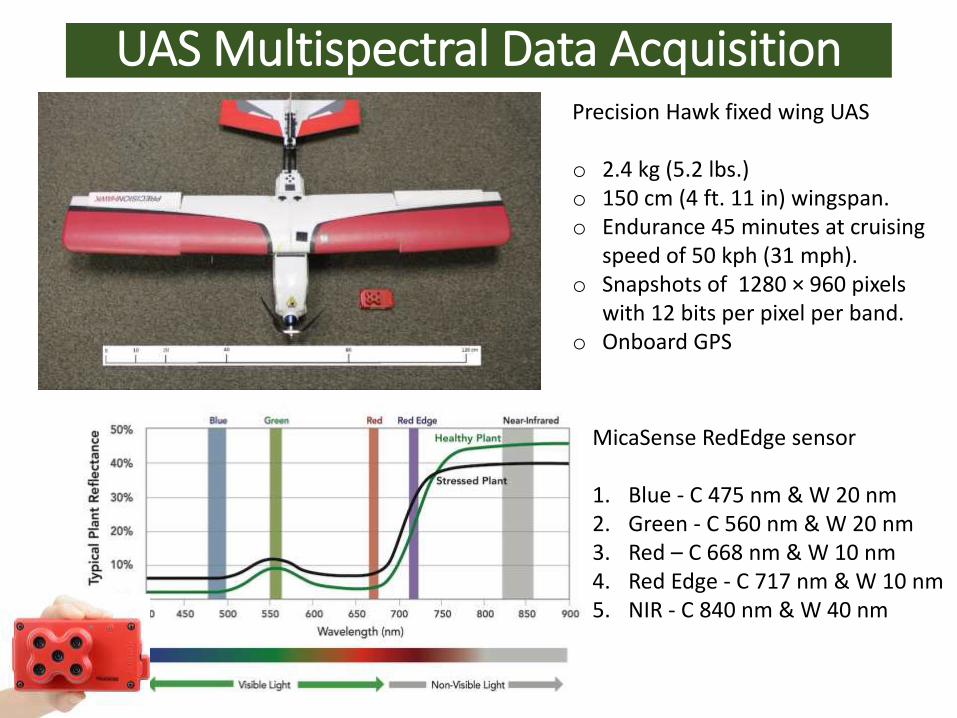
UAS Multispectral Data AcquisitionPrecision Hawk fixed wing UAS
o 2.4 kg (5.2 lbs.)o 150 cm (4 ft. 11 in) wingspan. o Endurance 45 minutes at cruising
speed of 50 kph (31 mph). o Snapshots of 1280 × 960 pixels
with 12 bits per pixel per band. o Onboard GPS
MicaSense RedEdge sensor
1. Blue - C 475 nm & W 20 nm 2. Green - C 560 nm & W 20 nm3. Red – C 668 nm & W 10 nm4. Red Edge - C 717 nm & W 10 nm5. NIR - C 840 nm & W 40 nm
UAS Multispectral Data Acquisition
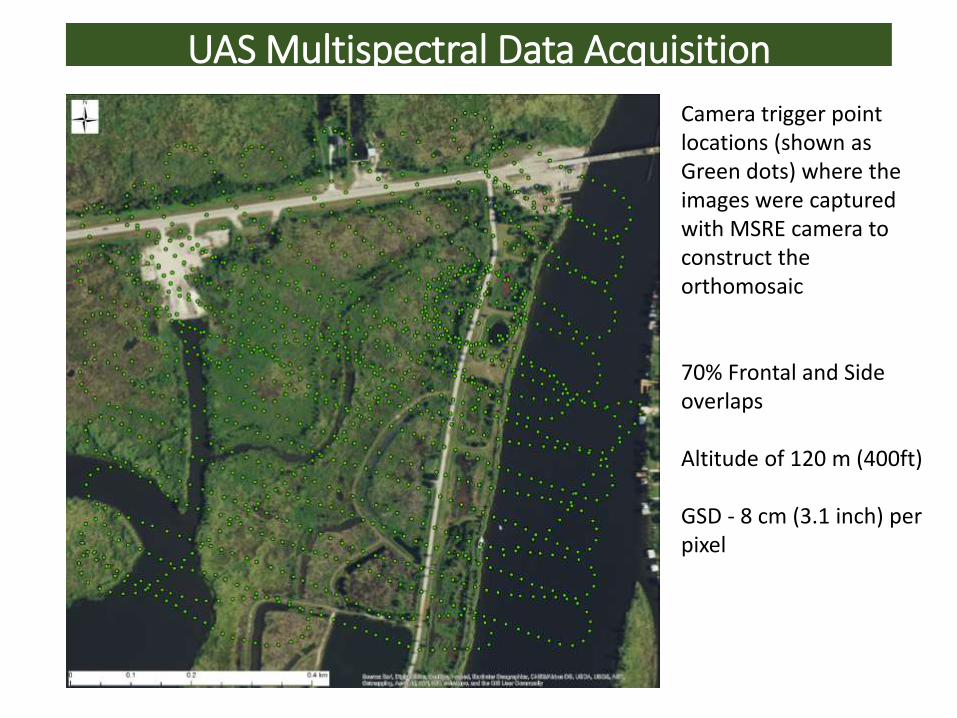
Camera trigger point locations (shown as Green dots) where the images were captured with MSRE camera to construct the orthomosaic
70% Frontal and Side overlaps
Altitude of 120 m (400ft)
GSD - 8 cm (3.1 inch) per pixel
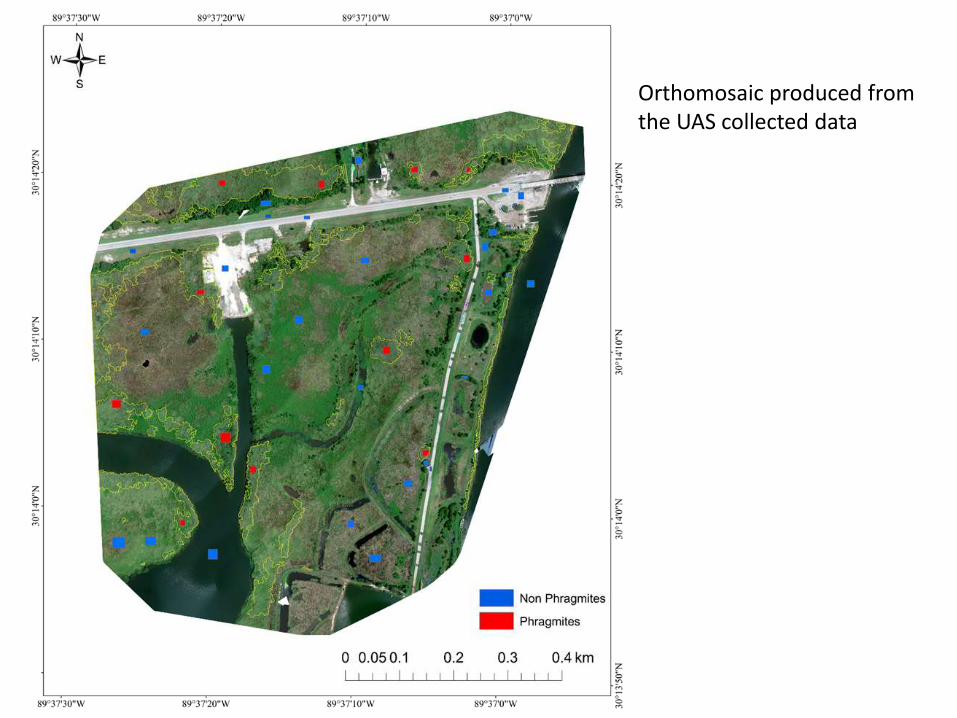
Orthomosaic produced from the UAS collected data
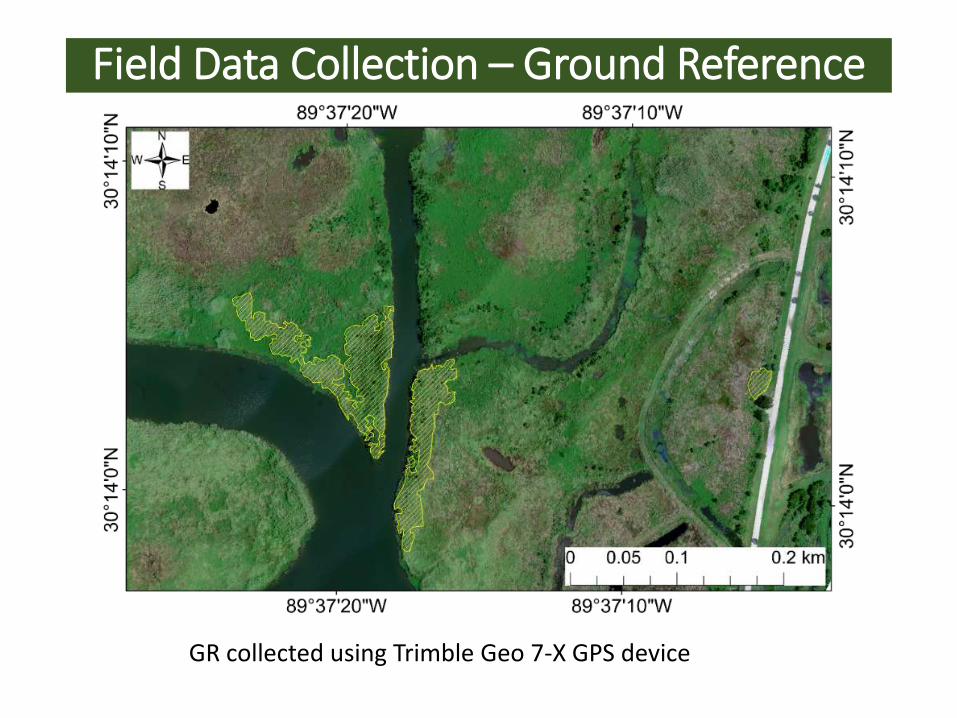
Field Data Collection – Ground Reference
GR collected using Trimble Geo 7-X GPS device
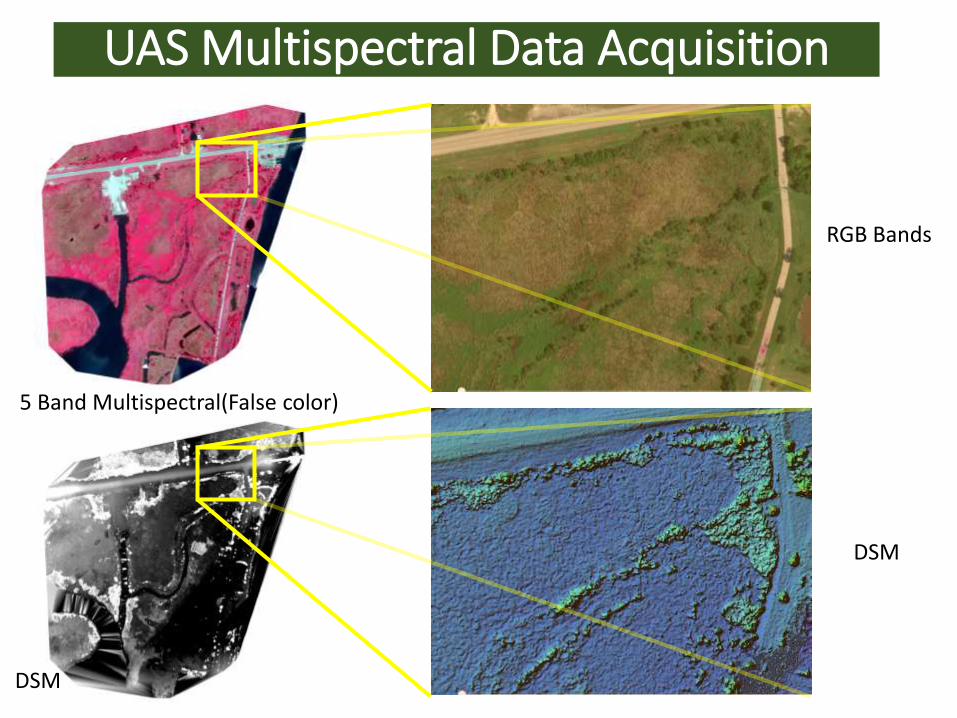
UAS Multispectral Data Acquisition
RGB Bands
DSM
5 Band Multispectral(False color)
DSM
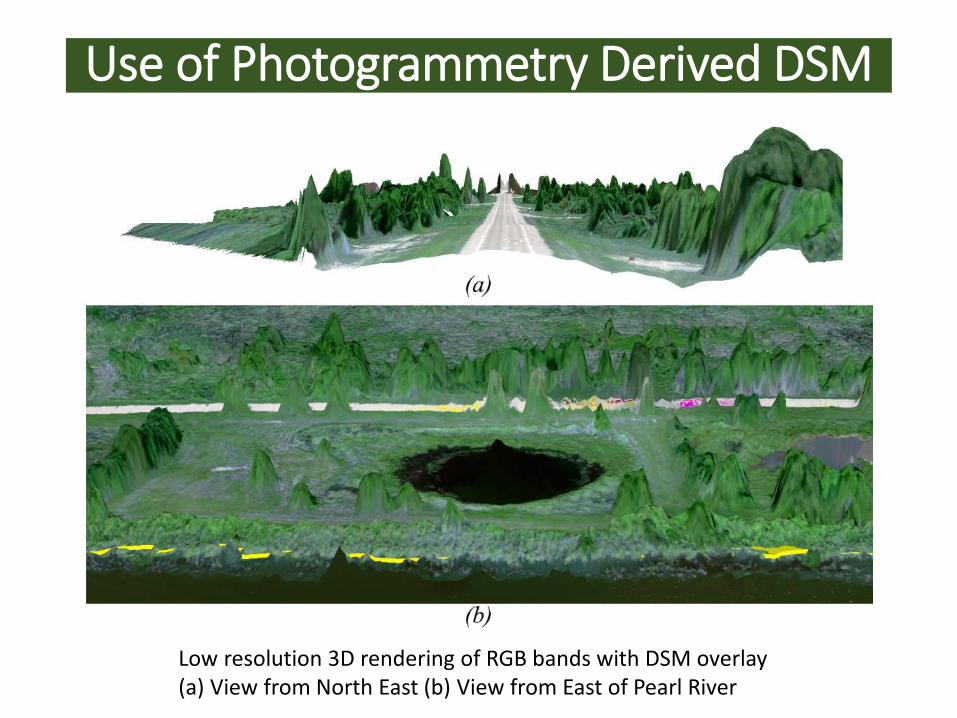
Use of Photogrammetry Derived DSM
Low resolution 3D rendering of RGB bands with DSM overlay (a) View from North East (b) View from East of Pearl River
80
85
90
95
100
105
Tallow
Green
Tallow Red Tallow
Yellow
RedMaple
Green
SweetGum
Green
SweetGum
Yellow
RedMaple
Red
Sycamore Hackberry WaterOak
Cla
ss A
ccura
cie
s
WWV- Classes
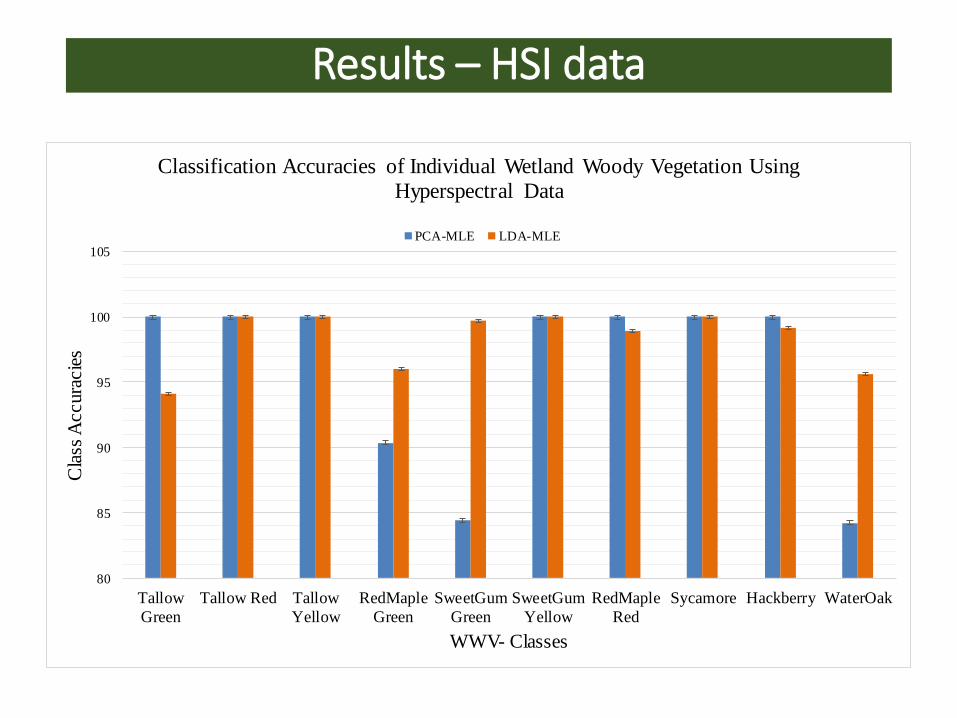
Classification Accuracies of Individual Wetland Woody Vegetation Using
Hyperspectral Data
PCA-MLE LDA-MLE
Results – HSI data
60
65
70
75
80
85
90
95
100
105
Phragmites RiverCane Pickerelweed Cattail Torpedograss Cogongrass GiantCutgrass Hard StemBulrush
Cla
ss A
ccura
cie
s
WHP - Classes
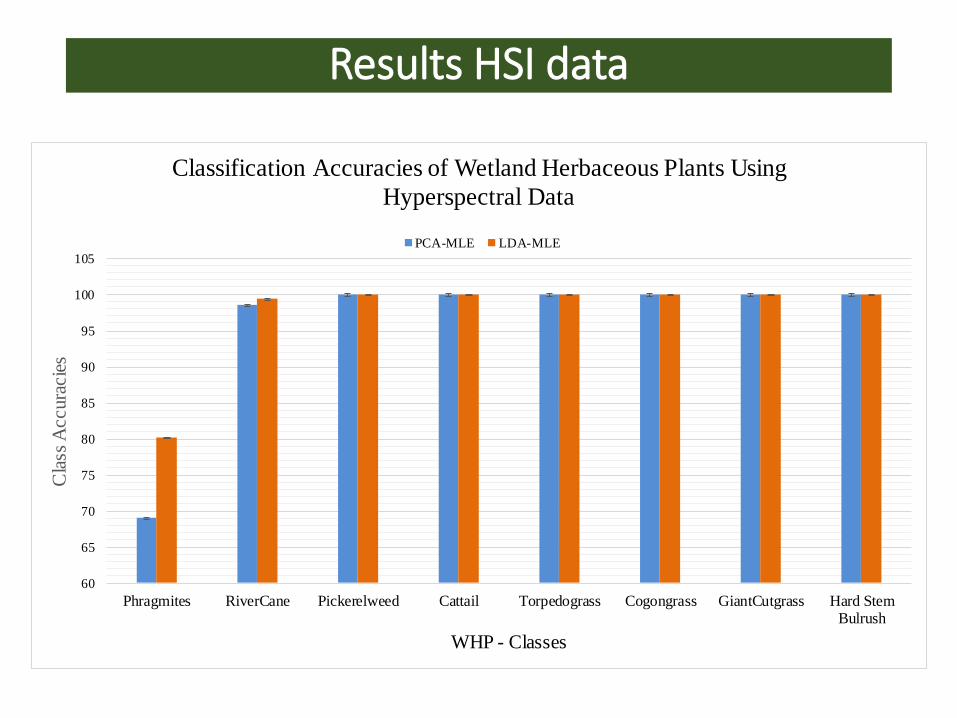
Classification Accuracies of Wetland Herbaceous Plants Using
Hyperspectral Data
PCA-MLE LDA-MLE
Results HSI data
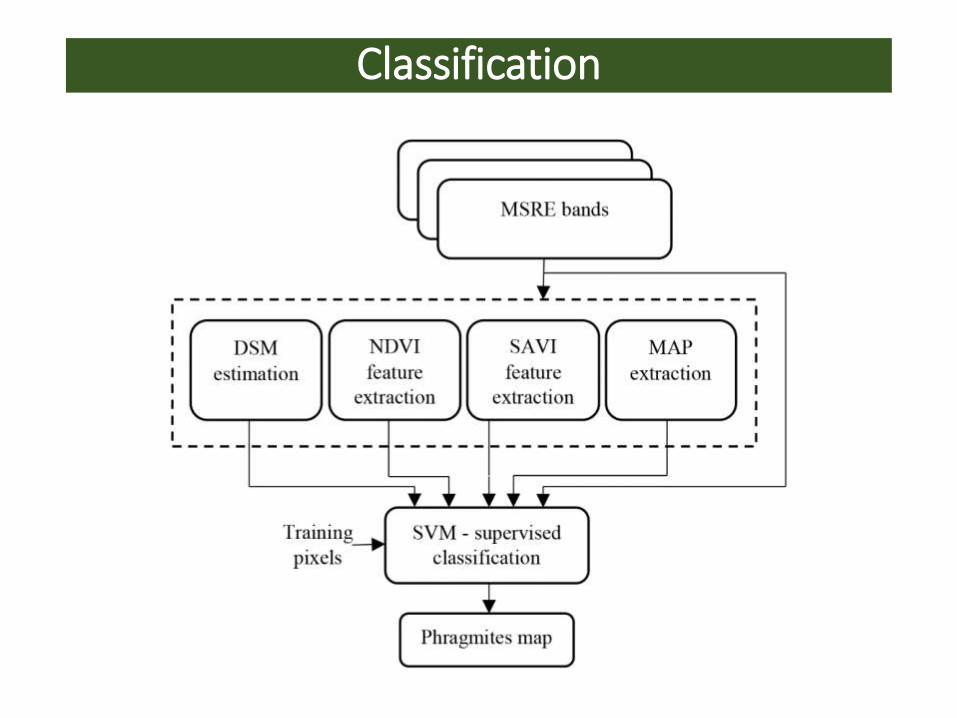
Classification
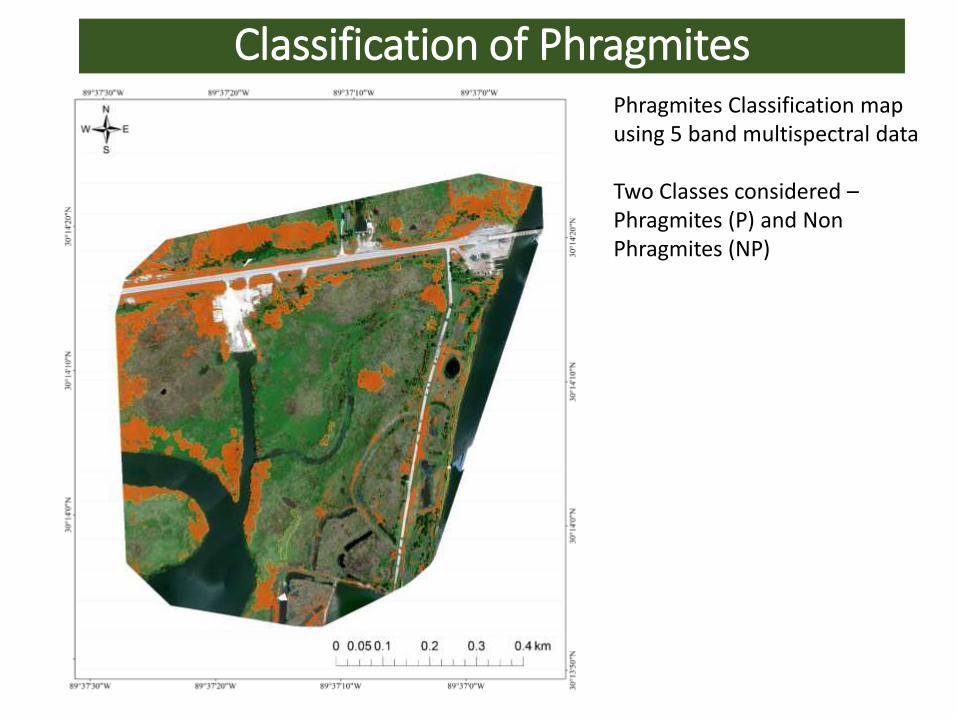
Phragmites Classification map using 5 band multispectral data
Two Classes considered –Phragmites (P) and Non Phragmites (NP)
Classification of Phragmites
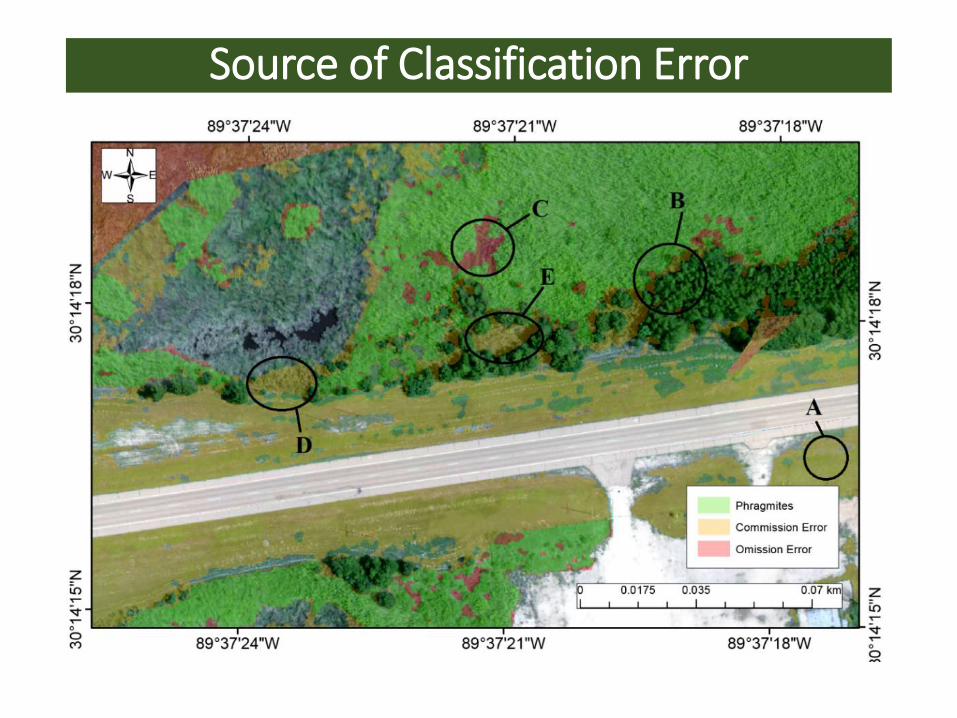
Source of Classification Error
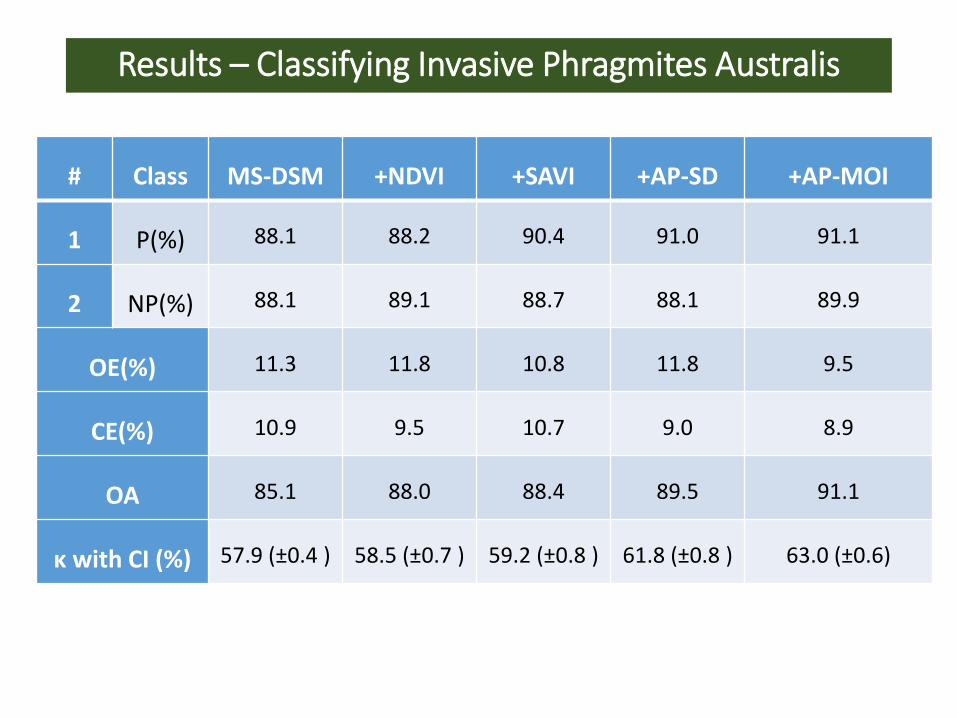
Results – Classifying Invasive Phragmites Australis
# Class MS-DSM +NDVI +SAVI +AP-SD +AP-MOI
1 P(%) 88.1 88.2 90.4 91.0 91.1
2 NP(%) 88.1 89.1 88.7 88.1 89.9
OE(%) 11.3 11.8 10.8 11.8 9.5
CE(%) 10.9 9.5 10.7 9.0 8.9
OA 85.1 88.0 88.4 89.5 91.1
κ with CI (%) 57.9 (±0.4 ) 58.5 (±0.7 ) 59.2 (±0.8 ) 61.8 (±0.8 ) 63.0 (±0.6)
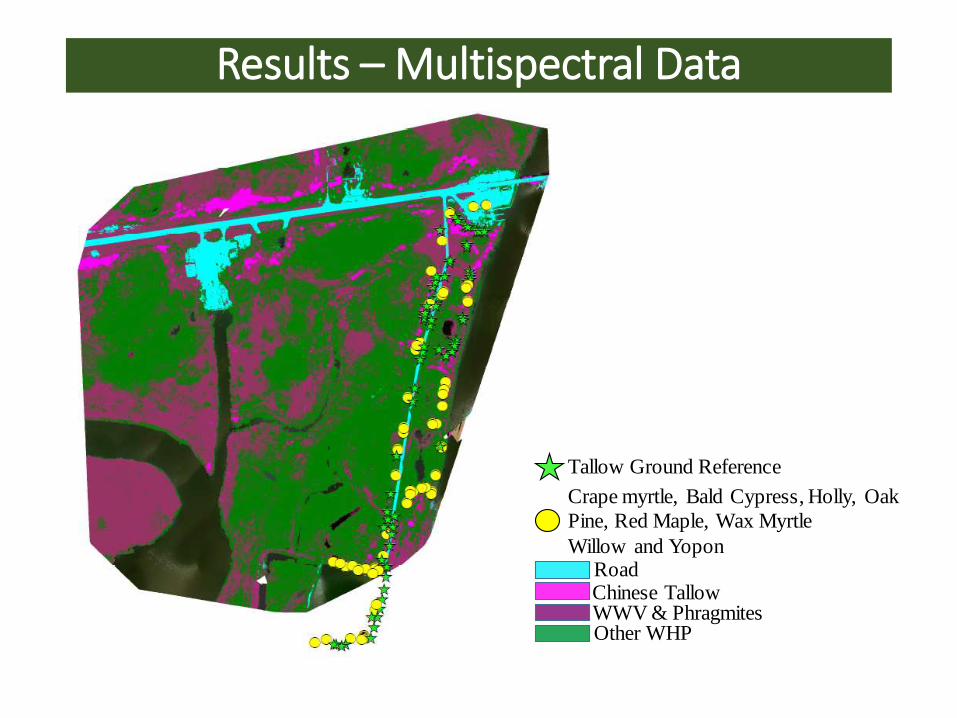
RoadChinese TallowWWV & PhragmitesOther WHP
Tallow Ground Reference
Crape myrtle, Bald Cypress, Holly, Oak
Pine, Red Maple, Wax Myrtle
Willow and Yopon
Results – Multispectral Data

Results – Classifying Invasive Chinese Tallow
Road
Chinese Tallow
Other Trees & Phragmites
Pasture
False Color Multispectral Classification Map
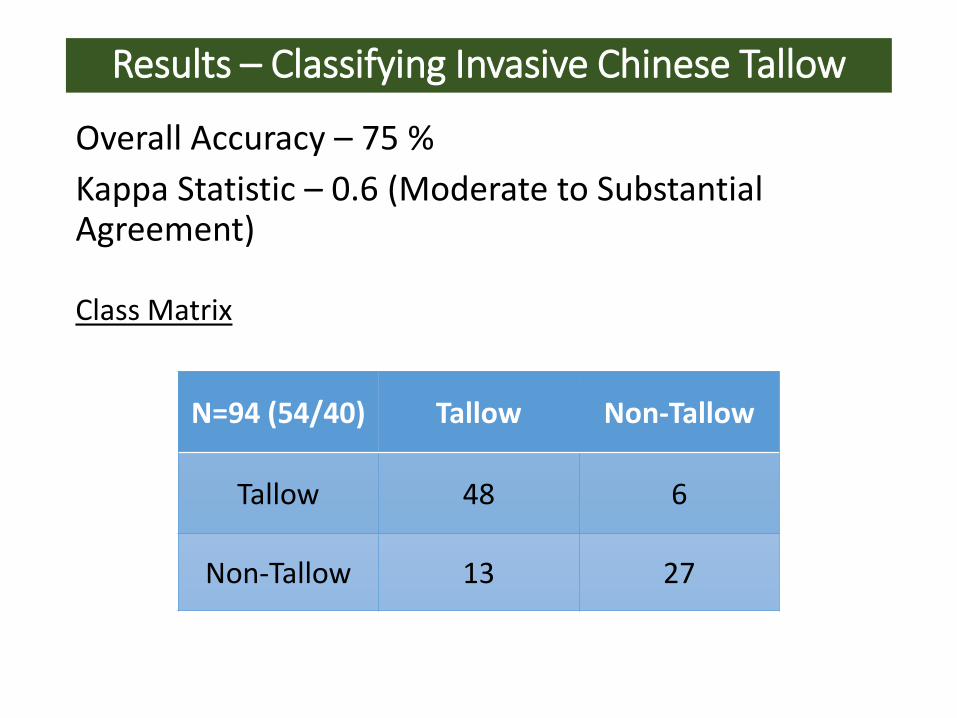
Overall Accuracy – 75 %
Kappa Statistic – 0.6 (Moderate to Substantial Agreement)
Results – Classifying Invasive Chinese Tallow
Class Matrix
N=94 (54/40) Tallow Non-Tallow
Tallow 48 6
Non-Tallow 13 27
Hyperspectral data is useful for classifying various wetland plant species.
Small UAS with commercially available has potential for mapping wetland species
Our results showed that this setup can be useful when classifying a broad group of selected wetland species
It produces subpar results when classifying individual species with subtle differences.
Summary

Questions