Embed Size (px)
Citation preview

Slides by Jonathan Eisen for BIS2C at UC Davis Spring 2016
Lecture 11: Microbial Growth and Functions
BIS 002C Biodiversity & the Tree of Life
Spring 2016
Prof. Jonathan Eisen
1

Slides by Jonathan Eisen for BIS2C at UC Davis Spring 2016
Where we are going and where we have been
• Previous Lecture: !10: Not a Tree
• Current Lecture: !11: Microbial Growth and Functions
• Next Lecture: !12: Symbiosis
2

Slides by Jonathan Eisen for BIS2C at UC Davis Spring 2016
Thought Questions & Main Topics
• What are the ranges of conditions in which life on Earth lives?
• What are the ranges of conditions in which life on Earth prefers to live?
• What are the key ways that living systems acquire carbon and energy?
3

Slides by Jonathan Eisen for BIS2C at UC Davis Spring 2016
Key Concepts and Topics
• Culturing
• Extremophily !Thermophiles !Halophiles
• Trophies
• Oxygen
• More on organelles
4

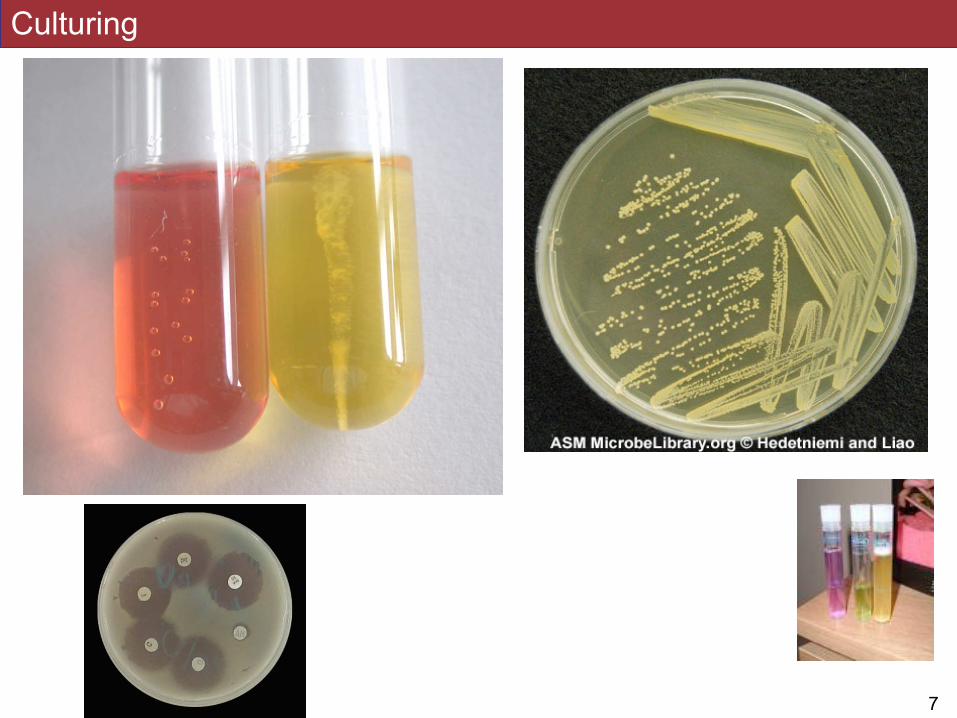
Culturing
• Culturing (or cultivation) is the growth of microorganisms in controlled or defined conditions.
• A pure culture (which is the ideal if possible) is one in which only one type of microbe is present
!5

General approach to culturing
! Collect sample ! Make an environment with specific growth conditions
" Energy " Electrons " Carbon " Other conditions (e.g., O2, temperature, salt, etc)
! Dilution/passaging until one obtains a “pure” sample with just a single clone
!6
Culturing
!7

Slides by Jonathan Eisen for BIS2C at UC Davis Spring 2016
Prokaryotic Cell Division (Part 1)
8

Mitosis
!9

Binary fission and Mitosis Clonal Growth
10
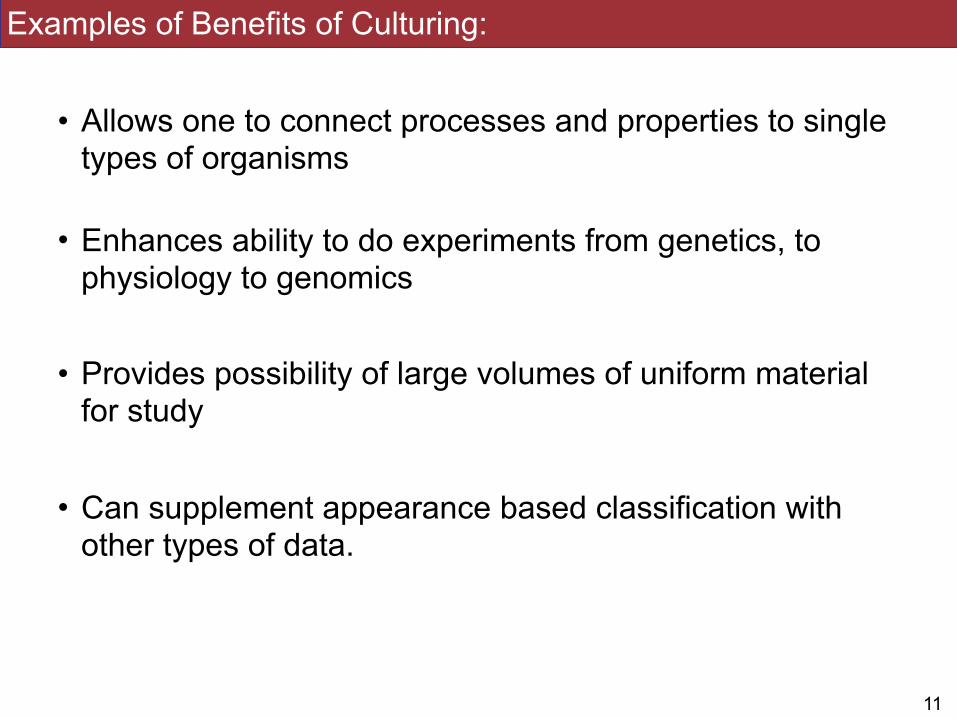
Examples of Benefits of Culturing:
• Allows one to connect processes and properties to single types of organisms
• Enhances ability to do experiments from genetics, to physiology to genomics
• Provides possibility of large volumes of uniform material for study
• Can supplement appearance based classification with other types of data.
!11

Function Example I: Extremophily
!12

Example 1: Thermophiles
!13

Figure 26.16 Some Crenarchaeotes Like It Hot
!14
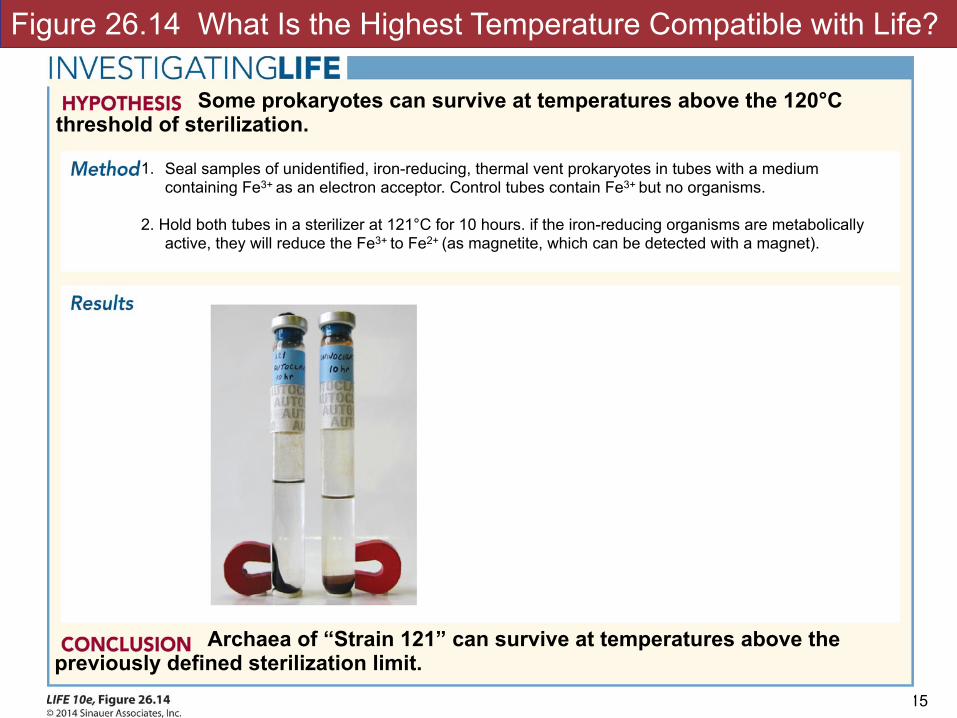
Figure 26.14 What Is the Highest Temperature Compatible with Life?
!15
Some prokaryotes can survive at temperatures above the 120°C threshold of sterilization.
1. Seal samples of unidentified, iron-reducing, thermal vent prokaryotes in tubes with a medium containing Fe3+ as an electron acceptor. Control tubes contain Fe3+ but no organisms.
2. Hold both tubes in a sterilizer at 121°C for 10 hours. if the iron-reducing organisms are metabolically active, they will reduce the Fe3+ to Fe2+ (as magnetite, which can be detected with a magnet).
Archaea of “Strain 121” can survive at temperatures above the previously defined sterilization limit.

Set up some flasks with growth media
60° 70° 80° 90°1 2 3 4 Use different
flasks for different conditions
Determining Optimal Growth Temperature
!1633
Grow starter culture
Add a small portion of the starter culture to flasks
Monitor growth over time

Set up some flasks with growth media
60° 70° 80° 90°1 2 3 4 Use different
flasks for different conditions
1 2 3 460° 70° 80° 90°1h 1h 1h 1h
Determining Optimal Growth Temperature
!1633
Grow starter culture
Add a small portion of the starter culture to flasks
Monitor growth over time

Set up some flasks with growth media
60° 70° 80° 90°1 2 3 4 Use different
flasks for different conditions
1 2 3 460° 70° 80° 90°1h 1h 1h 1h
1 2 3 460° 70° 80° 90°2h 2h 2h 2h
1 2 3 460° 70° 80° 90°3h 3h 3h 3h
Determining Optimal Growth Temperature
!1633
Grow starter culture
Add a small portion of the starter culture to flasks
Monitor growth over time

Growth vs. Time
!17
0.0
20.0
40.0
60.0
80.0
0h 1h 2h 3h
60° 70° 80° 90°
Plot Growth vs. Time for Each Condition
Time Elapsed
Den
sity
of G
row
th

Growth Rate
!18
0.0
12.5
25.0
37.5
50.0
60 °C 70 °C 80 °C 90° C
Calculate and Plot Growth Rate vs. Conditions
Temperature
Gro
wth
Rat
e

Optimal growth temperature (OGT) for Different Species
!19

Optimal growth temperature (OGT) for Different Species
!21
A > B >> E
Mesophile Optimum at 15-45 °C Thermophile Optimum at 45-80°C Hyperthermophile Optimum at > 80°C
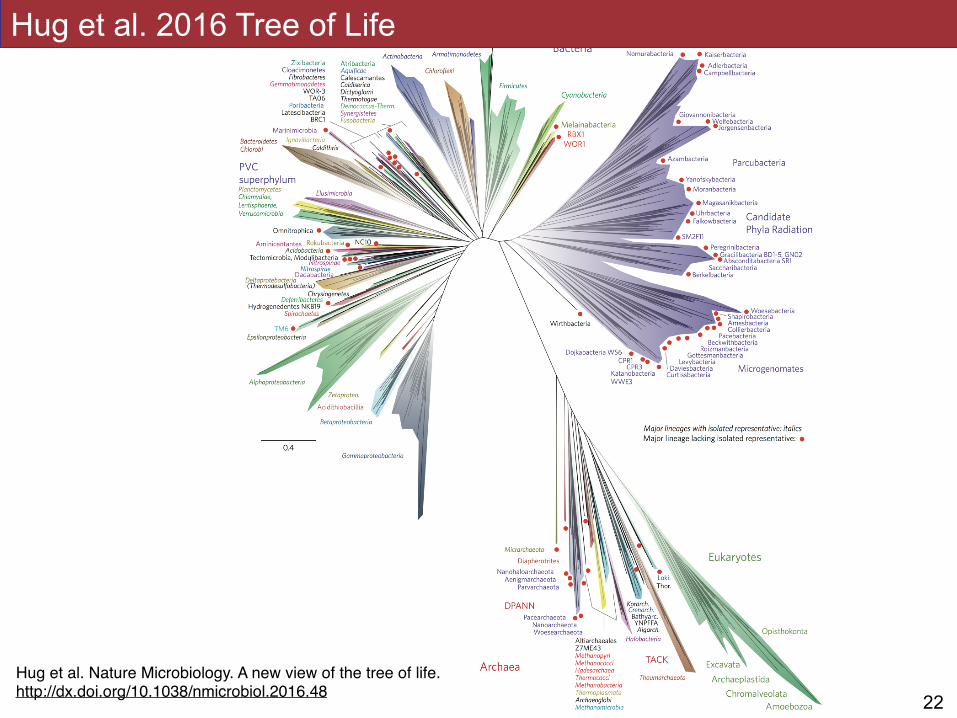
Hug et al 2016
!22
Hug et al. 2016 Tree of Life
Hug et al. Nature Microbiology. A new view of the tree of life. http://dx.doi.org/10.1038/nmicrobiol.2016.48

Hug et al 2016
!24
Thermophiles Across the Tree
Hug et al. Nature Microbiology. A new view of the tree of life. http://dx.doi.org/10.1038/nmicrobiol.2016.48
What are some possible evolutionary scenarios that would account for this pattern of presence of thermophily across the Tree of Life?

Thermophile Adaptations
!30
Stresses of High Temperature
Examples of common adaptations
Denatures proteins, RNA and DNA
Make proteins more stable
Speeds up reactions Slow down enzyme rates
Liquifies membranes Decrease fluidity of membranes

Slides by Jonathan Eisen for BIS2C at UC Davis Spring 2016
Example 1: Extreme Halophiles
31

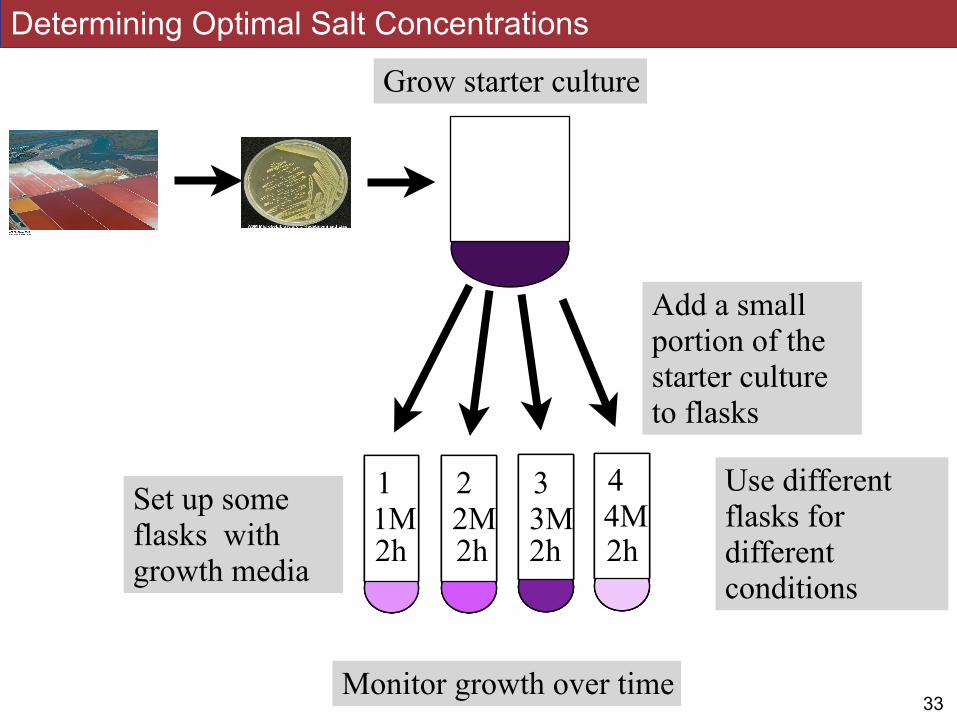
Determining Optimal Salt Concentrations
!3233
Grow starter culture
Set up some flasks with growth media
Add a small portion of the starter culture to flasks
1 2 3 4 Use different flasks for different conditions
1M 2M 3M 4M
Monitor growth over time

Determining Optimal Salt Concentrations
!3233
Grow starter culture
Set up some flasks with growth media
Add a small portion of the starter culture to flasks
1 2 3 4 Use different flasks for different conditions
1M 2M 3M 4M
Monitor growth over time
1 2 3 41M 2M 3M 4M1h 1h 1h 1h
Determining Optimal Salt Concentrations
!3233
Grow starter culture
Set up some flasks with growth media
Add a small portion of the starter culture to flasks
1 2 3 4 Use different flasks for different conditions
1M 2M 3M 4M
Monitor growth over time
1 2 3 41M 2M 3M 4M1h 1h 1h 1h
1 2 3 41M 2M 3M 4M2h 2h 2h 2h
1 2 3 41M 2M 3M 4M3h 3h 3h 3h

Growth vs. Time
Plot Growth vs. Time for Each Condition
!33
0.0
20.0
40.0
60.0
80.0
0h 1h 2h 3h
1M 2M 3M 4M
Time Elapsed
Den
sity
of G
row
th

Growth Rate
!34
0.0
12.5
25.0
37.5
50.0
1M 2M 3M 4M
Calculate and Plot Growth Rate vs. Conditions
Salinity
Gro
wth
Rat
e

Optimal salt concentration for different species
!35

Slides by Jonathan Eisen for BIS2C at UC Davis Spring 2014
Euryarchaeota: Halophiles (Salt lovers)
• Pink carotenoid pigments – very visible
• Have been found at pH up to 11.5.
• Unusual adaptations to high salt, desiccation
• Many have bacteriorhodopsin which uses energy of light to synthesize ATP (photoheterotrophs)
36

Hug et al 2016
!38
Extreme Halophiles Across the Tree
Hug et al. Nature Microbiology. A new view of the tree of life. http://dx.doi.org/10.1038/nmicrobiol.2016.48
What are some possible evolutionary scenarios that would account for this pattern of presence of halophily across the Tree of Life?
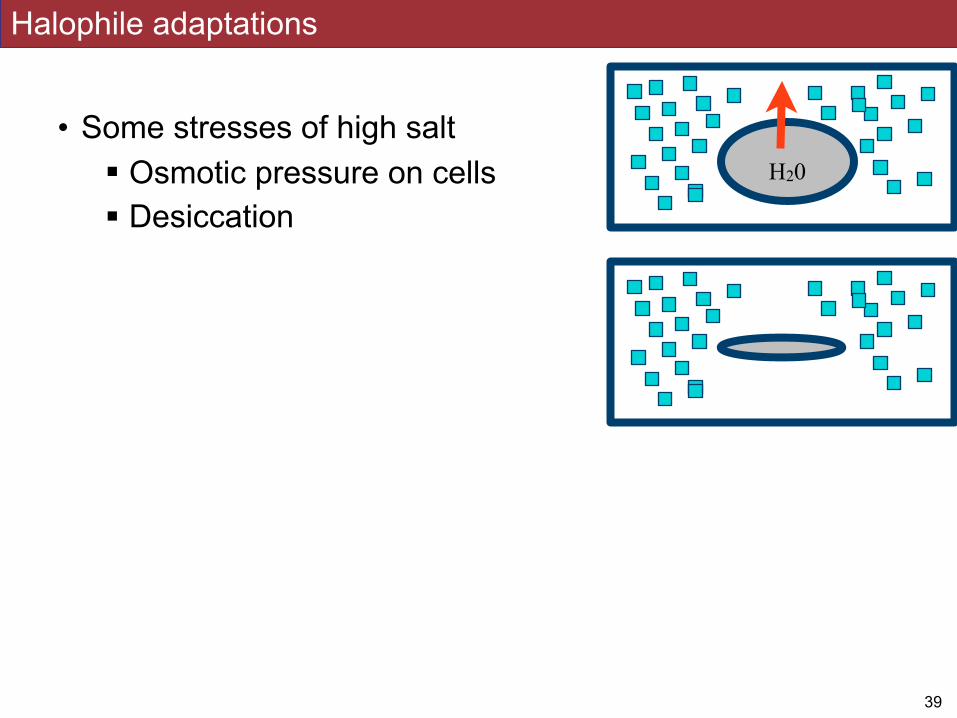
• Some stresses of high salt ! Osmotic pressure on cells ! Desiccation
Halophile adaptations
!39
H20

• Some stresses of high salt ! Osmotic pressure on cells ! Desiccation
• Halophile adaptations ! Increased osmolarity inside cell
" Proteins " Carbohydrates " Salts
! Membrane pumps ! Desiccation resistance
Halophile adaptations
!40
H20
H20

• Some stresses of high salt ! Osmotic pressure on cells ! Desiccation
• Halophile adaptations ! Increased osmolarity inside cell
" Proteins " Carbohydrates " Salts - only done in extremely halophilic archaea
! Membrane pumps ! Desiccation resistance
Halophile adaptations
!42
High internal salt requires ALL cellular components to be adapted to salt, charge. For example, all proteins must change surface charge and other properties.

Slides by Jonathan Eisen for BIS2C at UC Davis Spring 2014
Uses of extremophiles
!43
Type of environment
Examples Example of mechanism of survival
Practical Uses
High temp (thermophiles)
Deep sea vents, hotsprings
Amino acid changes
Heat stable enzymes
Low temp (psychrophile)
Antarctic ocean, glaciers
Antifreeze proteins
Enhancing cold tolerance of crops
High pressure (barophile)
Deep sea vents, hotsprings
Solute changes Industrial processes
High salt (halophiles
Evaporating pools
Incr. internal osmolarity
Soy sauce production
High pH (alkaliphiles)
Soda lakes Transporters Detergents
Low pH (acidophiles)
Mine tailings Transporters Bioremediation
Desiccation (xerophiles)
Deserts Spore formation Freeze-drying additives
High radiation (radiophiles)
Nuclear reactor waste sites
Absorption, repair damage
Bioremediation, space travel

Slides by Jonathan Eisen for BIS2C at UC Davis Spring 2014
Novozymes in Davis
44

Function Example I: Trophies
!45

Incredible diversity in forms of nutrition in bacteria and archaea
• Bacteria and archaea exhibit incredible diversity in how they obtain nutrition (i.e., the processes by which an they assimilates chemicals and energy and uses them for growth)
• Generally referred to with the suffix “trophy”
• Origin: Greek -trophiā, from trophē, from trephein, to nourish.
• Examples: ! autotrophy ! chemotrophy ! phototrophy ! heterotrophy
!46

Component Different FormsEnergy source Light
Photo
Chemical
Chemo
Electron source (reducing equivalent)
Inorganic
Litho
Organic
Organo
Carbon source Carbon from C1 compounds
Auto
Carbon from organics
Hetero
Forms of nutrition (trophy)
• Three main components to “trophy”

Component Different FormsEnergy source Light
Photo
Chemical
Chemo
Electron source (reducing equivalent)
Inorganic
Litho
Organic
Organo
Carbon source Carbon from C1 compounds
Auto
Carbon from organics
Hetero
Forms of nutrition (trophy)
• E. coli • Chemo organo hetero trophy• Chemo hetero trophy

Component Different FormsEnergy source Light
Photo
Chemical
Chemo
Electron source (reducing equivalent)
Inorganic
Litho
Organic
Organo
Carbon source Carbon from C1 compounds
Auto
Carbon from organics
Hetero
Forms of nutrition (trophy)
• Humans? • Chemo organo hetero trophy• Chemo hetero trophy

Component Different FormsEnergy source Light
Photo
Chemical
Chemo
Electron source (reducing equivalent)
Inorganic
Litho
Organic
Organo
Carbon source Carbon from C1 compounds
Auto
Carbon from organics
Hetero
Forms of nutrition (trophy)
• Cyanobacteria • Photo litho auto trophy• Photo auto trophy

Slides by Jonathan Eisen for BIS2C at UC Davis Spring 2014 51
αProteo
Genome
Bacterial cell envelope
Cell membrane
Genome
A Symbiosis with a Proteobacterium

Slides by Jonathan Eisen for BIS2C at UC Davis Spring 2014
Engulfment
52
αProteo
Cell membrane
Genome
Genome
Bacterial cell envelope

Slides by Jonathan Eisen for BIS2C at UC Davis Spring 2014
What Does This Provide Host?
53

Slides by Jonathan Eisen for BIS2C at UC Davis Spring 2014
Symbiosis with Free Living Cyanobacterium
54
N
Mitochondrion
Mitochondrial Genome
MNucleus
Cell membrane
Nuclear Genome
Cyanobacterial Cell envelope
Cyanobacterial Genome Cyano

Slides by Jonathan Eisen for BIS2C at UC Davis Spring 2014
Engulfment
55
N
Mitochondrion
Mitochondrial Genome
MNucleus
Cell membrane
Nuclear Genome
Cyanobacterial Cell envelope
Cyanobacterial Genome Cyano

Slides by Jonathan Eisen for BIS2C at UC Davis Spring 2014
What Does This Provide Host?
56

Slides by Jonathan Eisen for BIS2C at UC Davis Spring 2014
Clicker Question
57

Slides by Jonathan Eisen for BIS2C at UC Davis Spring 2014
Clicker Question
What is the different between chemoautolithotrophy and chemoheterolithotrophy?
• A: The source of electrons
• B: The source of energy
• C: The source of carbon
• D: A and B
• E: All of the above
58

Slides by Jonathan Eisen for BIS2C at UC Davis Spring 2014
Clicker Question
What is the different between chemoautolithotrophy and chemoheterolithotrophy?
• A: The source of electrons
• B: The source of energy
• C: The source of carbon
• D: A and B
• E: A, B and C
59

Slides by Jonathan Eisen for BIS2C at UC Davis Spring 2016
Growth vs. Oxygen
60
Aerobes vs. AnaerobesMicrobes differ in their use and tolerance of oxygen.
1. Aerobes- Require oxygen 2. Anaerobes- Vary in their tolerance/ use of oxygen
Obligate anaerobes – oxygen is toxic.
Aerotolerant anaerobes – can’t use oxygen, but are not damaged by it.
Facultative anaerobes – don’t need oxygen, but use it when available.

Organelle Evolution
61

Simple Species Tree for Three Domains
62
Archaea Eukaryotes Bacteria

63
Archaea Euks BacteriaTACK
Eocyte Species Tree for Three Domains

Acquisition of Mitochondria At Base of Eukaryotic Branch
64
Archaea Euks BacteriaTACK

Endosymbiosis Shown on Species Tree
65
Archaea Euks BacteriaTACK

Continued Evolution After Endosymbiosis
66
Archaea Euks BacteriaTACK

Simple Model Showing Some Diversification within Eukaryotes
67
A2 E1 PBT E2 B2 B3 B4A1 A3

68
Suppose we built phylogenetic trees with different genes from each of these species
A2 E1 PBT E2 B2 B3 B4A1 A3
Simple Model Showing Some Diversification within Eukaryotes

Gene Set 1
69
A2 E1 PBT E2 B2 B3 B4A1 A3
Some Genes with Show This Pattern with Eukaryotes Sister to TACK

Gene Set 2: Organellar Genes
70
A2 E1 PBT E2 B2 B3 B4A1 A3
Some Genes with Show Alternative Pattern With “Eukaryotes” Branching within Bacteria

After Additional Speciation in the Eukaryote Portion of the Tree
71
A2 E1 PBT E2 B2 B3 B4A1 A3 E3

Gene transfer model
72
A2 E1 PBT E2 B2 B3 B4A1 A3 E3
Suppose we built phylogenetic trees with different genes from each of these species

Nuclear Genes
73
A2 E1 PBT E2 B2 B3 B4A1 A3 E3
Some Genes with Show This Pattern with Eukaryotes Sister to TACK
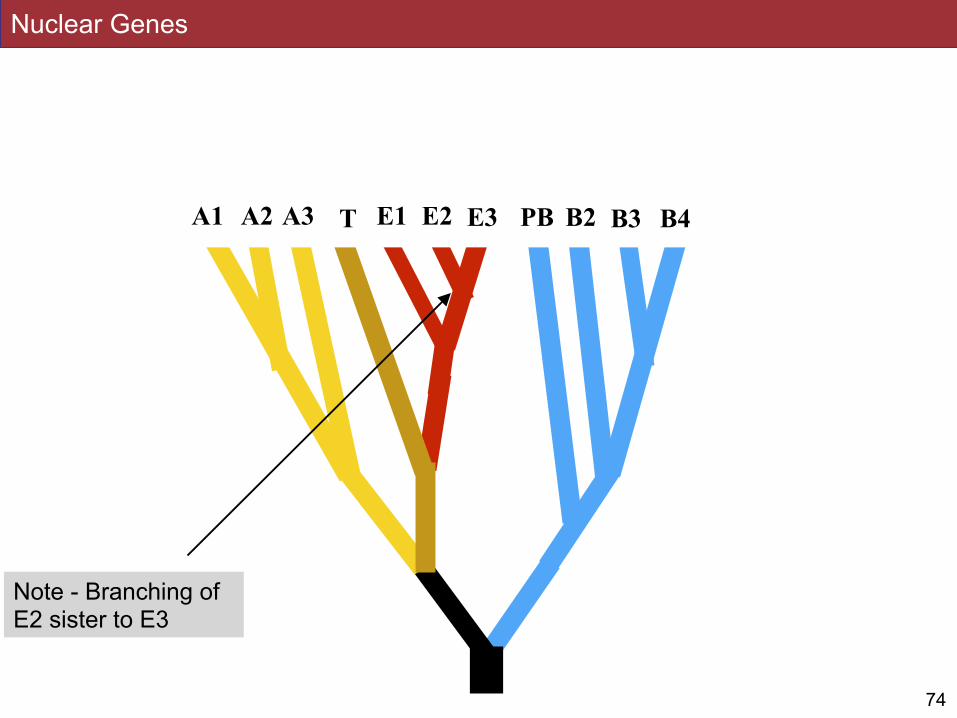
Nuclear Genes
74
A2 E1 PBT E2 B2 B3 B4A1 A3 E3
Note - Branching of E2 sister to E3

Mitochondrial Genes
76
A2 E1 PBT E2 B2 B3 B4A1 A3 E3
Some Genes with Show Alternative Pattern With “Eukaryotes” Branching within Bacteria

Mitochondrial Genes
77
A2 E1 PBT E2 B2 B3 B4A1 A3 E3
Note - Branching of E2 sister to E3

Mitochondrial Genes
78
A2 E1 PBT E2 B2 B3 B4A1 A3 E3
The topology of the tree within Eukaryotes is the same regardless of which genes. They differ in where eukaryotes placed in the tree.

Another Symbioses - with a CB - Cyanobacterium
79
Archaea T PBEukaryotes CB B3 B4

80
Another Symbioses - with a CB - Cyanobacterium
Archaea T PBEukaryotes CB B3 B4

81
Continued Evolution - Diversification of Plants
Archaea T PBE1 CB B3 B4E2 Plants
Suppose we built phylogenetic trees with different genes from each of these species