Embed Size (px)
Citation preview

2015 Holiday shopping
survey results
July 2015
epsilon.com
Nothing says holidays and mistletoe like blazing sun and beach trips, right?
The reality is that shoppers are already thinking about their holiday purchases and retailers are well underway in their holiday planning. For example, Amazon Prime Day got everyone who wasn’t already ready, in the mood to buy.
The pages of this ebook will provide you with insights to understand the shopping plans and habits of your customers. After reviewing this research you will be armed with the intelligence to insure that your bottom line can enjoy “happy holidays.”
• Nearly one-in-five (18%) respondents already started their winter holiday shopping as of this June. • Of these, over one-third (36%) did their
shopping within the first quarter of the year, while one-fourth did so in April and May.
• Well over half (56%) plan to do their holiday shopping in October and November, 74% in September, October, or November.
• Holiday gifts are most frequently (at over 90%) purchased for immediate family members such as Sons/Daughters and Spouses/Partners. • Spending is also highest for these folks
– on average $100 for Sons/Daughters and $93 for Spouses/Partners. It’s also relatively high for Grandchildren at $81.
• Planned spending for the majority (71%) of shoppers will be About the Same as last year, while one-fifth claim their spending will be Lower. • The average amount planned to be spent
on gifts this holiday season is $554.
• As for the types of gifts planned to be purchased, Clothes is #1 by far as 71% say they’ll be purchasing them.• Clothing apparel tends to skews Younger
and Female; however, it’s still the most commonly purchased item across all age groups and by Males.
• Toys are the next most commonly purchased item at 55%, especially among those under 45 years (69%).
Highlights
We recently conducted a survey of our Shopper’s Voice® customers and discovered what is on their minds for 2015. The following pages detail the results of the survey.
Highlights (cont.)
• Electronics and Books are in the following tier of gifts to be purchased at 43% and 42% respectively. • Women are more likely to purchase ALL
types of gifts items with the exception of Electronics and Sports Equipment which skew more Male.
• Three-quarters (74%) of respondents plan to purchase Gift Cards, most often For a Specific Store (i.e. valid at only one store) at 64%. • Over half of gift cards are for Food and
Beverage.• Those For Multiple Stores are much less
popular at 19%.
• In terms of how the gifts will likely be purchased, At the Store (90%) and Online (83%) are most anticipated.• The latter being on a Computer instead
of a Tablet or Smartphone.
• Compared to last year, At the Store will be About the Same (80%) as will Online on a Computer (63%). • Purchasing via Mail, Phone, and Tablet is
anticipated to be much Lower.
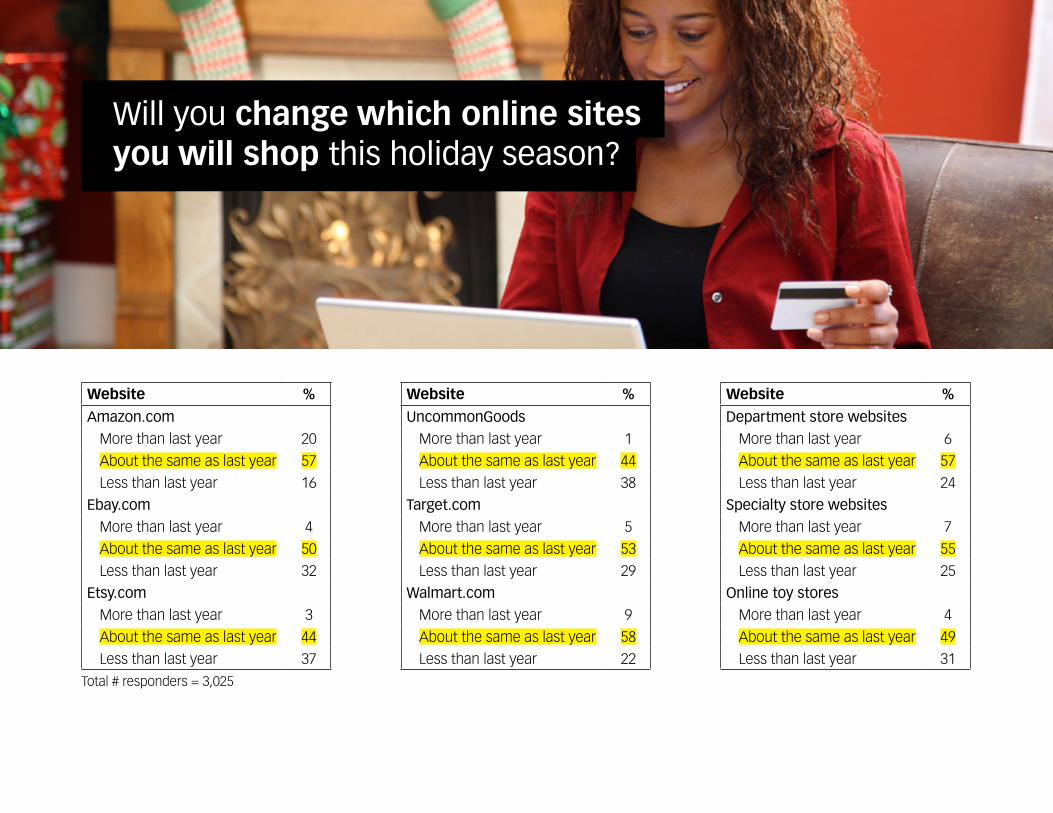
• Regarding online shopping, Amazon is the only retailer that respondents anticipate spending More than last year.• Spending on other websites including
Mass Merchandisers and Department Stores is expected to be Less.
• The most popular ways to shop for holiday gifts is by Looking at a Product Online and then Purchasing it in Store (58%) OR Looking at a Product in Store and then Purchasing it Online (53%).
• Of the 24% who Interact with Virtual Bulletin Board Sites, the majority (83%) Click on Posts to Learn More About Ideas and 74% Click on Posts to Learn More About Where to Buy it.• Effectively 33% Click on a Post and Make
a Purchase.
Highlights (cont.)
• TV Advertising, Email from Brands, and Newspaper Adverts are considered to be most influence purchasing.
• Family or Friends tend to most impact the decision to buy holiday gifts as compared to Online Reviews, Colleagues or Social Media.
• If having to choose only one way to purchase an item from Catalog Sent in the Mail, the most common method would be to purchase it Online (42%) followed by At the Store (24%).
• Cash and Debit Cards are the payment methods that most respondents expect to implement when making their holiday gift purchases.• The next most popular method is using a
Visa (51%).
• Online Shopping is more likely to happen during the early Evening vs. In Store which skews towards Morning.
• As for the days shopped for holiday gifts, last year 31% shopped on Black Friday and 32% did so on Cyber Monday, while this year slightly more (at 33% and 34% respectively) plan to do so on those very same days. • Notably 46% of respondents Didn’t Do
Any Shopping around the Thanksgiving Holiday or Christmas Eve, and a similar number (44%) don’t plan to this year as well..
• Nearly half (48%) of those Under 45 plan to Regularly Use Online Sites or Emails to find better deals.• 86% will Regularly/Occasionally use
these sources to do this.
• Females are much more deal-oriented when it comes to holiday shopping as 79% plan to Use Coupons Received By Mail, 72% Do Price Comparisons Online, 70% Print and Use Coupons Received By Email or 67% Coupons Found Online.• The key practice that Men do is Do Price
Comparisons Online, which 66% of them do.
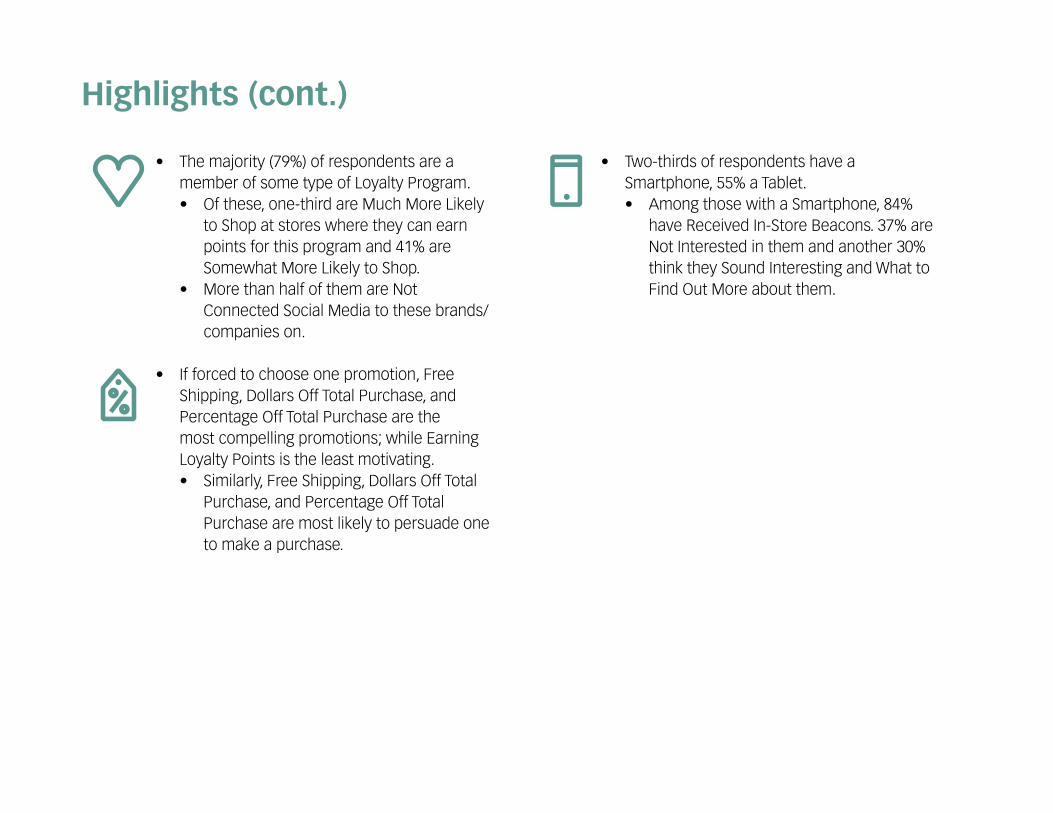
• Two-thirds of respondents have a Smartphone, 55% a Tablet.• Among those with a Smartphone, 84%
have Received In-Store Beacons. 37% are Not Interested in them and another 30% think they Sound Interesting and What to Find Out More about them.
Highlights (cont.)
• The majority (79%) of respondents are a member of some type of Loyalty Program. • Of these, one-third are Much More Likely
to Shop at stores where they can earn points for this program and 41% are Somewhat More Likely to Shop.
• More than half of them are Not Connected Social Media to these brands/companies on.
• If forced to choose one promotion, Free Shipping, Dollars Off Total Purchase, and Percentage Off Total Purchase are the most compelling promotions; while Earning Loyalty Points is the least motivating.• Similarly, Free Shipping, Dollars Off Total
Purchase, and Percentage Off Total Purchase are most likely to persuade one to make a purchase.
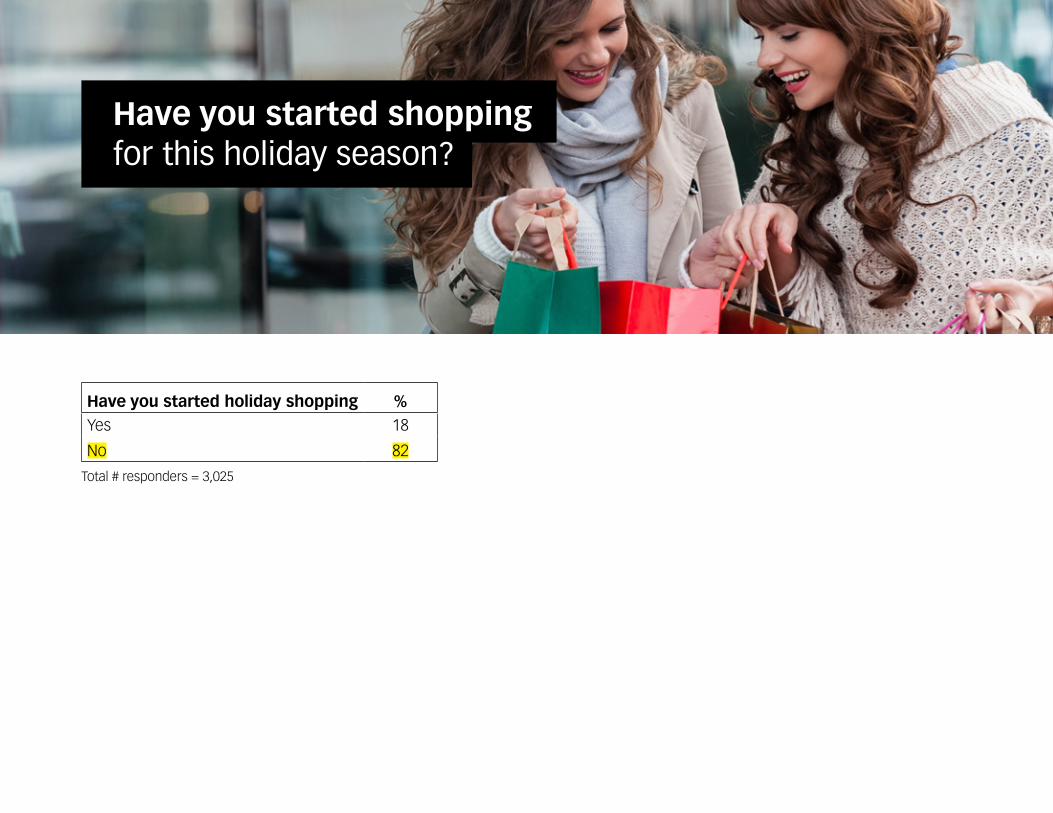
Have you started holiday shopping %Yes 18
No 82
Total # responders = 3,025
Have you started shopping for this holiday season?
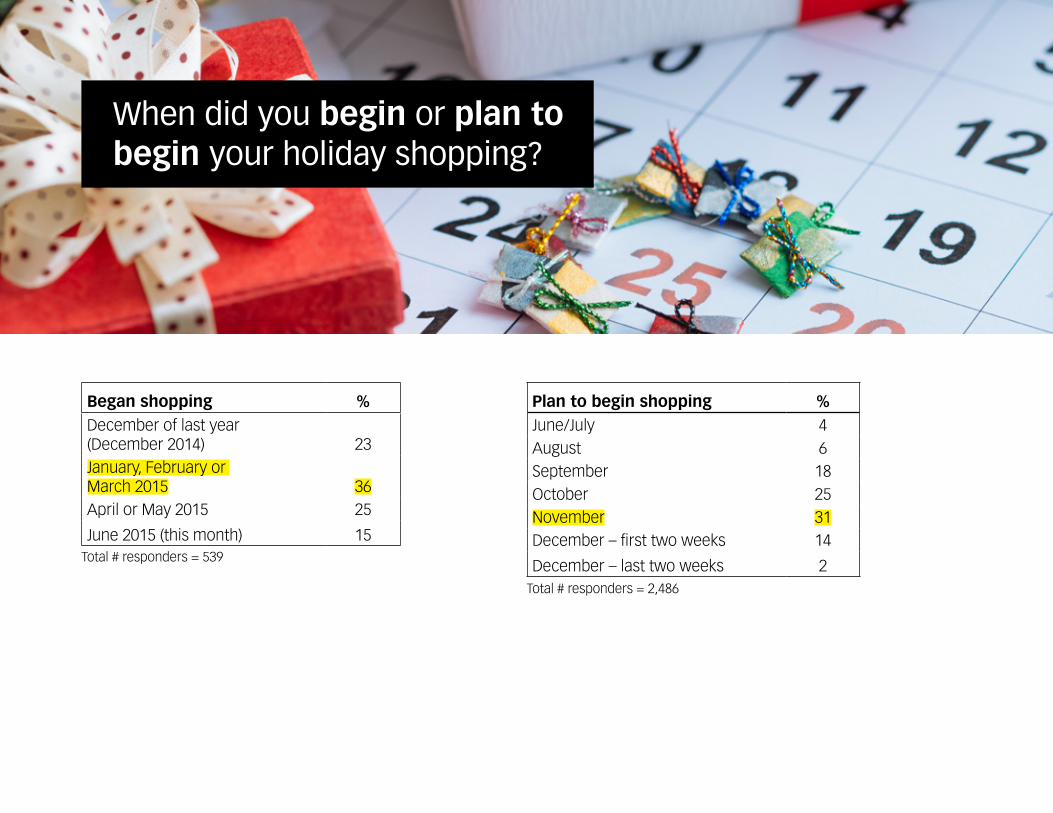
Began shopping %December of last year (December 2014) 23January, February or March 2015 36April or May 2015 25
June 2015 (this month) 15Total # responders = 539
When did you begin or plan to begin your holiday shopping?
Plan to begin shopping %June/July 4August 6September 18October 25November 31December – first two weeks 14
December – last two weeks 2Total # responders = 2,486
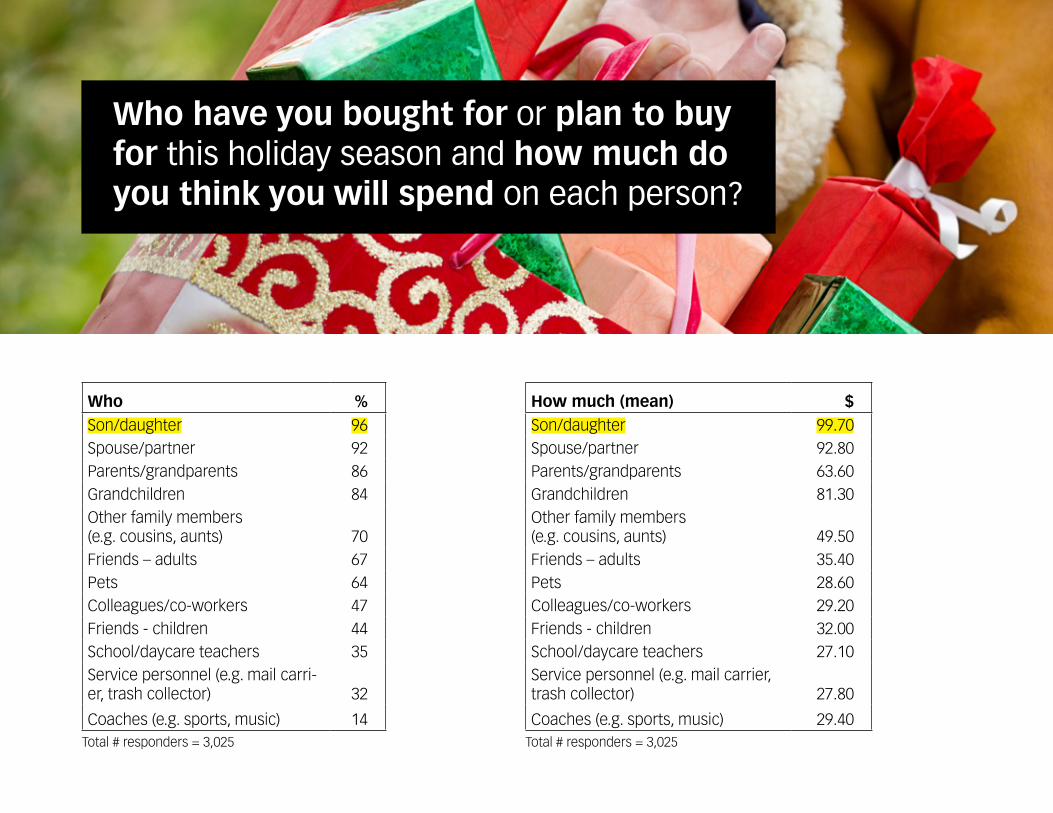
Who have you bought for or plan to buy for this holiday season and how much do you think you will spend on each person?
Who %Son/daughter 96Spouse/partner 92Parents/grandparents 86Grandchildren 84Other family members (e.g. cousins, aunts) 70Friends – adults 67Pets 64Colleagues/co-workers 47Friends - children 44School/daycare teachers 35Service personnel (e.g. mail carri-er, trash collector) 32
Coaches (e.g. sports, music) 14Total # responders = 3,025 Total # responders = 3,025
How much (mean) $Son/daughter 99.70Spouse/partner 92.80Parents/grandparents 63.60Grandchildren 81.30Other family members (e.g. cousins, aunts) 49.50Friends – adults 35.40Pets 28.60Colleagues/co-workers 29.20Friends - children 32.00School/daycare teachers 27.10Service personnel (e.g. mail carrier, trash collector) 27.80
Coaches (e.g. sports, music) 29.40
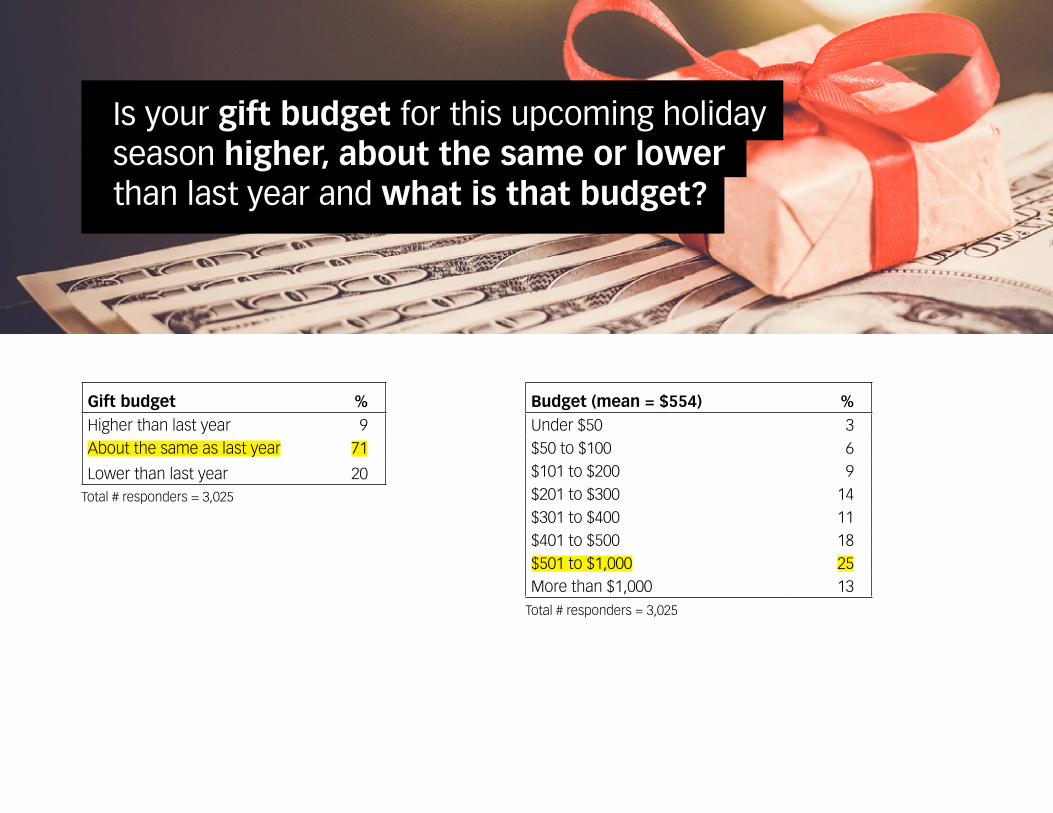
Is your gift budget for this upcoming holiday season higher, about the same or lower than last year and what is that budget?
Gift budget %Higher than last year 9About the same as last year 71
Lower than last year 20Total # responders = 3,025
Total # responders = 3,025
Budget (mean = $554) %Under $50 3$50 to $100 6$101 to $200 9$201 to $300 14$301 to $400 11$401 to $500 18$501 to $1,000 25More than $1,000 13
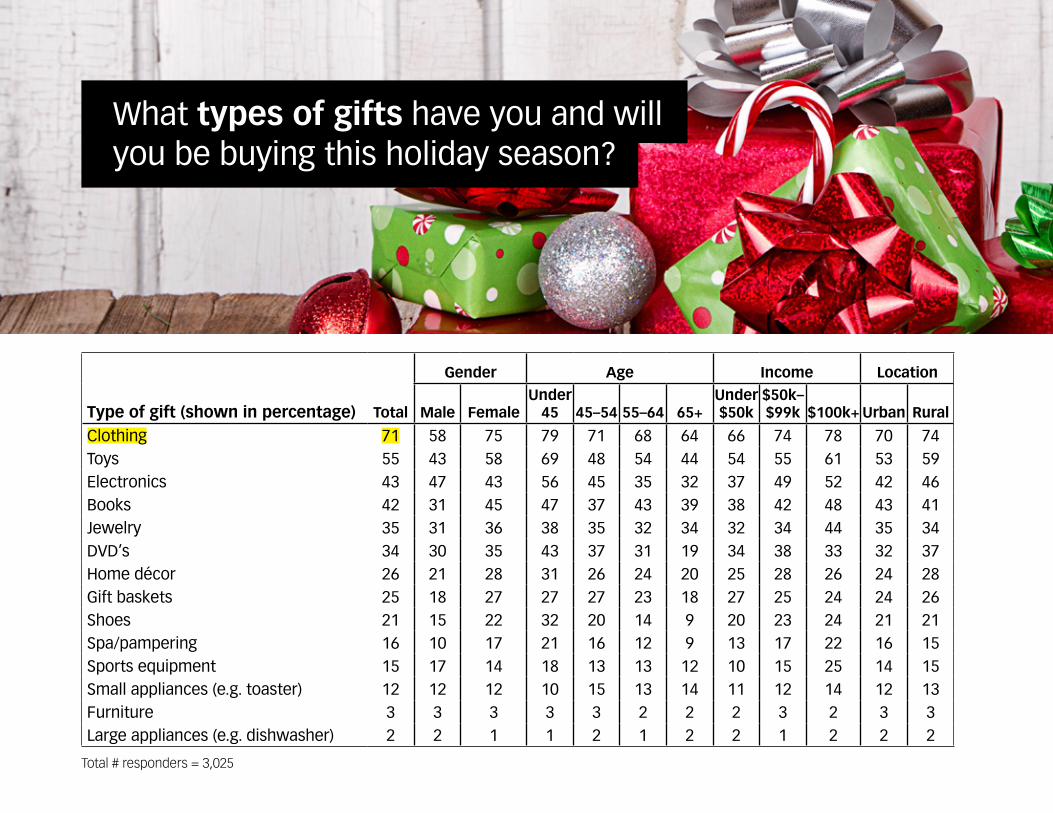
What types of gifts have you and will you be buying this holiday season?
Total # responders = 3,025
Type of gift (shown in percentage) Total
Gender Age Income Location
Male FemaleUnder
45 45–54 55–64 65+Under $50k
$50k–$99k $100k+ Urban Rural
Clothing 71 58 75 79 71 68 64 66 74 78 70 74Toys 55 43 58 69 48 54 44 54 55 61 53 59Electronics 43 47 43 56 45 35 32 37 49 52 42 46Books 42 31 45 47 37 43 39 38 42 48 43 41Jewelry 35 31 36 38 35 32 34 32 34 44 35 34DVD’s 34 30 35 43 37 31 19 34 38 33 32 37Home décor 26 21 28 31 26 24 20 25 28 26 24 28Gift baskets 25 18 27 27 27 23 18 27 25 24 24 26Shoes 21 15 22 32 20 14 9 20 23 24 21 21Spa/pampering 16 10 17 21 16 12 9 13 17 22 16 15Sports equipment 15 17 14 18 13 13 12 10 15 25 14 15Small appliances (e.g. toaster) 12 12 12 10 15 13 14 11 12 14 12 13Furniture 3 3 3 3 3 2 2 2 3 2 3 3Large appliances (e.g. dishwasher) 2 2 1 1 2 1 2 2 1 2 2 2
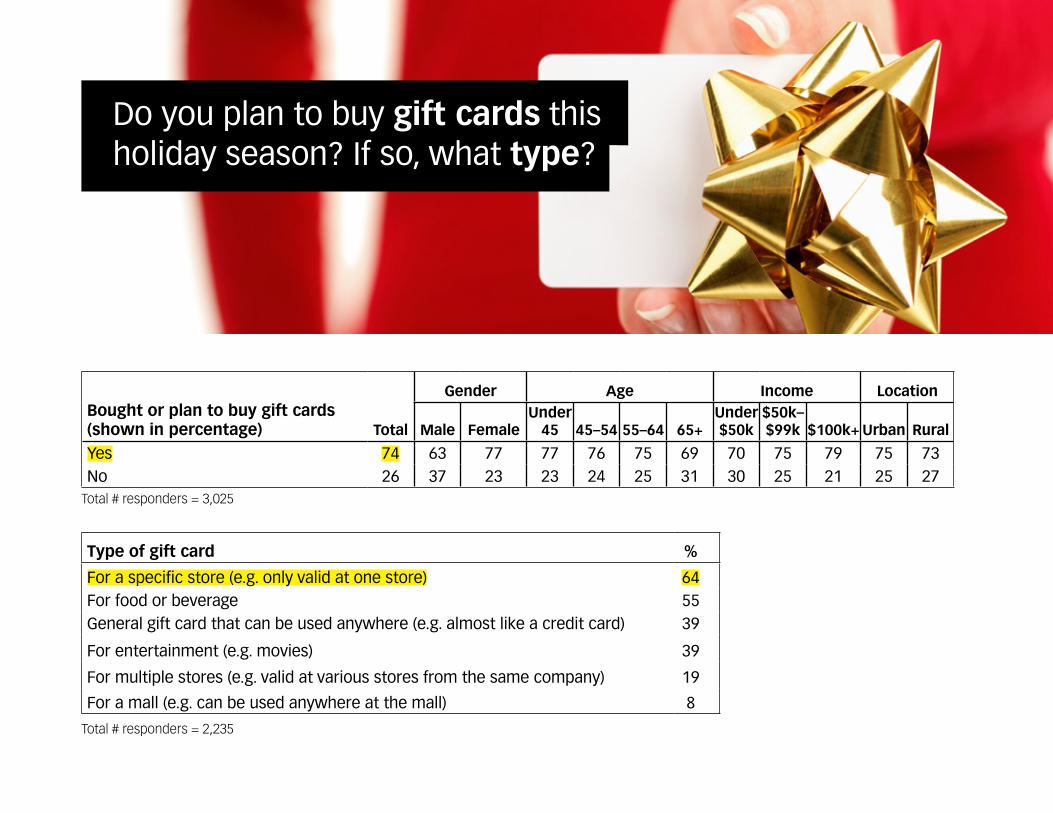
Do you plan to buy gift cards this holiday season? If so, what type?
Total # responders = 3,025
Bought or plan to buy gift cards (shown in percentage) Total
Gender Age Income Location
Male FemaleUnder
45 45–54 55–64 65+Under $50k
$50k–$99k $100k+ Urban Rural
Yes 74 63 77 77 76 75 69 70 75 79 75 73No 26 37 23 23 24 25 31 30 25 21 25 27
Type of gift card %
For a specific store (e.g. only valid at one store) 64For food or beverage 55General gift card that can be used anywhere (e.g. almost like a credit card) 39
For entertainment (e.g. movies) 39
For multiple stores (e.g. valid at various stores from the same company) 19
For a mall (e.g. can be used anywhere at the mall) 8
Total # responders = 2,235
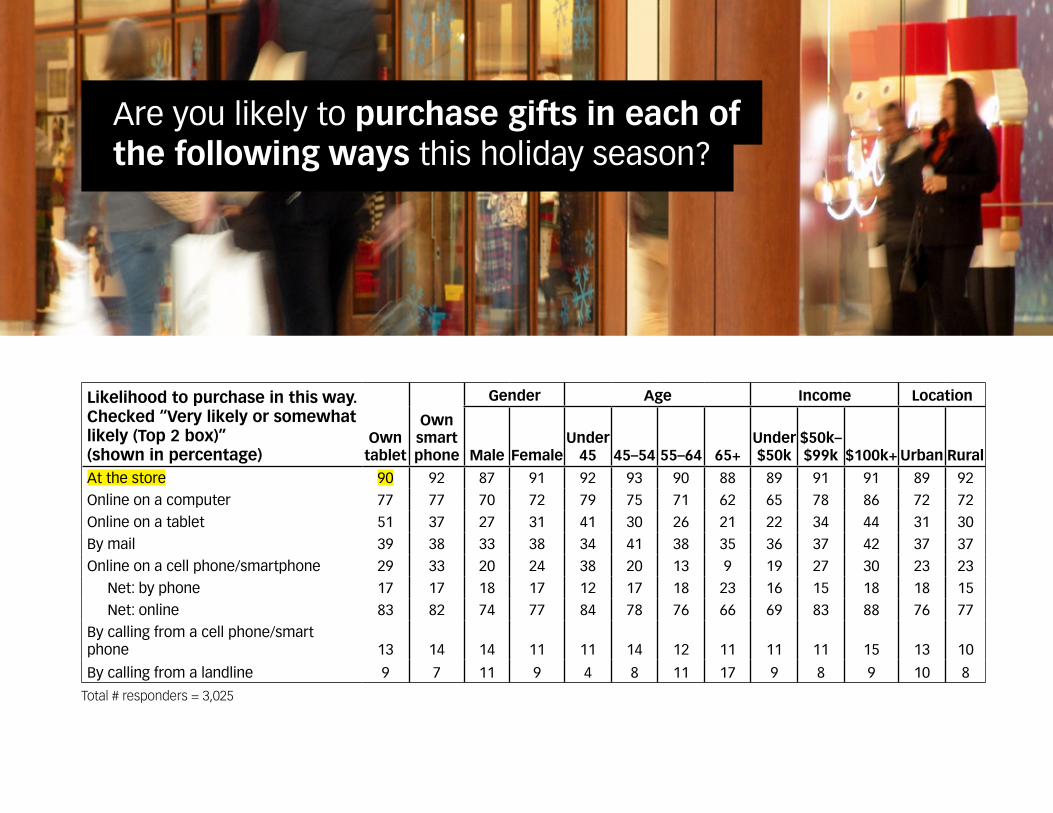
Are you likely to purchase gifts in each of the following ways this holiday season?
Total # responders = 3,025
Likelihood to purchase in this way. Checked “Very likely or somewhat likely (Top 2 box)” (shown in percentage)
Own tablet
Own smart phone
Gender Age Income Location
Male FemaleUnder
45 45–54 55–64 65+Under $50k
$50k–$99k $100k+ Urban Rural
At the store 90 92 87 91 92 93 90 88 89 91 91 89 92Online on a computer 77 77 70 72 79 75 71 62 65 78 86 72 72Online on a tablet 51 37 27 31 41 30 26 21 22 34 44 31 30By mail 39 38 33 38 34 41 38 35 36 37 42 37 37Online on a cell phone/smartphone 29 33 20 24 38 20 13 9 19 27 30 23 23 Net: by phone 17 17 18 17 12 17 18 23 16 15 18 18 15 Net: online 83 82 74 77 84 78 76 66 69 83 88 76 77By calling from a cell phone/smart phone 13 14 14 11 11 14 12 11 11 11 15 13 10
By calling from a landline 9 7 11 9 4 8 11 17 9 8 9 10 8
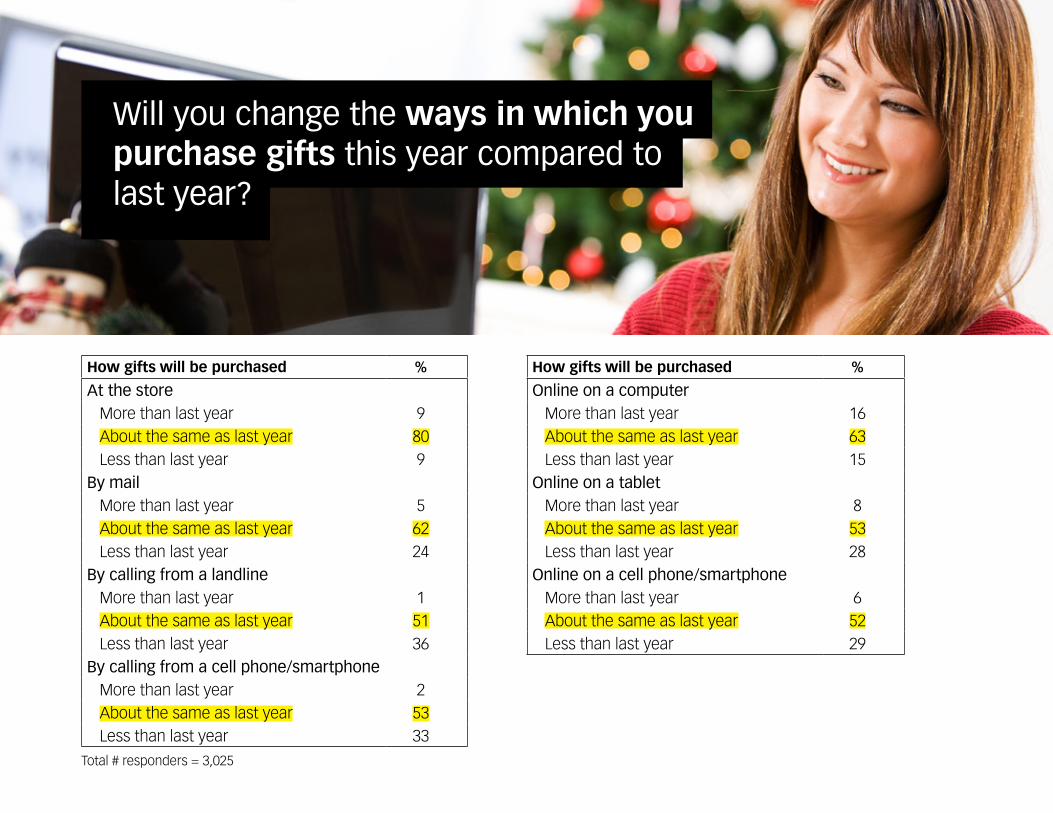
Will you change the ways in which you purchase gifts this year compared to last year?
Total # responders = 3,025
How gifts will be purchased %
At the storeMore than last year 9About the same as last year 80Less than last year 9
By mailMore than last year 5About the same as last year 62Less than last year 24
By calling from a landlineMore than last year 1About the same as last year 51Less than last year 36
By calling from a cell phone/smartphoneMore than last year 2About the same as last year 53Less than last year 33
How gifts will be purchased %
Online on a computerMore than last year 16About the same as last year 63Less than last year 15
Online on a tabletMore than last year 8About the same as last year 53Less than last year 28
Online on a cell phone/smartphoneMore than last year 6About the same as last year 52Less than last year 29
Total # responders = 3,025
Website %
Amazon.comMore than last year 20About the same as last year 57Less than last year 16
Ebay.comMore than last year 4About the same as last year 50Less than last year 32
Etsy.comMore than last year 3About the same as last year 44Less than last year 37
Will you change which online sites you will shop this holiday season?
Website %
UncommonGoodsMore than last year 1About the same as last year 44Less than last year 38
Target.comMore than last year 5About the same as last year 53Less than last year 29
Walmart.comMore than last year 9About the same as last year 58Less than last year 22
Website %
Department store websitesMore than last year 6About the same as last year 57Less than last year 24
Specialty store websitesMore than last year 7About the same as last year 55Less than last year 25
Online toy storesMore than last year 4About the same as last year 49Less than last year 31
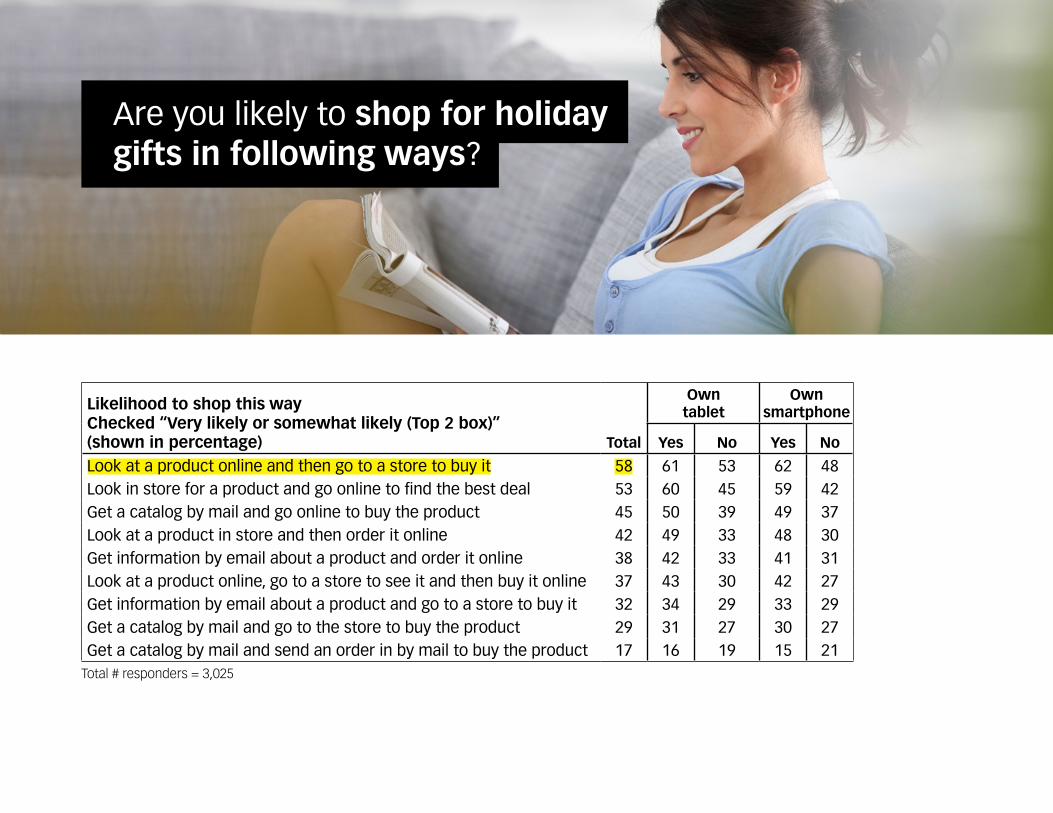
Are you likely to shop for holiday gifts in following ways?
Total # responders = 3,025
Likelihood to shop this wayChecked “Very likely or somewhat likely (Top 2 box)” (shown in percentage) Total
Own tablet
Own smartphone
Yes No Yes No
Look at a product online and then go to a store to buy it 58 61 53 62 48Look in store for a product and go online to find the best deal 53 60 45 59 42Get a catalog by mail and go online to buy the product 45 50 39 49 37Look at a product in store and then order it online 42 49 33 48 30Get information by email about a product and order it online 38 42 33 41 31Look at a product online, go to a store to see it and then buy it online 37 43 30 42 27Get information by email about a product and go to a store to buy it 32 34 29 33 29Get a catalog by mail and go to the store to buy the product 29 31 27 30 27Get a catalog by mail and send an order in by mail to buy the product 17 16 19 15 21
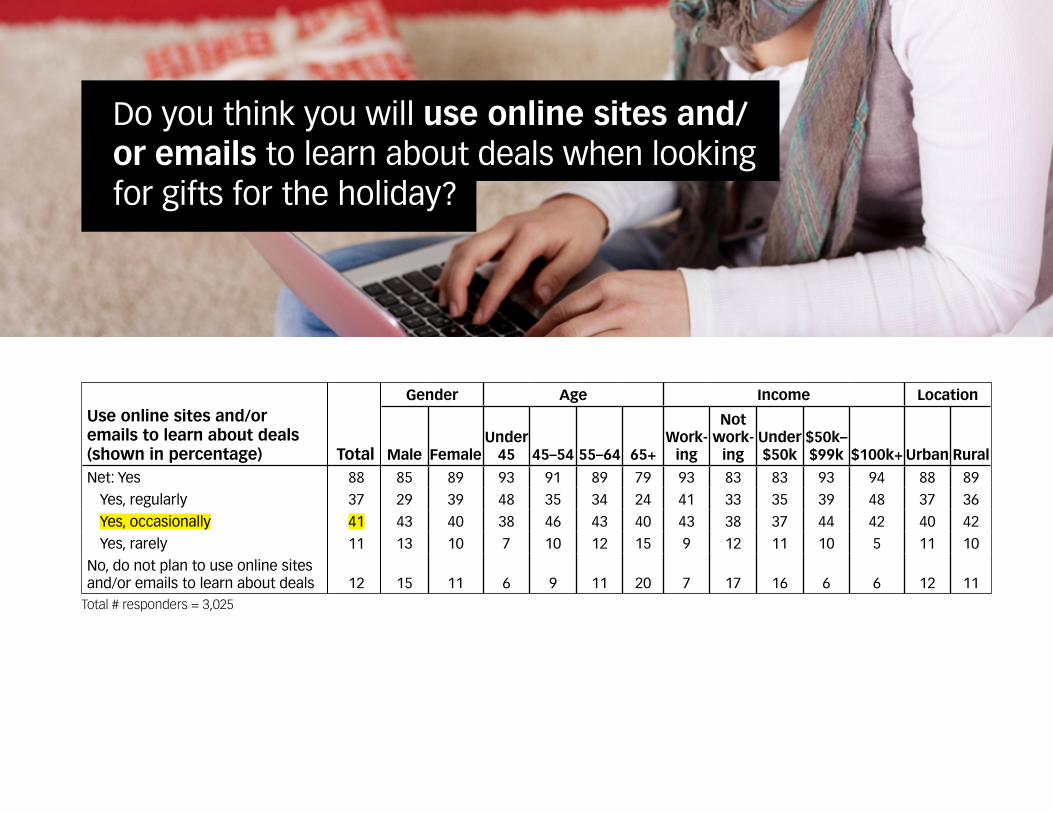
Do you think you will use online sites and/or emails to learn about deals when looking for gifts for the holiday?
Total # responders = 3,025
Use online sites and/or emails to learn about deals (shown in percentage) Total
Gender Age Income Location
Male FemaleUnder
45 45–54 55–64 65+Work-
ing
Not work-
ingUnder $50k
$50k–$99k $100k+ Urban Rural
Net: Yes 88 85 89 93 91 89 79 93 83 83 93 94 88 89Yes, regularly 37 29 39 48 35 34 24 41 33 35 39 48 37 36Yes, occasionally 41 43 40 38 46 43 40 43 38 37 44 42 40 42Yes, rarely 11 13 10 7 10 12 15 9 12 11 10 5 11 10
No, do not plan to use online sites and/or emails to learn about deals 12 15 11 6 9 11 20 7 17 16 6 6 12 11
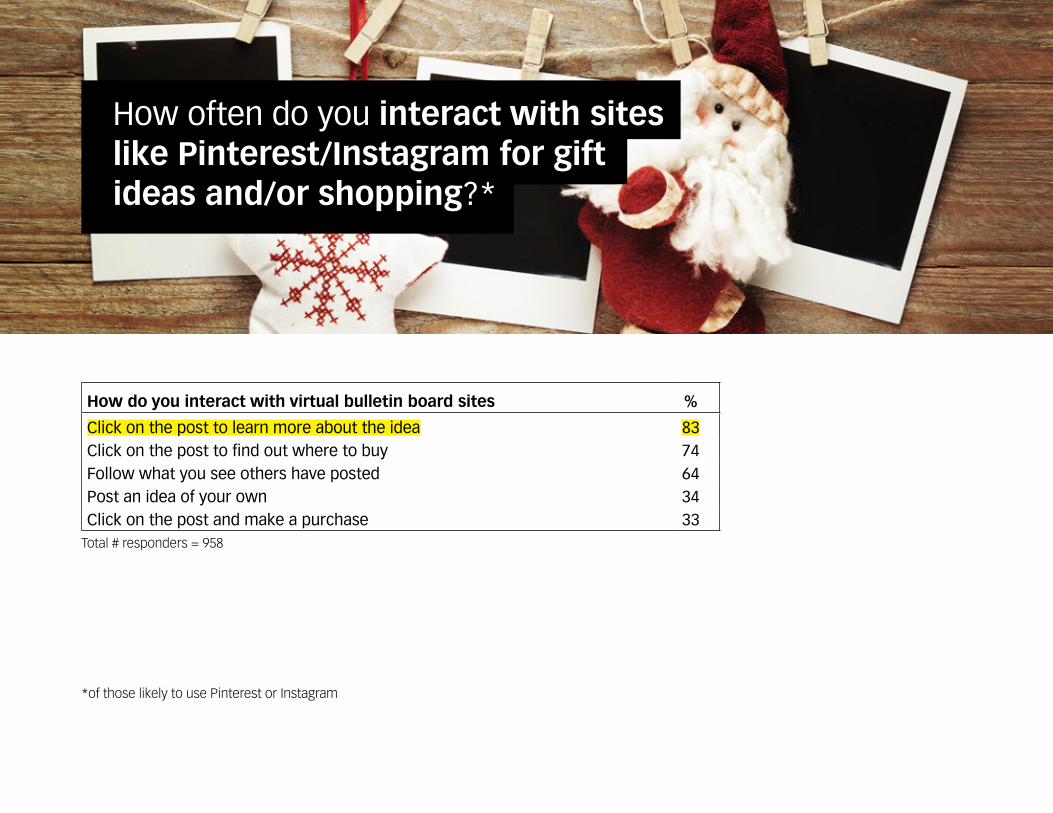
How often do you interact with sites like Pinterest/Instagram for gift ideas and/or shopping?*
How do you interact with virtual bulletin board sites %
Click on the post to learn more about the idea 83Click on the post to find out where to buy 74Follow what you see others have posted 64Post an idea of your own 34Click on the post and make a purchase 33
Total # responders = 958
*of those likely to use Pinterest or Instagram
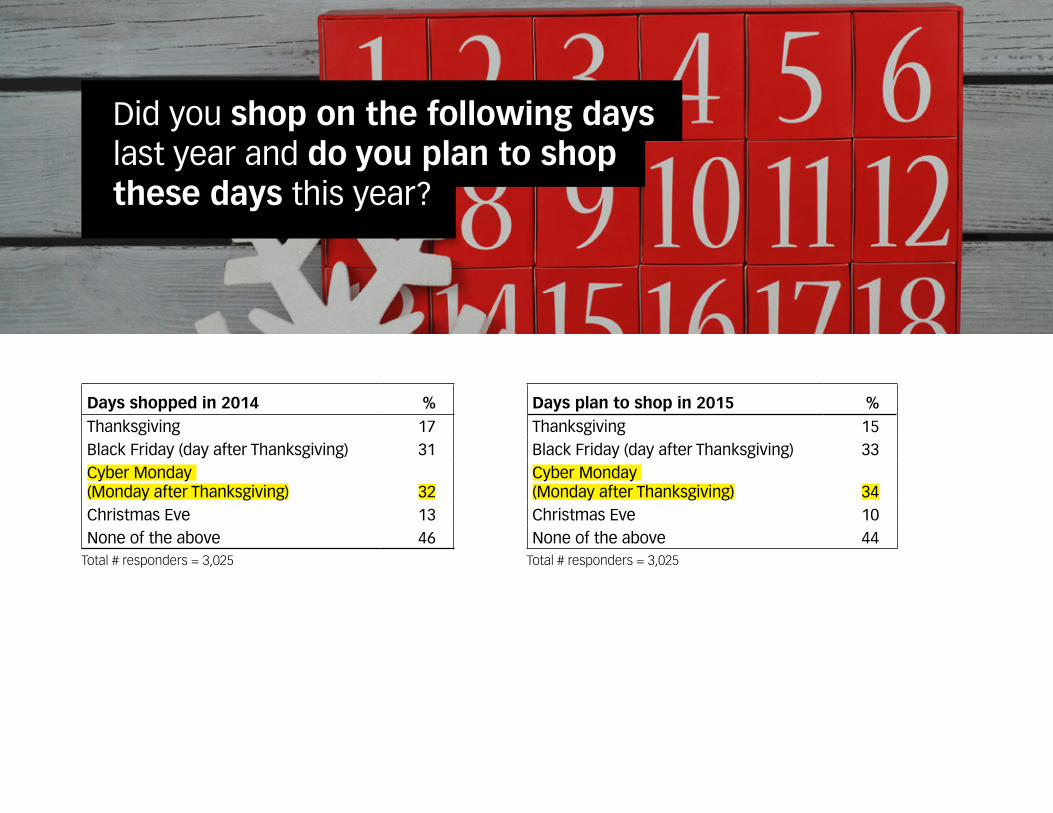
Did you shop on the following days last year and do you plan to shop these days this year?
Total # responders = 3,025
Days plan to shop in 2015 %Thanksgiving 15Black Friday (day after Thanksgiving) 33Cyber Monday (Monday after Thanksgiving) 34Christmas Eve 10None of the above 44
Days shopped in 2014 %Thanksgiving 17Black Friday (day after Thanksgiving) 31Cyber Monday (Monday after Thanksgiving) 32Christmas Eve 13None of the above 46
Total # responders = 3,025
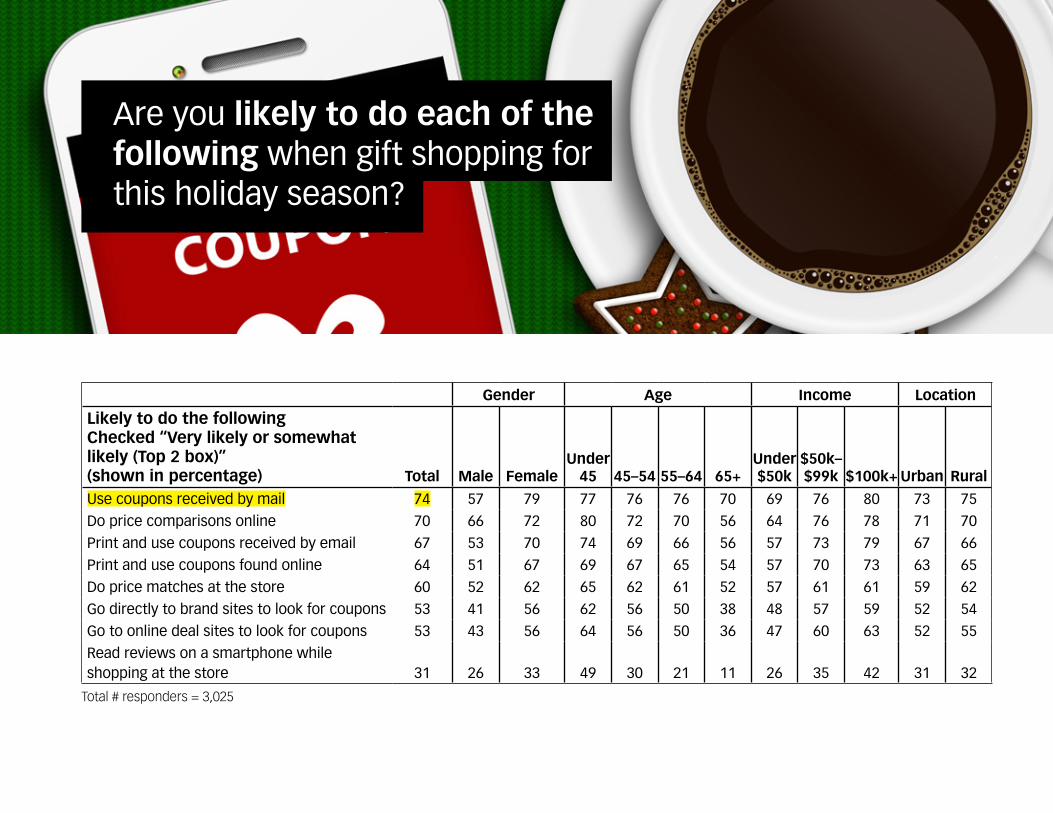
Are you likely to do each of the following when gift shopping for this holiday season?
Total # responders = 3,025
Gender Age Income Location
Likely to do the followingChecked “Very likely or somewhat likely (Top 2 box)” (shown in percentage) Total Male Female
Under 45 45–54 55–64 65+
Under $50k
$50k–$99k $100k+ Urban Rural
Use coupons received by mail 74 57 79 77 76 76 70 69 76 80 73 75Do price comparisons online 70 66 72 80 72 70 56 64 76 78 71 70Print and use coupons received by email 67 53 70 74 69 66 56 57 73 79 67 66Print and use coupons found online 64 51 67 69 67 65 54 57 70 73 63 65Do price matches at the store 60 52 62 65 62 61 52 57 61 61 59 62Go directly to brand sites to look for coupons 53 41 56 62 56 50 38 48 57 59 52 54Go to online deal sites to look for coupons 53 43 56 64 56 50 36 47 60 63 52 55Read reviews on a smartphone while shopping at the store 31 26 33 49 30 21 11 26 35 42 31 32
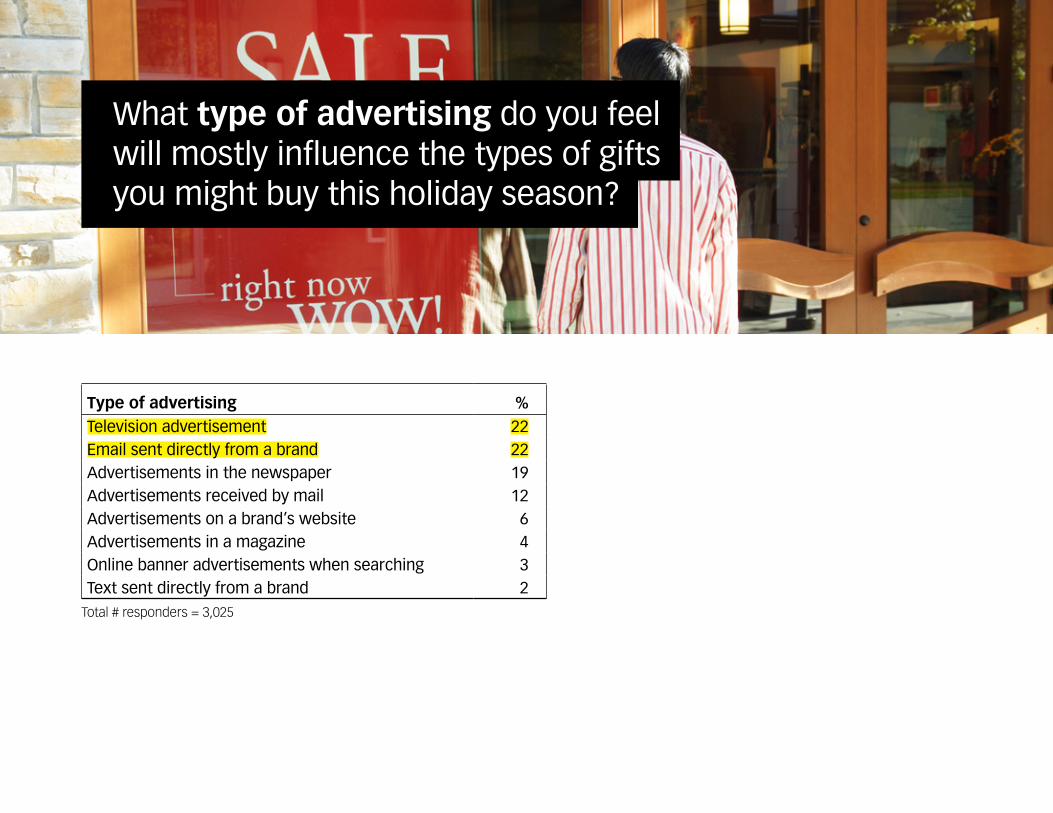
What type of advertising do you feel will mostly influence the types of gifts you might buy this holiday season?
Total # responders = 3,025
Type of advertising %Television advertisement 22Email sent directly from a brand 22Advertisements in the newspaper 19Advertisements received by mail 12Advertisements on a brand’s website 6Advertisements in a magazine 4Online banner advertisements when searching 3Text sent directly from a brand 2
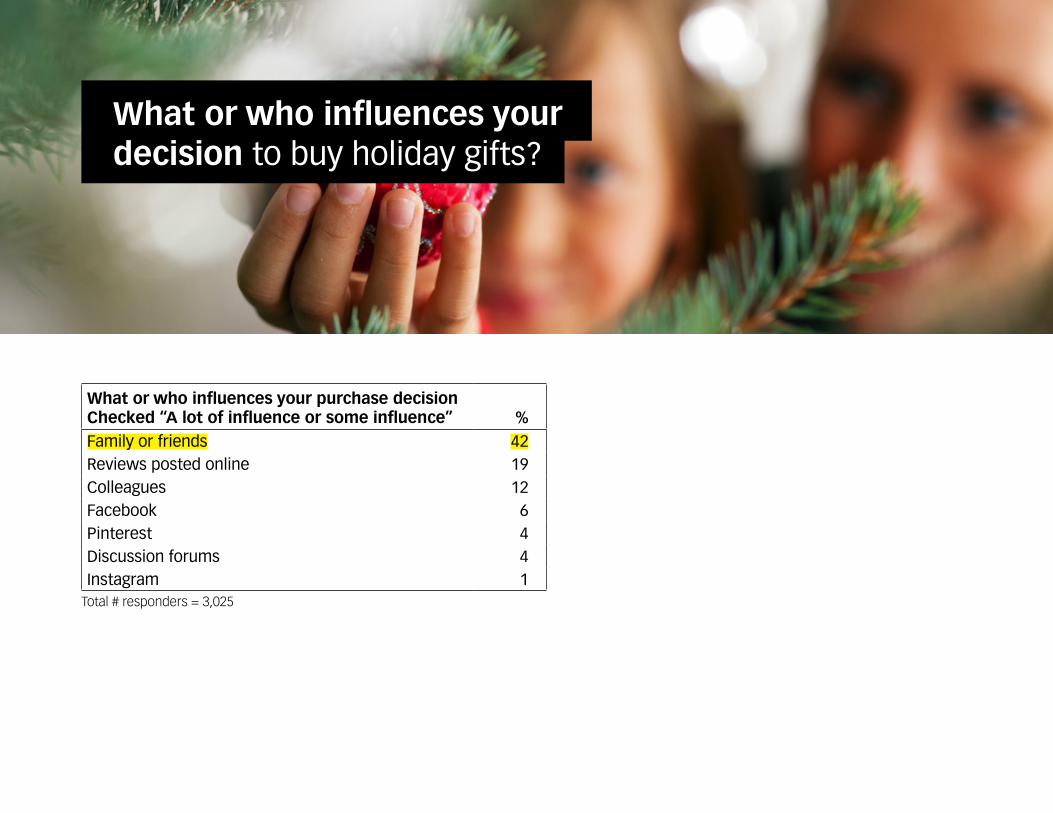
What or who influences your decision to buy holiday gifts?
Total # responders = 3,025
What or who influences your purchase decisionChecked “A lot of influence or some influence” %Family or friends 42Reviews posted online 19Colleagues 12Facebook 6Pinterest 4Discussion forums 4Instagram 1
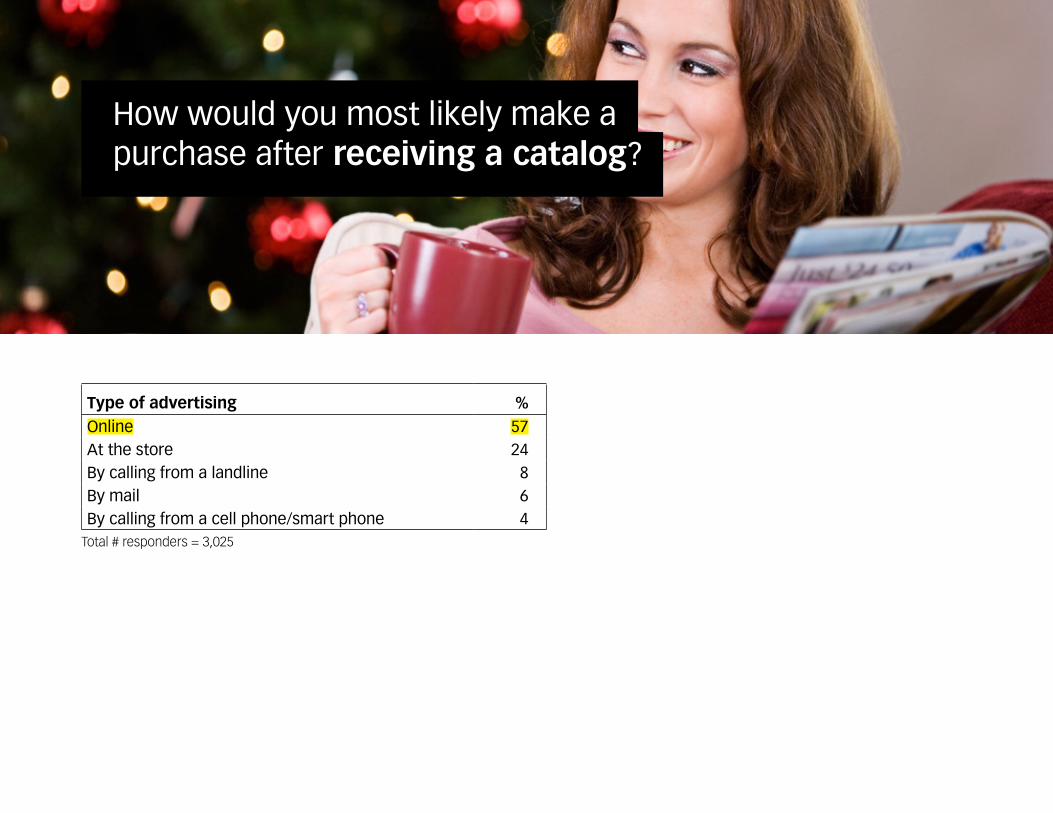
How would you most likely make a purchase after receiving a catalog?
Total # responders = 3,025
Type of advertising %Online 57At the store 24By calling from a landline 8By mail 6By calling from a cell phone/smart phone 4
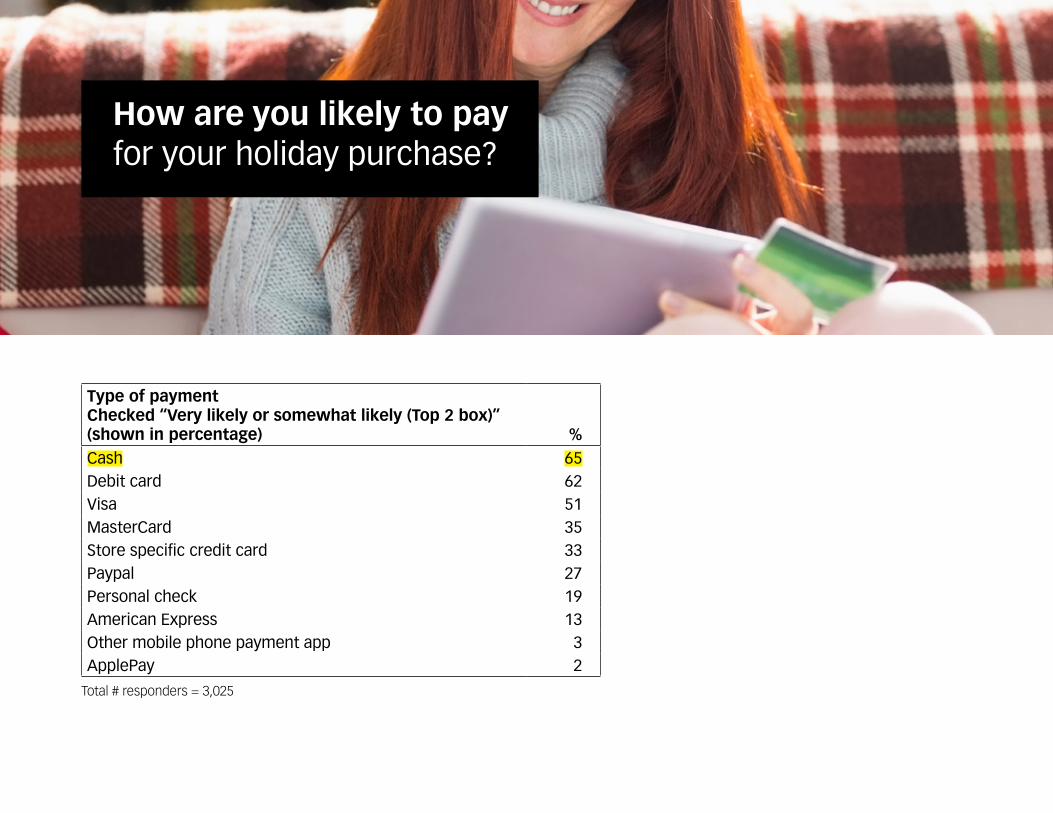
How are you likely to pay for your holiday purchase?
Total # responders = 3,025
Type of payment Checked “Very likely or somewhat likely (Top 2 box)” (shown in percentage) %Cash 65Debit card 62Visa 51MasterCard 35Store specific credit card 33Paypal 27Personal check 19American Express 13Other mobile phone payment app 3ApplePay 2
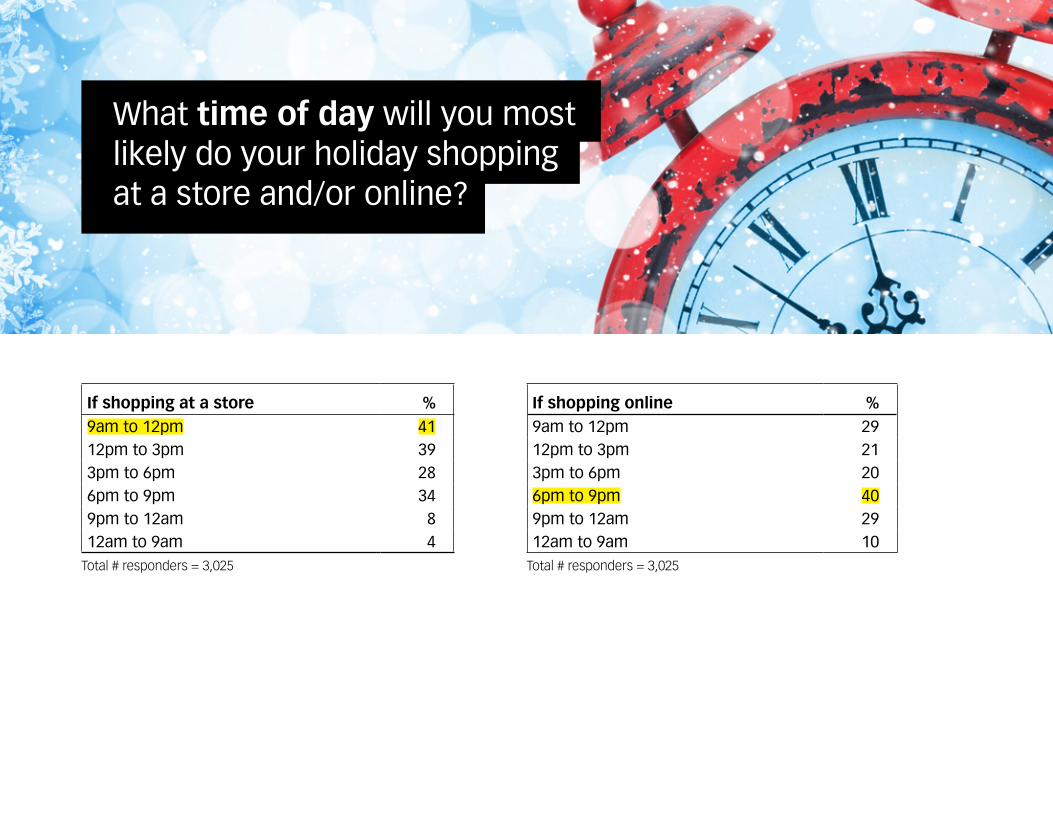
What time of day will you most likely do your holiday shopping at a store and/or online?
Total # responders = 3,025
If shopping online %9am to 12pm 2912pm to 3pm 213pm to 6pm 206pm to 9pm 409pm to 12am 2912am to 9am 10
If shopping at a store %9am to 12pm 4112pm to 3pm 393pm to 6pm 286pm to 9pm 349pm to 12am 812am to 9am 4
Total # responders = 3,025
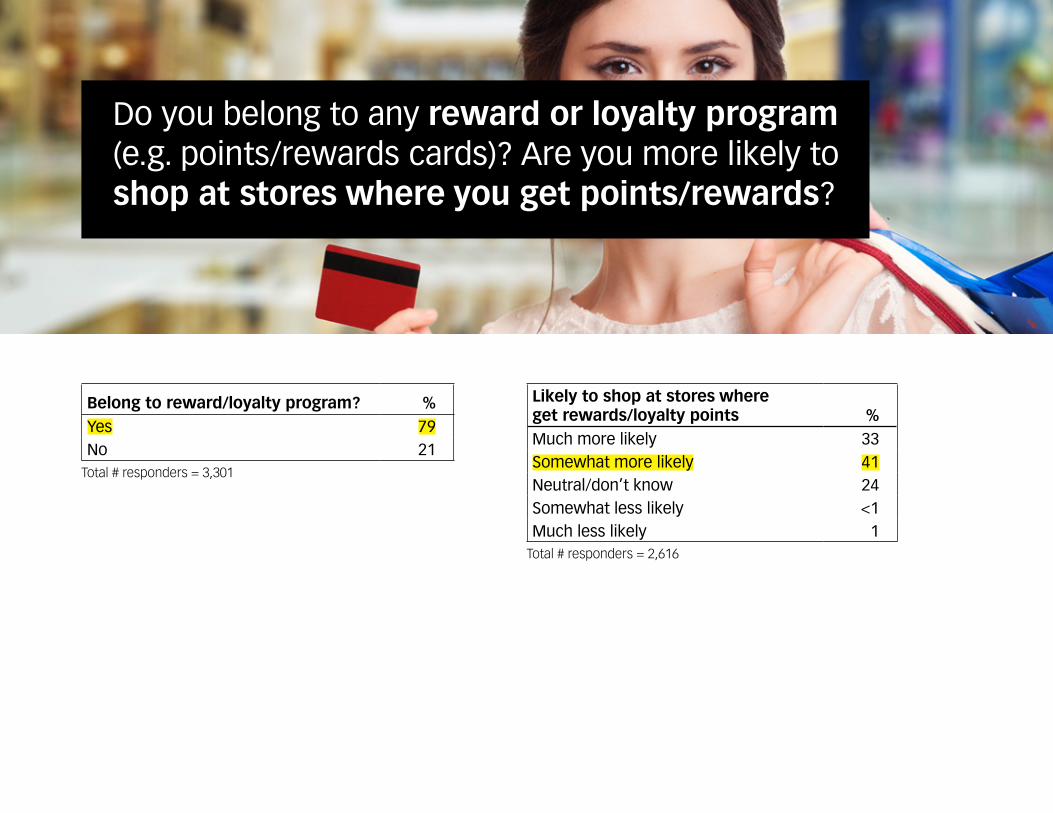
Do you belong to any reward or loyalty program (e.g. points/rewards cards)? Are you more likely to shop at stores where you get points/rewards?
Total # responders = 3,301
Likely to shop at stores where get rewards/loyalty points %Much more likely 33Somewhat more likely 41Neutral/don’t know 24Somewhat less likely <1Much less likely 1
Belong to reward/loyalty program? %Yes 79No 21
Total # responders = 2,616
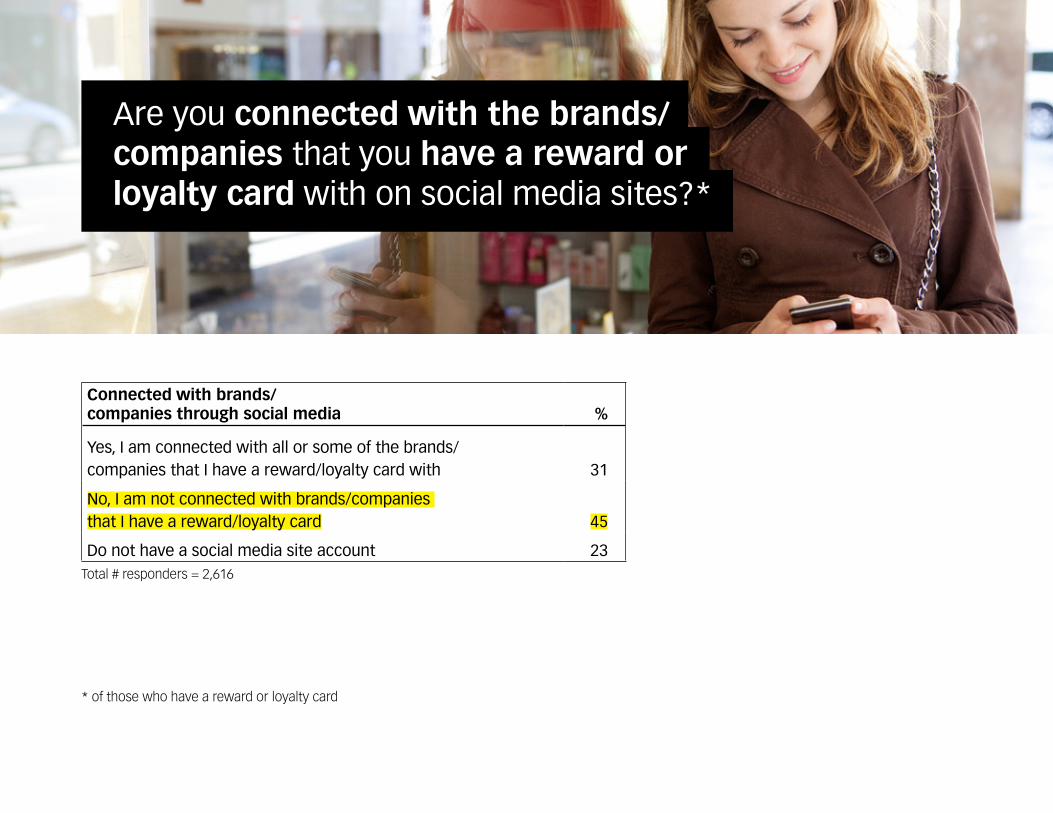
Are you connected with the brands/companies that you have a reward or loyalty card with on social media sites?*
Connected with brands/ companies through social media %
Yes, I am connected with all or some of the brands/ companies that I have a reward/loyalty card with 31
No, I am not connected with brands/companies that I have a reward/loyalty card 45
Do not have a social media site account 23Total # responders = 2,616
* of those who have a reward or loyalty card
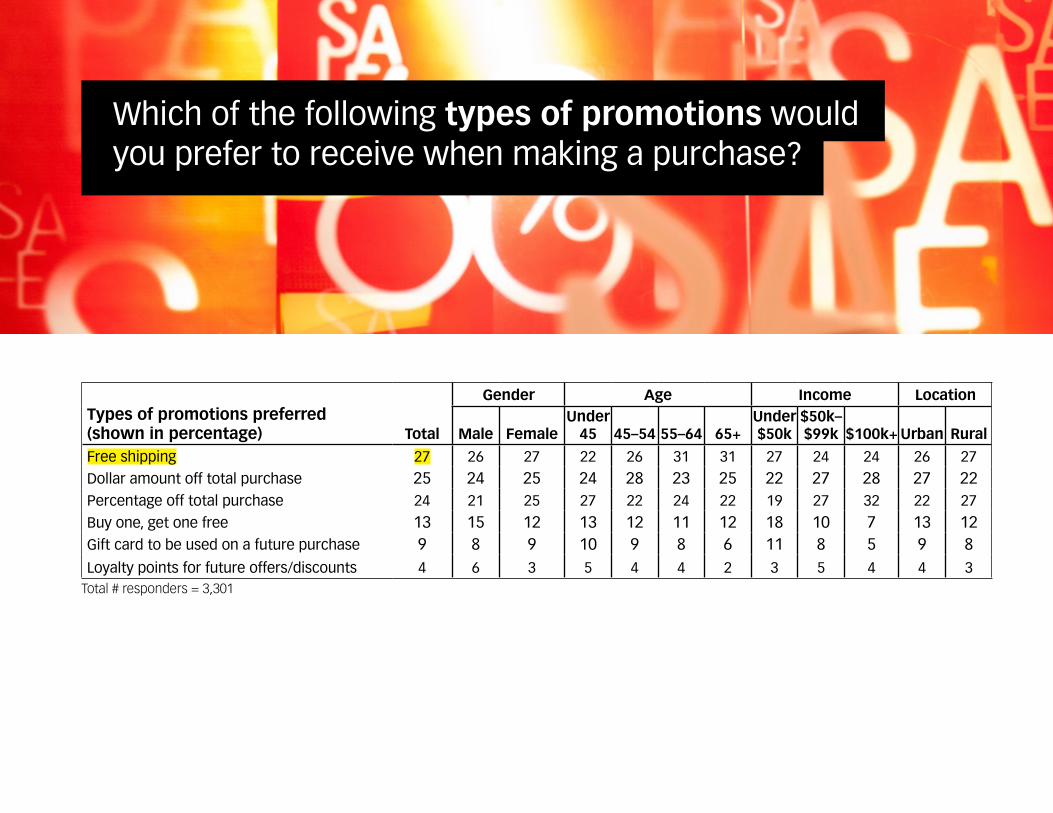
Which of the following types of promotions would you prefer to receive when making a purchase?
Total # responders = 3,301
Types of promotions preferred (shown in percentage) Total
Gender Age Income Location
Male FemaleUnder
45 45–54 55–64 65+Under $50k
$50k–$99k $100k+ Urban Rural
Free shipping 27 26 27 22 26 31 31 27 24 24 26 27Dollar amount off total purchase 25 24 25 24 28 23 25 22 27 28 27 22Percentage off total purchase 24 21 25 27 22 24 22 19 27 32 22 27Buy one, get one free 13 15 12 13 12 11 12 18 10 7 13 12Gift card to be used on a future purchase 9 8 9 10 9 8 6 11 8 5 9 8Loyalty points for future offers/discounts 4 6 3 5 4 4 2 3 5 4 4 3
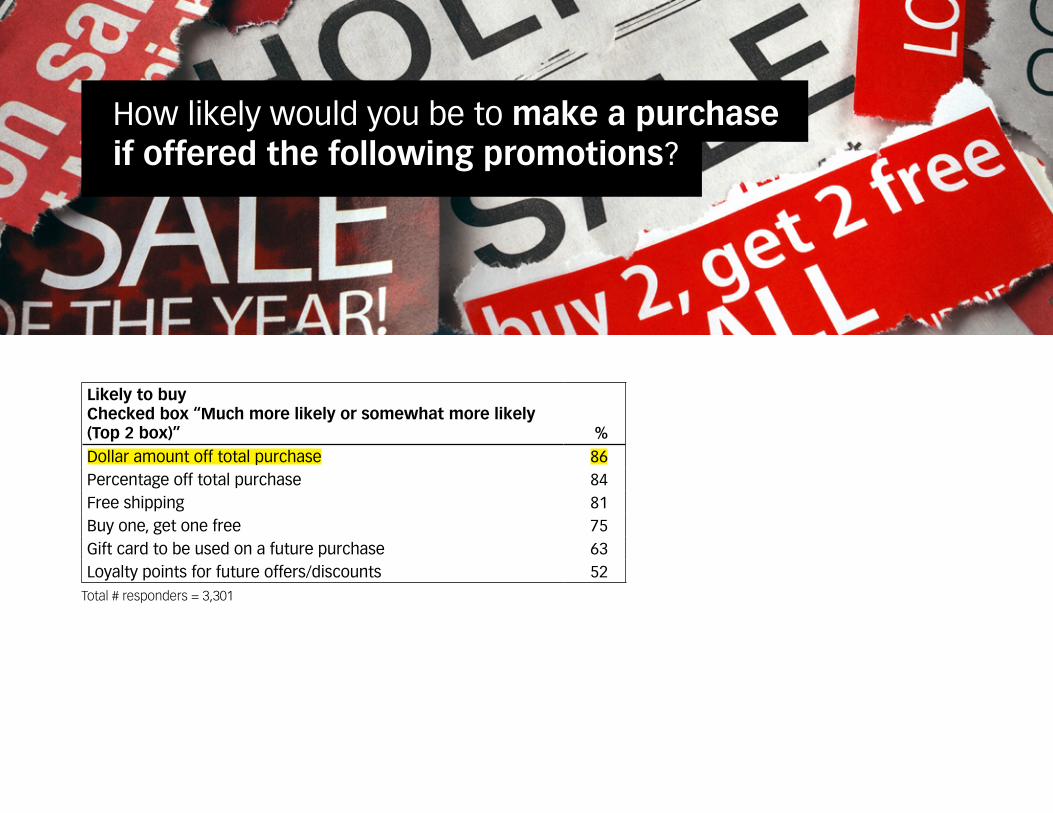
How likely would you be to make a purchase if offered the following promotions?
Likely to buyChecked box “Much more likely or somewhat more likely (Top 2 box)” %Dollar amount off total purchase 86Percentage off total purchase 84Free shipping 81Buy one, get one free 75Gift card to be used on a future purchase 63Loyalty points for future offers/discounts 52
Total # responders = 3,301
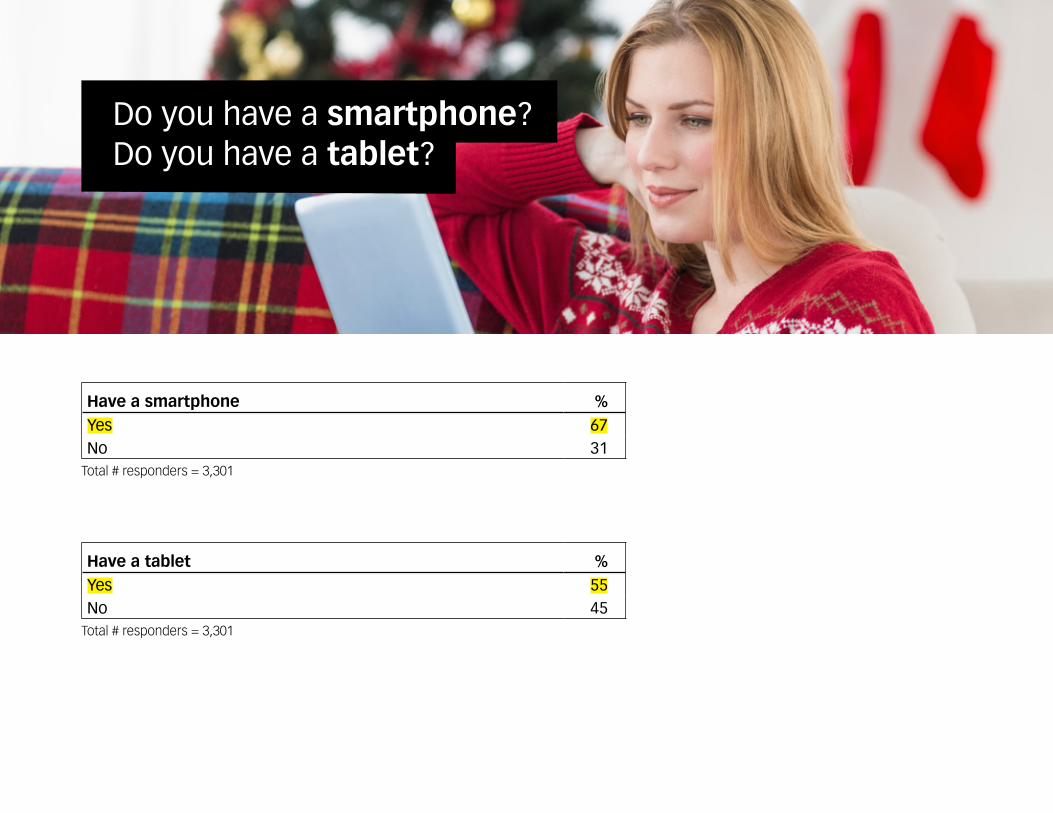
Do you have a smartphone? Do you have a tablet?
Have a smartphone %Yes 67No 31
Total # responders = 3,301
Have a tablet %Yes 55No 45
Total # responders = 3,301
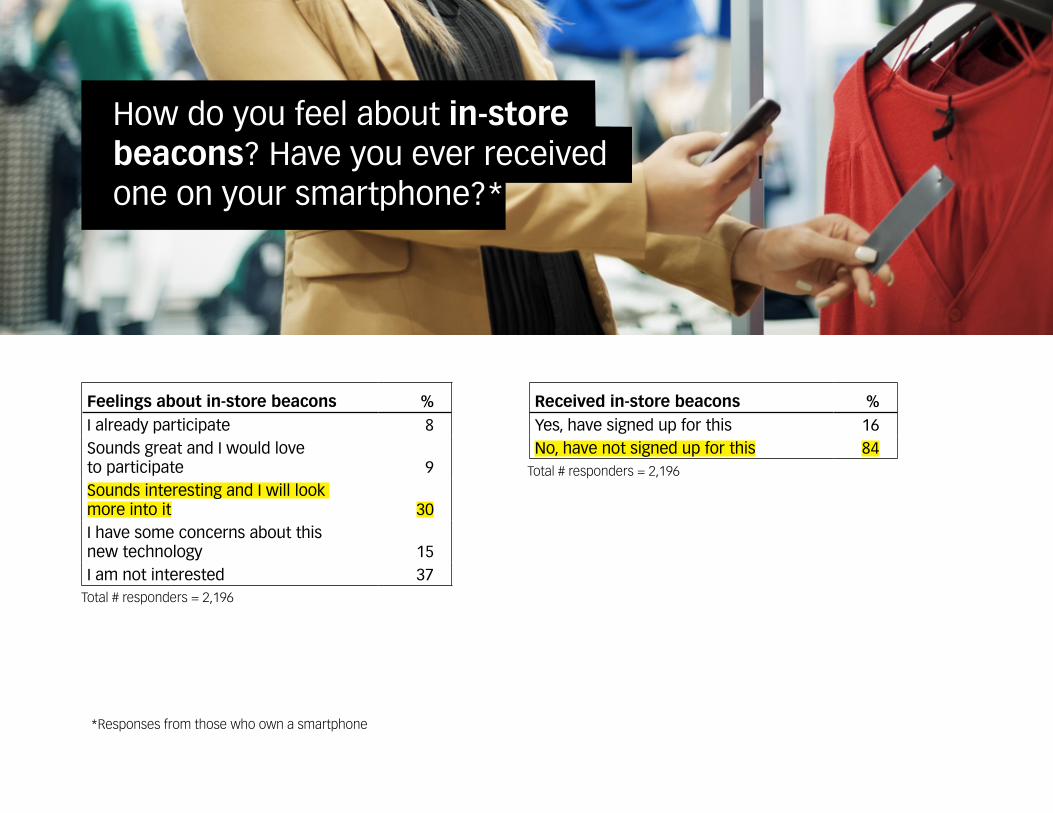
Received in-store beacons %Yes, have signed up for this 16No, have not signed up for this 84
How do you feel about in-store beacons? Have you ever received one on your smartphone?*
Total # responders = 2,196
Feelings about in-store beacons %I already participate 8Sounds great and I would love to participate 9Sounds interesting and I will look more into it 30I have some concerns about this new technology 15I am not interested 37
Total # responders = 2,196
*Responses from those who own a smartphone
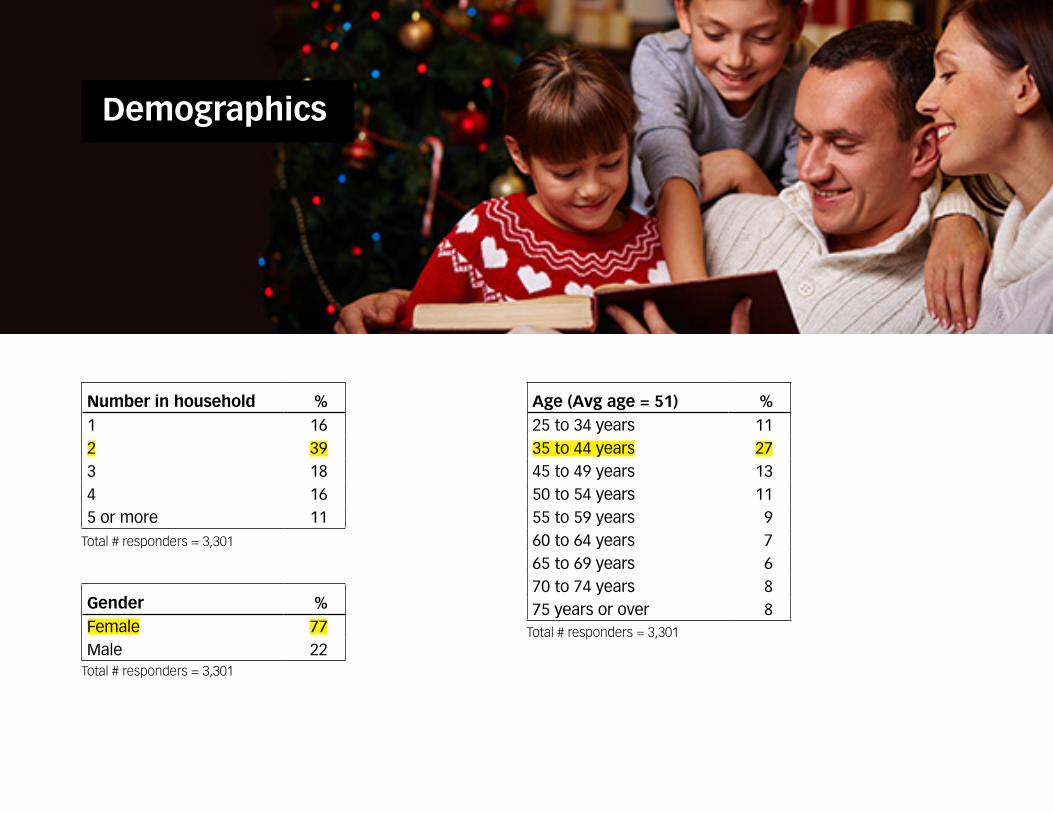
Demographics
Number in household %1 162 393 184 165 or more 11
Total # responders = 3,301
Gender %Female 77Male 22
Age (Avg age = 51) %25 to 34 years 1135 to 44 years 2745 to 49 years 1350 to 54 years 1155 to 59 years 960 to 64 years 765 to 69 years 670 to 74 years 875 years or over 8
Total # responders = 3,301
Total # responders = 3,301
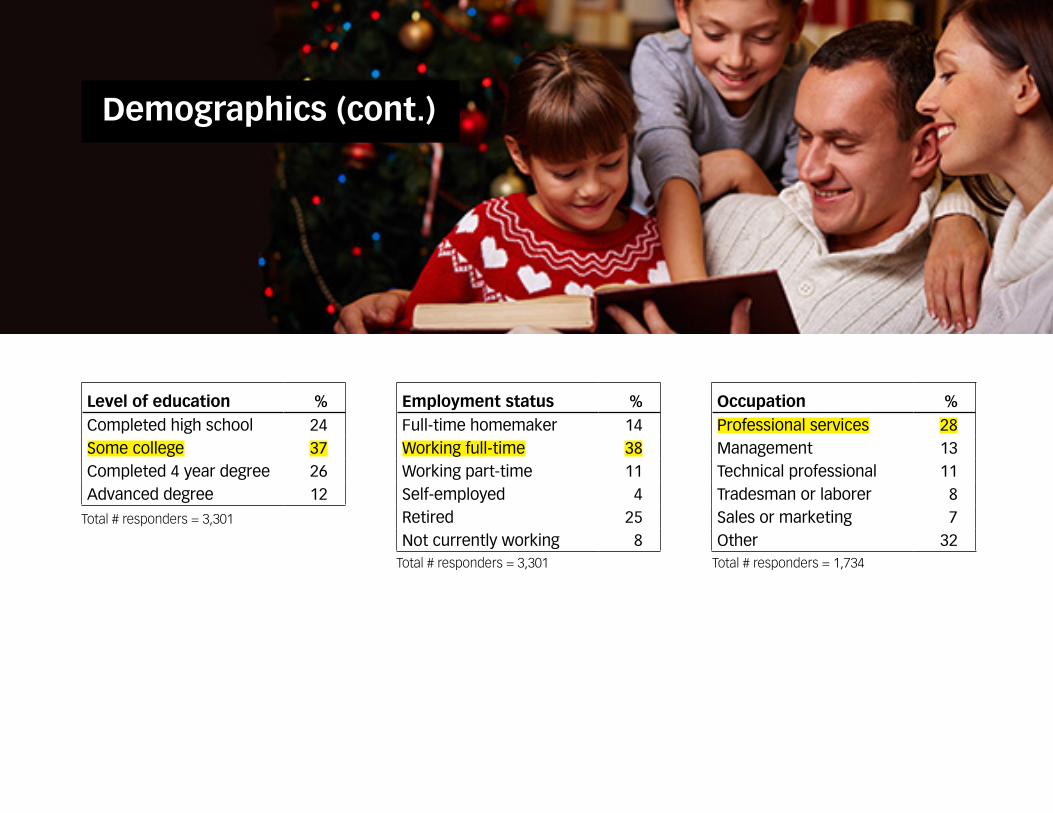
Demographics (cont.)
Level of education %Completed high school 24Some college 37Completed 4 year degree 26Advanced degree 12
Total # responders = 3,301
Employment status %Full-time homemaker 14Working full-time 38Working part-time 11Self-employed 4Retired 25Not currently working 8
Occupation %Professional services 28Management 13Technical professional 11Tradesman or laborer 8Sales or marketing 7Other 32
Total # responders = 3,301 Total # responders = 1,734
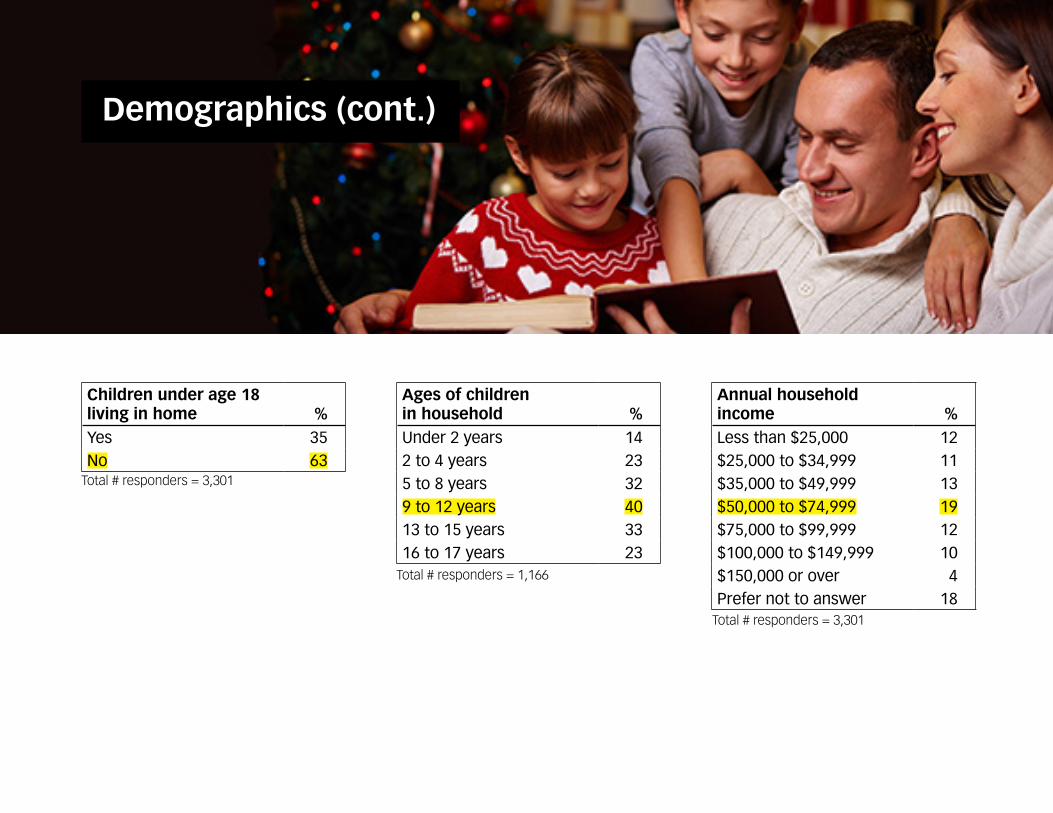
Demographics (cont.)
Children under age 18 living in home %Yes 35No 63
Total # responders = 3,301
Ages of children in household %Under 2 years 142 to 4 years 235 to 8 years 329 to 12 years 4013 to 15 years 3316 to 17 years 23
Annual household income %Less than $25,000 12$25,000 to $34,999 11$35,000 to $49,999 13$50,000 to $74,999 19$75,000 to $99,999 12$100,000 to $149,999 10$150,000 or over 4Prefer not to answer 18
Total # responders = 1,166
Total # responders = 3,301
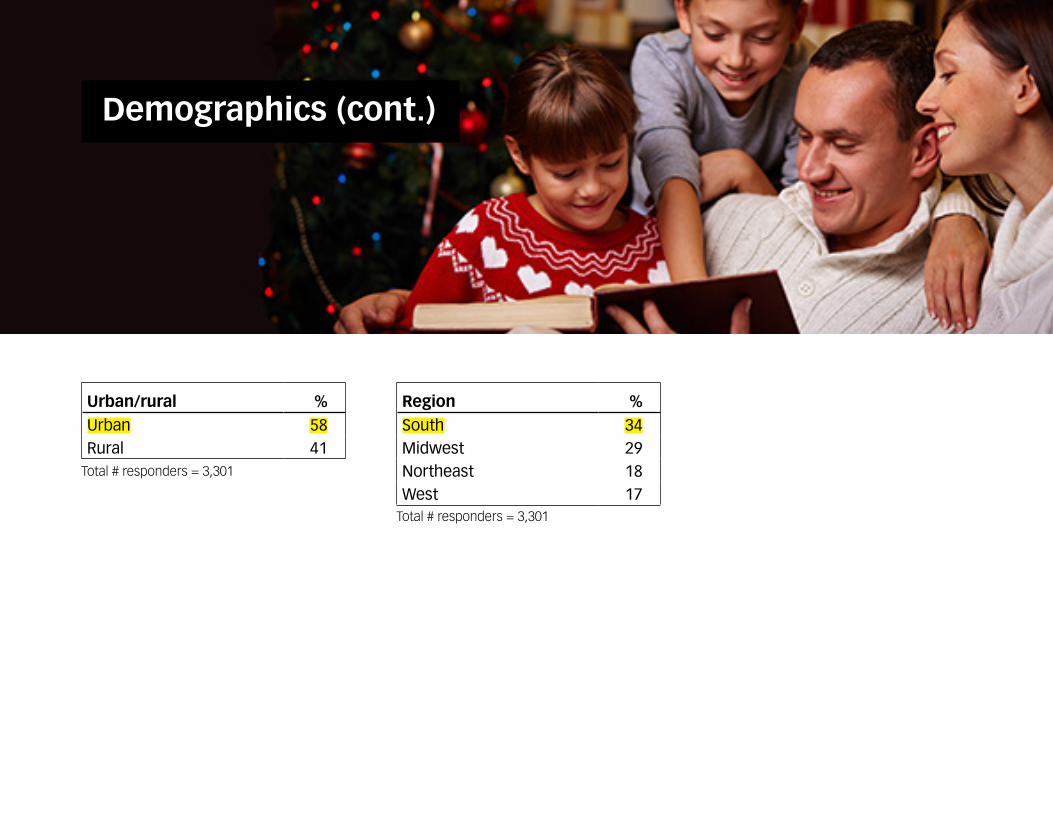
Demographics (cont.)
Urban/rural %Urban 58Rural 41
Total # responders = 3,301
Region %South 34Midwest 29Northeast 18West 17
Total # responders = 3,301

About the MethodologyThis report on customer insights is based on a Shopper’s Voice® survey conducted in June 2015. The online survey was completed by 3,301 U.S. responders in the Shopper’s Voice database 25 years of age or older. Results are shown for the total sample and/or by demographic groups. Results were weighted based on age of re-sponder. Weighted total sample sizes from groups within the study are as follows: Total = 3,301; By age: Under 45=1,248, 45-54=790, 55-64=509, 65+=466; By household income: Under $50,000=1,181, $50,000-$99,999=1,037, $100,000 or over=467; By location: Urban=1,904, Rural=1,354.