Embed Size (px)
Citation preview
1 l Digital Salary & Industry Insights
DigitalSalary &IndustryInsights7th Edition
propellondon.com0207 432 [email protected]
Digital Salary & Industry Insights l 3
Contents
Preface 5Methodology 6Demographics 7
Overview 8Open Blend Method 9Leaving Intentions 14Factors that drive job change 17How professionals find a role 18Bonus receipt & company benefits 20C-Level Insights 23Contractors/Freelancers 25Salary overview 26Gender pay gap 26
Marketing 28Demographics and highlights 29Open Blend summary 30 Salaries 32
Advertising Operations/Trafficking 32Affiliate Marketing 32Campaign Management 33Content Management / Editorial 33Digital Advertising 34 Email Marketing / eCRM 34Marketing - Online / Direct 35Marketing - Brand Strategy 35Paid Search 36Paid Social 36Product Management 37SEO/SEM 37Social Media 38
Commercial 39Demographics and highlights 40Open Blend summary 41Salaries 43
Account Management 43Agency Sales 43Business Development 44Channel Sales 44
Customer Services 45Enterprise Software Sales 45Partnerships 46Pre-Sales 46Publisher Development 47
Technical 48Demographics and highlights 49Open Blend summary 50Salaries 52
Architecture 52Back-end Development 52Big Data 53Business Analysis 53Front-end Development 54IT Operations 54Mobile Development 55Programme Management 55Project Management 56Testing & Quality Assurance 56
Creative 57Demographics and highlights 58Open Blend summary 59Salaries 61
Artwork 61Copywriting 61Creative Strategy 62Design 63Production Management 63Project Management 63UX / UI 64
Business Operations 65Demographics and highlights 66Open Blend summary 67Salaries 69
Administration 69Finance 69Human Resources 70IT Salaries 70
4 l Digital Salary & Industry Insights
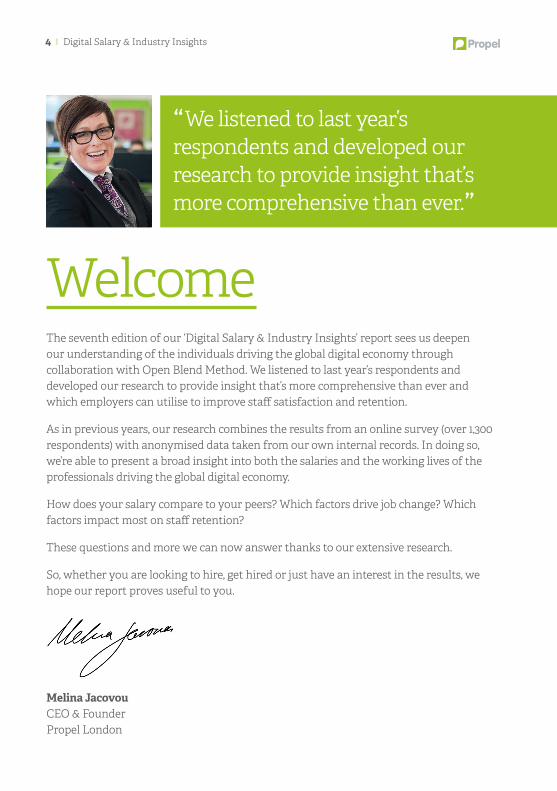
The seventh edition of our ‘Digital Salary & Industry Insights’ report sees us deepen our understanding of the individuals driving the global digital economy through collaboration with Open Blend Method. We listened to last year’s respondents and developed our research to provide insight that’s more comprehensive than ever and which employers can utilise to improve staff satisfaction and retention.
As in previous years, our research combines the results from an online survey (over 1,300 respondents) with anonymised data taken from our own internal records. In doing so, we’re able to present a broad insight into both the salaries and the working lives of the professionals driving the global digital economy.
How does your salary compare to your peers? Which factors drive job change? Which factors impact most on staff retention?
These questions and more we can now answer thanks to our extensive research.
So, whether you are looking to hire, get hired or just have an interest in the results, we hope our report proves useful to you.
Melina JacovouCEO & FounderPropel London
“We listened to last year’srespondents and developed our research to provide insight that’s more comprehensive than ever.”
Welcome
Digital Salary & Industry Insights l 5
Propel’s seventh annual ‘Digital Salary & Industry Insights’ report combines our own internal salary data with over 1,300 respondents to a survey we conducted from December 2015 to February 2016.
The survey element has been included in the research for our previous two salary surveys, with questions designed to provide insight into work life blend and role perceptions within the global digital economy.
The report is split into five main sections. The first breaks down the overall results from our survey across the entire sample, showing differences across seniority, length of tenure, gender, business type and skill set. The remaining four sections analyse our sample based on their wider skill set.
We split out our respondents into five main skill sets: Marketing, Commercial, Technical, Creative and Business Operations. Within these skill sets, data is broken down further by seniority, which we split into the following brackets:
• Junior / Non Management• Mid-level / Middle Management• Senior / Senior Management / Head of• Senior Executive / CxO / Managing Director / Board Level
The following pages provide a brief overview of the methodology adopted to compile the report, and a summary of the demographic splits for the sample.
This report has been produced by Propel in partnership with The Drum and Open Blend Method.
Any queries regarding the contents of this report, as well as any media queries, can be directed to our marketing department on 0207 432 6340 or by emailing us at [email protected].
Preface
6 l Digital Salary & Industry Insights
The data for this report is drawn from two primary sources; an online survey carried out in early 2016, and internal salary records taken from placed candidates and client briefs throughout 2015/16.
Online surveyWe gathered the data through a pre-tested and then revised questionnaire. The responses were collected online via SurveyMonkey, then analysed through Microsoft Office Excel and PowerBI.
We received 1,353 responses to the survey, 43 of which were invalidated due to being either incomplete, irrelevant or due to respondent error.
The final survey data set therefore consists of 1,310 responses from individuals working across the global digital economy.
The questionnaire structure took into consideration a number of factors regarding respondent behaviour, namely:
• Direct influences - demographic variables (e.g. age, gender, seniority, job title and salary)• Behavioural influences - career level, years in industry, skill set• Deduced influences – work life blend, attitudes, career patterns
This year, we measured the deduced influences of our respondents more explicitly through incorporating the Open Blend Method into our analysis. A full summary of the methodology applied to derive the Open Blend Method results can be found on page 9.
Internal dataWe took a total of 1,850 anonymised salary records from our own database. This allowed us to supplement the salary data provided by survey respondents with robust data drawn from placed candidates and client briefs.
Final data total In total we have 3,160 individual data records to form the basis of our analysis.
Methodology
Digital Salary & Industry Insights l 7
Demographics
Female 37%
Male 63%
Junior 18%C-level 8%
Mid-level 39%
Senior 35%
Creative 17%
BusinessOperations 10%Technical
21%
Marketing37%
Commercial15%
18-24, 9%65+, 1%
45-54, 8%55-64, 2%
25-34, 52%35-44, 28%
AgencySide 38%
Tech Vendor 15%
Consultancy5%
In-house/client-side 42%
Less than1 year 38%4-5 years 5%
>5 years 7%
3-4 years 8%
1-2 years 26%
2-3 years16%
Demographics overview: Gender
Demographics overview: Seniority
Demographics overview: Skill set
Demographics overview: Age
Demographics overview: Type of business
Demographics overview: Time in role
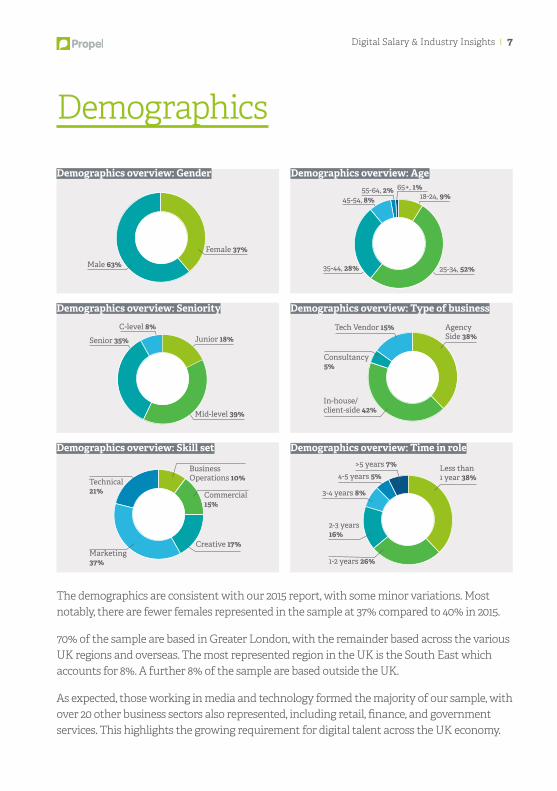
The demographics are consistent with our 2015 report, with some minor variations. Most notably, there are fewer females represented in the sample at 37% compared to 40% in 2015.
70% of the sample are based in Greater London, with the remainder based across the various UK regions and overseas. The most represented region in the UK is the South East which accounts for 8%. A further 8% of the sample are based outside the UK.
As expected, those working in media and technology formed the majority of our sample, with over 20 other business sectors also represented, including retail, finance, and government services. This highlights the growing requirement for digital talent across the UK economy.
8 l Digital Salary & Industry Insights
Section 1:
Overview
Before delving into the five skill sets andspecialisms, we have analysed thesample as a whole within the overviewsection.
This section acts to provide perspectiveto the rest of the report and provide ageneral summary of employeeperceptions and average salaries acrossthe global digital economy.
Digital Salary & Industry Insights l 9
IntroductionIn our 2015 report, 95% of respondents told us that work life balance was ‘very important’ to them. So, we listened and this year have developed our report through collaboration with Open Blend Method - an online tool that facilitates coaching in sessions between a manager and their talent.
At the heart of these sessions is the methodology of work life blend – the replacement for work life balance.
The term ‘work life balance’ implies a precarious balancing act. It’s a notion that suggests our work and our life are in opposition to each other.
The concept of work life blend acknowledges the reality that productivity at work is impacted by life and life is impacted by work. Our life commitments are not separate, they come together, influence each other and blend.
The Open Blend methodology is underpinned by the belief that well-being drives perfor-mance and that if you are happy, not stressed, confident and secure in your role you have the best chance of reaching your potential.
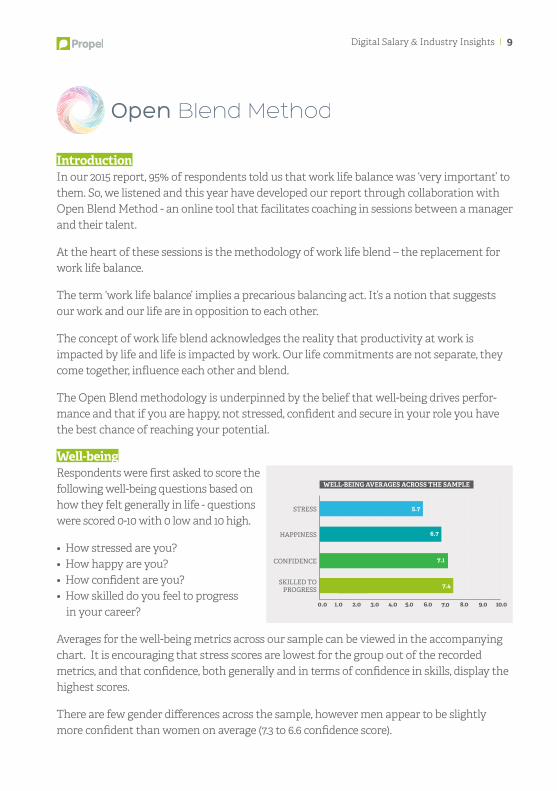
Well-beingRespondents were first asked to score the following well-being questions based on how they felt generally in life - questions were scored 0-10 with 0 low and 10 high.
• How stressed are you?• How happy are you?• How confident are you?• How skilled do you feel to progress
in your career?
Averages for the well-being metrics across our sample can be viewed in the accompanying chart. It is encouraging that stress scores are lowest for the group out of the recorded metrics, and that confidence, both generally and in terms of confidence in skills, display the highest scores.
There are few gender differences across the sample, however men appear to be slightly more confident than women on average (7.3 to 6.6 confidence score).
HAPPINESS
CONFIDENCE
SKILLED TOPROGRESS 7.4
7.1
6.7
5.7STRESS
0.0 1.0 2.0 3.0 4.0 5.0 7.0 8.0 9.0 10.06.0
WELL-BEING AVERAGES ACROSS THE SAMPLE
10 l Digital Salary & Industry Insights
Similarly, there are no stark differences in averages based on age, but both the 18-24 (Gen Z) and 45-54 (Younger Boomers) groups observe scores lower than the average across most well-being measures.
We were also interested in the respondents whose happiness score fell in both the bottom and top 20% of the sample. We highlight these two groups in the next section and look at how their work life blend scores impact upon their happiness scores.
Unique work life blendTo create a unique work life blend we asked each survey respondent to: “Imagine that everything is running smoothly in your life, you are highly effective at work and home, you are happy and feel on top of everything in your life, what is contributing to this? “
They were then taken through a 3 stage process:
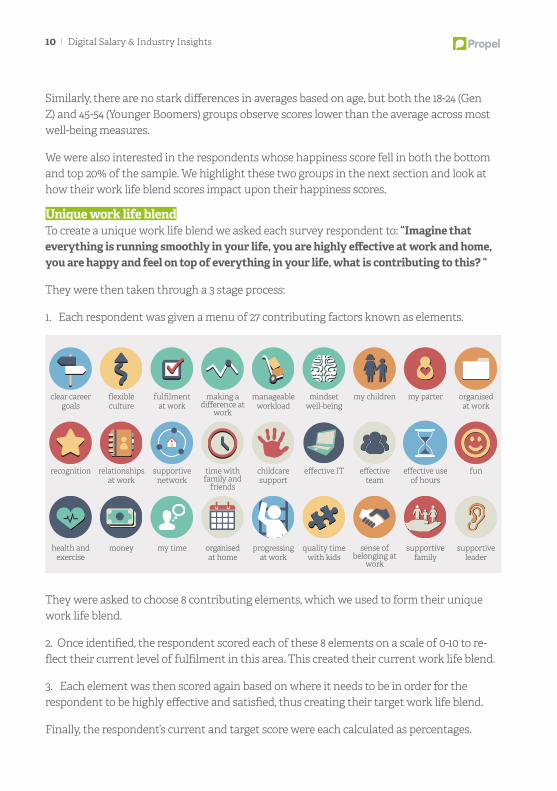
1. Each respondent was given a menu of 27 contributing factors known as elements.
They were asked to choose 8 contributing elements, which we used to form their unique work life blend.
2. Once identified, the respondent scored each of these 8 elements on a scale of 0-10 to re-flect their current level of fulfilment in this area. This created their current work life blend.
3. Each element was then scored again based on where it needs to be in order for the respondent to be highly effective and satisfied, thus creating their target work life blend.
Finally, the respondent’s current and target score were each calculated as percentages.
clear careergoals
flexibleculture
fulfilmentat work
making adifference at
work
manageableworkload
mindsetwell-being
my children my parter organisedat work
recognition relationshipsat work
supportivenetwork
time withfamily and
friends
childcaresupport
effective IT effectiveteam
effective useof hours
fun
health and exercise
money my time organised at home
progressing at work
quality time with kids
sense of belonging at
work
supportive family
supportive leader
Digital Salary & Industry Insights l 11
Results
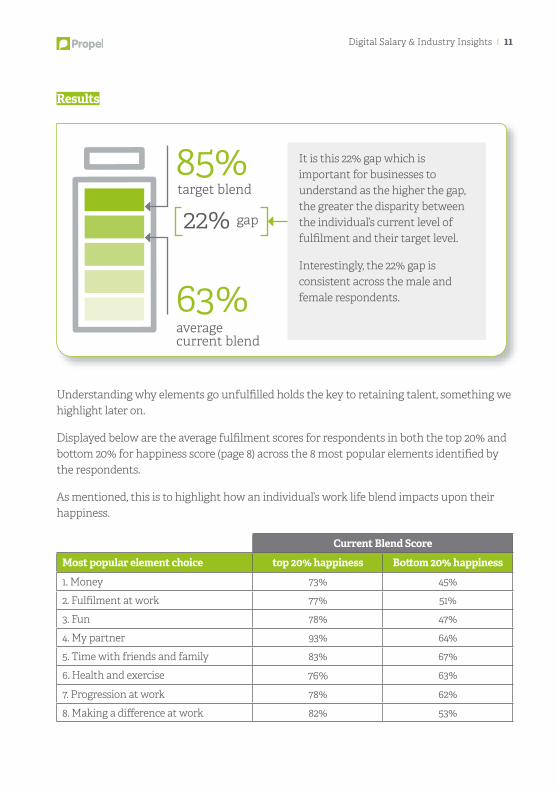
Understanding why elements go unfulfilled holds the key to retaining talent, something we highlight later on.
Displayed below are the average fulfilment scores for respondents in both the top 20% and bottom 20% for happiness score (page 8) across the 8 most popular elements identified by the respondents.
As mentioned, this is to highlight how an individual’s work life blend impacts upon their happiness.
Current Blend Score
Most popular element choice top 20% happiness Bottom 20% happiness
1. Money 73% 45%
2. Fulfilment at work 77% 51%
3. Fun 78% 47%
4. My partner 93% 64%
5. Time with friends and family 83% 67%
6. Health and exercise 76% 63%
7. Progression at work 78% 62%
8. Making a difference at work 82% 53%
target blend
22% gap
averagecurrent blend
63%
85% It is this 22% gap which is important for businesses to understand as the higher the gap, the greater the disparity between the individual’s current level of fulfilment and their target level.
Interestingly, the 22% gap is consistent across the male and female respondents.
12 l Digital Salary & Industry Insights
To highlight the link between work life blend and well-being further, respondents expe-riencing a blend fulfilment of 80% and above are in the top 20% for happiness score. In contrast, people experiencing blend fulfilment of under 60% are in the bottom 20% for happiness score.
We also found that respondents in the top 20% for happiness are less likely to consider a job change and the respondents with the highest stress scores are the most likely to consider a job change.
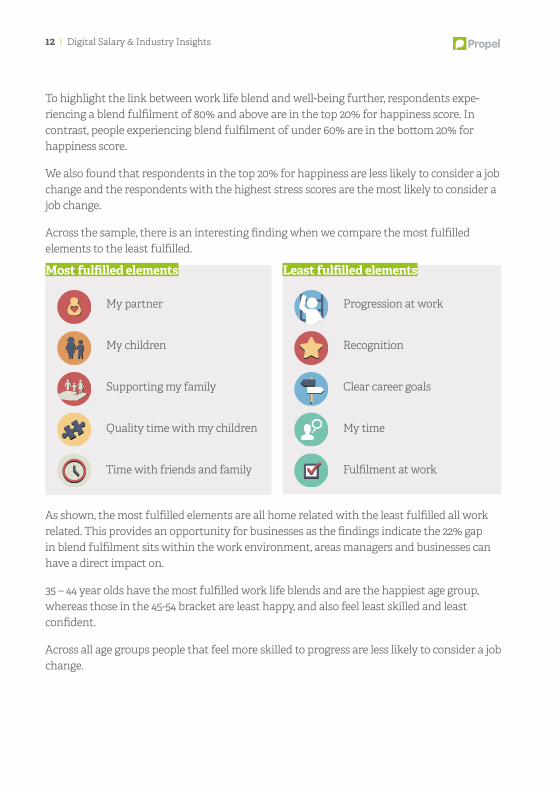
Across the sample, there is an interesting finding when we compare the most fulfilled elements to the least fulfilled.
As shown, the most fulfilled elements are all home related with the least fulfilled all work related. This provides an opportunity for businesses as the findings indicate the 22% gap in blend fulfilment sits within the work environment, areas managers and businesses can have a direct impact on.
35 – 44 year olds have the most fulfilled work life blends and are the happiest age group, whereas those in the 45-54 bracket are least happy, and also feel least skilled and least confident.
Across all age groups people that feel more skilled to progress are less likely to consider a job change.
Most fulfilled elements Least fulfilled elements
My partner
My children
Supporting my family
Quality time with my children
Time with friends and family
Progression at work
Recognition
Clear career goals
My time
Fulfilment at work
Digital Salary & Industry Insights l 13
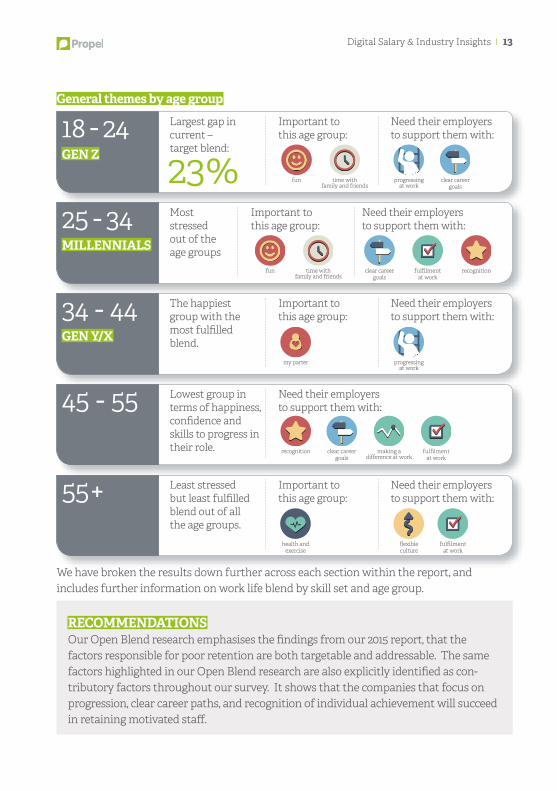
General themes by age group
23%
ReCOMMenDATIOnSOur Open Blend research emphasises the findings from our 2015 report, that the factors responsible for poor retention are both targetable and addressable. The same factors highlighted in our Open Blend research are also explicitly identified as con-tributory factors throughout our survey. It shows that the companies that focus on progression, clear career paths, and recognition of individual achievement will succeed in retaining motivated staff.
Largest gap in current – target blend:
Most stressed out of the age groups
The happiest group with the most fulfilled blend.
Lowest group in terms of happiness, confidence and skills to progress in their role.
Least stressed but least fulfilled blend out of all the age groups.
Important to this age group:
Important to this age group:
Important to this age group:
Need their employers to support them with:
Important to this age group:
Need their employers to support them with:
Need their employers to support them with:
Need their employers to support them with:
Need their employers to support them with:
18 - 24 Gen Z
25 - 34 MILLennIALS
34 - 44 Gen Y/X
45 - 55
55+
We have broken the results down further across each section within the report, and includes further information on work life blend by skill set and age group.
time withfamily and friends
time withfamily and friends
fulfilmentat work
making adifference at work
fulfilmentat work
recognition
recognition
fun
fun clear careergoals
clear careergoals
progressing at work
clear careergoals
my parter progressing at work
health and exercise
flexibleculture
fulfilmentat work
14 l Digital Salary & Industry Insights
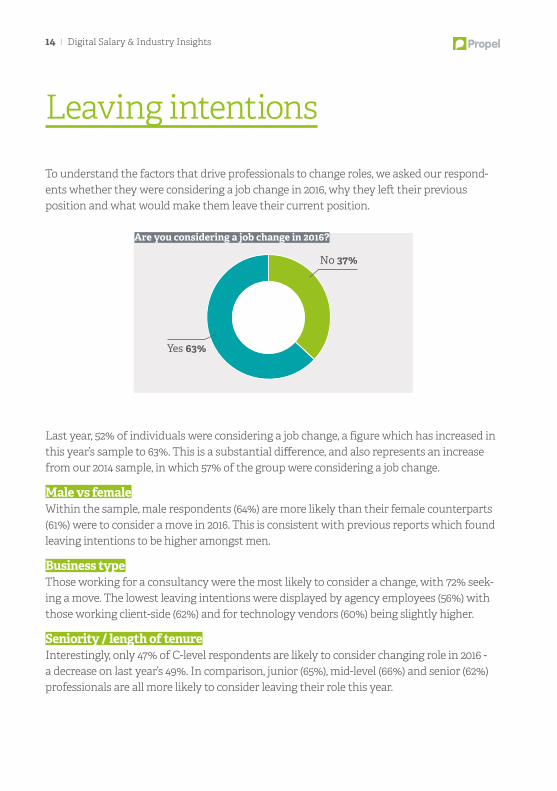
To understand the factors that drive professionals to change roles, we asked our respond-ents whether they were considering a job change in 2016, why they left their previous position and what would make them leave their current position.
Last year, 52% of individuals were considering a job change, a figure which has increased in this year’s sample to 63%. This is a substantial difference, and also represents an increase from our 2014 sample, in which 57% of the group were considering a job change.
Male vs femaleWithin the sample, male respondents (64%) are more likely than their female counterparts (61%) were to consider a move in 2016. This is consistent with previous reports which found leaving intentions to be higher amongst men.
Business typeThose working for a consultancy were the most likely to consider a change, with 72% seek-ing a move. The lowest leaving intentions were displayed by agency employees (56%) with those working client-side (62%) and for technology vendors (60%) being slightly higher.
Seniority / length of tenureInterestingly, only 47% of C-level respondents are likely to consider changing role in 2016 - a decrease on last year’s 49%. In comparison, junior (65%), mid-level (66%) and senior (62%) professionals are all more likely to consider leaving their role this year.
Leaving intentions
No 37%
Yes 63%
Are you considering a job change in 2016?
Digital Salary & Industry Insights l 15
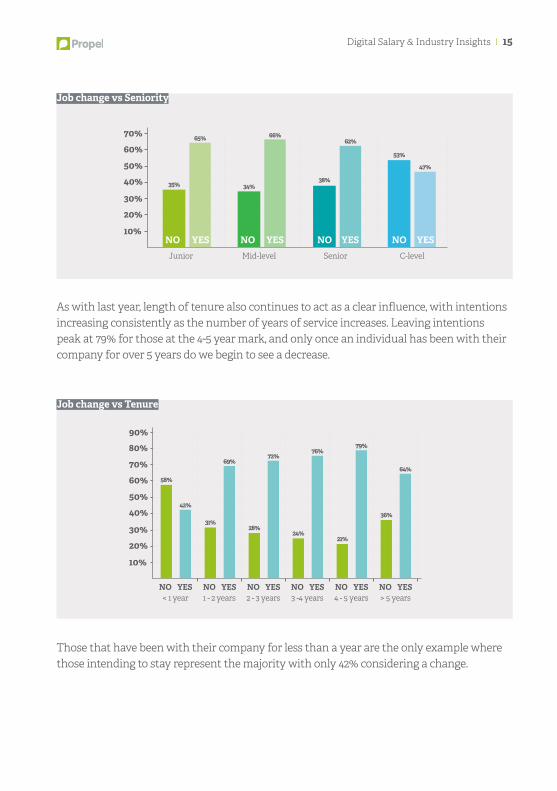
As with last year, length of tenure also continues to act as a clear influence, with intentions increasing consistently as the number of years of service increases. Leaving intentions peak at 79% for those at the 4-5 year mark, and only once an individual has been with their company for over 5 years do we begin to see a decrease.
Those that have been with their company for less than a year are the only example where those intending to stay represent the majority with only 42% considering a change.
Junior Mid-level Senior C-level
20%
10%
30%
50%40%
60%70%
35%
65%
34%
66%
38%
62%
53%
47%
NO YES NO YES YESNO YESNO
< 1 year
20%
10%
30%
50%40%
60%70%
80%90%
58%
42%
NO YES1 - 2 years
31%
69%
NO YES2 - 3 years
28%
72%
NO YES3 -4 years
24%
76%
NO YES4 - 5 years
21%
79%
NO YES> 5 years
36%
64%
NO YES
Job change vs Seniority
Job change vs Tenure
16 l Digital Salary & Industry Insights
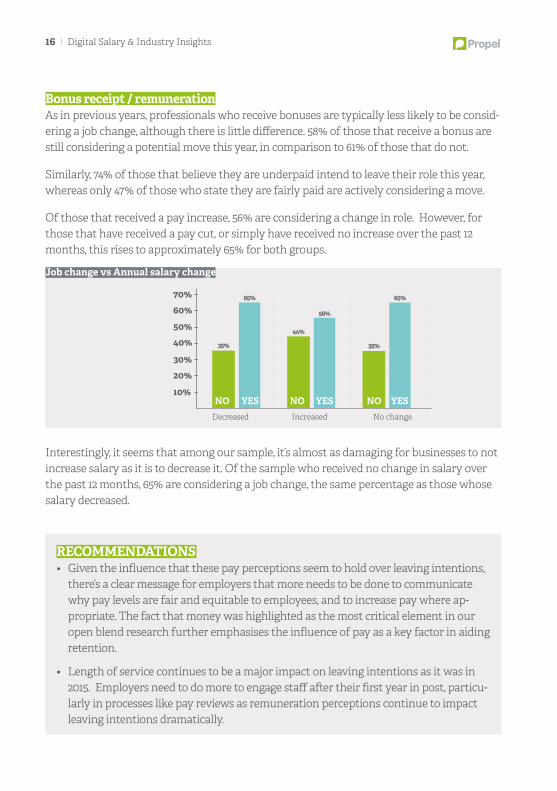
Bonus receipt / remunerationAs in previous years, professionals who receive bonuses are typically less likely to be consid-ering a job change, although there is little difference. 58% of those that receive a bonus are still considering a potential move this year, in comparison to 61% of those that do not.
Similarly, 74% of those that believe they are underpaid intend to leave their role this year, whereas only 47% of those who state they are fairly paid are actively considering a move.
Of those that received a pay increase, 56% are considering a change in role. However, for those that have received a pay cut, or simply have received no increase over the past 12 months, this rises to approximately 65% for both groups.
Interestingly, it seems that among our sample, it’s almost as damaging for businesses to not increase salary as it is to decrease it. Of the sample who received no change in salary over the past 12 months, 65% are considering a job change, the same percentage as those whose salary decreased.
Decreased Increased No change
20%
10%
30%
50%40%
60%70%
35%
65%
44%
56%
35%
65%
NO YES NO YES YESNO
ReCOMMenDATIOnS• Given the influence that these pay perceptions seem to hold over leaving intentions,
there’s a clear message for employers that more needs to be done to communicate why pay levels are fair and equitable to employees, and to increase pay where ap-propriate. The fact that money was highlighted as the most critical element in our open blend research further emphasises the influence of pay as a key factor in aiding retention.
• Length of service continues to be a major impact on leaving intentions as it was in 2015. Employers need to do more to engage staff after their first year in post, particu-larly in processes like pay reviews as remuneration perceptions continue to impact leaving intentions dramatically.
Job change vs Annual salary change
Digital Salary & Industry Insights l 17
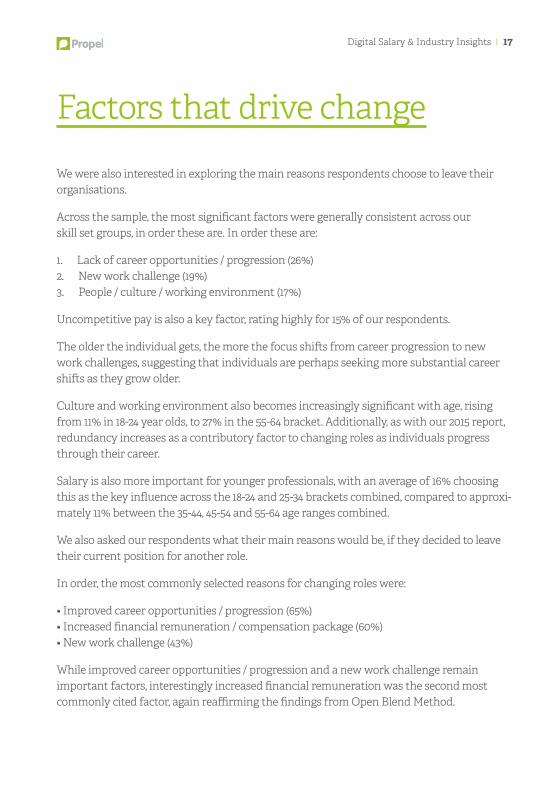
We were also interested in exploring the main reasons respondents choose to leave their organisations.
Across the sample, the most significant factors were generally consistent across our skill set groups, in order these are. In order these are:
1. Lack of career opportunities / progression (26%)2. New work challenge (19%)3. People / culture / working environment (17%)
Uncompetitive pay is also a key factor, rating highly for 15% of our respondents.
The older the individual gets, the more the focus shifts from career progression to new work challenges, suggesting that individuals are perhaps seeking more substantial career shifts as they grow older.
Culture and working environment also becomes increasingly significant with age, rising from 11% in 18-24 year olds, to 27% in the 55-64 bracket. Additionally, as with our 2015 report, redundancy increases as a contributory factor to changing roles as individuals progress through their career.
Salary is also more important for younger professionals, with an average of 16% choosing this as the key influence across the 18-24 and 25-34 brackets combined, compared to approxi-mately 11% between the 35-44, 45-54 and 55-64 age ranges combined.
We also asked our respondents what their main reasons would be, if they decided to leave their current position for another role.
In order, the most commonly selected reasons for changing roles were:
• Improved career opportunities / progression (65%)• Increased financial remuneration / compensation package (60%)• New work challenge (43%)
While improved career opportunities / progression and a new work challenge remain important factors, interestingly increased financial remuneration was the second most commonly cited factor, again reaffirming the findings from Open Blend Method.
Factors that drive change
18 l Digital Salary & Industry Insights
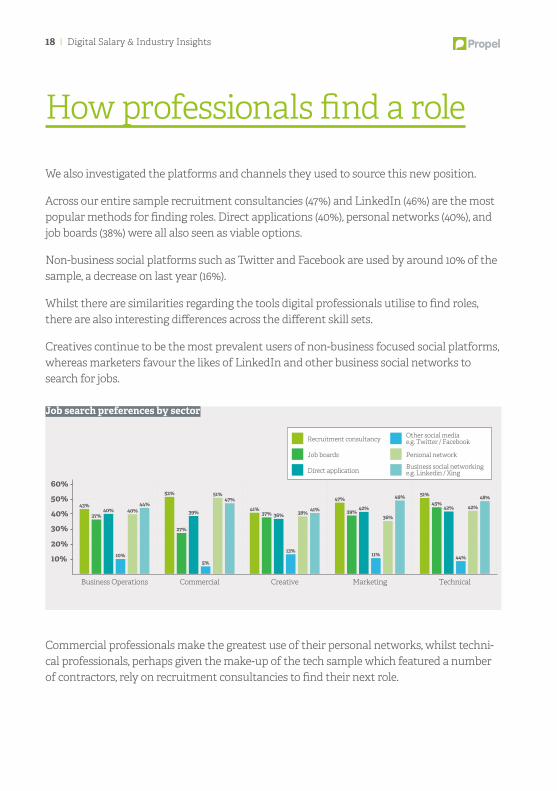
We also investigated the platforms and channels they used to source this new position.
Across our entire sample recruitment consultancies (47%) and LinkedIn (46%) are the most popular methods for finding roles. Direct applications (40%), personal networks (40%), and job boards (38%) were all also seen as viable options.
Non-business social platforms such as Twitter and Facebook are used by around 10% of the sample, a decrease on last year (16%).
Whilst there are similarities regarding the tools digital professionals utilise to find roles, there are also interesting differences across the different skill sets.
Creatives continue to be the most prevalent users of non-business focused social platforms, whereas marketers favour the likes of LinkedIn and other business social networks to search for jobs.
Commercial professionals make the greatest use of their personal networks, whilst techni-cal professionals, perhaps given the make-up of the tech sample which featured a number of contractors, rely on recruitment consultancies to find their next role.
How professionals find a role
10%
20%
40%
30%
50%
60%
Business Operations
43%
37%40%
10%
40%44%
Commercial
52%
27%
39%
5%
51%47%
Creative
41%37% 36%
13%
38% 41%
Marketing
47%
39% 42%
11%
36%
49%
Technical
51%45%
42%
44%
42%
48%
Recruitment consultancy
Job boards
Direct application
Other social media e.g. Twi�er / Facebook
Personal network
Business social networking e.g. Linkedin / Xing
Job search preferences by sector
Digital Salary & Industry Insights l 19
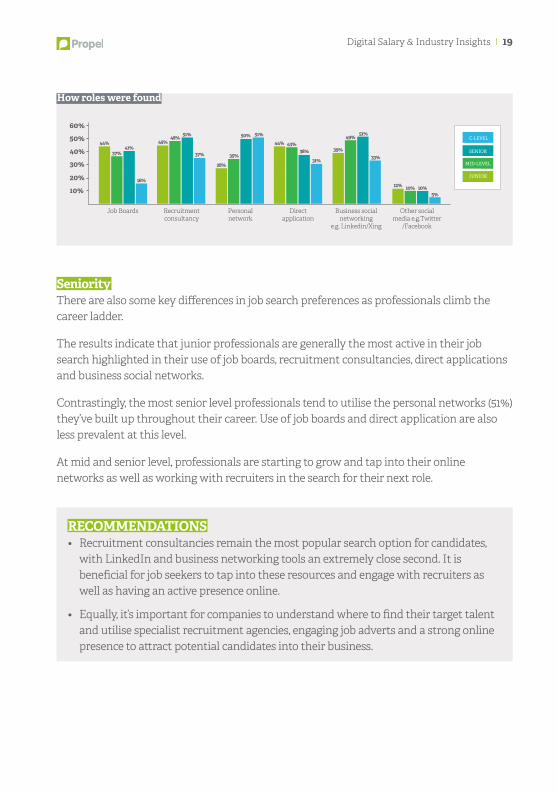
SeniorityThere are also some key differences in job search preferences as professionals climb the career ladder.
The results indicate that junior professionals are generally the most active in their job search highlighted in their use of job boards, recruitment consultancies, direct applications and business social networks.
Contrastingly, the most senior level professionals tend to utilise the personal networks (51%) they’ve built up throughout their career. Use of job boards and direct application are also less prevalent at this level.
At mid and senior level, professionals are starting to grow and tap into their online networks as well as working with recruiters in the search for their next role.
Job Boards
10%
20%
40%
30%
50%
60%
44% 45% 44% 43%48% 51% 51%50%
37% 38% 39%
49% 51%
28%31% 33%
12% 10% 10%5%
35%41%
16%
37%
Recruitmentconsultancy
Personalnetwork
Directapplication
Business socialnetworking
e.g. Linkedin/Xing
Other socialmedia e.g.Twi�er
SENIOR
MID-LEVEL
JUNIOR
C-LEVEL
How roles were found
ReCOMMenDATIOnS• Recruitment consultancies remain the most popular search option for candidates,
with LinkedIn and business networking tools an extremely close second. It is beneficial for job seekers to tap into these resources and engage with recruiters as well as having an active presence online.
• Equally, it’s important for companies to understand where to find their target talent and utilise specialist recruitment agencies, engaging job adverts and a strong online presence to attract potential candidates into their business.
20 l Digital Salary & Industry Insights
Bonus receipt amongst our respondents is something we’ve been interested in over past few surveys. In particular we’re interested in how it differs across business type and wheth-er it impacts upon an individual’s willingness to leave their role and their pay perceptions.
55% of our respondents receive some form of bonus, a finding which is consistent with our 2015 report (55%). This also represents an increase on our 2014 sample (50%).
However, less than half of the female sample receive a bonus (47%), down 4% in comparison to 2015, and in contrast, 58% of male respondents receive a bonus, an increase of 2%.
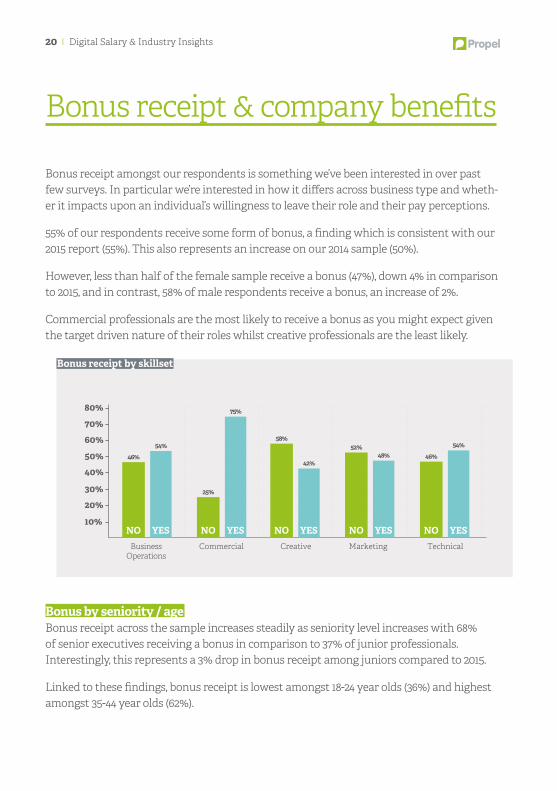
Commercial professionals are the most likely to receive a bonus as you might expect given the target driven nature of their roles whilst creative professionals are the least likely.
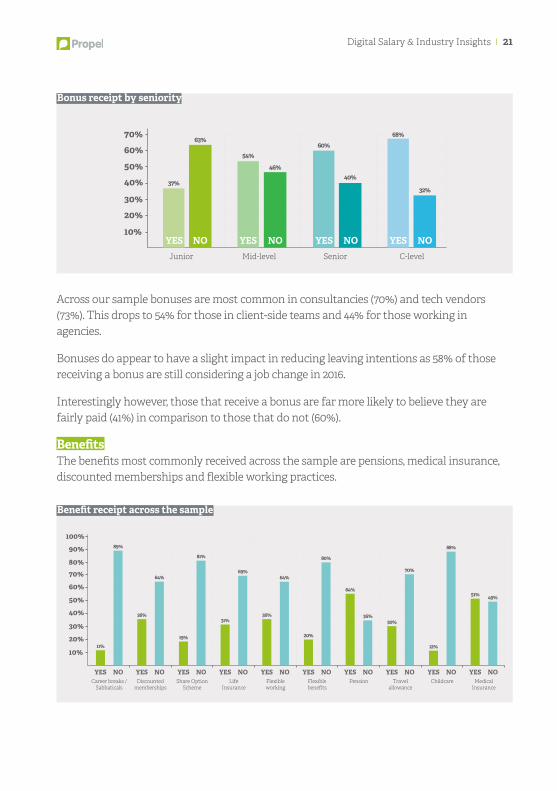
Bonus by seniority / ageBonus receipt across the sample increases steadily as seniority level increases with 68% of senior executives receiving a bonus in comparison to 37% of junior professionals. Interestingly, this represents a 3% drop in bonus receipt among juniors compared to 2015.
Linked to these findings, bonus receipt is lowest amongst 18-24 year olds (36%) and highest amongst 35-44 year olds (62%).
Bonus receipt & company benefits
BusinessOperations
Commercial Creative Marketing Technical
20%
10%
30%
50%40%
60%70%
80%
46%54%
NO YES
25%
75%
NO YES
58%
42%
NO YES
52%48%
NO YES
46%
54%
NO YES
Bonus receipt by skillset
Digital Salary & Industry Insights l 21
Across our sample bonuses are most common in consultancies (70%) and tech vendors (73%). This drops to 54% for those in client-side teams and 44% for those working in agencies.
Bonuses do appear to have a slight impact in reducing leaving intentions as 58% of those receiving a bonus are still considering a job change in 2016.
Interestingly however, those that receive a bonus are far more likely to believe they are fairly paid (41%) in comparison to those that do not (60%).
BenefitsThe benefits most commonly received across the sample are pensions, medical insurance, discounted memberships and flexible working practices.
Junior Mid-level Senior C-level
20%
10%
30%
50%40%
60%70%
63%
NO
37%
YES
46%
NO
54%
YES
40%
NO
60%
YES
32%
NO
68%
YES
Bonus receipt by seniority
Career breaks /Sabbaticals
20%
10%
30%
50%40%
60%70%80%
90%100%
11%
89%
NOYESDiscounted
memberships
36%
64%
NOYESShare Option
Scheme
19%
81%
NOYESLife
Insurance
31%
69%
NOYESFlexibleworking
36%
64%
NOYESFlexiblebenefits
20%
80%
NOYESPension
64%
36%
NOYESTravel
allowance
30%
70%
NOYESChildcare
12%
88%
NOYESMedical
Insurance
51% 49%
NOYES
Benefit receipt across the sample
22 l Digital Salary & Industry Insights
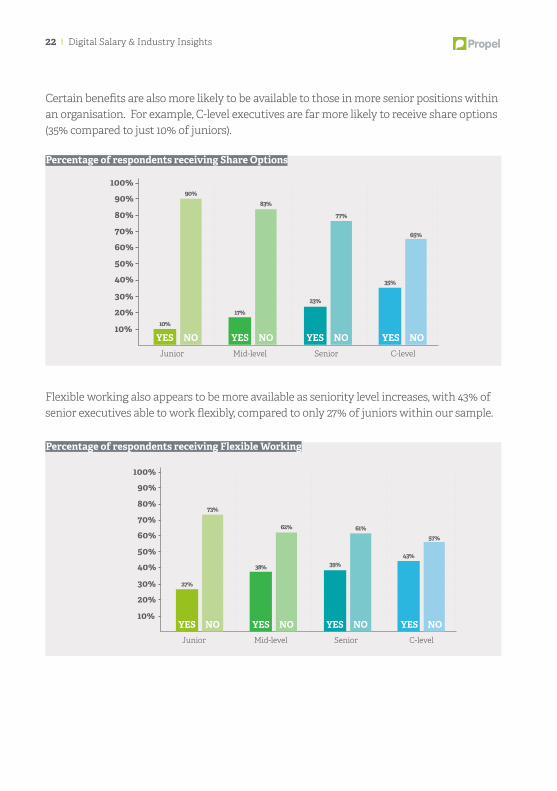
Certain benefits are also more likely to be available to those in more senior positions within an organisation. For example, C-level executives are far more likely to receive share options (35% compared to just 10% of juniors).
Flexible working also appears to be more available as seniority level increases, with 43% of senior executives able to work flexibly, compared to only 27% of juniors within our sample.
Junior Mid-level Senior C-level
20%
10%
30%
50%40%
60%70%
80%
90%100%
10%
90%
17%
83%
23%
77%
35%
65%
YES NO YES NO YES NO YES NO
Percentage of respondents receiving Share Options
Junior Mid-level Senior C-level
20%
10%
30%
50%40%
60%70%
80%
90%100%
27%
73%
38%
62%
39%
61%
43%
57%
YES NO YES NO YES NO YES NO
Percentage of respondents receiving Flexible Working
Digital Salary & Industry Insights l 23
We asked those in senior executives and C-level positions additional questions, in order to gain further insight into trends amongst the most senior employees.
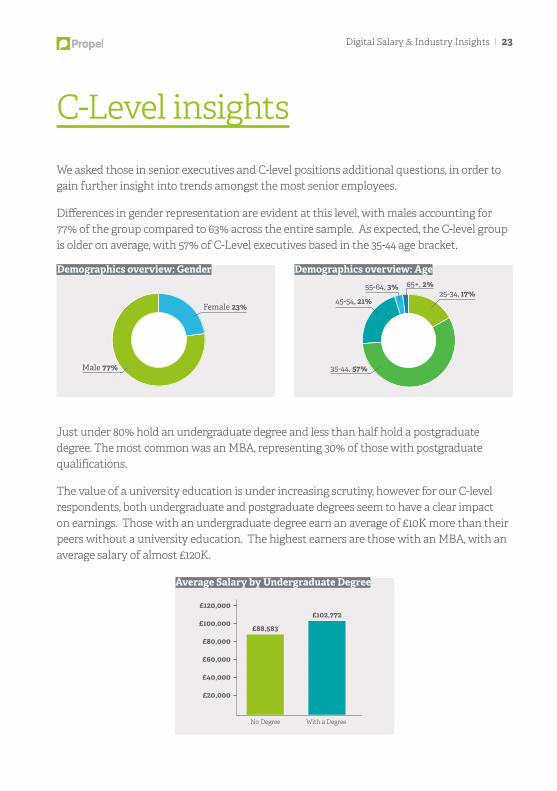
Differences in gender representation are evident at this level, with males accounting for 77% of the group compared to 63% across the entire sample. As expected, the C-level group is older on average, with 57% of C-Level executives based in the 35-44 age bracket.
Just under 80% hold an undergraduate degree and less than half hold a postgraduate degree. The most common was an MBA, representing 30% of those with postgraduate qualifications.
The value of a university education is under increasing scrutiny, however for our C-level respondents, both undergraduate and postgraduate degrees seem to have a clear impact on earnings. Those with an undergraduate degree earn an average of £10K more than their peers without a university education. The highest earners are those with an MBA, with an average salary of almost £120K.
C-Level insights
Female 23%
Male 77%
25-34, 17%65+, 2%
45-54, 21%
55-64, 3%
35-44, 57%
Demographics overview: Gender Demographics overview: Age
£40,000
£20,000
£60,000
£80,000
£100,000
£120,000
No Degree With a Degree
£88,583
£102,772
Average Salary by Undergraduate Degree
24 l Digital Salary & Industry Insights
Working hoursC-Level respondents are typically contracted more hours per week than those in junior, mid-level and senior positions. For example, 11% of senior executives are contracted 48+ hours per week compared to 3% of junior, mid-level and senior respondents combined.
The results also found that 36% of the most senior professionals work 10+ hours over their contracted hours and only 16% of them work less than 2 hours more than they’re contracted.
In comparison, 20% of the junior, mid-level and senior respondents combined don’t work additional hours, and 40% work less than 2 hours above their contracted hours.
RemunerationFor the vast majority of our executives (70%), performance related pay accounts for 0-30% of their overall remuneration package and for 18% of senior executives, performance influ-ences 60% or more of their overall remuneration package.
Current roleAs previously stated, personal networks are the most popular avenue for finding their next role, with 50% of the respondents having obtained their current role this way.
Following this, the two most popular methods were through a specialist headhunting firm (17%) and through internal promotion (16%).
Exemplifying the difficulty in attracting C-level candidates, over a quarter (27%) stated that they expect to be in their current post for six years or more.
Additionally, many are attached to their current roles with significant notice periods. Slightly under 40% expected to provide notice of between three to six months, and 16% expected to provide notice of six months or more before departing.
Keeping in mind the restrictive notice periods, and the fact that the vast majority of C-level individuals gain roles through their personal network, firms should look to either focus on hiring talented individuals from within to the executive level, or consider employing a specialist headhunting firm in order to attract the best candidates externally.
Digital Salary & Industry Insights l 25
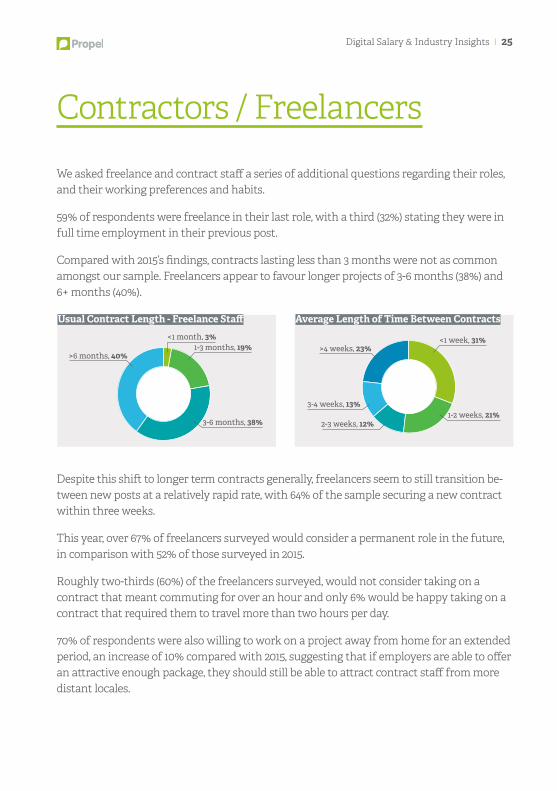
We asked freelance and contract staff a series of additional questions regarding their roles, and their working preferences and habits.
59% of respondents were freelance in their last role, with a third (32%) stating they were in full time employment in their previous post.
Compared with 2015’s findings, contracts lasting less than 3 months were not as common amongst our sample. Freelancers appear to favour longer projects of 3-6 months (38%) and 6+ months (40%).
Despite this shift to longer term contracts generally, freelancers seem to still transition be-tween new posts at a relatively rapid rate, with 64% of the sample securing a new contract within three weeks.
This year, over 67% of freelancers surveyed would consider a permanent role in the future, in comparison with 52% of those surveyed in 2015.
Roughly two-thirds (60%) of the freelancers surveyed, would not consider taking on a contract that meant commuting for over an hour and only 6% would be happy taking on a contract that required them to travel more than two hours per day.
70% of respondents were also willing to work on a project away from home for an extended period, an increase of 10% compared with 2015, suggesting that if employers are able to offer an attractive enough package, they should still be able to attract contract staff from more distant locales.
Contractors / Freelancers
1-3 months, 19%<1 month, 3%
>6 months, 40%
3-6 months, 38%
<1 week, 31%>4 weeks, 23%
3-4 weeks, 13%
2-3 weeks, 12%1-2 weeks, 21%
Usual Contract Length - Freelance Staff Average Length of Time Between Contracts
26 l Digital Salary & Industry Insights
Encouragingly, the overall average salaries across the skill sets covered appear to be greater in comparison with last year.
Overall Agency Client-side Tech Vendors ConsultancyJunior £27,542 £24,243 £28,607 £32,900 £29,871
Mid-level £41,514 £37,172 £41,826 £50,009 £49,303
Senior £68,256 £57,436 £70,793 £84,915 £69,434
C-level £108,418 £109,060 £103,235 £123,769 £89,286
In contrast to 2015, agency staff represent the lowest paid group across the majority of seniority levels and have seen their average salaries decrease across junior, mid-level and senior positions.
What is clear is that the healthy salaries across the different skill sets and business types are representative of the flourishing digital economy.
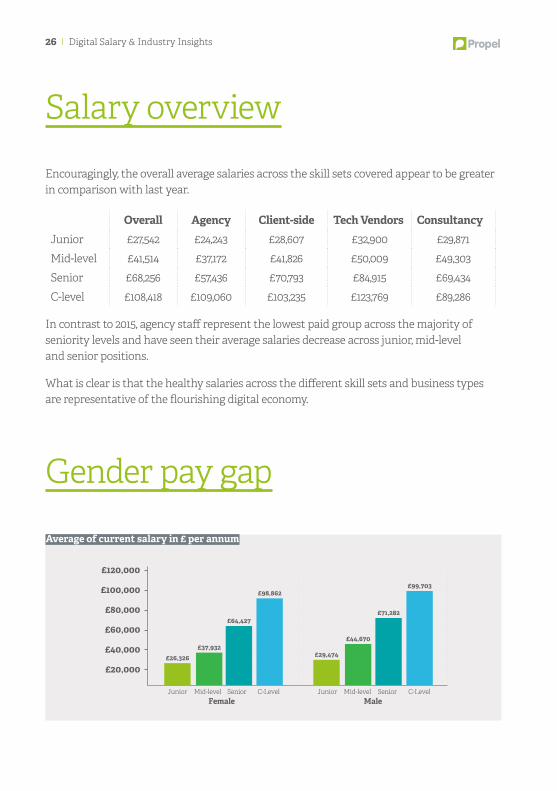
Gender pay gap
Salary overview
£40,000
£20,000
£60,000
£100,000
£80,000
£120,000
FemaleC-Level
£98,862
Senior
£64,427
Mid-level
£37,932
Junior
£26,326
MaleC-Level
£99,703
Senior
£71,282
Mid-level
£44,670
Junior
£29,474
Average of current salary in £ per annum
Digital Salary & Industry Insights l 27
The pay gap across the sample sits relative to that observed in ONS statistics, at approximately 18%.
As with our 2015 report, there are still some clear differences in pay across genders. The gender pay gap becomes much more significant at mid and senior levels, with over £6,000 separating average pay at these levels. Some positives can be seen at the C-level bracket, where the gap is much narrower and almost at parity.
Gender pay differences continue to make headlines, with the UK government currently drafting legislation that, if passed, would force companies above 250 employees to disclose the gender pay gap amongst their workforce.
Regardless of the threat of legislation, firms need to do more to identify where gender pay differences exist in their organisations and rectify the underlying reasons. Our research suggests that these interventions should be targeted primarily at middle and senior man-agement level.
28 l Digital Salary & Industry Insights
Section 2:
Marketing
The role of the modern marketer continuesto develop and diversify with marketers nowexpected to reach consumers seamlesslyacross multiple channels and touchpoints.
Salaries across the group remain below theoverall averages, however compared to 2015,salaries do increase for three of the fourseniority levels which is encouraging.Findings from our Open Blend researchsuggest that progression and fulfilment atwork are key areas of concern across manyof the age brackets.
Digital Salary & Industry Insights l 29
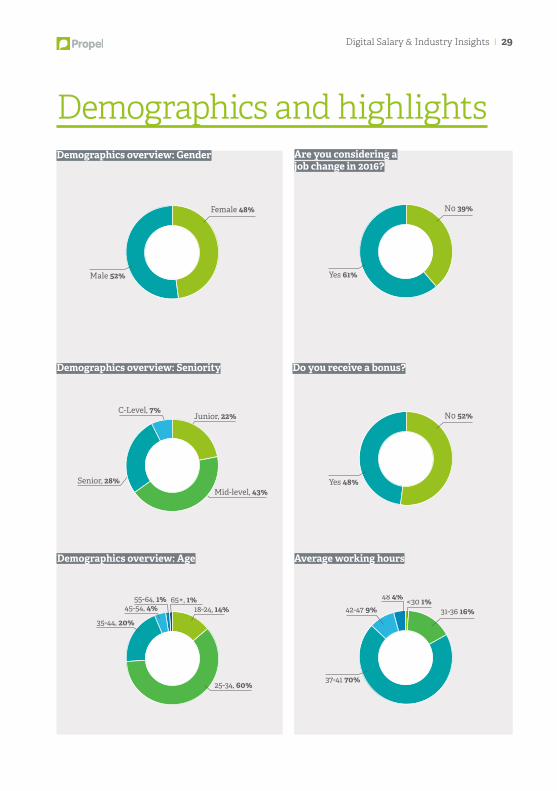
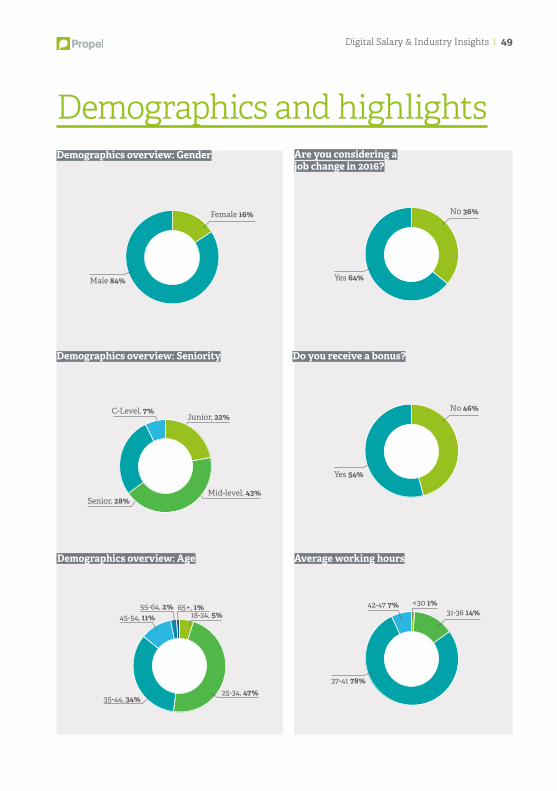
Demographics and highlights
N0 39%
Yes 61%
N0 52%
Yes 48%
31-36 16%<30 1%48 4%
42-47 9%
37-41 70%
Are you considering ajob change in 2016?
Do you receive a bonus?
Average working hours
Junior, 22%C-Level, 7%
Mid-level, 43%Senior, 28%
18-24, 14%65+, 1%
45-54, 4%55-64, 1%
25-34, 60%
35-44, 20%
Demographics overview: Gender
Demographics overview: Seniority
Demographics overview: Age
Female 48%
Male 52%
30 l Digital Salary & Industry Insights
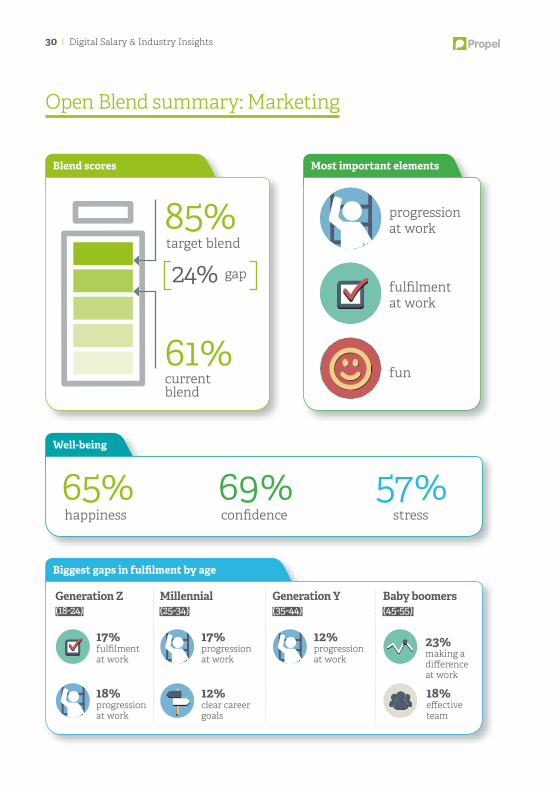
Most important elementsBlend scores
Biggest gaps in fulfilment by age
progressionat work
target blend
fulfilmentat work
24% gap
funcurrent blend
61%
Well-being
happiness65%
confidence69%
stress57%
85%
Generation Z(18-24)
Millennial(25-34)
Generation Y (35-44)
Baby boomers(45-55)
17%fulfilmentat work
17%progressionat work
12%progressionat work
23%making adifferenceat work
18%progressionat work
12%clear careergoals
18%effectiveteam
Open Blend summary: Marketing
Digital Salary & Industry Insights l 31
£40,000
£20,000
£60,000
£100,000
£80,000
£120,000
C-LevelSeniorMid-levelJunior
£26,504£39,007
£63,723
£108,203
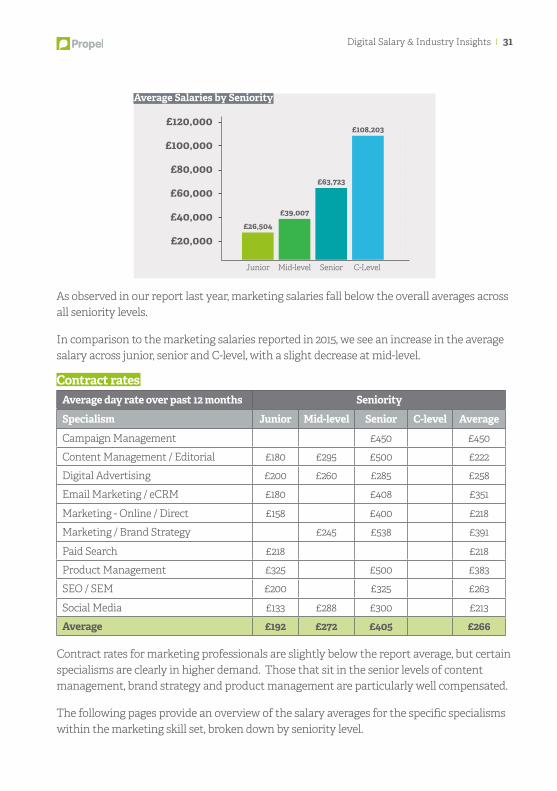
Average Salaries by Seniority
As observed in our report last year, marketing salaries fall below the overall averages across all seniority levels.
In comparison to the marketing salaries reported in 2015, we see an increase in the average salary across junior, senior and C-level, with a slight decrease at mid-level.
Contract ratesAverage day rate over past 12 months Seniority
Specialism Junior Mid-level Senior C-level Average
Campaign Management £450 £450
Content Management / Editorial £180 £295 £500 £222
Digital Advertising £200 £260 £285 £258
Email Marketing / eCRM £180 £408 £351
Marketing - Online / Direct £158 £400 £218
Marketing / Brand Strategy £245 £538 £391
Paid Search £218 £218
Product Management £325 £500 £383
SEO / SEM £200 £325 £263
Social Media £133 £288 £300 £213
Average £192 £272 £405 £266
Contract rates for marketing professionals are slightly below the report average, but certain specialisms are clearly in higher demand. Those that sit in the senior levels of content management, brand strategy and product management are particularly well compensated.
The following pages provide an overview of the salary averages for the specific specialisms within the marketing skill set, broken down by seniority level.
32 l Digital Salary & Industry Insights
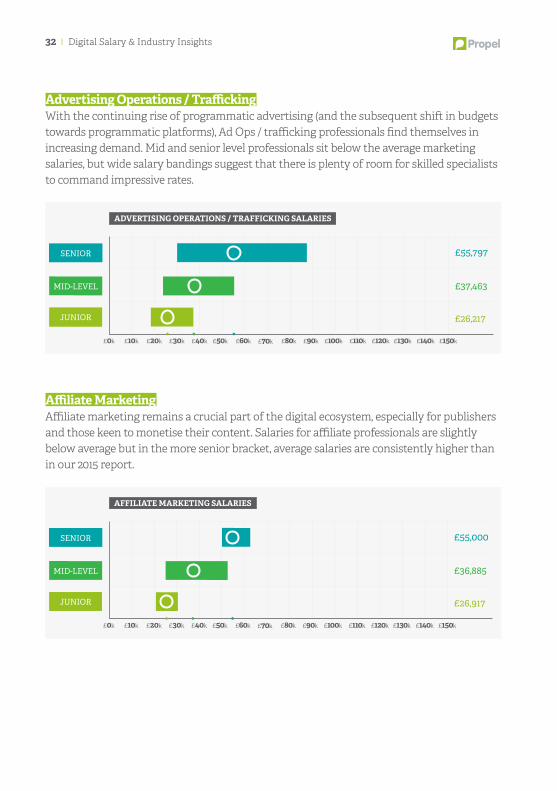
Advertising Operations / TraffickingWith the continuing rise of programmatic advertising (and the subsequent shift in budgets towards programmatic platforms), Ad Ops / trafficking professionals find themselves in increasing demand. Mid and senior level professionals sit below the average marketing salaries, but wide salary bandings suggest that there is plenty of room for skilled specialists to command impressive rates.
Affiliate MarketingAffiliate marketing remains a crucial part of the digital ecosystem, especially for publishers and those keen to monetise their content. Salaries for affiliate professionals are slightly below average but in the more senior bracket, average salaries are consistently higher than in our 2015 report.
£0k £10k £20k £30k £40k £50k £70k £80k £90k £100k £110k £120k £130k £140k
£37,463
£26,217
£55,797
£150k£60k
ADVERTISING OPERATIONS / TRAFFICKING SALARIES
SENIOR
MID-LEVEL
JUNIOR
£0k £10k £20k £30k £40k £50k £70k £80k £90k £100k £110k £120k £130k £140k
£36,885
£26,917
£55,000
£150k£60k
AFFILIATE MARKETING SALARIES
SENIOR
MID-LEVEL
JUNIOR
Digital Salary & Industry Insights l 33
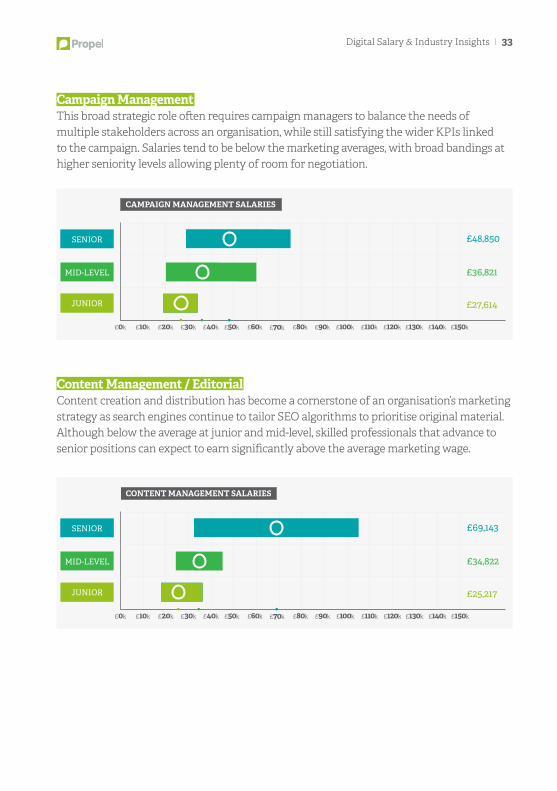
Campaign ManagementThis broad strategic role often requires campaign managers to balance the needs of multiple stakeholders across an organisation, while still satisfying the wider KPIs linked to the campaign. Salaries tend to be below the marketing averages, with broad bandings at higher seniority levels allowing plenty of room for negotiation.
Content Management / editorialContent creation and distribution has become a cornerstone of an organisation’s marketing strategy as search engines continue to tailor SEO algorithms to prioritise original material. Although below the average at junior and mid-level, skilled professionals that advance to senior positions can expect to earn significantly above the average marketing wage.
£0k £10k £20k £30k £40k £50k £70k £80k £90k £100k £110k £120k £130k £140k
£36,821
£27,614
£48,850
£150k£60k
CAMPAIGN MANAGEMENT SALARIES
SENIOR
MID-LEVEL
JUNIOR
£0k £10k £20k £30k £40k £50k £70k £80k £90k £100k £110k £120k £130k £140k
£34,822
£25,217
£69,143
£150k£60k
CONTENT MANAGEMENT SALARIES
SENIOR
MID-LEVEL
JUNIOR
34 l Digital Salary & Industry Insights
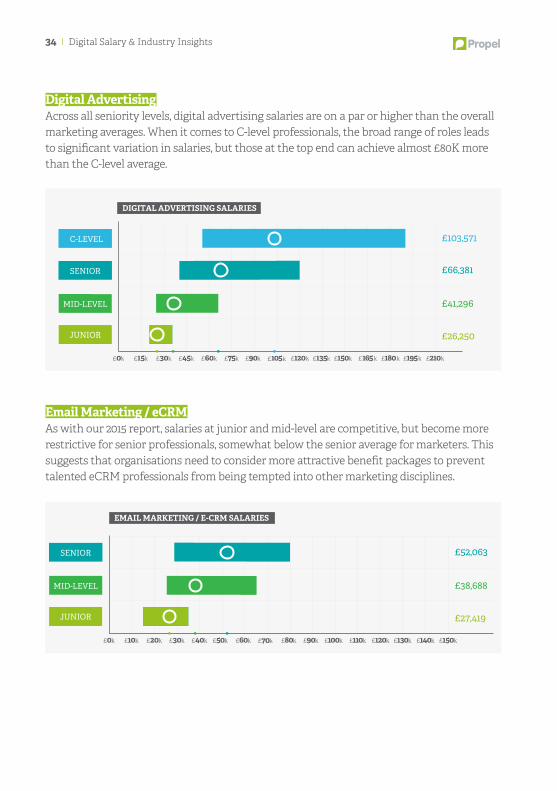
Digital AdvertisingAcross all seniority levels, digital advertising salaries are on a par or higher than the overall marketing averages. When it comes to C-level professionals, the broad range of roles leads to significant variation in salaries, but those at the top end can achieve almost £80K more than the C-level average.
email Marketing / eCRMAs with our 2015 report, salaries at junior and mid-level are competitive, but become more restrictive for senior professionals, somewhat below the senior average for marketers. This suggests that organisations need to consider more attractive benefit packages to prevent talented eCRM professionals from being tempted into other marketing disciplines.
DIGITAL ADVERTISING SALARIES
£41,296
£26,250
£0k
£66,381
£15k £30k £45k £60k £75k £105k £120k £135k £150k £165k £180k £195k £210k£90k
£103,571
SENIOR
MID-LEVEL
JUNIOR
C-LEVEL
£0k £10k £20k £30k £40k £50k £70k £80k £90k £100k £110k £120k £130k £140k
£38,688
£27,419
£52,063
£150k£60k
EMAIL MARKETING / E-CRM SALARIES
SENIOR
MID-LEVEL
JUNIOR
Digital Salary & Industry Insights l 35
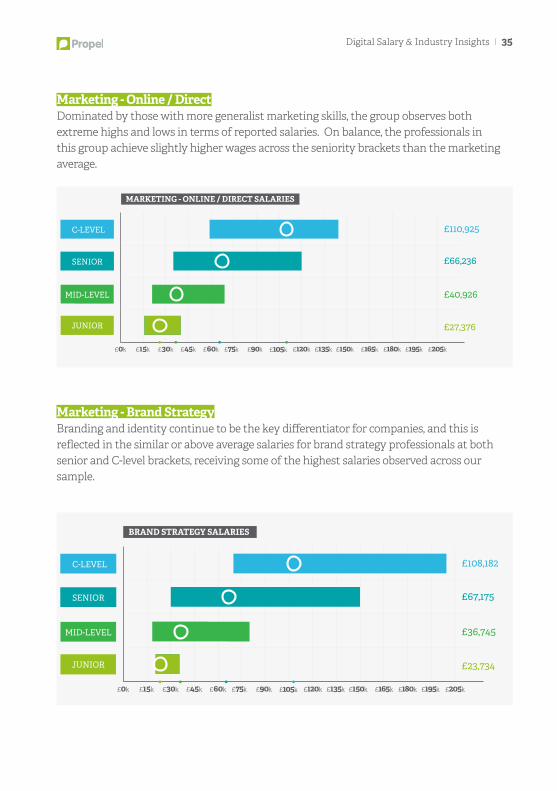
Marketing - Online / DirectDominated by those with more generalist marketing skills, the group observes both extreme highs and lows in terms of reported salaries. On balance, the professionals in this group achieve slightly higher wages across the seniority brackets than the marketing average.
Marketing - Brand StrategyBranding and identity continue to be the key differentiator for companies, and this is reflected in the similar or above average salaries for brand strategy professionals at both senior and C-level brackets, receiving some of the highest salaries observed across our sample.
£40,926
£27,376
£0k
£66,236
£15k £30k £45k £60k £75k £105k £120k £135k £150k £165k £180k £195k £205k£90k
£110,925
MARKETING - ONLINE / DIRECT SALARIES
SENIOR
MID-LEVEL
JUNIOR
C-LEVEL
£36,745
£23,734
£0k
£67,175
£15k £30k £45k £60k £75k £105k £120k £135k £150k £165k £180k £195k £205k£90k
£108,182
BRAND STRATEGY SALARIES
SENIOR
MID-LEVEL
JUNIOR
C-LEVEL
36 l Digital Salary & Industry Insights
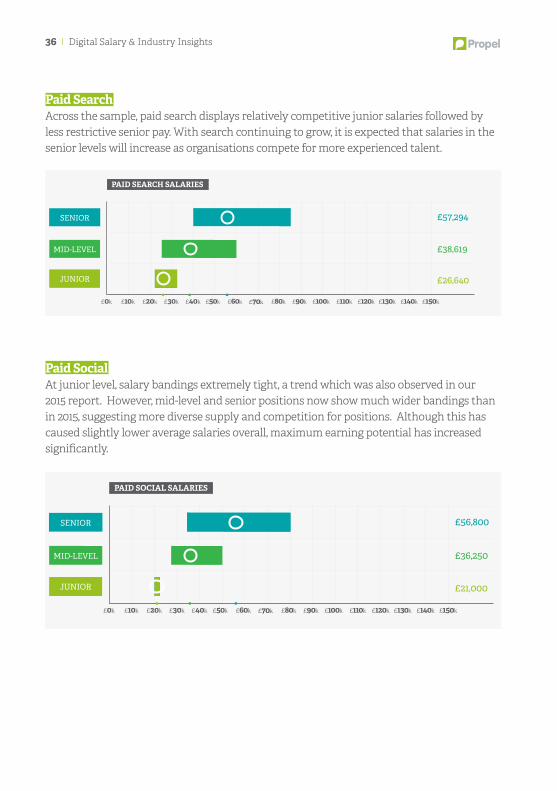
Paid SearchAcross the sample, paid search displays relatively competitive junior salaries followed by less restrictive senior pay. With search continuing to grow, it is expected that salaries in the senior levels will increase as organisations compete for more experienced talent.
Paid SocialAt junior level, salary bandings extremely tight, a trend which was also observed in our 2015 report. However, mid-level and senior positions now show much wider bandings than in 2015, suggesting more diverse supply and competition for positions. Although this has caused slightly lower average salaries overall, maximum earning potential has increased significantly.
£0k £10k £20k £30k £40k £50k £70k £80k £90k £100k £110k £120k £130k £140k
£38,619
£26,640
£57,294
£150k£60k
PAID SEARCH SALARIES
SENIOR
MID-LEVEL
JUNIOR
£0k £10k £20k £30k £40k £50k £70k £80k £90k £100k £110k £120k £130k £140k
£36,250
£21,000
£56,800
£150k£60k
PAID SOCIAL SALARIES
SENIOR
MID-LEVEL
JUNIOR
Digital Salary & Industry Insights l 37
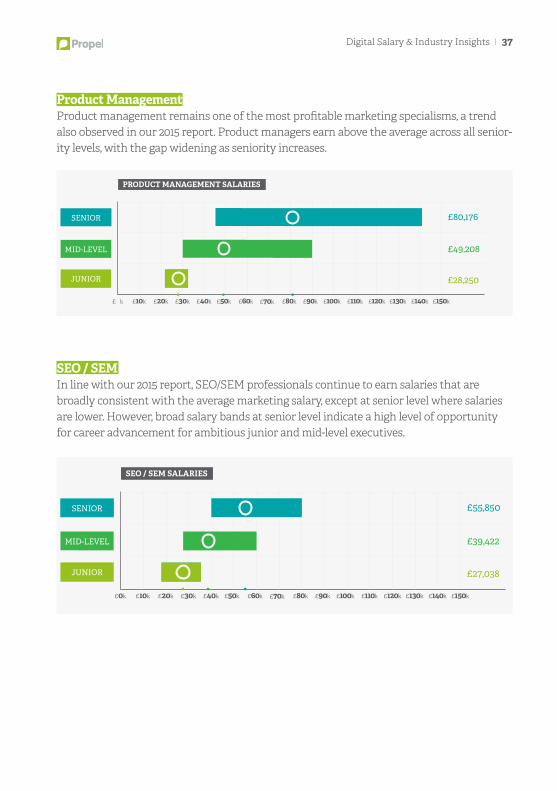
Product ManagementProduct management remains one of the most profitable marketing specialisms, a trend also observed in our 2015 report. Product managers earn above the average across all senior-ity levels, with the gap widening as seniority increases.
SeO / SeMIn line with our 2015 report, SEO/SEM professionals continue to earn salaries that are broadly consistent with the average marketing salary, except at senior level where salaries are lower. However, broad salary bands at senior level indicate a high level of opportunity for career advancement for ambitious junior and mid-level executives.
£ k £10k £20k £30k £40k £50k £70k £80k £90k £100k £110k £120k £130k £140k
£49,208
£28,250
£80,176
£150k£60k
PRODUCT MANAGEMENT SALARIES
SENIOR
MID-LEVEL
JUNIOR
£0k £10k £20k £30k £40k £50k £70k £80k £90k £100k £110k £120k £130k £140k
£39,422
£27,038
£55,850
£150k£60k
SEO / SEM SALARIES
SENIOR
MID-LEVEL
JUNIOR
38 l Digital Salary & Industry Insights
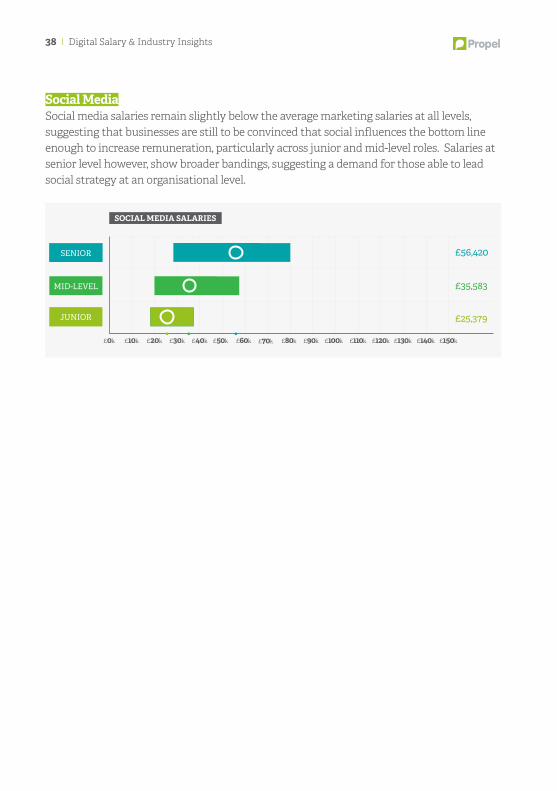
Social MediaSocial media salaries remain slightly below the average marketing salaries at all levels, suggesting that businesses are still to be convinced that social influences the bottom line enough to increase remuneration, particularly across junior and mid-level roles. Salaries at senior level however, show broader bandings, suggesting a demand for those able to lead social strategy at an organisational level.
£0k £10k £20k £30k £40k £50k £70k £80k £90k £100k £110k £120k £130k £140k
£35,583
£25,379
£56,420
£150k£60k
SOCIAL MEDIA SALARIES
SENIOR
MID-LEVEL
JUNIOR
Section 3:
Commercial
The leading edge of a business, those inthe commercial section of our report areresponsible for seeking out potential clientsand fostering the relationships that allowa company to grow.
Salaries have increased across the spectrumin comparison to our 2015 survey, whileresearch from our Open Blend section suggests that employers have to do more to ensure commercial staff are fulfilled, and clear on their future prospects for progression.
40 l Digital Salary & Industry Insights
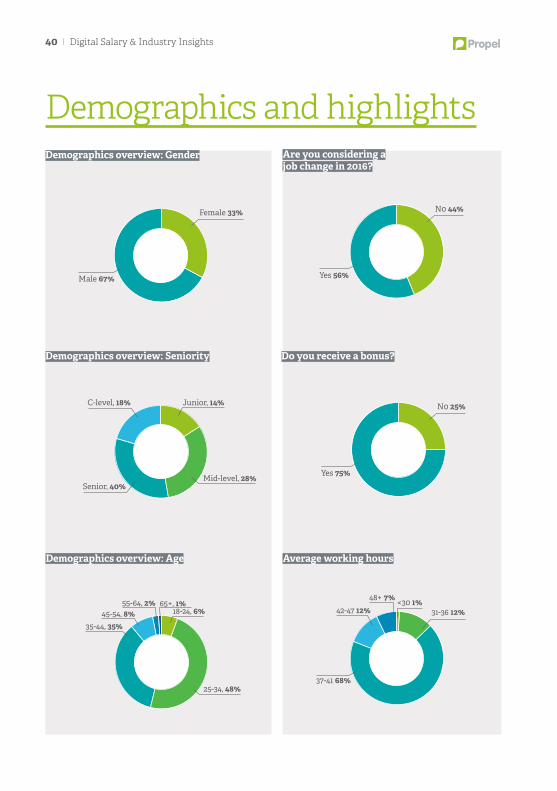
Demographics and highlights
N0 44%
Yes 56%
N0 25%
Yes 75%
31-36 12%<30 1%48+ 7%
42-47 12%
37-41 68%
Are you considering ajob change in 2016?
Do you receive a bonus?
Average working hours
Junior, 14%C-level, 18%
Mid-level, 28%Senior, 40%
18-24, 6%65+, 1%
45-54, 8%55-64, 2%
25-34, 48%
35-44, 35%
Demographics overview: Gender
Demographics overview: Seniority
Demographics overview: Age
Female 33%
Male 67%
Digital Salary & Industry Insights l 41
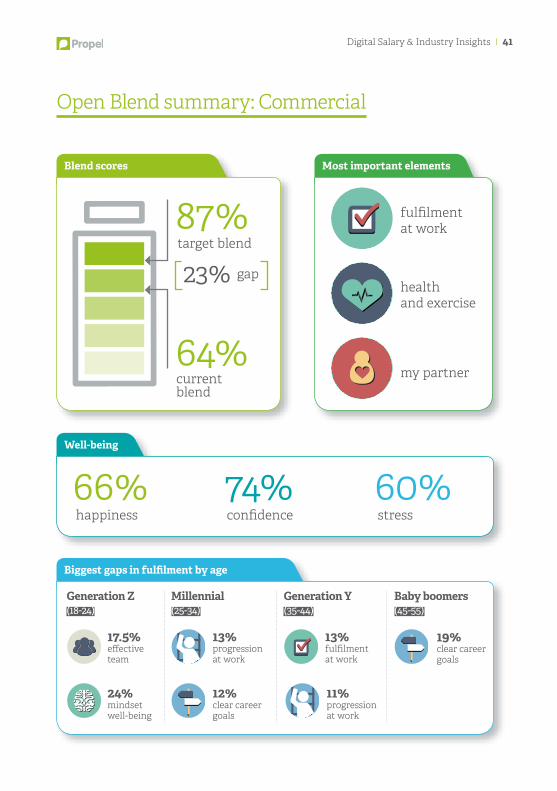
Most important elementsBlend scores
Biggest gaps in fulfilment by age
fulfilmentat work
target blend
healthand exercise
23% gap
my partnercurrent blend
64%
Well-being
happiness66%
confidence74%
stress60%
87%
Generation Z(18-24)
Millennial(25-34)
Generation Y (35-44)
Baby boomers(45-55)
17.5%effectiveteam
13%progressionat work
13%fulfilmentat work
19%clear careergoals
24%mindsetwell-being
12%clear careergoals
11%progressionat work
Open Blend summary: Commercial
42 l Digital Salary & Industry Insights
£40,000
£20,000
£60,000
£100,000
£80,000
£120,000
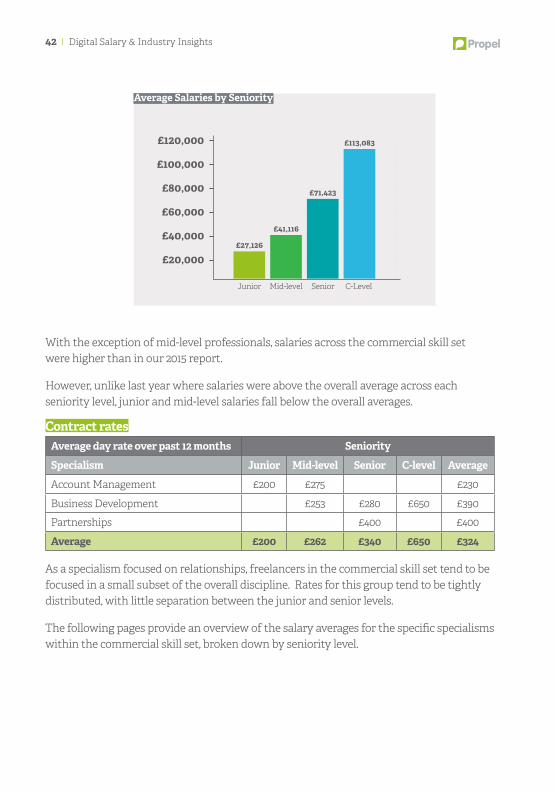
C-LevelSeniorMid-levelJunior
£27,126
£41,116
£71,423
£113,083
Average Salaries by Seniority
With the exception of mid-level professionals, salaries across the commercial skill set were higher than in our 2015 report.
However, unlike last year where salaries were above the overall average across each seniority level, junior and mid-level salaries fall below the overall averages.
Contract ratesAverage day rate over past 12 months Seniority
Specialism Junior Mid-level Senior C-level Average
Account Management £200 £275 £230
Business Development £253 £280 £650 £390
Partnerships £400 £400
Average £200 £262 £340 £650 £324
As a specialism focused on relationships, freelancers in the commercial skill set tend to be focused in a small subset of the overall discipline. Rates for this group tend to be tightly distributed, with little separation between the junior and senior levels.
The following pages provide an overview of the salary averages for the specific specialisms within the commercial skill set, broken down by seniority level.
Digital Salary & Industry Insights l 43
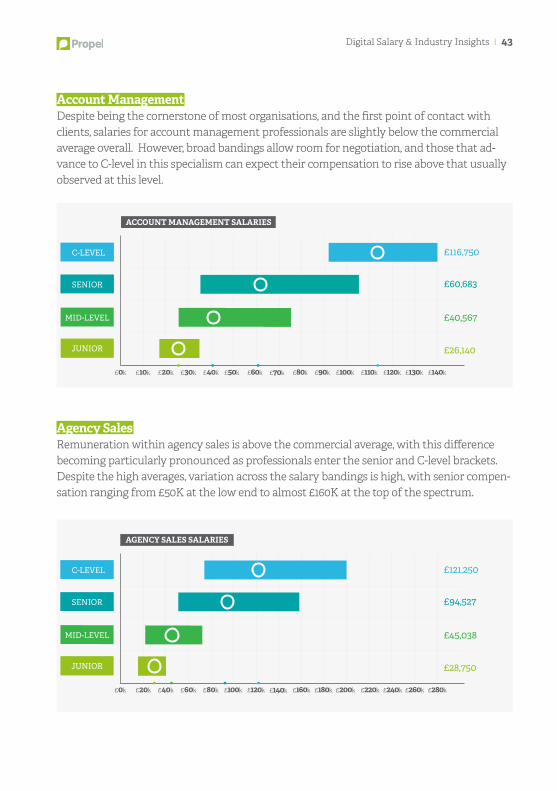
Account ManagementDespite being the cornerstone of most organisations, and the first point of contact with clients, salaries for account management professionals are slightly below the commercial average overall. However, broad bandings allow room for negotiation, and those that ad-vance to C-level in this specialism can expect their compensation to rise above that usually observed at this level.
Agency SalesRemuneration within agency sales is above the commercial average, with this difference becoming particularly pronounced as professionals enter the senior and C-level brackets. Despite the high averages, variation across the salary bandings is high, with senior compen-sation ranging from £50K at the low end to almost £160K at the top of the spectrum.
£40,567
£26,140
£0k
£60,683
£10k £20k £30k £40k £50k £70k £80k £90k £100k £110k £120k £130k £140k£60k
£116,750
ACCOUNT MANAGEMENT SALARIES
SENIOR
MID-LEVEL
JUNIOR
C-LEVEL
£45,038
£28,750
£0k
£94,527
£20k £40k £60k £80k £100k £140k £160k £180k £200k £220k £240k £260k £280k£120k
£121,250
AGENCY SALES SALARIES
SENIOR
MID-LEVEL
JUNIOR
C-LEVEL
44 l Digital Salary & Industry Insights
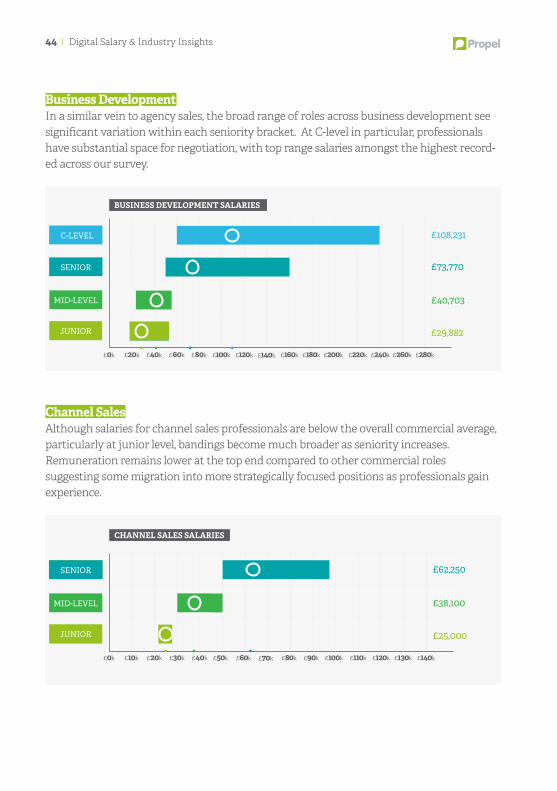
Business DevelopmentIn a similar vein to agency sales, the broad range of roles across business development see significant variation within each seniority bracket. At C-level in particular, professionals have substantial space for negotiation, with top range salaries amongst the highest record-ed across our survey.
Channel SalesAlthough salaries for channel sales professionals are below the overall commercial average, particularly at junior level, bandings become much broader as seniority increases. Remuneration remains lower at the top end compared to other commercial roles suggesting some migration into more strategically focused positions as professionals gain experience.
£40,703
£29,882
£0k
£73,770
£20k £40k £60k £80k £100k £140k £160k £180k £200k £220k £240k £260k £280k£120k
£108,231
BUSINESS DEVELOPMENT SALARIES
SENIOR
MID-LEVEL
JUNIOR
C-LEVEL
£38,100
£25,000
£0k
£62,250
£10k £20k £30k £40k £50k £70k £80k £90k £100k £110k £120k £130k £140k£60k
CHANNEL SALES SALARIES
SENIOR
MID-LEVEL
JUNIOR
Digital Salary & Industry Insights l 45
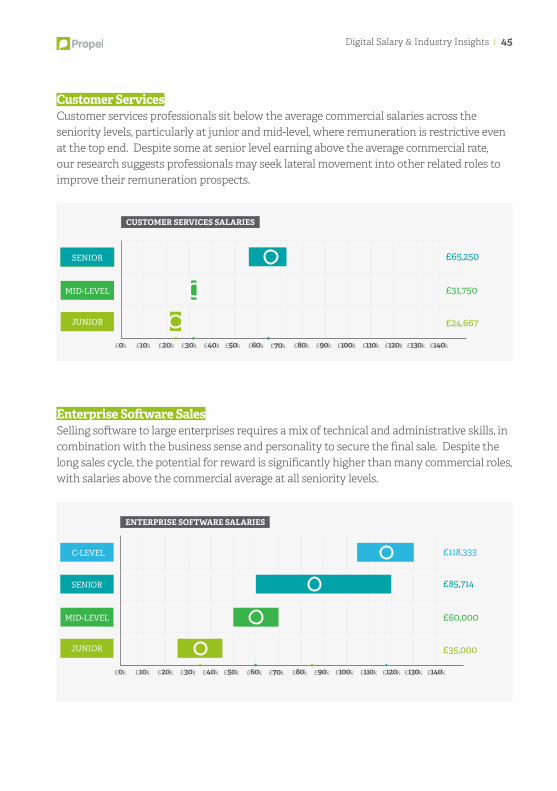
Customer ServicesCustomer services professionals sit below the average commercial salaries across the seniority levels, particularly at junior and mid-level, where remuneration is restrictive even at the top end. Despite some at senior level earning above the average commercial rate, our research suggests professionals may seek lateral movement into other related roles to improve their remuneration prospects.
enterprise Software SalesSelling software to large enterprises requires a mix of technical and administrative skills, in combination with the business sense and personality to secure the final sale. Despite the long sales cycle, the potential for reward is significantly higher than many commercial roles, with salaries above the commercial average at all seniority levels.
£31,750
£24,667
£0k
£65,250
£10k £20k £30k £40k £50k £70k £80k £90k £100k £110k £120k £130k £140k£60k
CUSTOMER SERVICES SALARIES
SENIOR
MID-LEVEL
JUNIOR
£60,000
£35,000
£0k
£85,714
£10k £20k £30k £40k £50k £70k £80k £90k £100k £110k £120k £130k £140k£60k
£118,333
ENTERPRISE SOFTWARE SALARIES
SENIOR
MID-LEVEL
JUNIOR
C-LEVEL
46 l Digital Salary & Industry Insights
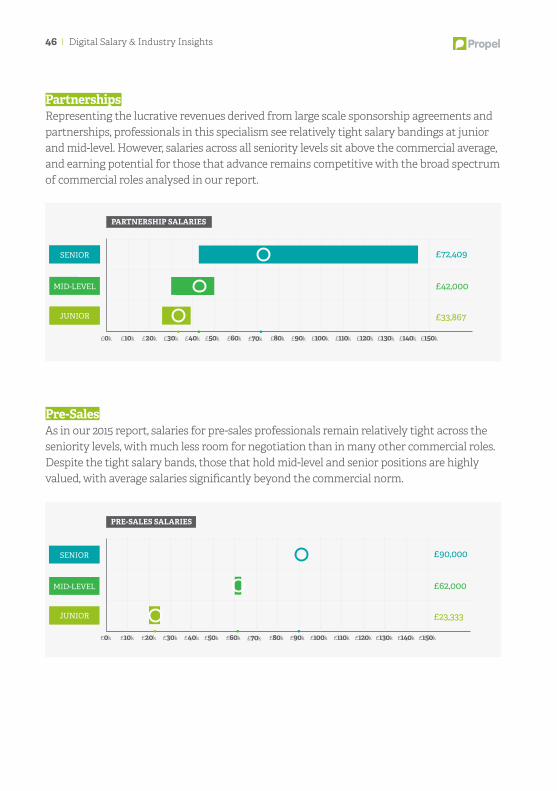
PartnershipsRepresenting the lucrative revenues derived from large scale sponsorship agreements and partnerships, professionals in this specialism see relatively tight salary bandings at junior and mid-level. However, salaries across all seniority levels sit above the commercial average, and earning potential for those that advance remains competitive with the broad spectrum of commercial roles analysed in our report.
Pre-Sales As in our 2015 report, salaries for pre-sales professionals remain relatively tight across the seniority levels, with much less room for negotiation than in many other commercial roles. Despite the tight salary bands, those that hold mid-level and senior positions are highly valued, with average salaries significantly beyond the commercial norm.
£0k £10k £20k £30k £40k £50k £70k £80k £90k £100k £110k £120k £130k £140k
£42,000
£33,867
£72,409
£150k£60k
PARTNERSHIP SALARIES
SENIOR
MID-LEVEL
JUNIOR
£0k £10k £20k £30k £40k £50k £70k £80k £90k £100k £110k £120k £130k £140k
£62,000
£23,333
£90,000
£150k£60k
PRE-SALES SALARIES
SENIOR
MID-LEVEL
JUNIOR
Digital Salary & Industry Insights l 47
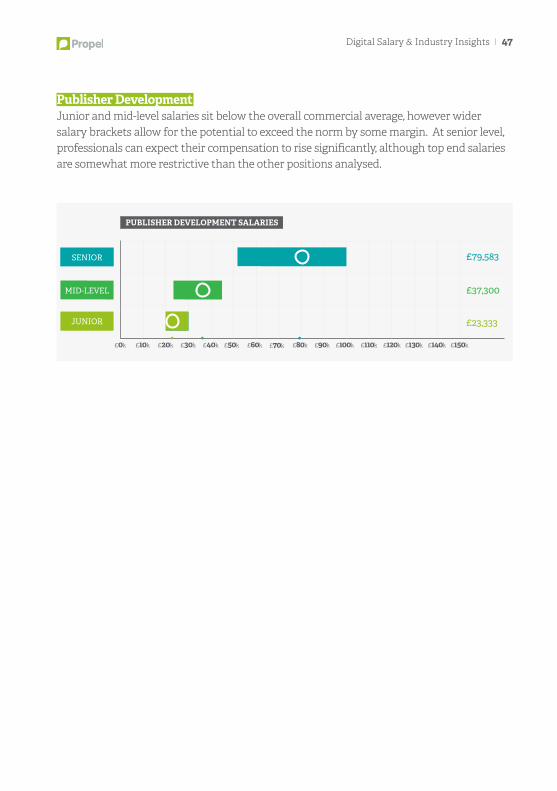
Publisher DevelopmentJunior and mid-level salaries sit below the overall commercial average, however wider salary brackets allow for the potential to exceed the norm by some margin. At senior level, professionals can expect their compensation to rise significantly, although top end salaries are somewhat more restrictive than the other positions analysed.e
£0k £10k £20k £30k £40k £50k £70k £80k £90k £100k £110k £120k £130k £140k
£37,300
£23,333
£79,583
£150k£60k
PUBLISHER DEVELOPMENT SALARIES
SENIOR
MID-LEVEL
JUNIOR
Section 4:
Technical
Those in our technical specialisms are responsible for maintaining the extensive infrastructure and virtual assets that act as storefronts in today’s digital economy. Developers and technical specialists arguably hold as much influence over the customer experience as marketers, with polished online interactions a growing driver of brand preference.
Salaries for this group are above the overallindustry averages observed across oursample. However, findings from our OpenBlend research suggest that progression atwork remains a key concern across manyof the age brackets.
Digital Salary & Industry Insights l 49
Demographics and highlights
N0 36%
Yes 64%
No 46%
Yes 54%
31-36 14%<30 1%42-47 7%
37-41 78%
Are you considering ajob change in 2016?
Do you receive a bonus?
Average working hours
18-24, 5%65+, 1%
45-54, 11%55-64, 2%
25-34, 47%35-44, 34%
Junior, 22%C-Level, 7%
Mid-level, 43%Senior, 28%
Demographics overview: Gender
Demographics overview: Seniority
Demographics overview: Age
Female 16%
Male 84%
50 l Digital Salary & Industry Insights
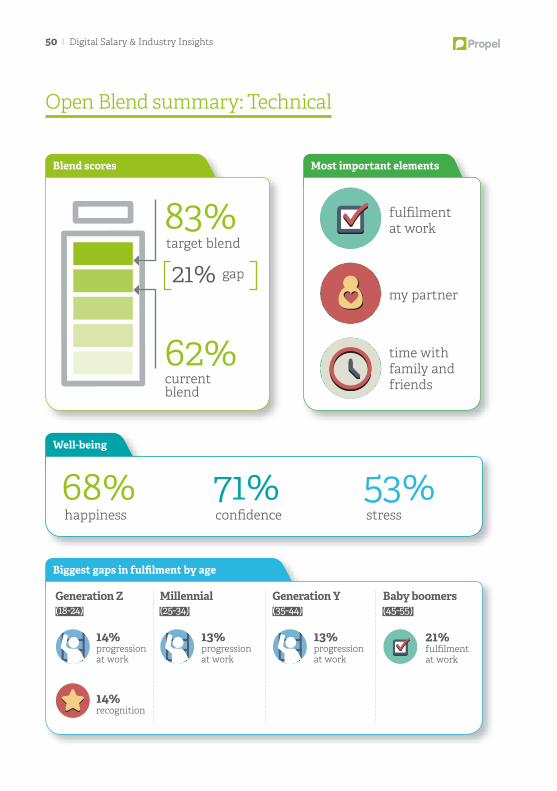
Most important elementsBlend scores
Biggest gaps in fulfilment by age
fulfilmentat work
target blend
my partner21% gap
time withfamily andfriendscurrent
blend
62%
Well-being
happiness68%
confidence71%
stress53%
83%
Generation Z(18-24)
Millennial(25-34)
Generation Y (35-44)
Baby boomers(45-55)
14%progressionat work
13%progressionat work
13%progressionat work
21%fulfilmentat work
14%recognition
Open Blend summary: Technical
Digital Salary & Industry Insights l 51
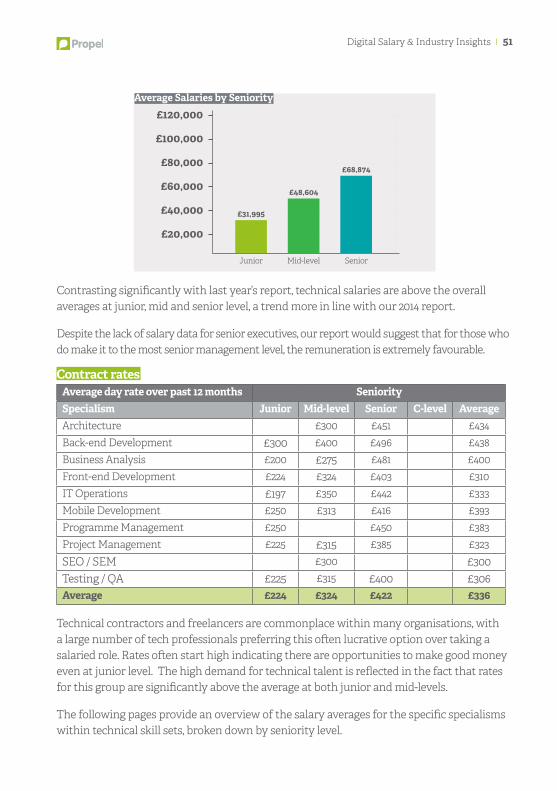
£40,000
£20,000
£60,000
£100,000
£80,000
£120,000
Mid-levelJunior
£31,995
£48,604
Senior
£68,874
Average Salaries by Seniority
Contrasting significantly with last year’s report, technical salaries are above the overall averages at junior, mid and senior level, a trend more in line with our 2014 report.
Despite the lack of salary data for senior executives, our report would suggest that for those who do make it to the most senior management level, the remuneration is extremely favourable.
Contract ratesAverage day rate over past 12 months SenioritySpecialism Junior Mid-level Senior C-level AverageArchitecture £300 £451 £434Back-end Development £300 £400 £496 £438Business Analysis £200 £275 £481 £400Front-end Development £224 £324 £403 £310IT Operations £197 £350 £442 £333Mobile Development £250 £313 £416 £393Programme Management £250 £450 £383Project Management £225 £315 £385 £323SEO / SEM £300 £300Testing / QA £225 £315 £400 £306Average £224 £324 £422 £336
Technical contractors and freelancers are commonplace within many organisations, with a large number of tech professionals preferring this often lucrative option over taking a salaried role. Rates often start high indicating there are opportunities to make good money even at junior level. The high demand for technical talent is reflected in the fact that rates for this group are significantly above the average at both junior and mid-levels.
The following pages provide an overview of the salary averages for the specific specialisms within technical skill sets, broken down by seniority level.
52 l Digital Salary & Industry Insights
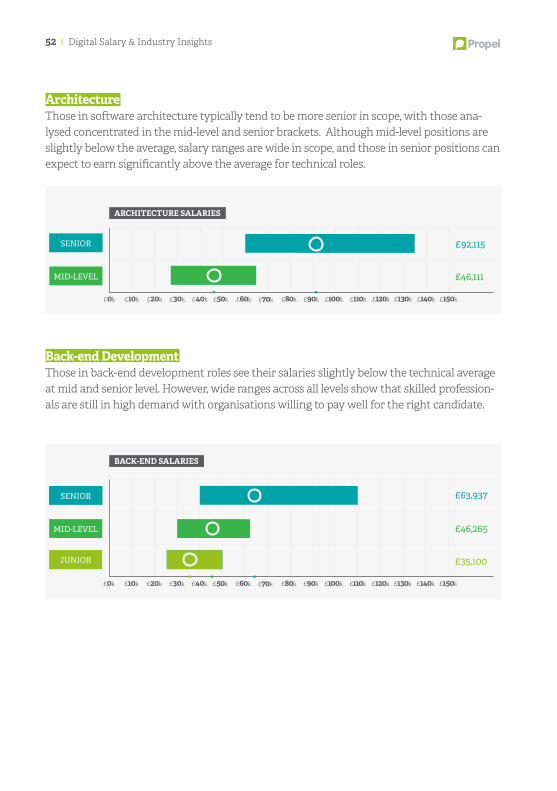
ArchitectureThose in software architecture typically tend to be more senior in scope, with those ana-lysed concentrated in the mid-level and senior brackets. Although mid-level positions are slightly below the average, salary ranges are wide in scope, and those in senior positions can expect to earn significantly above the average for technical roles.
Back-end DevelopmentThose in back-end development roles see their salaries slightly below the technical average at mid and senior level. However, wide ranges across all levels show that skilled profession-als are still in high demand with organisations willing to pay well for the right candidate.
£0k £10k £20k £30k £40k £50k £70k £80k £90k £100k £110k £120k £130k £140k
£92,115
£46,111
£150k£60k
ARCHITECTURE SALARIES
SENIOR
MID-LEVEL
£0k £10k £20k £30k £40k £50k £70k £80k £90k £100k £110k £120k £130k £140k
£46,265
£35,100
£63,937
£150k£60k
BACK-END SALARIES
SENIOR
MID-LEVEL
JUNIOR
Digital Salary & Industry Insights l 53
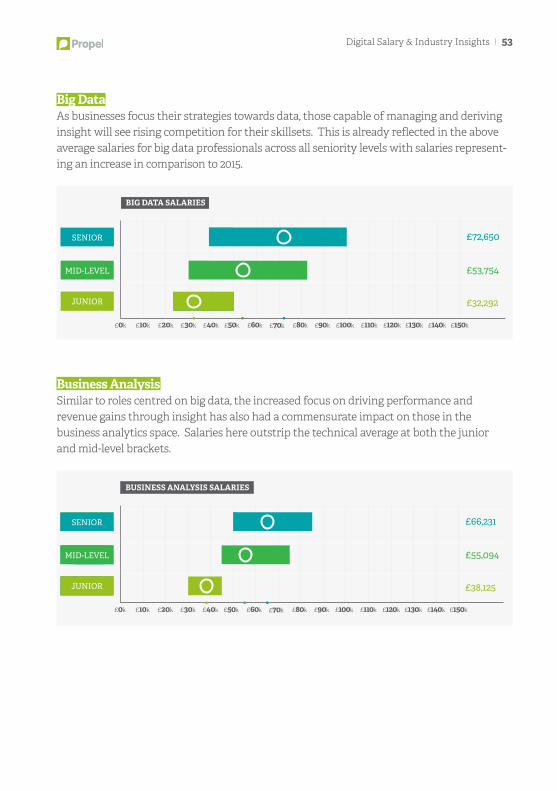
Big DataAs businesses focus their strategies towards data, those capable of managing and deriving insight will see rising competition for their skillsets. This is already reflected in the above average salaries for big data professionals across all seniority levels with salaries represent-ing an increase in comparison to 2015.
Business AnalysisSimilar to roles centred on big data, the increased focus on driving performance and revenue gains through insight has also had a commensurate impact on those in the business analytics space. Salaries here outstrip the technical average at both the junior and mid-level brackets.
£0k £10k £20k £30k £40k £50k £70k £80k £90k £100k £110k £120k £130k £140k
£53,754
£32,292
£72,650
£150k£60k
BIG DATA SALARIES
SENIOR
MID-LEVEL
JUNIOR
£0k
SENIOR
MID-LEVEL
JUNIOR
£10k £20k £30k £40k £50k £70k £80k £90k £100k £110k £120k £130k £140k
£55,094
£38,125
£66,231
£150k£60k
BUSINESS ANALYSIS SALARIES
SENIOR
MID-LEVEL
JUNIOR
54 l Digital Salary & Industry Insights
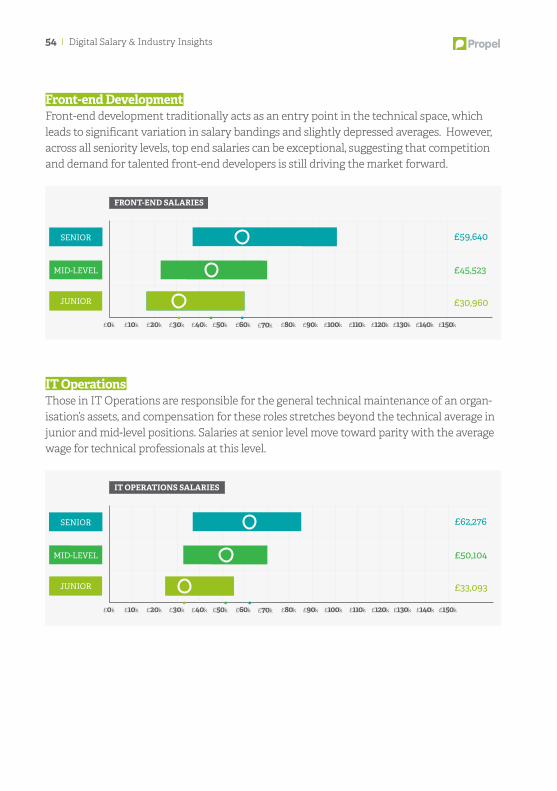
Front-end DevelopmentFront-end development traditionally acts as an entry point in the technical space, which leads to significant variation in salary bandings and slightly depressed averages. However, across all seniority levels, top end salaries can be exceptional, suggesting that competition and demand for talented front-end developers is still driving the market forward.
IT OperationsThose in IT Operations are responsible for the general technical maintenance of an organ-isation’s assets, and compensation for these roles stretches beyond the technical average in junior and mid-level positions. Salaries at senior level move toward parity with the average wage for technical professionals at this level.
£0k £10k £20k £30k £40k £50k £70k £80k £90k £100k £110k £120k £130k £140k
£45,523
£30,960
£59,640
£150k£60k
FRONT-END SALARIES
SENIOR
MID-LEVEL
JUNIOR
£0k £10k £20k £30k £40k £50k £70k £80k £90k £100k £110k £120k £130k £140k
£50,104
£33,093
£62,276
£150k£60k
IT OPERATIONS SALARIES
SENIOR
MID-LEVEL
JUNIOR
Digital Salary & Industry Insights l 55
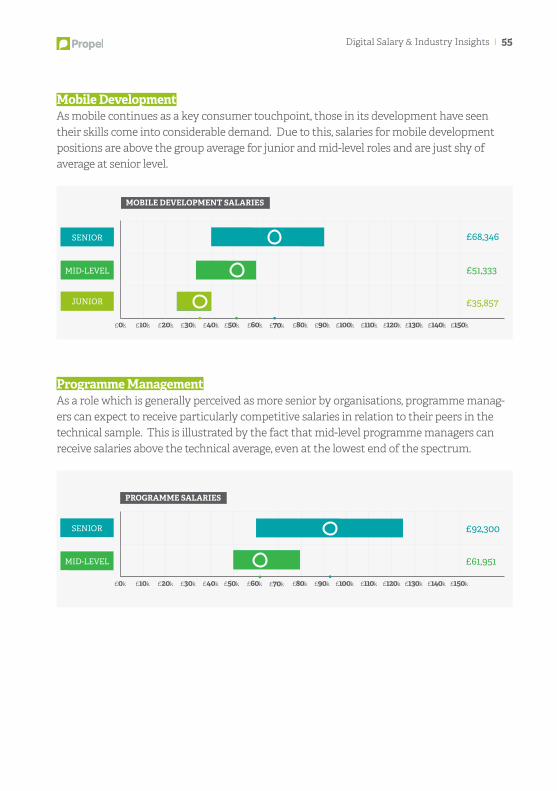
Mobile DevelopmentAs mobile continues as a key consumer touchpoint, those in its development have seen their skills come into considerable demand. Due to this, salaries for mobile development positions are above the group average for junior and mid-level roles and are just shy of average at senior level.
Programme ManagementAs a role which is generally perceived as more senior by organisations, programme manag-ers can expect to receive particularly competitive salaries in relation to their peers in the technical sample. This is illustrated by the fact that mid-level programme managers can receive salaries above the technical average, even at the lowest end of the spectrum.
£0k £10k £20k £30k £40k £50k £70k £80k £90k £100k £110k £120k £130k £140k
£51,333
£35,857
£68,346
£150k£60k
MOBILE DEVELOPMENT SALARIES
SENIOR
MID-LEVEL
JUNIOR
£0k £10k £20k £30k £40k £50k £70k £80k £90k £100k £110k £120k £130k £140k
£92,300
£61,951
£150k£60k
PROGRAMME SALARIES
SENIOR
MID-LEVEL
56 l Digital Salary & Industry Insights
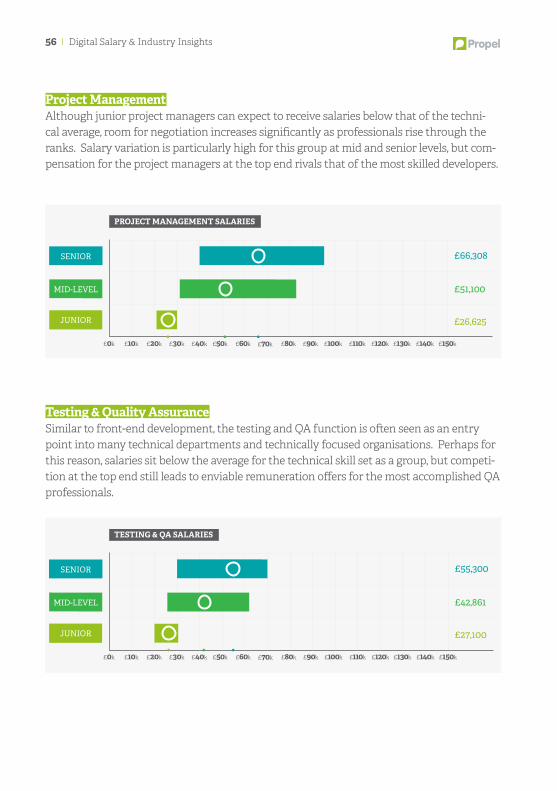
Project ManagementAlthough junior project managers can expect to receive salaries below that of the techni-cal average, room for negotiation increases significantly as professionals rise through the ranks. Salary variation is particularly high for this group at mid and senior levels, but com-pensation for the project managers at the top end rivals that of the most skilled developers.
Testing & Quality AssuranceSimilar to front-end development, the testing and QA function is often seen as an entry point into many technical departments and technically focused organisations. Perhaps for this reason, salaries sit below the average for the technical skill set as a group, but competi-tion at the top end still leads to enviable remuneration offers for the most accomplished QA professionals.
£0k £10k £20k £30k £40k £50k £70k £80k £90k £100k £110k £120k £130k £140k
£51,100
£26,625
£66,308
£150k£60k
PROJECT MANAGEMENT SALARIES
SENIOR
MID-LEVEL
JUNIOR
£0k £10k £20k £30k £40k £50k £70k £80k £90k £100k £110k £120k £130k £140k
£42,861
£27,100
£55,300
£150k£60k
TESTING & QA SALARIES
SENIOR
MID-LEVEL
JUNIOR
Section 5:
Creative
Creativity remains one of the strongest differentiators that any business can offer, with many of the world’s most notable companies driven by design and ingenuity. Those in our creative section are responsible for creating the spark that brings an idea to life.
The majority of those in our creative group have seen their salaries increase since 2015. Our Open Blend research suggests that younger creatives in particular (those in generation Z and millennials) feel that clearer career goals are a necessity.
58 l Digital Salary & Industry Insights
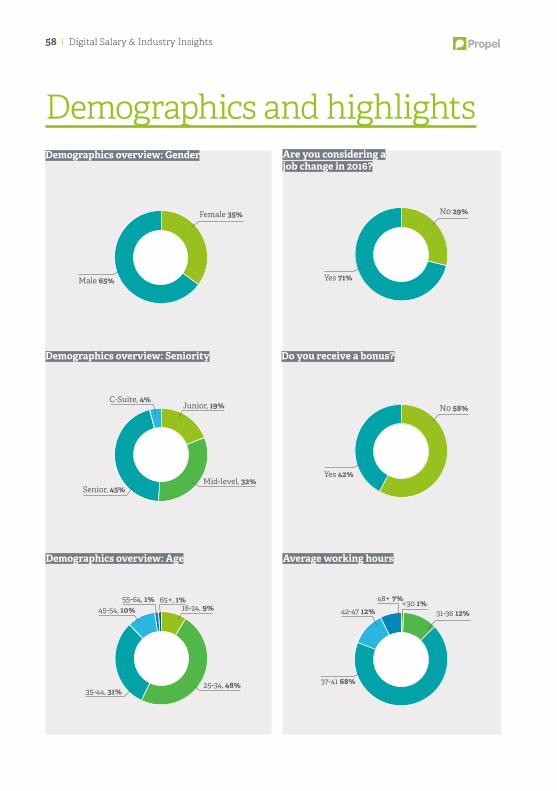
Demographics and highlights
N0 29%
Yes 71%
N0 58%
Yes 42%
31-36 12%<30 1%48+ 7%
42-47 12%
37-41 68%
Are you considering ajob change in 2016?
Do you receive a bonus?
Average working hours
Junior, 19%C-Suite, 4%
Mid-level, 32%Senior, 45%
18-24, 9%65+, 1%
45-54, 10%55-64, 1%
25-34, 48%35-44, 31%
Demographics overview: Gender
Demographics overview: Seniority
Demographics overview: Age
Female 35%
Male 65%
Digital Salary & Industry Insights l 59
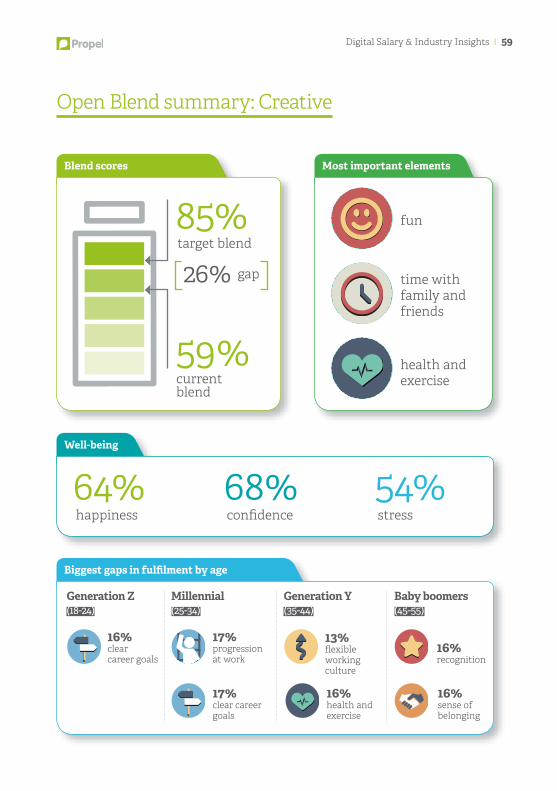
Most important elementsBlend scores
Biggest gaps in fulfilment by age
fun
target blend
time withfamily andfriends
26% gap
health andexercisecurrent
blend
59%
Well-being
happiness64%
confidence68%
stress54%
85%
Generation Z(18-24)
Millennial(25-34)
Generation Y (35-44)
Baby boomers(45-55)
16%clearcareer goals
17%progressionat work
13%flexibleworkingculture
16%recognition
17%clear careergoals
16%health andexercise
16%sense ofbelonging
Open Blend summary: Creative
60 l Digital Salary & Industry Insights
£40,000
£20,000
£60,000
£100,000
£80,000
£120,000
C-LevelSeniorMid-levelJunior
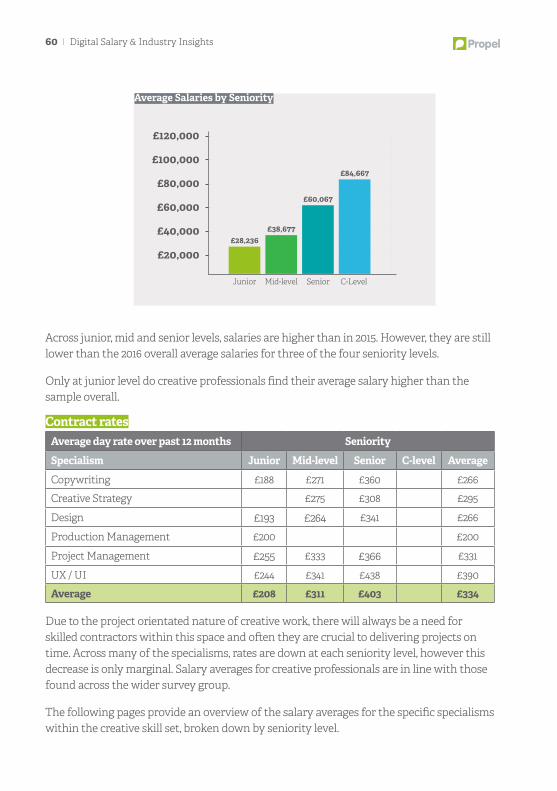
£28,236£38,677
£60,067
£84,667
Average Salaries by Seniority
Across junior, mid and senior levels, salaries are higher than in 2015. However, they are still lower than the 2016 overall average salaries for three of the four seniority levels.
Only at junior level do creative professionals find their average salary higher than the sample overall.
Contract ratesAverage day rate over past 12 months Seniority
Specialism Junior Mid-level Senior C-level Average
Copywriting £188 £271 £360 £266
Creative Strategy £275 £308 £295
Design £193 £264 £341 £266
Production Management £200 £200
Project Management £255 £333 £366 £331
UX / UI £244 £341 £438 £390
Average £208 £311 £403 £334
Due to the project orientated nature of creative work, there will always be a need for skilled contractors within this space and often they are crucial to delivering projects on time. Across many of the specialisms, rates are down at each seniority level, however this decrease is only marginal. Salary averages for creative professionals are in line with those found across the wider survey group.
The following pages provide an overview of the salary averages for the specific specialisms within the creative skill set, broken down by seniority level.
Digital Salary & Industry Insights l 61
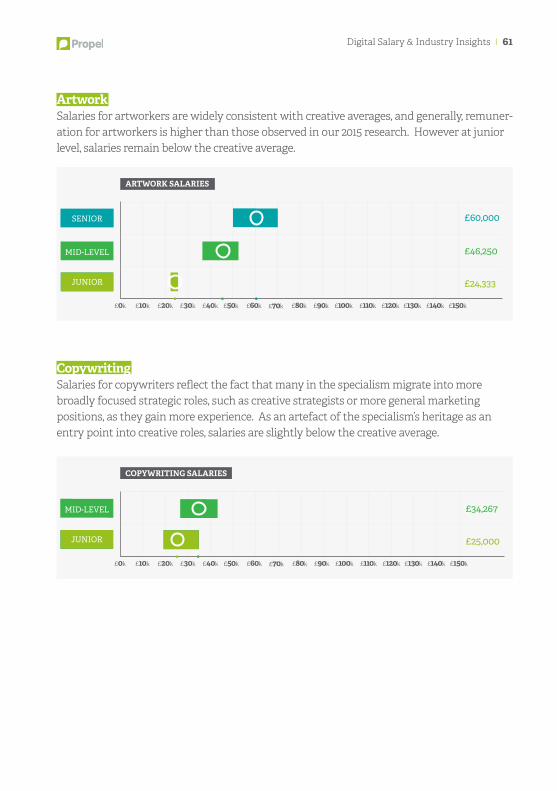
ArtworkSalaries for artworkers are widely consistent with creative averages, and generally, remuner-ation for artworkers is higher than those observed in our 2015 research. However at junior level, salaries remain below the creative average.Copywriting
CopywritingSalaries for copywriters reflect the fact that many in the specialism migrate into more broadly focused strategic roles, such as creative strategists or more general marketing positions, as they gain more experience. As an artefact of the specialism’s heritage as an entry point into creative roles, salaries are slightly below the creative average.
£0k
SENIOR
MID-LEVEL
JUNIOR
£10k £20k £30k £40k £50k £70k £80k £90k £100k £110k £120k £130k £140k
£46,250
£24,333
£60,000
£150k£60k
ARTWORK SALARIES
£0k £10k £20k £30k £40k £50k £70k £80k £90k £100k £110k £120k £130k £140k
£34,267
£25,000
£150k£60k
COPYWRITING SALARIES
MID-LEVEL
JUNIOR
62 l Digital Salary & Industry Insights
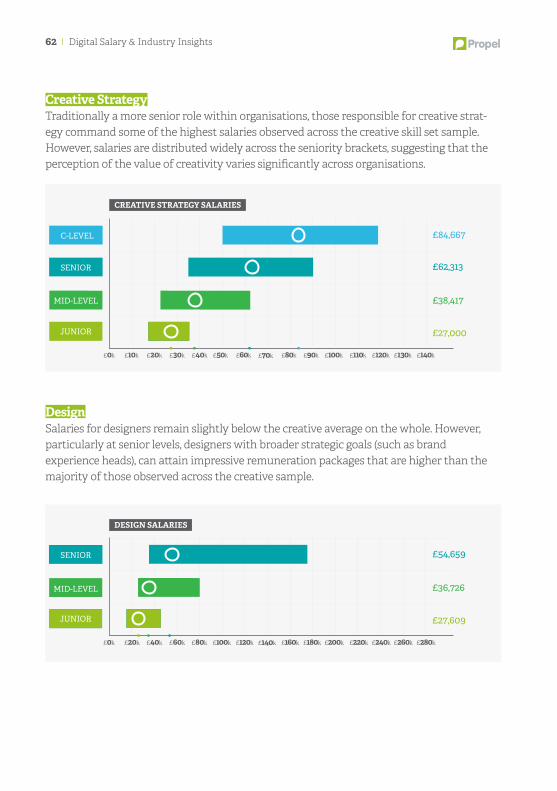
Creative StrategyTraditionally a more senior role within organisations, those responsible for creative strat-egy command some of the highest salaries observed across the creative skill set sample. However, salaries are distributed widely across the seniority brackets, suggesting that the perception of the value of creativity varies significantly across organisations.
DesignSalaries for designers remain slightly below the creative average on the whole. However, particularly at senior levels, designers with broader strategic goals (such as brand experience heads), can attain impressive remuneration packages that are higher than the majority of those observed across the creative sample.
£38,417
£27,000
£0k
£62,313
£10k £20k £30k £40k £50k £70k £80k £90k £100k £110k £120k £130k £140k£60k
£84,667
CREATIVE STRATEGY SALARIES
SENIOR
MID-LEVEL
JUNIOR
C-LEVEL
£36,726
£27,609
£0k
£54,659
£20k £40k £60k £80k £100k £140k £160k £180k £200k £220k £240k £260k £280k£120k
DESIGN SALARIES
SENIOR
MID-LEVEL
JUNIOR
Digital Salary & Industry Insights l 63
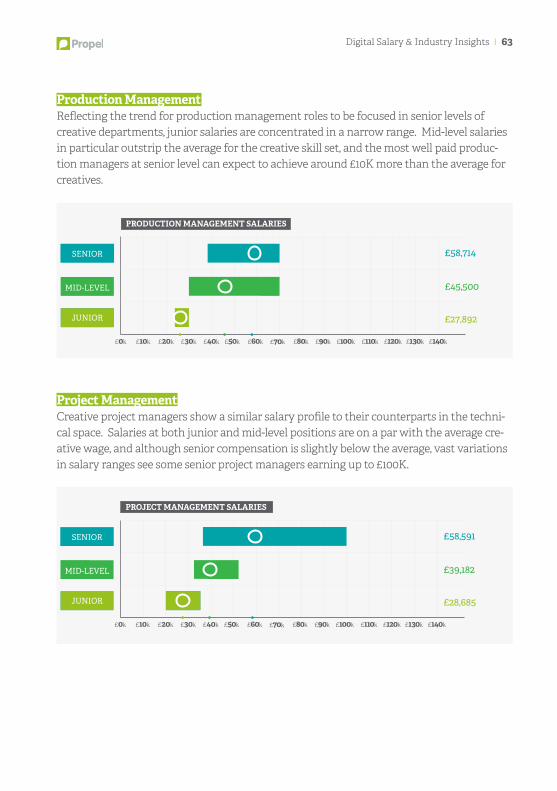
Production ManagementReflecting the trend for production management roles to be focused in senior levels of creative departments, junior salaries are concentrated in a narrow range. Mid-level salaries in particular outstrip the average for the creative skill set, and the most well paid produc-tion managers at senior level can expect to achieve around £10K more than the average for creatives.
Project ManagementCreative project managers show a similar salary profile to their counterparts in the techni-cal space. Salaries at both junior and mid-level positions are on a par with the average cre-ative wage, and although senior compensation is slightly below the average, vast variations in salary ranges see some senior project managers earning up to £100K.
£45,500
£27,892
£0k
£58,714
£10k £20k £30k £40k £50k £70k £80k £90k £100k £110k £120k £130k £140k£60k
PRODUCTION MANAGEMENT SALARIES
SENIOR
MID-LEVEL
JUNIOR
£39,182
£28,685
£0k
£58,591
£10k £20k £30k £40k £50k £70k £80k £90k £100k £110k £120k £130k £140k£60k
PROJECT MANAGEMENT SALARIES
SENIOR
MID-LEVEL
JUNIOR
64 l Digital Salary & Industry Insights
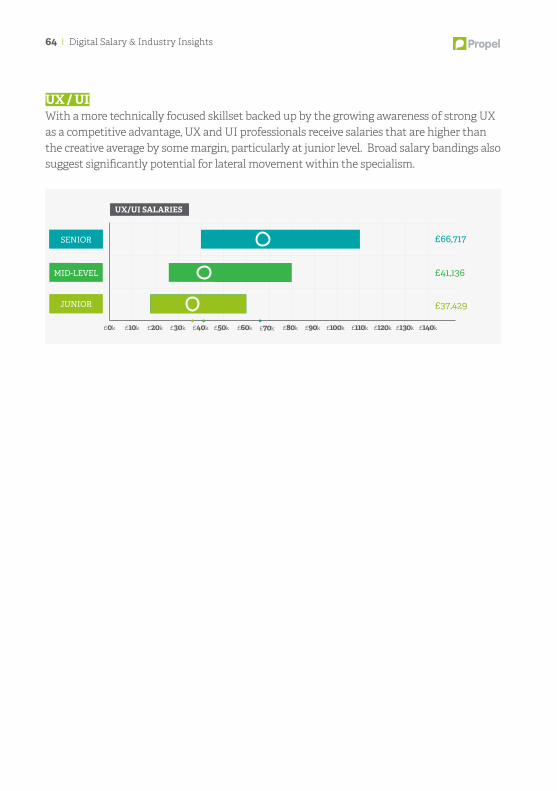
UX / UI With a more technically focused skillset backed up by the growing awareness of strong UX as a competitive advantage, UX and UI professionals receive salaries that are higher than the creative average by some margin, particularly at junior level. Broad salary bandings also suggest significantly potential for lateral movement within the specialism.
£41,136
£37,429
£0k
£66,717
£10k £20k £30k £40k £50k £70k £80k £90k £100k £110k £120k £130k £140k£60k
UX/UI SALARIES
SENIOR
MID-LEVEL
JUNIOR
Section 6:
BusinessOperations
The business operations professionals in our sample are theengines of their organisations. Responsible for core functionssuch as finance and human resources, they often sit in thebackground of their business. Few professions are moreessential for firms to function effectively however, with ourOpen Blend research alone emphasising the importance ofHR policy on employee retention.
Salaries sit close to the overall averages, rising slightly above at junior level. Fulfilment at work and progression wererecognised as key concerns for business operationsprofessionals, which shifts to a focus on a more positive and flexible working culture for older employees.
66 l Digital Salary & Industry Insights
Demographics and highlights
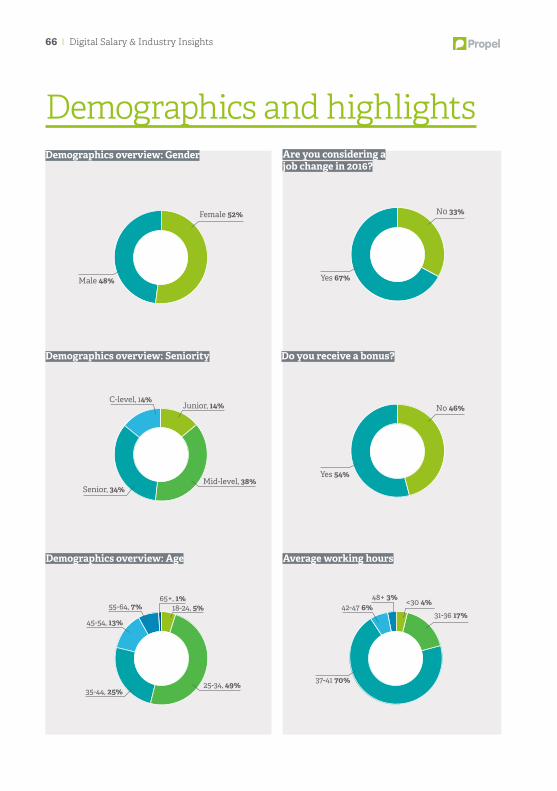
N0 33%
Yes 67%
No 46%
Yes 54%
31-36 17%<30 4%48+ 3%
42-47 6%
37-41 70%
Are you considering ajob change in 2016?
Do you receive a bonus?
Average working hours
Junior, 14%C-level, 14%
Mid-level, 38%Senior, 34%
18-24, 5%65+, 1%
45-54, 13%
55-64, 7%
25-34, 49%35-44, 25%
Demographics overview: Gender
Demographics overview: Seniority
Demographics overview: Age
Female 52%
Male 48%
Digital Salary & Industry Insights l 67
Open Blend summary: Business Operations
Most important elementsBlend scores
Biggest gaps in fulfilment by age
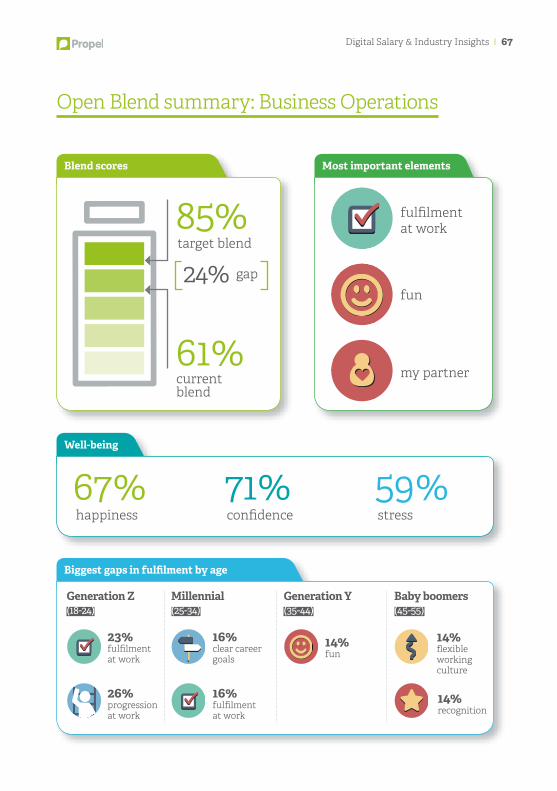
fulfilmentat work
target blend
fun24% gap
my partnercurrent blend
61%
Well-being
happiness67%
confidence71%
stress59%
85%
Generation Z(18-24)
Millennial(25-34)
Generation Y (35-44)
Baby boomers(45-55)
23%fulfilmentat work
16%clear careergoals
14%fun
14%flexible workingculture
26%progression at work
16%fulfilmentat work
14%recognition
68 l Digital Salary & Industry Insights
£40,000
£20,000
£60,000
£100,000
£80,000
£120,000
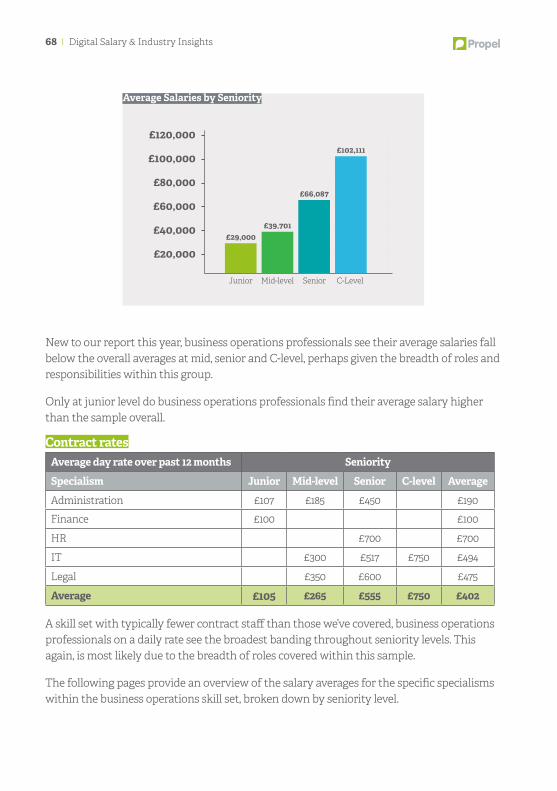
C-LevelSeniorMid-levelJunior
£29,000£39,701
£66,087
£102,111
Average Salaries by Seniority
New to our report this year, business operations professionals see their average salaries fall below the overall averages at mid, senior and C-level, perhaps given the breadth of roles and responsibilities within this group.
Only at junior level do business operations professionals find their average salary higher than the sample overall.
Contract ratesAverage day rate over past 12 months Seniority
Specialism Junior Mid-level Senior C-level Average
Administration £107 £185 £450 £190
Finance £100 £100
HR £700 £700
IT £300 £517 £750 £494
Legal £350 £600 £475
Average £105 £265 £555 £750 £402
A skill set with typically fewer contract staff than those we’ve covered, business operations professionals on a daily rate see the broadest banding throughout seniority levels. This again, is most likely due to the breadth of roles covered within this sample.
The following pages provide an overview of the salary averages for the specific specialisms within the business operations skill set, broken down by seniority level.
Digital Salary & Industry Insights l 69
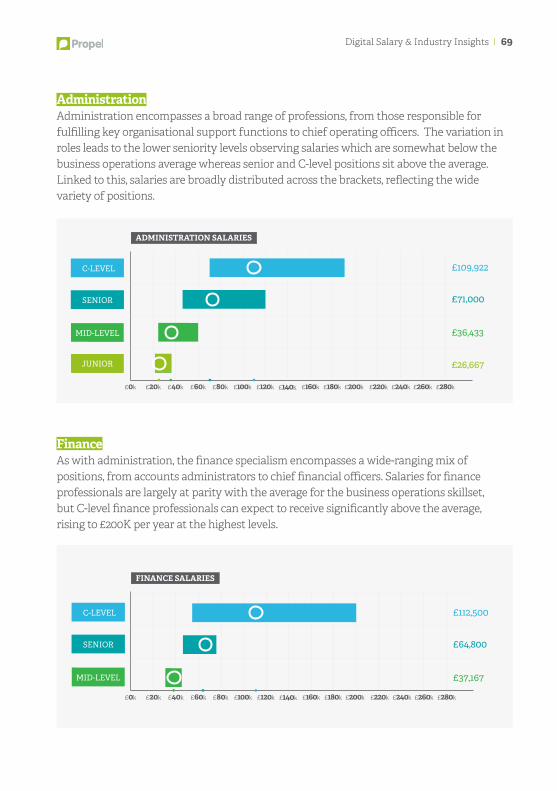
AdministrationAdministration encompasses a broad range of professions, from those responsible for fulfilling key organisational support functions to chief operating officers. The variation in roles leads to the lower seniority levels observing salaries which are somewhat below the business operations average whereas senior and C-level positions sit above the average. Linked to this, salaries are broadly distributed across the brackets, reflecting the wide variety of positions.
FinanceAs with administration, the finance specialism encompasses a wide-ranging mix of positions, from accounts administrators to chief financial officers. Salaries for finance professionals are largely at parity with the average for the business operations skillset, but C-level finance professionals can expect to receive significantly above the average, rising to £200K per year at the highest levels.
£36,433
£26,667
£0k
£71,000
£20k £40k £60k £80k £100k £140k £160k £180k £200k £220k £240k £260k £280k£120k
£109,922
ADMINISTRATION SALARIES
SENIOR
MID-LEVEL
JUNIOR
C-LEVEL
£37,167
£0k
£64,800
£20k £40k £60k £80k £100k £140k £160k £180k £200k £220k £240k £260k £280k£120k
£112,500
FINANCE SALARIES
SENIOR
MID-LEVEL
C-LEVEL
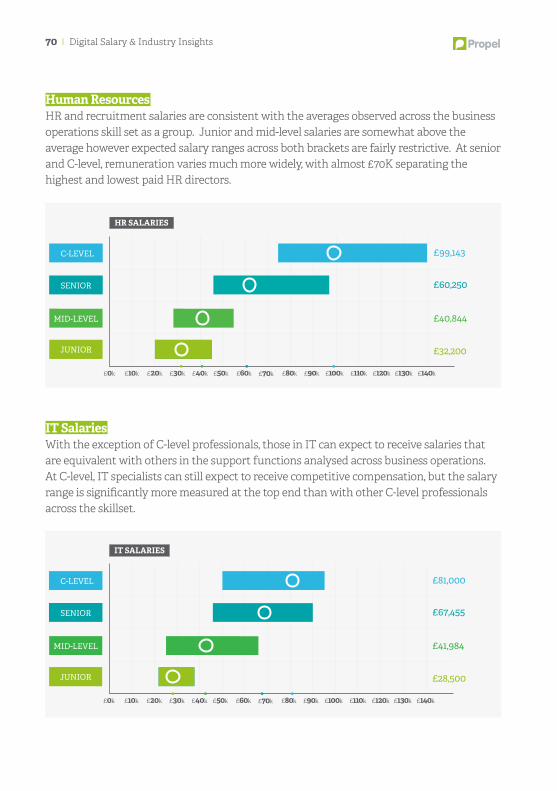
70 l Digital Salary & Industry Insights
Human ResourcesHR and recruitment salaries are consistent with the averages observed across the business operations skill set as a group. Junior and mid-level salaries are somewhat above the average however expected salary ranges across both brackets are fairly restrictive. At senior and C-level, remuneration varies much more widely, with almost £70K separating the highest and lowest paid HR directors.
IT SalariesWith the exception of C-level professionals, those in IT can expect to receive salaries that are equivalent with others in the support functions analysed across business operations. At C-level, IT specialists can still expect to receive competitive compensation, but the salary range is significantly more measured at the top end than with other C-level professionals across the skillset.
£40,844
£32,200
£0k
£60,250SENIOR
MID-LEVEL
JUNIOR
£10k £20k £30k £40k £50k £70k £80k £90k £100k £110k £120k £130k £140k£60k
£99,143C-LEVEL
HR SALARIES
£41,984
£28,500
£0k
£67,455
£10k £20k £30k £40k £50k £70k £80k £90k £100k £110k £120k £130k £140k£60k
£81,000
IT SALARIES
SENIOR
MID-LEVEL
JUNIOR
C-LEVEL
Our Digital Salary & Industry Insights report is an annual undertaking produced for the individuals who drive the global digital economy. We’ll be back in 2017 with our eighth edition, but in the meantime you can get in touch with any questions or queries on 0207 432 6340 or by emailing [email protected].
Propel London: Recruiters for the global digital economy Propel are the UK’s largest independent provider of permanent and contract recruitment services to the global digital economy, specialising in commercial, marketing, technical and creative talent.
The Drum is a global media platform and Europe’s largest marketing website.
Every day we share industry news from around the globe, and every fortnight, we showcase ‘world-changing’ marketing in our magazine.
Beyond our reporting remit, our ecosystem includes 23 awards, 7 live events, a peer-to-peer learning club, content marketing division, and video production and distribution service.
To find out more visit www.thedrum.com.
Open Blend Method is an online tool that simply enables effective communication between a leader and their individual team members.
Our software facilitates high impact coaching sessions that focus on an individual’s well-being and performance. At the heart of the software is our ‘Blend Tool’. Work life balance is outdate and Blend is its replacement.
Blend is our simple yet revolutionary methodology that highlights the reality that perfo-mance at work is impacted by life and life is impacted by work; in other words our work and lives are not separate, the blend. Get the blend right and performance improves.
To find out more visit openblendmethod.co.uk.
Thank you

propellondon.com0207 432 [email protected]