Embed Size (px)
Citation preview

2017
2001 2002 2003 2004 2005 2006 2007 2008 2009 2010 2011 2012 2013 2014 2015 20160
5,000
10,000
15,000
20,000
25,000
30,000
Texas Drilling Permits
Energy
2017
Dec-
89De
c-90
Dec-
91De
c-92
Dec-
93De
c-94
Dec-
95De
c-96
Dec-
97De
c-98
Dec-
99De
c-00
Dec-
01De
c-02
Dec-
03De
c-04
Dec-
05De
c-06
Dec-
07De
c-08
Dec-
09De
c-10
Dec-
11De
c-12
Dec-
13De
c-14
Dec-
15De
c-16
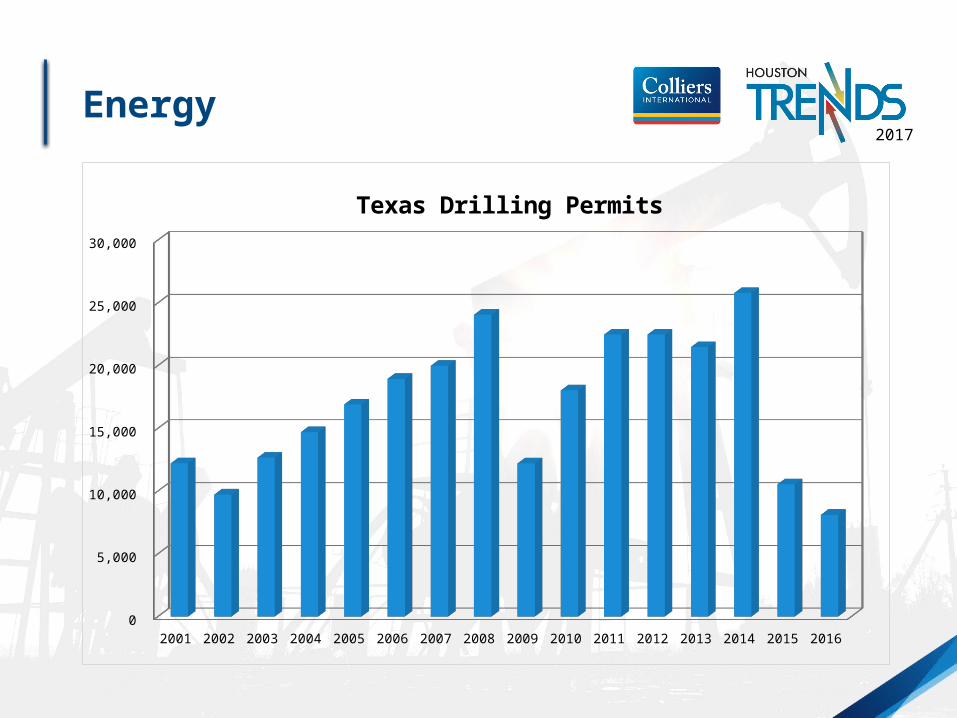
0
200
400
600
800
1,000
1,200
1,400
1,600
1,800
2,000
Rotary Rig Count
North America Texas
Energy
2017
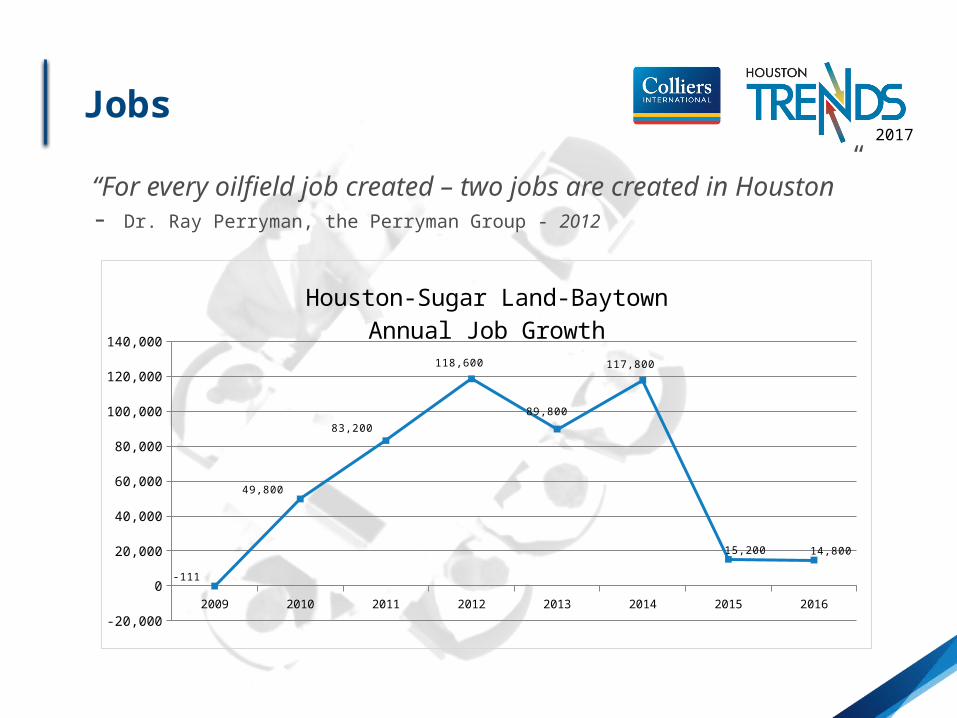
“For every oilfield job created – two jobs are created in Houston” - Dr. Ray Perryman, the Perryman Group - 2012
Jobs
2009 2010 2011 2012 2013 2014 2015 2016-20,000
0
20,000
40,000
60,000
80,000
100,000
120,000
140,000
-111
49,800
83,200
118,600
89,800
117,800
15,200 14,800
Houston-Sugar Land-BaytownAnnual Job Growth
2017
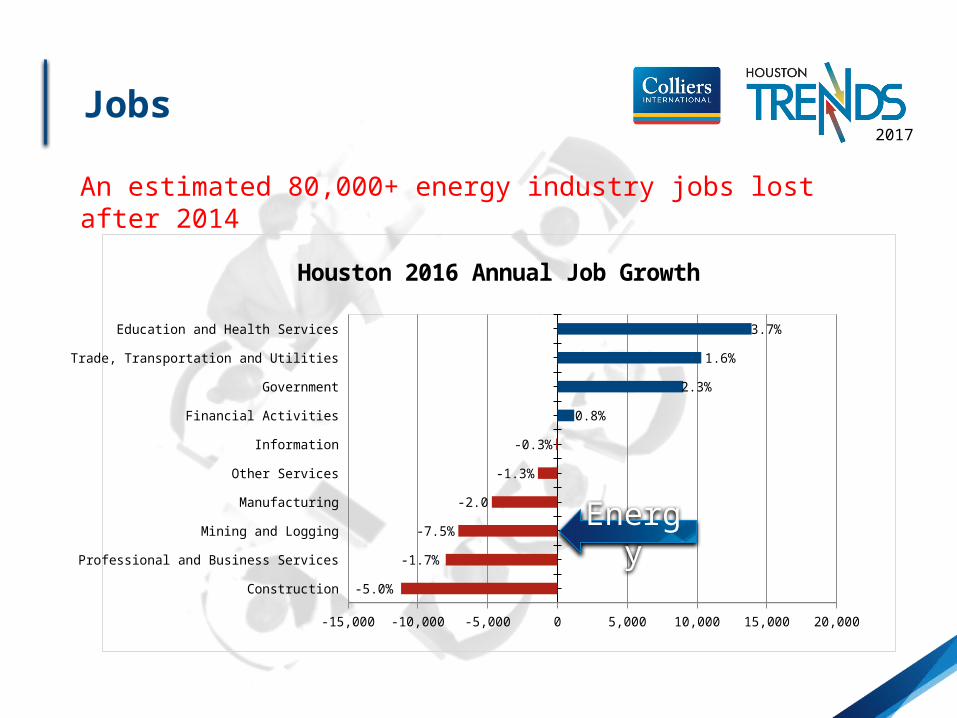
Construction
Professional and Business Services
Mining and Logging
Manufacturing
Other Services
Information
Financial Activities
Government
Trade, Transportation and Utilities
Education and Health Services
-15,000 -10,000 -5,000 0 5,000 10,000 15,000 20,000
-5.0%
-1.7%
-7.5%
-2.0
-1.3%
-0.3%
0.8%
2.3%
1.6%
3.7%
Houston 2016 Annual Job Growth
Energy
An estimated 80,000+ energy industry jobs lost after 2014
Jobs
2017
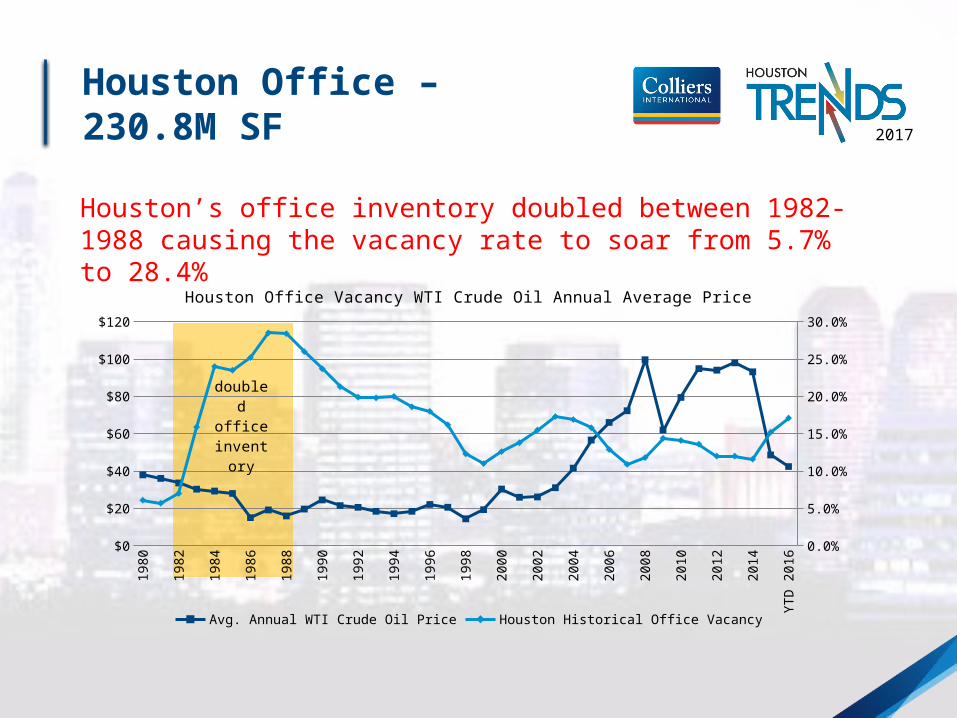
Houston Office – 230.8M SF
Houston’s office inventory doubled between 1982-1988 causing the vacancy rate to soar from 5.7% to 28.4%
1980
1981
1982
1983
1984
1985
1986
1987
1988
1989
1990
1991
1992
1993
1994
1995
1996
1997
1998
1999
2000
2001
2002
2003
2004
2005
2006
2007
2008
2009
2010
2011
2012
2013
2014
2015
YTD
2016
$0
$20
$40
$60
$80
$100
$120
0.0%
5.0%
10.0%
15.0%
20.0%
25.0%
30.0%
Houston Office Vacancy WTI Crude Oil Annual Average Price
Avg. Annual WTI Crude Oil Price Houston Historical Office Vacancy
doubled office in-ventory
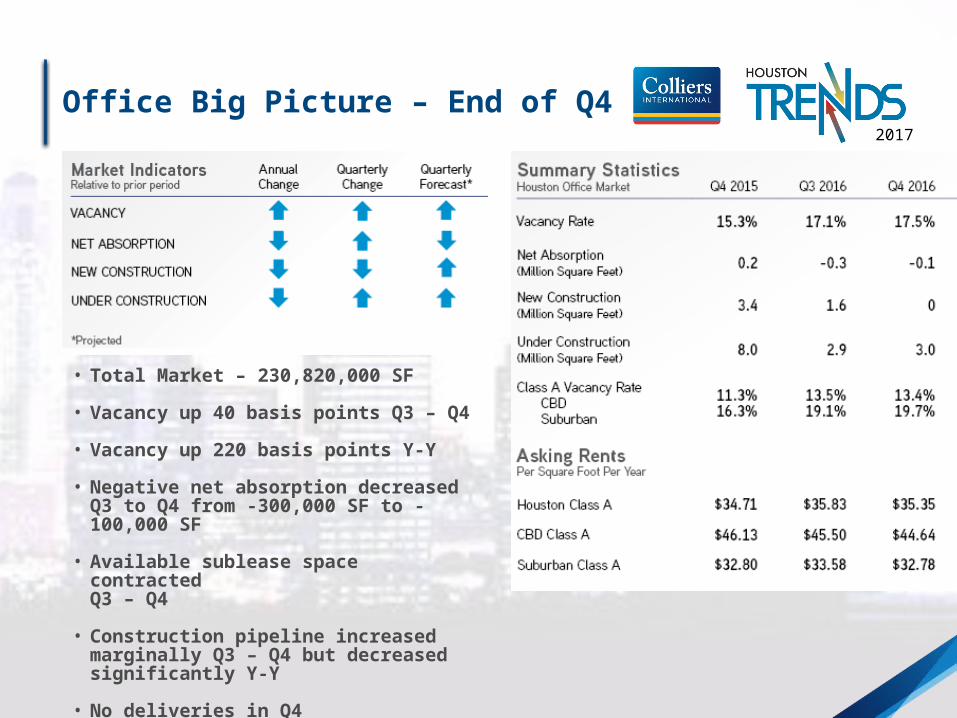
2017Office Big Picture – End of Q4
• Total Market – 230,820,000 SF• Vacancy up 40 basis points Q3 – Q4 • Vacancy up 220 basis points Y-Y• Negative net absorption decreased
Q3 to Q4 from -300,000 SF to -100,000 SF
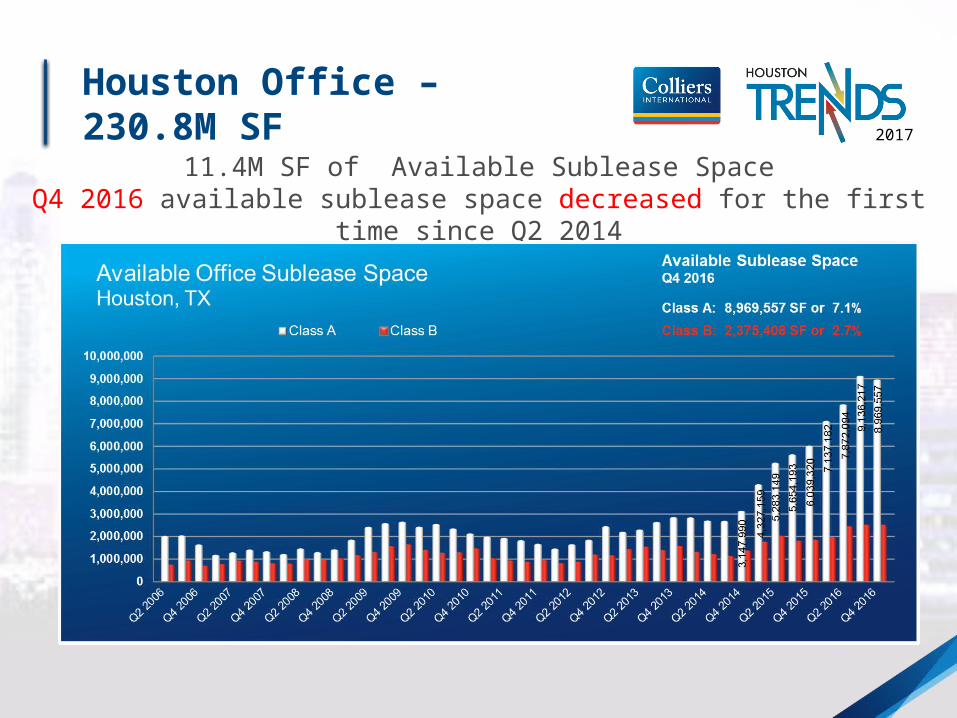
• Available sublease space contracted
Q3 – Q4• Construction pipeline increased
marginally Q3 – Q4 but decreased significantly Y-Y
• No deliveries in Q4
2017
Houston Office – 230.8M SF
11.4M SF of Available Sublease SpaceQ4 2016 available sublease space decreased for the first time since Q2 2014
2017Houston Office – 230.8M SF
Forecast
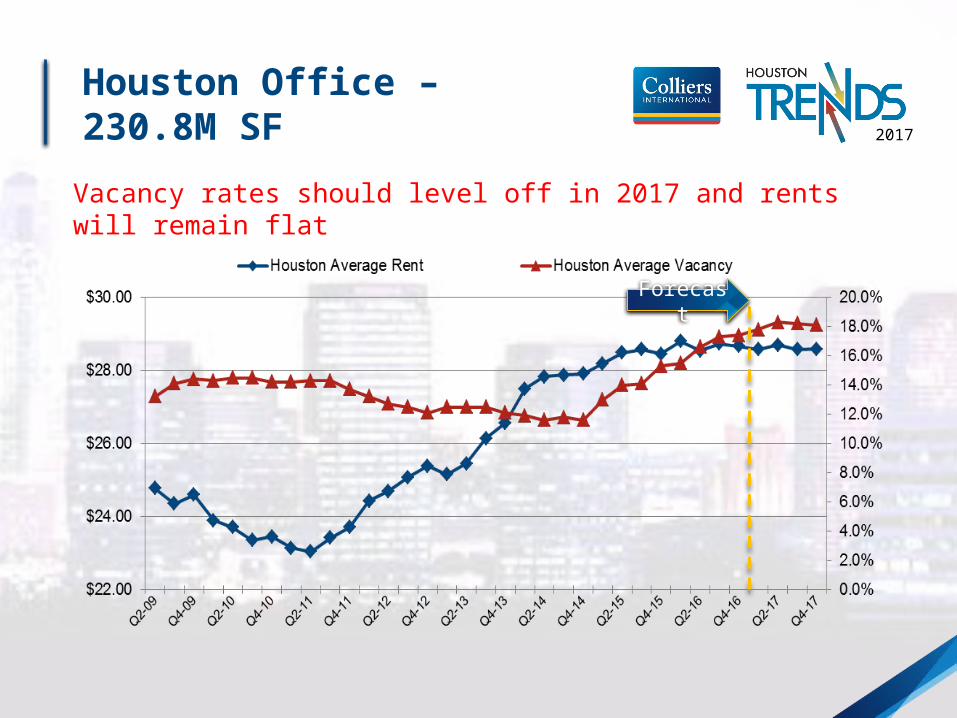
Vacancy rates should level off in 2017 and rents will remain flat
Confidential – Colliers International 2016
2017
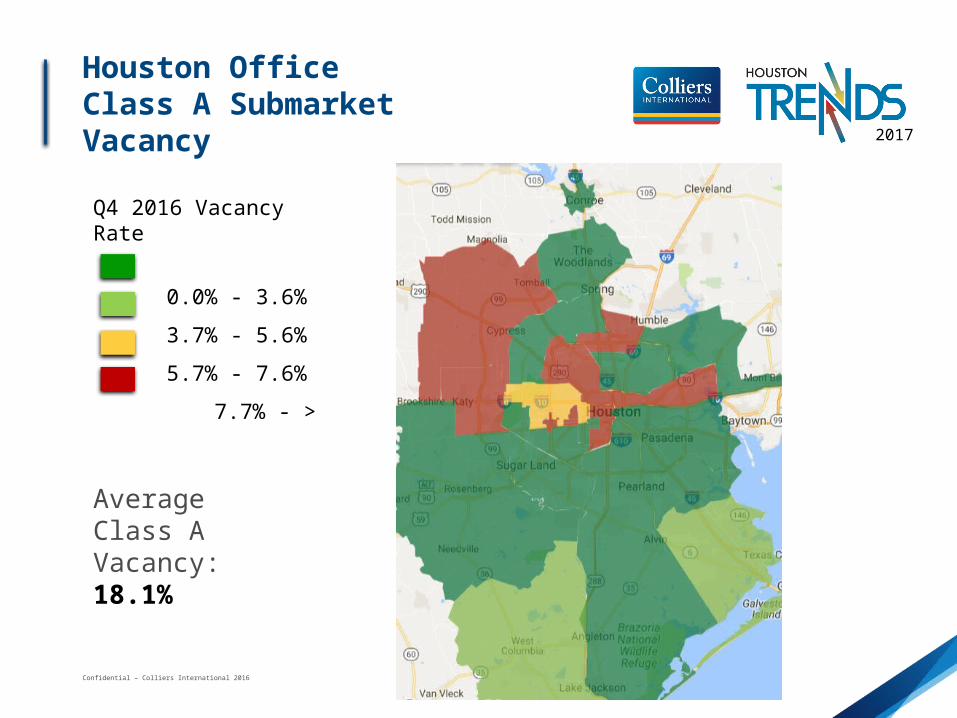
Average Class AVacancy: 18.1%
Houston OfficeClass A Submarket Vacancy
Q4 2016 Vacancy Rate
0.0% - 3.6%
3.7% - 5.6%
5.7% - 7.6%
7.7% - >
Confidential – Colliers International 2016
20172017
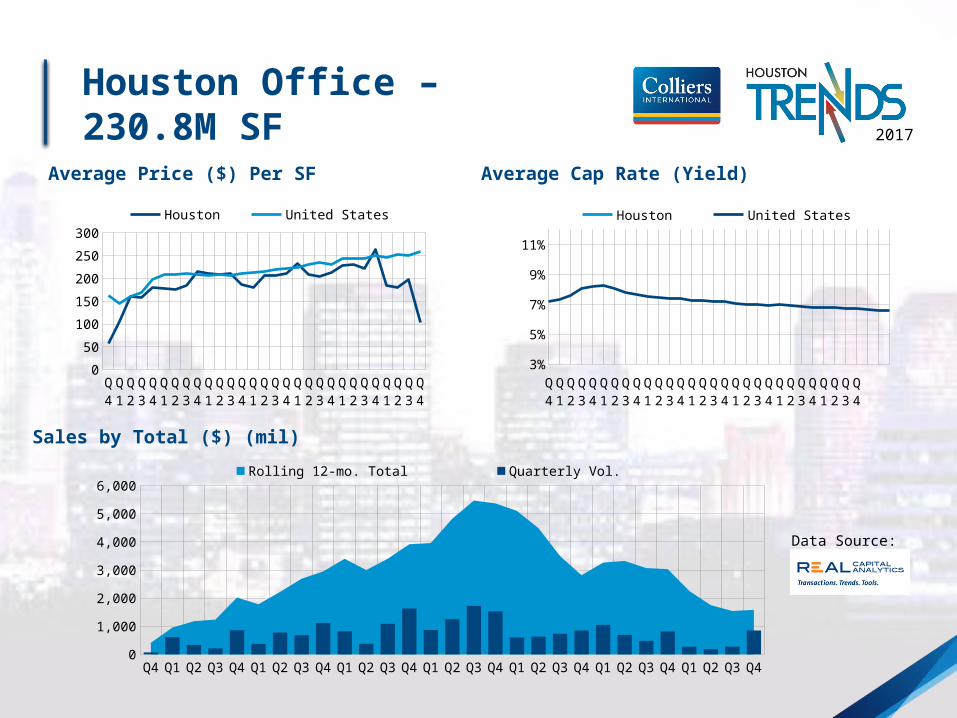
Average Cap Rate (Yield)Average Price ($) Per SF
Data Source:
Houston Office – 230.8M SF
Sales by Total ($) (mil)
Q4 '09
Q1 '10
Q2 '10
Q3 '10
Q4 '10
Q1 '11
Q2 '11
Q3 '11
Q4 '11
Q1 '12
Q2 '12
Q3 '12
Q4 '12
Q1 '13
Q2 '13
Q3 '13
Q4 '13
Q1 '14
Q2 '14
Q3 '14
Q4 '14
Q1 '15
Q2 '15
Q3 '15
Q4 '15
Q1 '16
Q2 '16
Q3 '16
Q4 '16
0
1,000
2,000
3,000
4,000
5,000
6,000Rolling 12-mo. Total Quarterly Vol.
Q4 '09
Q1 '10
Q2 '10
Q3 '10
Q4 '10
Q1 '11
Q2 '11
Q3 '11
Q4 '11
Q1 '12
Q2 '12
Q3 '12
Q4 '12
Q1 '13
Q2 '13
Q3 '13
Q4 '13
Q1 '14
Q2 '14
Q3 '14
Q4 '14
Q1 '15
Q2 '15
Q3 '15
Q4 '15
Q1 '16
Q2 '16
Q3 '16
Q4 '16
0
50
100
150
200
250
300Houston United States
Q4 '09
Q1 '10
Q2 '10
Q3 '10
Q4 '10
Q1 '11
Q2 '11
Q3 '11
Q4 '11
Q1 '12
Q2 '12
Q3 '12
Q4 '12
Q1 '13
Q2 '13
Q3 '13
Q4 '13
Q1 '14
Q2 '14
Q3 '14
Q4 '14
Q1 '15
Q2 '15
Q3 '15
Q4 '15
Q1 '16
Q2 '16
Q3 '16
Q4 '16
3%
5%
7%
9%
11%
Houston United States
Confidential – Colliers International 2016
20172017
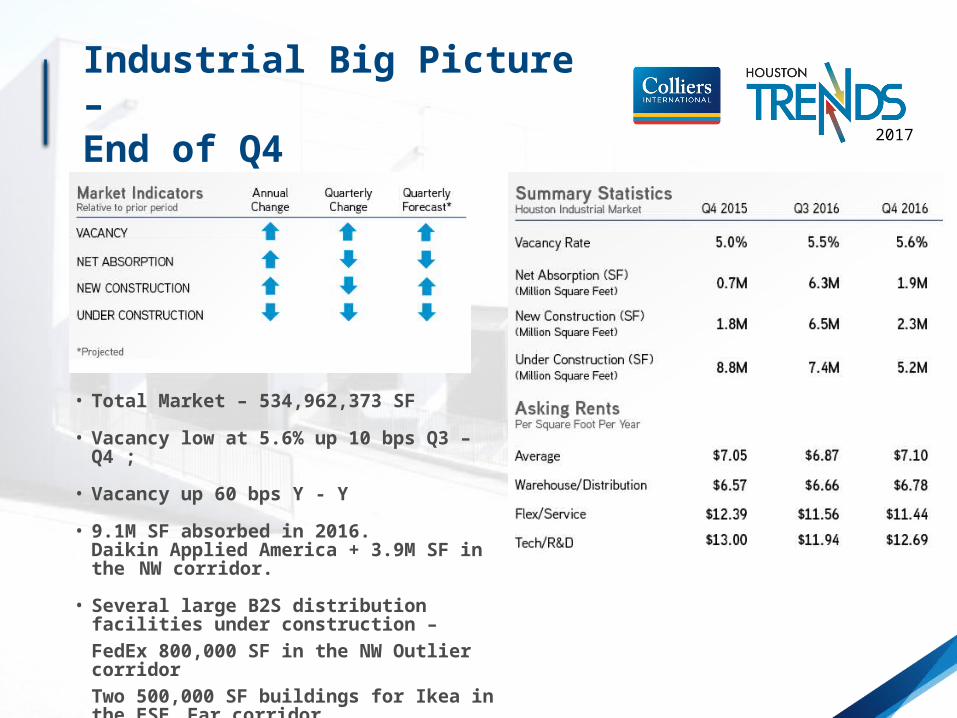
Industrial Big Picture – End of Q4
• Total Market – 534,962,373 SF• Vacancy low at 5.6% up 10 bps Q3 –
Q4 ; • Vacancy up 60 bps Y - Y• 9.1M SF absorbed in 2016.
Daikin Applied America + 3.9M SF in the NW corridor.
• Several large B2S distribution facilities under construction – FedEx 800,000 SF in the NW Outlier corridor
Two 500,000 SF buildings for Ikea in the ESE Far corridor.
Confidential – Colliers International 2016
20172017
Q2-09
Q4-09
Q2-10
Q4-10
Q2-11
Q4-11
Q2-12
Q4-12
Q2-13
Q4-13
Q2-14
Q4-14
Q2-15
Q4-15
Q2-16
Q4-16
Q2-17
Q4-17
$5.00
$5.50
$6.00
$6.50
$7.00
$7.50
2.0%
3.0%
4.0%
5.0%
6.0%
7.0%
8.0%
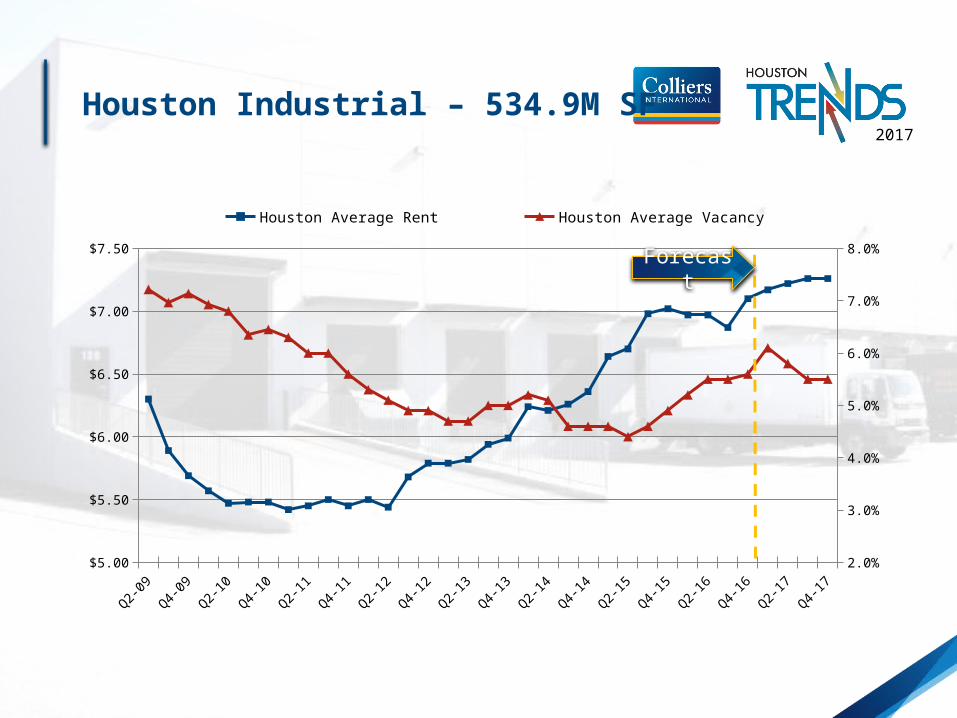
Houston Average Rent Houston Average Vacancy
Houston Industrial – 534.9M SF
Forecast
Confidential – Colliers International 2016
2017
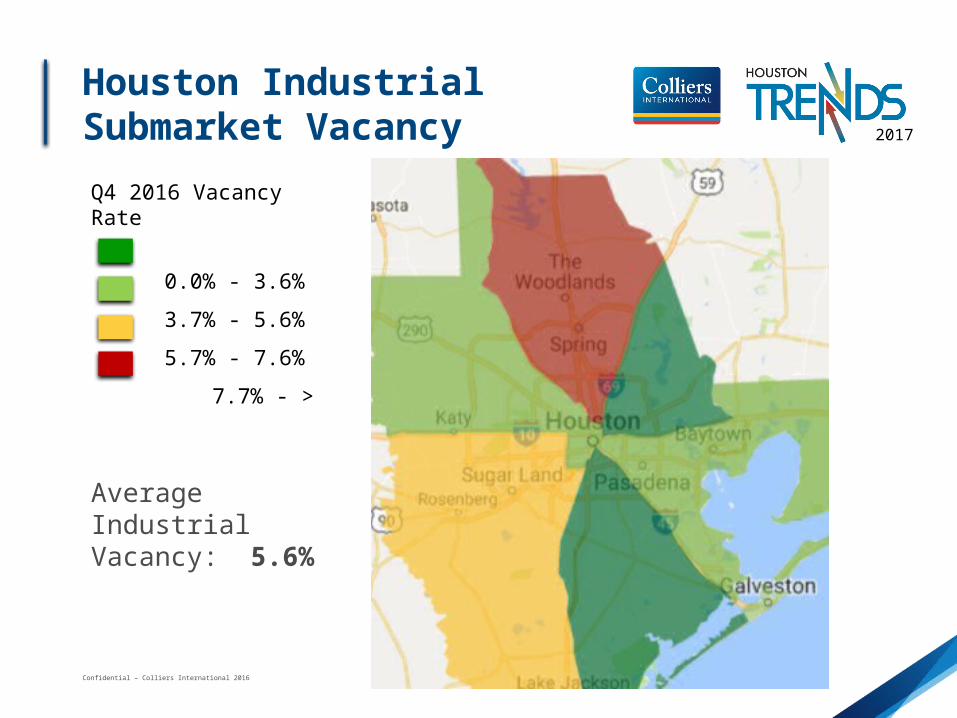
Average Industrial Vacancy: 5.6%
Houston IndustrialSubmarket VacancyQ4 2016 Vacancy Rate
0.0% - 3.6%
3.7% - 5.6%
5.7% - 7.6%
7.7% - >
Confidential – Colliers International 2016
20172017
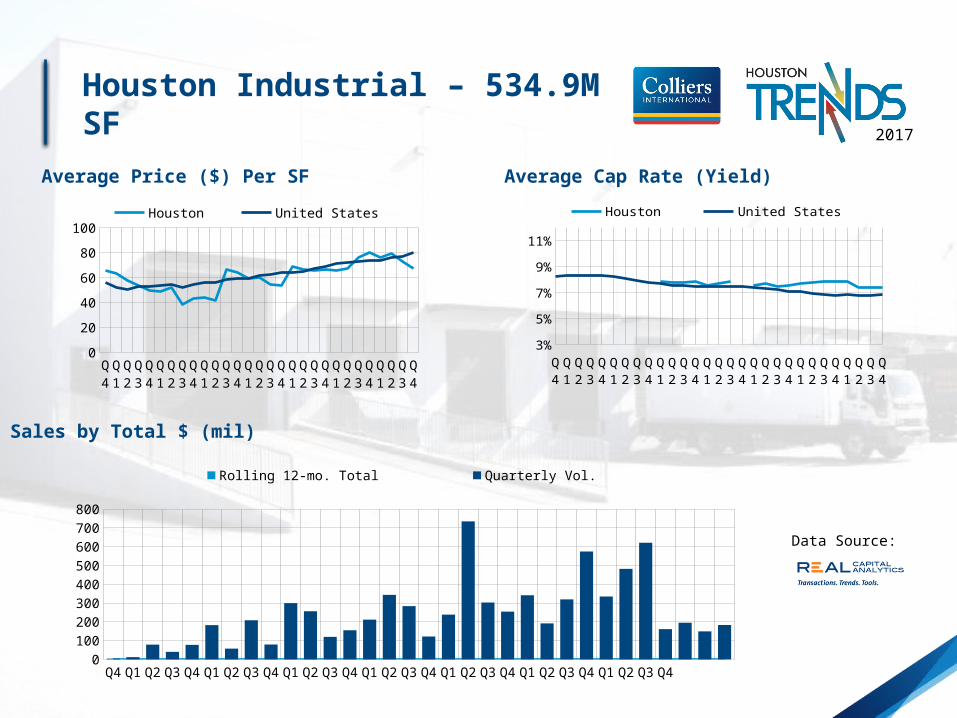
Sales by Total $ (mil)
Data Source:
Average Cap Rate (Yield)Average Price ($) Per SF
Houston Industrial – 534.9M SF
Q4 '09
Q1 '10
Q2 '10
Q3 '10
Q4 '10
Q1 '11
Q2 '11
Q3 '11
Q4 '11
Q1 '12
Q2 '12
Q3 '12
Q4 '12
Q1 '13
Q2 '13
Q3 '13
Q4 '13
Q1 '14
Q2 '14
Q3 '14
Q4 '14
Q1 '15
Q2 '15
Q3 '15
Q4 '15
Q1 '16
Q2 '16
Q3 '16
Q4 '16
0100200300400500600700800
Rolling 12-mo. Total Quarterly Vol.
Q4 '09
Q1 '10
Q2 '10
Q3 '10
Q4 '10
Q1 '11
Q2 '11
Q3 '11
Q4 '11
Q1 '12
Q2 '12
Q3 '12
Q4 '12
Q1 '13
Q2 '13
Q3 '13
Q4 '13
Q1 '14
Q2 '14
Q3 '14
Q4 '14
Q1 '15
Q2 '15
Q3 '15
Q4 '15
Q1 '16
Q2 '16
Q3 '16
Q4 '16
0
20
40
60
80
100Houston United States
Q4 '09
Q1 '10
Q2 '10
Q3 '10
Q4 '10
Q1 '11
Q2 '11
Q3 '11
Q4 '11
Q1 '12
Q2 '12
Q3 '12
Q4 '12
Q1 '13
Q2 '13
Q3 '13
Q4 '13
Q1 '14
Q2 '14
Q3 '14
Q4 '14
Q1 '15
Q2 '15
Q3 '15
Q4 '15
Q1 '16
Q2 '16
Q3 '16
Q4 '16
3%
5%
7%
9%
11%
Houston United States
Confidential – Colliers International 2016
20172017
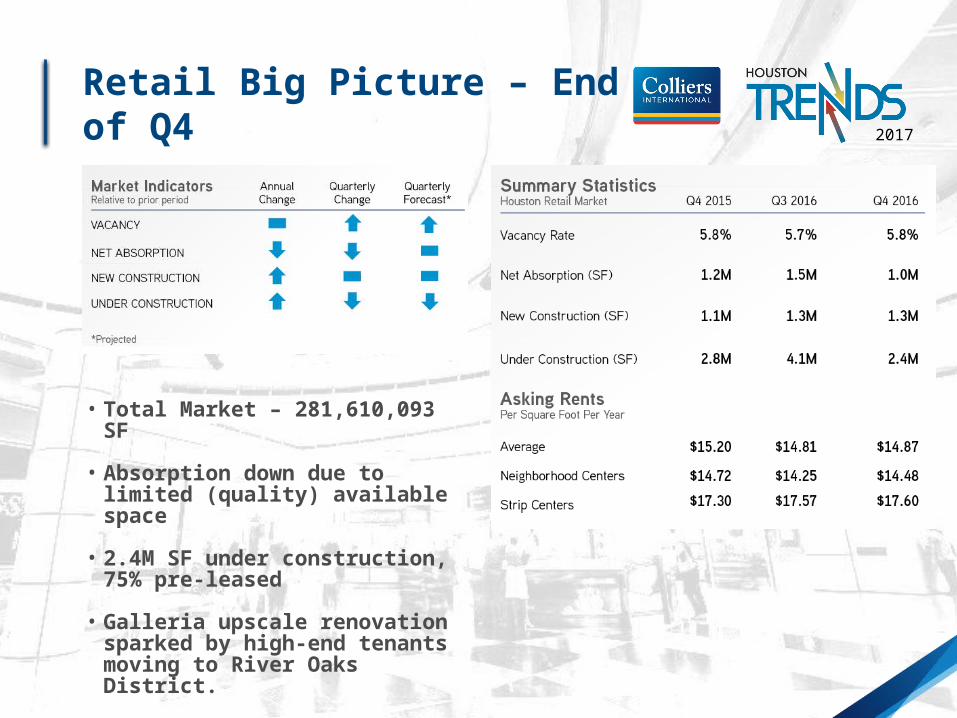
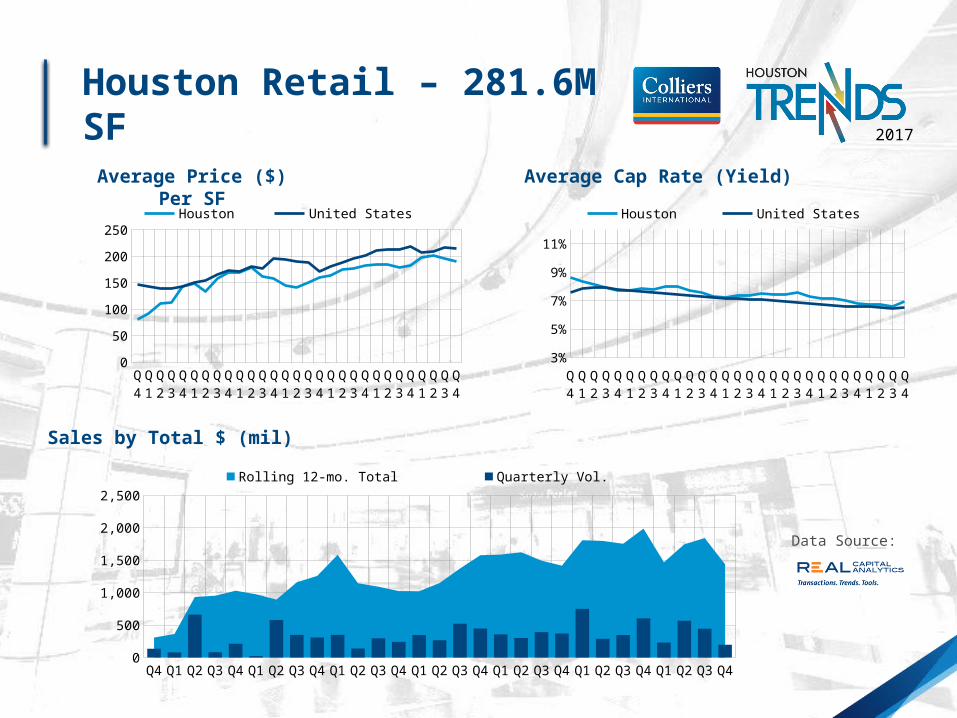
Retail Big Picture – End of Q4
• Total Market – 281,610,093 SF• Absorption down due to
limited (quality) available space
• 2.4M SF under construction, 75% pre-leased
• Galleria upscale renovation sparked by high-end tenants moving to River Oaks District.
Confidential – Colliers International 2016
20172017
Q1-09
Q3-09
Q1-10
Q3-10
Q1-11
Q3-11
Q1-12
Q3-12
Q1-13
Q3-13
Q1-14
Q3-14
Q1-15
Q3-15
Q1-16
Q3-16
Q1-17
Q3-17
0.00%
2.00%
4.00%
6.00%
8.00%
10.00%
12.00%
Houston Average Vacancy
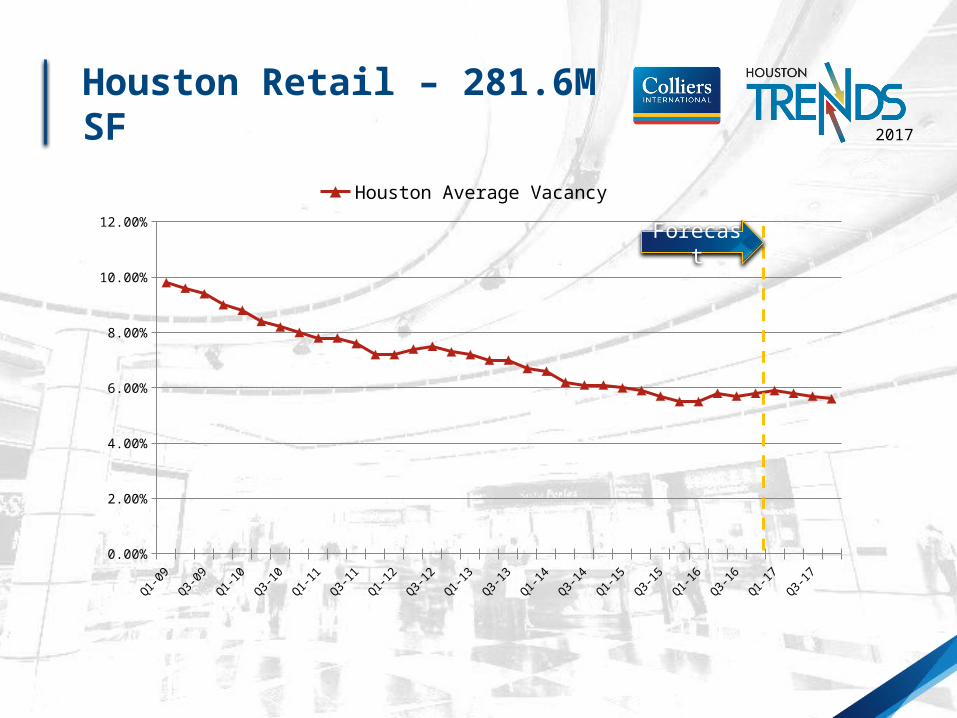
Houston Retail – 281.6M SF
Forecast
Confidential – Colliers International 2016
20172017
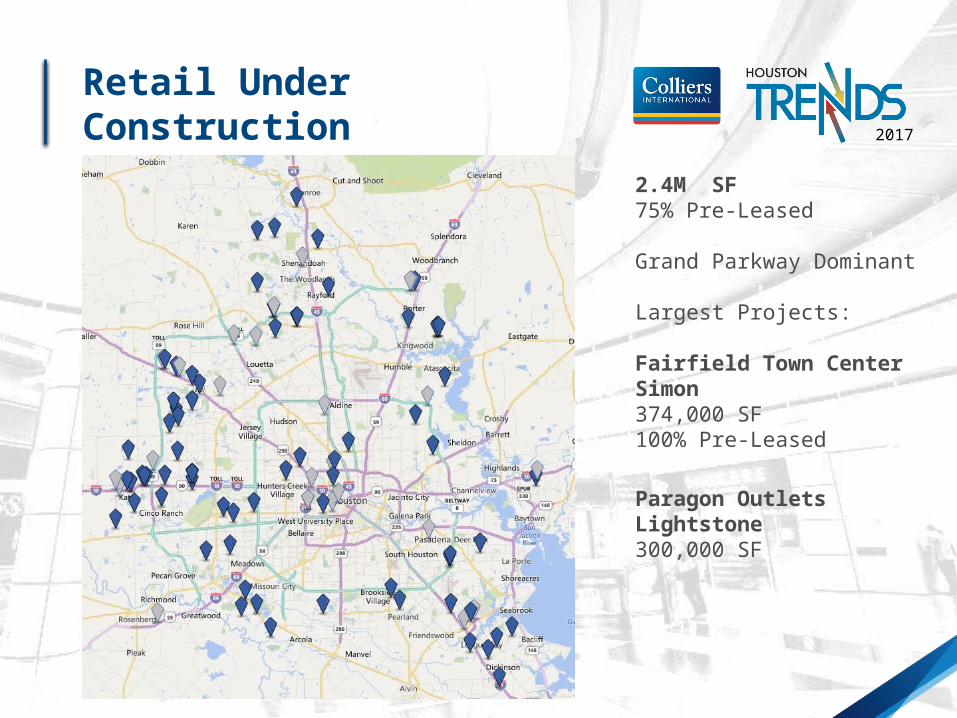
Retail Under Construction
2.4M SF 75% Pre-Leased
Grand Parkway Dominant
Largest Projects:
Fairfield Town CenterSimon374,000 SF100% Pre-Leased
Paragon OutletsLightstone300,000 SF
Confidential – Colliers International 2016
2017
Active Larger (Anchor) Tenants
Confidential – Colliers International 2016
20172017
Sales by Total $ (mil)
Average Cap Rate (Yield)Average Price ($) Per SF
Data Source:
Houston Retail – 281.6M SF
Q4 '09
Q1 '10
Q2 '10
Q3 '10
Q4 '10
Q1 '11
Q2 '11
Q3 '11
Q4 '11
Q1 '12
Q2 '12
Q3 '12
Q4 '12
Q1 '13
Q2 '13
Q3 '13
Q4 '13
Q1 '14
Q2 '14
Q3 '14
Q4 '14
Q1 '15
Q2 '15
Q3 '15
Q4 '15
Q1 '16
Q2 '16
Q3 '16
Q4 '16
0
500
1,000
1,500
2,000
2,500Rolling 12-mo. Total Quarterly Vol.
Q4 '09
Q1 '10
Q2 '10
Q3 '10
Q4 '10
Q1 '11
Q2 '11
Q3 '11
Q4 '11
Q1 '12
Q2 '12
Q3 '12
Q4 '12
Q1 '13
Q2 '13
Q3 '13
Q4 '13
Q1 '14
Q2 '14
Q3 '14
Q4 '14
Q1 '15
Q2 '15
Q3 '15
Q4 '15
Q1 '16
Q2 '16
Q3 '16
Q4 '16
0
50
100
150
200
250Houston United States
Q4 '09
Q1 '10
Q2 '10
Q3 '10
Q4 '10
Q1 '11
Q2 '11
Q3 '11
Q4 '11
Q1 '12
Q2 '12
Q3 '12
Q4 '12
Q1 '13
Q2 '13
Q3 '13
Q4 '13
Q1 '14
Q2 '14
Q3 '14
Q4 '14
Q1 '15
Q2 '15
Q3 '15
Q4 '15
Q1 '16
Q2 '16
Q3 '16
Q4 '16
3%
5%
7%
9%
11%
Houston United States
Confidential – Colliers International 2016
20172017
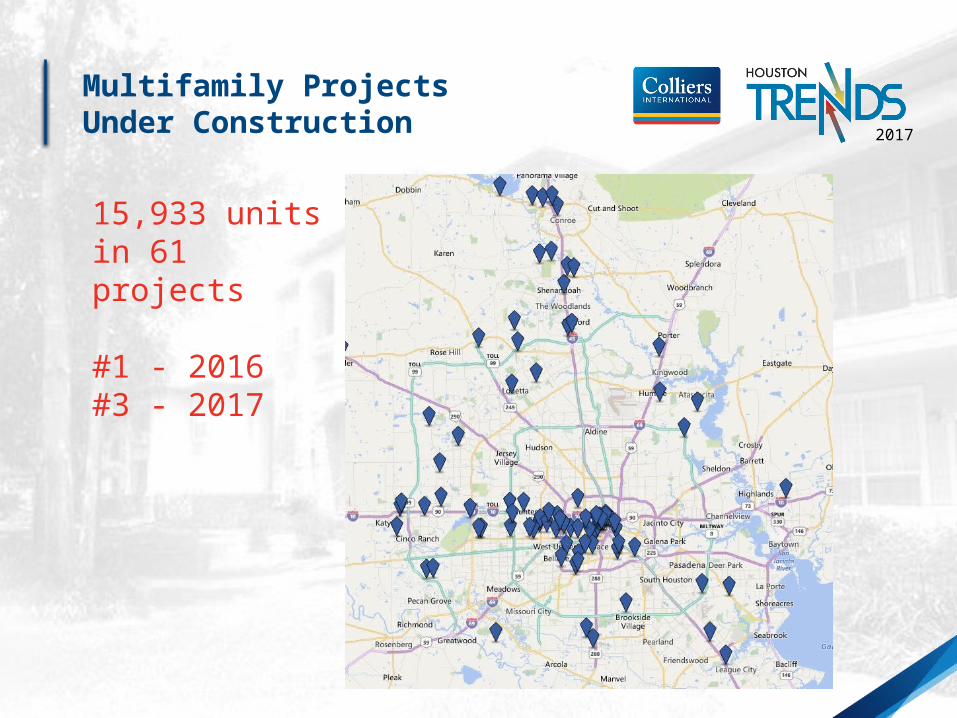
Multifamily Projects Under Construction
15,933 units in 61 projects
#1 - 2016#3 - 2017
Confidential – Colliers International 2016
20172017
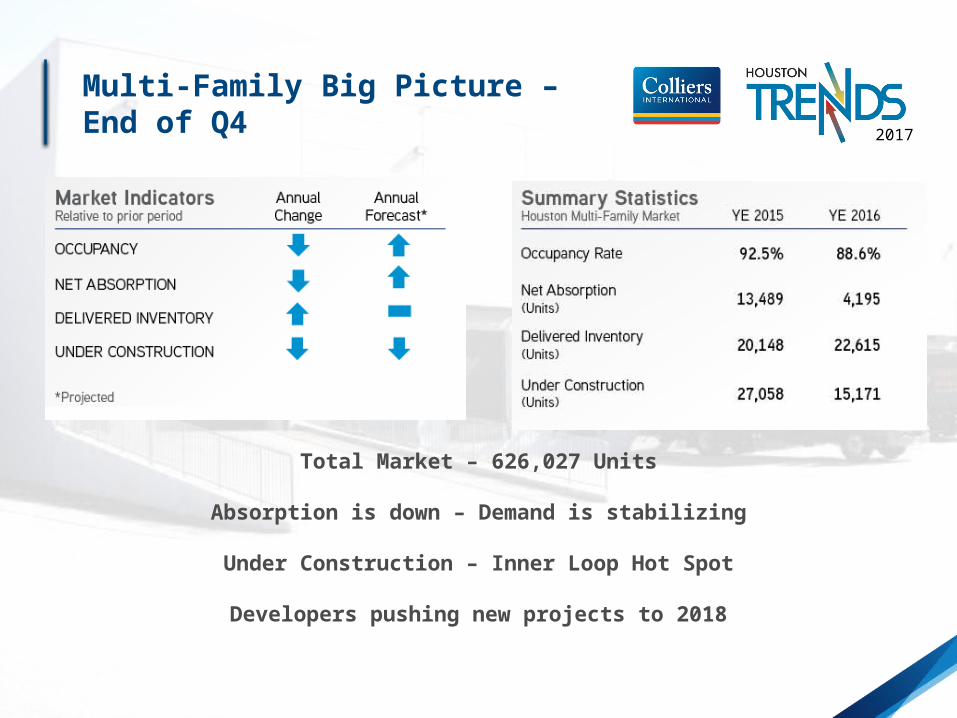
Multi-Family Big Picture – End of Q4
Total Market – 626,027 Units
Absorption is down – Demand is stabilizing
Under Construction – Inner Loop Hot Spot
Developers pushing new projects to 2018
Confidential – Colliers International 2016
20172017
2006
2007
2008
2009
2010
2011
2012
2013
2014
2015
2016
2017
$600
$700
$800
$900
$1,000
80.0%
85.0%
90.0%
95.0%
100.0%
Houston Average Rent Houston Average Occupancy
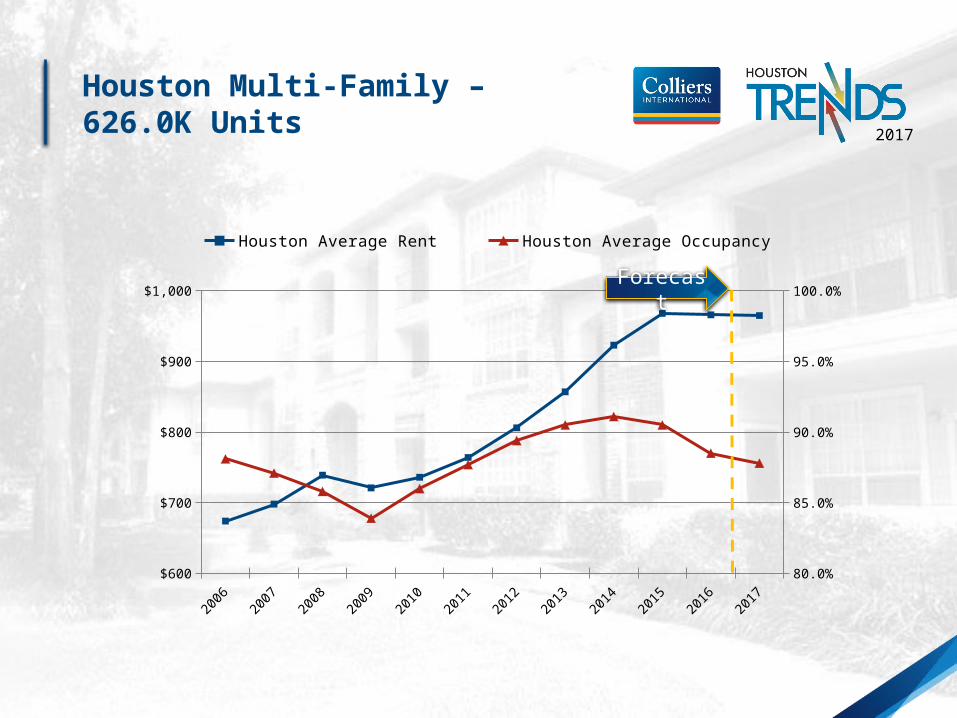
Houston Multi-Family – 626.0K Units
Forecast
Confidential – Colliers International 2016
20172017
Data Source:
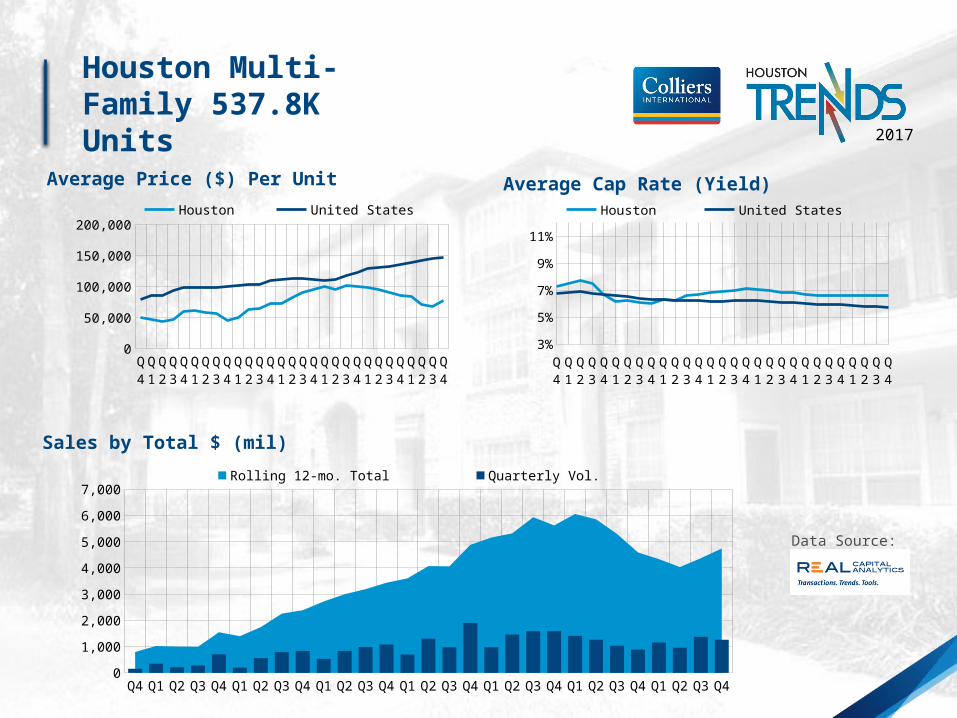
Average Cap Rate (Yield)Average Price ($) Per Unit
Sales by Total $ (mil)
Houston Multi-Family 537.8K Units
Q4 '09
Q1 '10
Q2 '10
Q3 '10
Q4 '10
Q1 '11
Q2 '11
Q3 '11
Q4 '11
Q1 '12
Q2 '12
Q3 '12
Q4 '12
Q1 '13
Q2 '13
Q3 '13
Q4 '13
Q1 '14
Q2 '14
Q3 '14
Q4 '14
Q1 '15
Q2 '15
Q3 '15
Q4 '15
Q1 '16
Q2 '16
Q3 '16
Q4 '16
0
1,000
2,000
3,000
4,000
5,000
6,000
7,000Rolling 12-mo. Total Quarterly Vol.
Q4 '09
Q1 '10
Q2 '10
Q3 '10
Q4 '10
Q1 '11
Q2 '11
Q3 '11
Q4 '11
Q1 '12
Q2 '12
Q3 '12
Q4 '12
Q1 '13
Q2 '13
Q3 '13
Q4 '13
Q1 '14
Q2 '14
Q3 '14
Q4 '14
Q1 '15
Q2 '15
Q3 '15
Q4 '15
Q1 '16
Q2 '16
Q3 '16
Q4 '16
020,00040,00060,00080,000
100,000120,000140,000160,000
Houston United States
Q4 '09
Q1 '10
Q2 '10
Q3 '10
Q4 '10
Q1 '11
Q2 '11
Q3 '11
Q4 '11
Q1 '12
Q2 '12
Q3 '12
Q4 '12
Q1 '13
Q2 '13
Q3 '13
Q4 '13
Q1 '14
Q2 '14
Q3 '14
Q4 '14
Q1 '15
Q2 '15
Q3 '15
Q4 '15
Q1 '16
Q2 '16
Q3 '16
Q4 '16
3%
5%
7%
9%
11%
Houston United States
Confidential – Colliers International 2016
20172017• Consultants back log continues to dwindle.
• Some firms are branching out supporting markets outside Houston while others are supplementing national account requirements with local personnel.
• The general contracting community chasing new markets to supplement the lack of new ground up projects as well as the tenant improvement sector.
• Sublease office tenant improvement market has limited significant construction allowances.
• Residential construction continues to thrive in “premium” locations. Medical and retail have not been adversely affected by the current downturn.
• The number of proposals received in individual trades has increased, pointing to increased interest in upcoming work.
• Companies are looking to trim costs without affecting production. This has not translated to any significant decrease in recognized cost.
• Long lead delivery times for critical path material and equipment continues to drive completion dates.
Construction Comments
Confidential – Colliers International 2016
2017
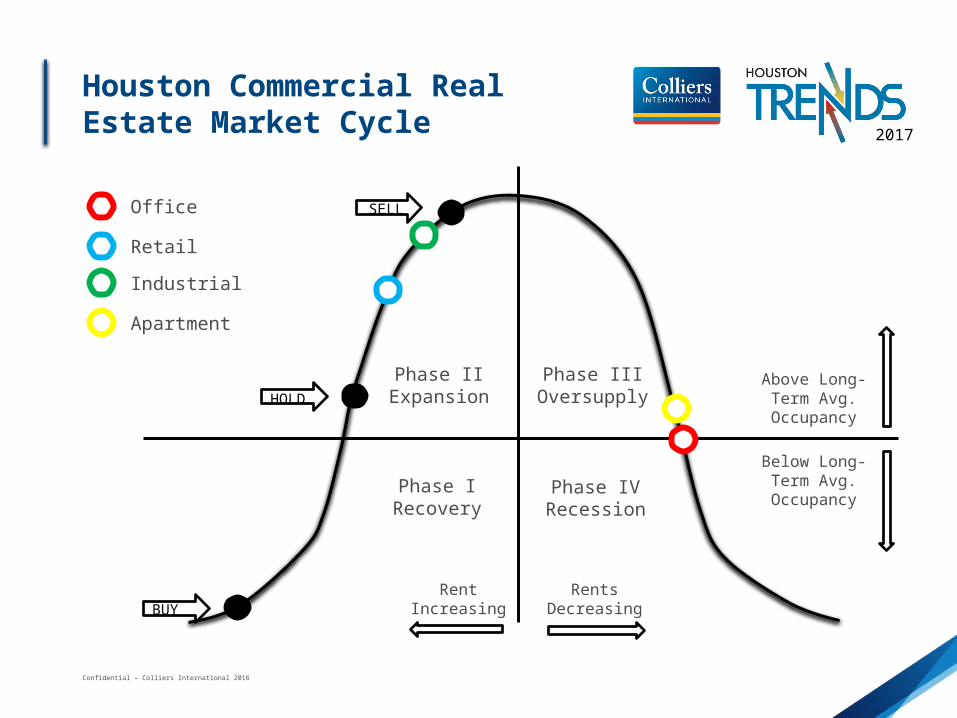
Office
Retail
Industrial
Apartment
Phase IRecovery
Phase IIExpansion
Phase IVRecession
Phase IIIOversupply
Rent Increasing
Rents Decreasing
Above Long-Term Avg.
Occupancy
Below Long-Term Avg. Occupancy
SELL
HOLD
BUY
Houston Commercial Real Estate Market Cycle

Thank you, have a great 2017.