Embed Size (px)
Citation preview
G r o u p o f H o t e l s
The Watergate Group of Hotels
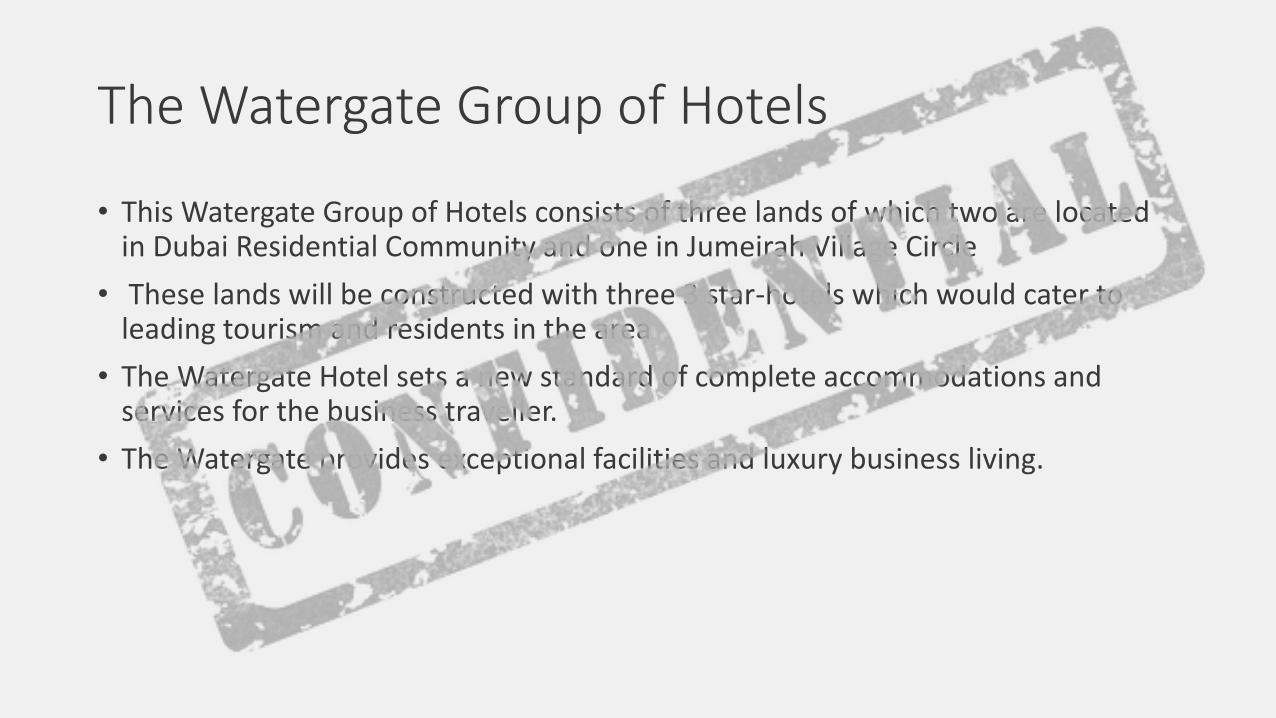
• This Watergate Group of Hotels consists of three lands of which two are located in Dubai Residential Community and one in Jumeirah Village Circle
• These lands will be constructed with three 3 star-hotels which would cater to leading tourism and residents in the area
• The Watergate Hotel sets a new standard of complete accommodations and services for the business traveller.
• The Watergate provides exceptional facilities and luxury business living.
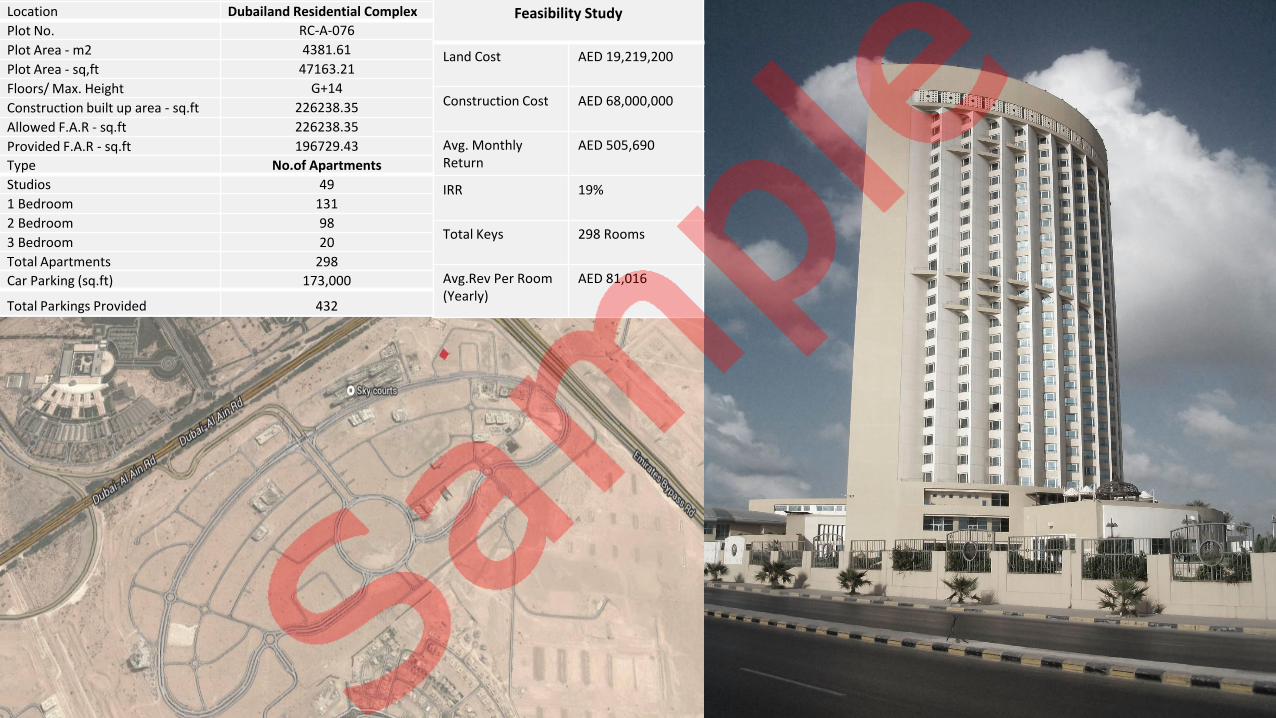
Location Dubailand Residential Complex
Plot No. RC-A-076
Plot Area - m2 4381.61
Plot Area - sq,ft 47163.21
Floors/ Max. Height G+14
Construction built up area - sq.ft 226238.35
Allowed F.A.R - sq.ft 226238.35
Provided F.A.R - sq.ft 196729.43
Type No.of Apartments
Studios 49
1 Bedroom 131
2 Bedroom 98
3 Bedroom 20
Total Apartments 298
Car Parking (sq.ft) 173,000
Total Parkings Provided 432
Feasibility Study
Land Cost AED 19,219,200
Construction Cost AED 68,000,000
Avg. MonthlyReturn
AED 505,690
IRR 19%
Total Keys 298 Rooms
Avg.Rev Per Room (Yearly)
AED 81,016
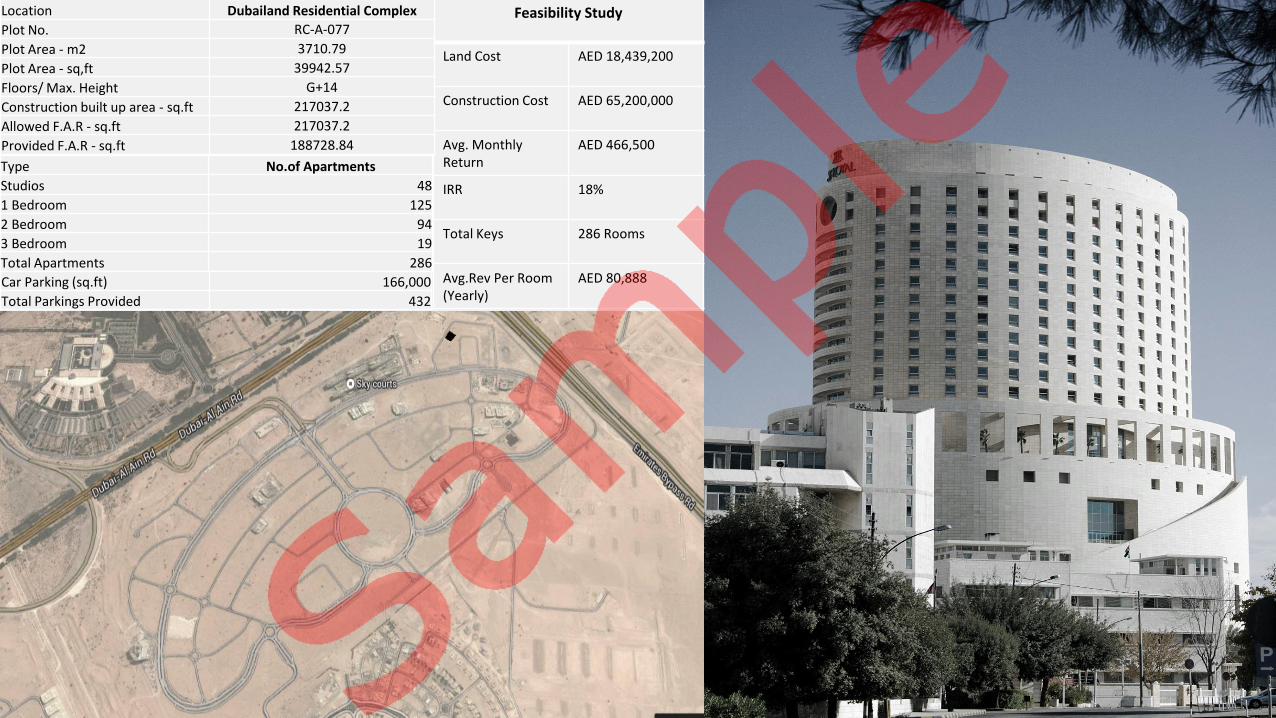
Feasibility Study
Land Cost AED 18,439,200
Construction Cost AED 65,200,000
Avg. MonthlyReturn
AED 466,500
IRR 18%
Total Keys 286 Rooms
Avg.Rev Per Room (Yearly)
AED 80,888
Location Dubailand Residential Complex
Plot No. RC-A-077
Plot Area - m2 3710.79
Plot Area - sq,ft 39942.57
Floors/ Max. Height G+14
Construction built up area - sq.ft 217037.2
Allowed F.A.R - sq.ft 217037.2
Provided F.A.R - sq.ft 188728.84
Type No.of Apartments
Studios 48
1 Bedroom 125
2 Bedroom 94
3 Bedroom 19
Total Apartments 286
Car Parking (sq.ft) 166,000
Total Parkings Provided 432
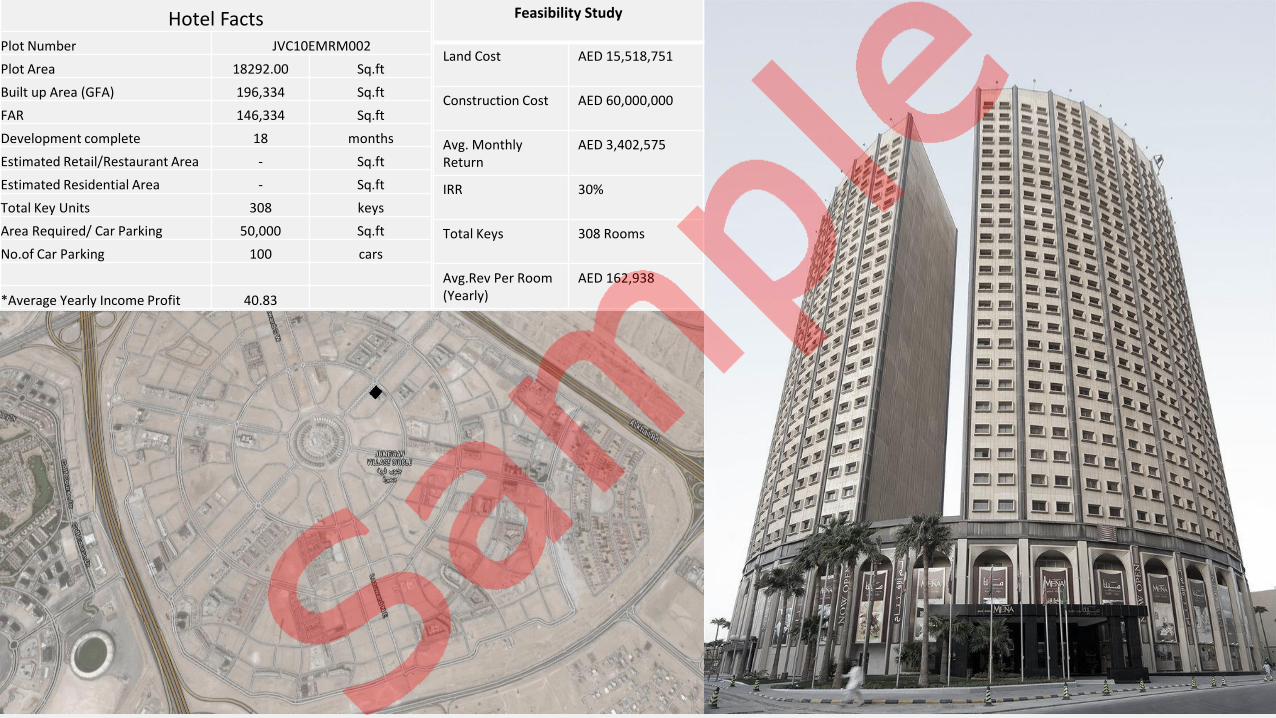
Feasibility Study
Land Cost AED 15,518,751
Construction Cost AED 60,000,000
Avg. MonthlyReturn
AED 3,402,575
IRR 30%
Total Keys 308 Rooms
Avg.Rev Per Room (Yearly)
AED 162,938
Hotel FactsPlot Number JVC10EMRM002
Plot Area 18292.00 Sq.ft
Built up Area (GFA) 196,334 Sq.ft
FAR 146,334 Sq.ft
Development complete 18 months
Estimated Retail/Restaurant Area - Sq.ft
Estimated Residential Area - Sq.ft
Total Key Units 308 keys
Area Required/ Car Parking 50,000 Sq.ft
No.of Car Parking 100 cars
*Average Yearly Income Profit 40.83
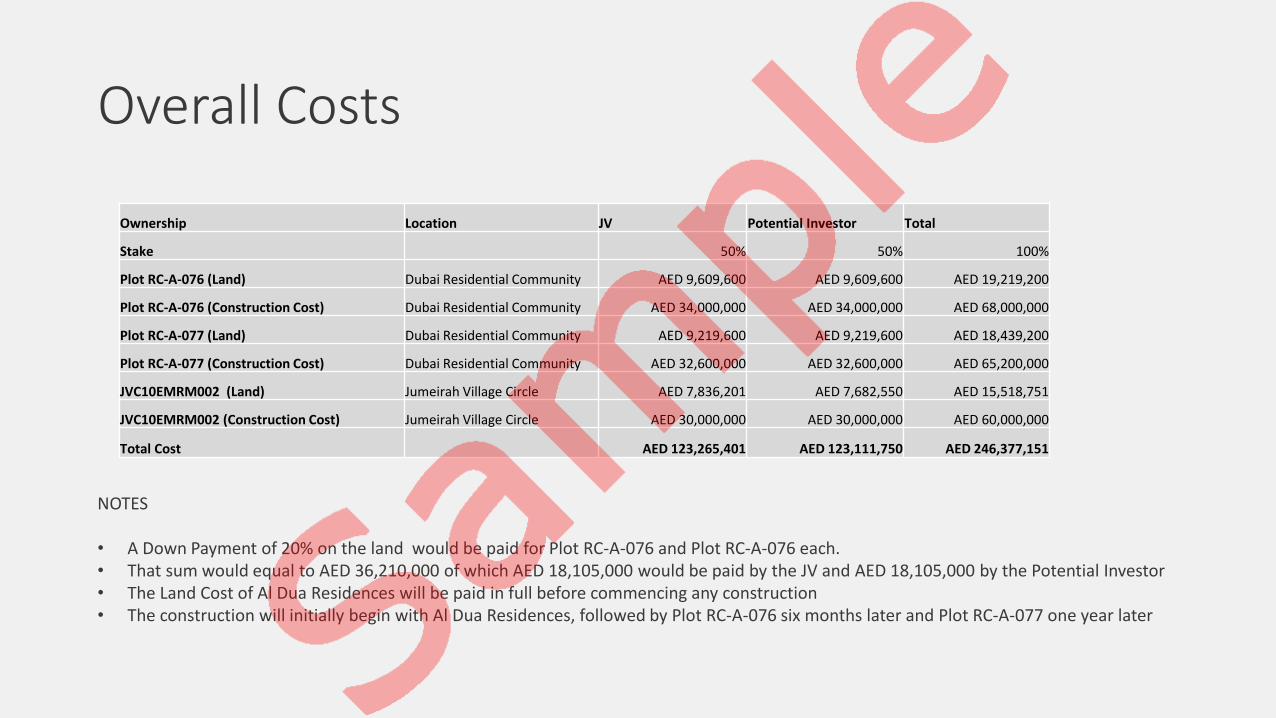
Overall Costs
Ownership Location JV Potential Investor Total
Stake 50% 50% 100%
Plot RC-A-076 (Land) Dubai Residential Community AED 9,609,600 AED 9,609,600 AED 19,219,200
Plot RC-A-076 (Construction Cost) Dubai Residential Community AED 34,000,000 AED 34,000,000 AED 68,000,000
Plot RC-A-077 (Land) Dubai Residential Community AED 9,219,600 AED 9,219,600 AED 18,439,200
Plot RC-A-077 (Construction Cost) Dubai Residential Community AED 32,600,000 AED 32,600,000 AED 65,200,000
JVC10EMRM002 (Land) Jumeirah Village Circle AED 7,836,201 AED 7,682,550 AED 15,518,751
JVC10EMRM002 (Construction Cost) Jumeirah Village Circle AED 30,000,000 AED 30,000,000 AED 60,000,000
Total Cost AED 123,265,401 AED 123,111,750 AED 246,377,151
NOTES
• A Down Payment of 20% on the land would be paid for Plot RC-A-076 and Plot RC-A-076 each.• That sum would equal to AED 36,210,000 of which AED 18,105,000 would be paid by the JV and AED 18,105,000 by the Potential Investor• The Land Cost of Al Dua Residences will be paid in full before commencing any construction• The construction will initially begin with Al Dua Residences, followed by Plot RC-A-076 six months later and Plot RC-A-077 one year later
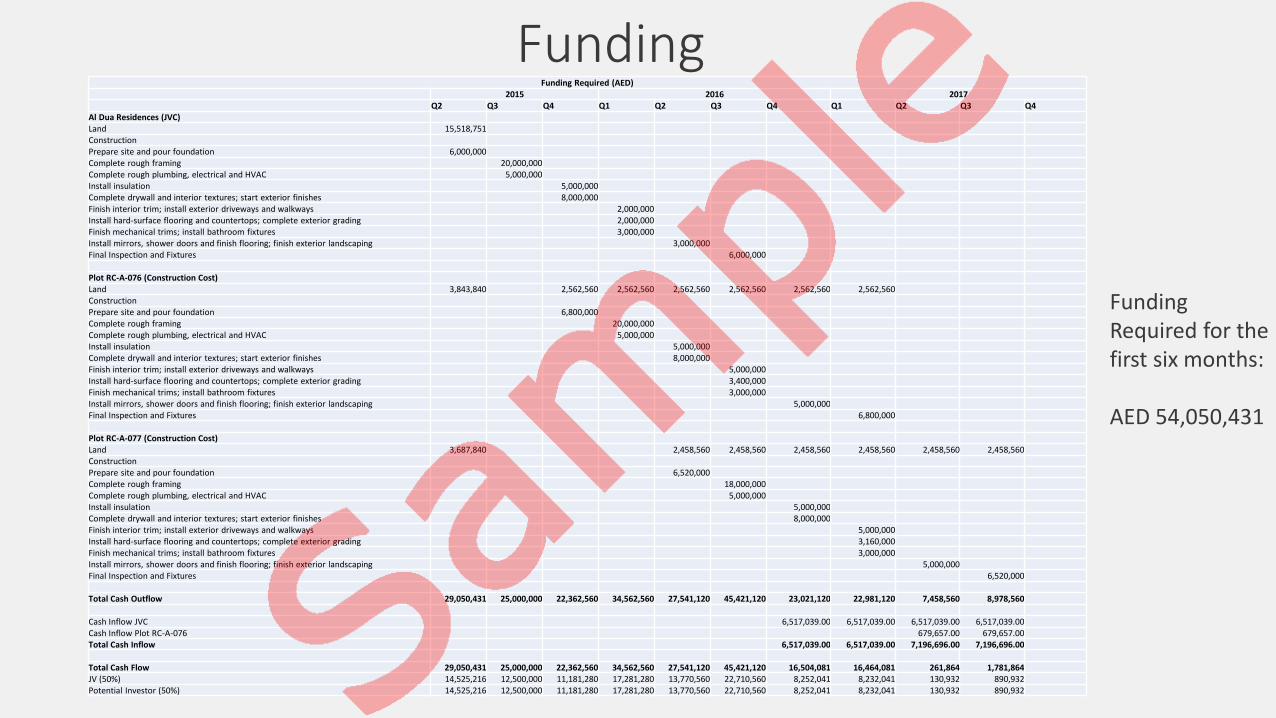
Funding
Funding Required for the first six months:
AED 54,050,431
Funding Required (AED)2015 2016 2017
Q2 Q3 Q4 Q1 Q2 Q3 Q4 Q1 Q2 Q3 Q4Al Dua Residences (JVC)Land 15,518,751ConstructionPrepare site and pour foundation 6,000,000Complete rough framing 20,000,000Complete rough plumbing, electrical and HVAC 5,000,000Install insulation 5,000,000Complete drywall and interior textures; start exterior finishes 8,000,000Finish interior trim; install exterior driveways and walkways 2,000,000Install hard-surface flooring and countertops; complete exterior grading 2,000,000Finish mechanical trims; install bathroom fixtures 3,000,000Install mirrors, shower doors and finish flooring; finish exterior landscaping 3,000,000Final Inspection and Fixtures 6,000,000
Plot RC-A-076 (Construction Cost)Land 3,843,840 2,562,560 2,562,560 2,562,560 2,562,560 2,562,560 2,562,560ConstructionPrepare site and pour foundation 6,800,000Complete rough framing 20,000,000Complete rough plumbing, electrical and HVAC 5,000,000Install insulation 5,000,000Complete drywall and interior textures; start exterior finishes 8,000,000Finish interior trim; install exterior driveways and walkways 5,000,000Install hard-surface flooring and countertops; complete exterior grading 3,400,000Finish mechanical trims; install bathroom fixtures 3,000,000Install mirrors, shower doors and finish flooring; finish exterior landscaping 5,000,000Final Inspection and Fixtures 6,800,000
Plot RC-A-077 (Construction Cost)Land 3,687,840 2,458,560 2,458,560 2,458,560 2,458,560 2,458,560 2,458,560ConstructionPrepare site and pour foundation 6,520,000Complete rough framing 18,000,000Complete rough plumbing, electrical and HVAC 5,000,000Install insulation 5,000,000Complete drywall and interior textures; start exterior finishes 8,000,000Finish interior trim; install exterior driveways and walkways 5,000,000Install hard-surface flooring and countertops; complete exterior grading 3,160,000Finish mechanical trims; install bathroom fixtures 3,000,000Install mirrors, shower doors and finish flooring; finish exterior landscaping 5,000,000Final Inspection and Fixtures 6,520,000
Total Cash Outflow 29,050,431 25,000,000 22,362,560 34,562,560 27,541,120 45,421,120 23,021,120 22,981,120 7,458,560 8,978,560
Cash Inflow JVC 6,517,039.00 6,517,039.00 6,517,039.00 6,517,039.00Cash Inflow Plot RC-A-076 679,657.00 679,657.00Total Cash Inflow 6,517,039.00 6,517,039.00 7,196,696.00 7,196,696.00
Total Cash Flow 29,050,431 25,000,000 22,362,560 34,562,560 27,541,120 45,421,120 16,504,081 16,464,081 261,864 1,781,864JV (50%) 14,525,216 12,500,000 11,181,280 17,281,280 13,770,560 22,710,560 8,252,041 8,232,041 130,932 890,932Potential Investor (50%) 14,525,216 12,500,000 11,181,280 17,281,280 13,770,560 22,710,560 8,252,041 8,232,041 130,932 890,932
Addendum
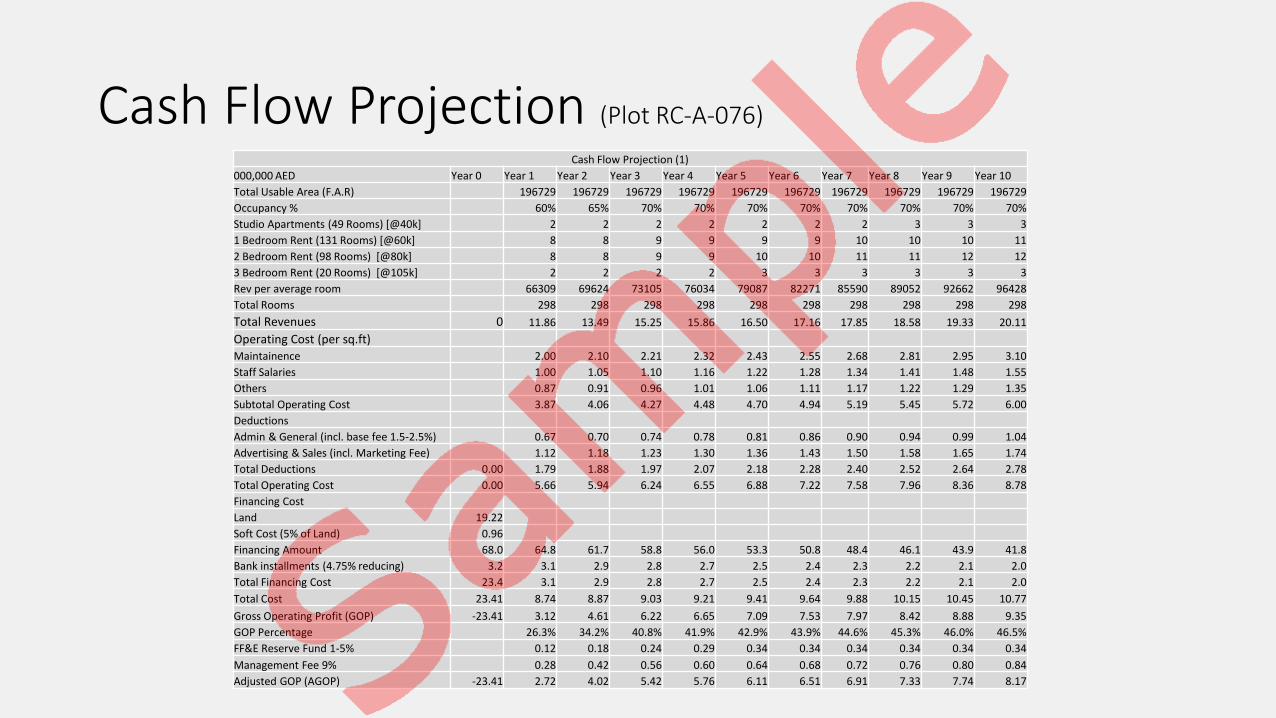
Cash Flow Projection (Plot RC-A-076)
Cash Flow Projection (1)
000,000 AED Year 0 Year 1 Year 2 Year 3 Year 4 Year 5 Year 6 Year 7 Year 8 Year 9 Year 10
Total Usable Area (F.A.R) 196729 196729 196729 196729 196729 196729 196729 196729 196729 196729
Occupancy % 60% 65% 70% 70% 70% 70% 70% 70% 70% 70%
Studio Apartments (49 Rooms) [@40k] 2 2 2 2 2 2 2 3 3 3
1 Bedroom Rent (131 Rooms) [@60k] 8 8 9 9 9 9 10 10 10 11
2 Bedroom Rent (98 Rooms) [@80k] 8 8 9 9 10 10 11 11 12 12
3 Bedroom Rent (20 Rooms) [@105k] 2 2 2 2 3 3 3 3 3 3
Rev per average room 66309 69624 73105 76034 79087 82271 85590 89052 92662 96428
Total Rooms 298 298 298 298 298 298 298 298 298 298
Total Revenues 0 11.86 13.49 15.25 15.86 16.50 17.16 17.85 18.58 19.33 20.11
Operating Cost (per sq.ft)Maintainence 2.00 2.10 2.21 2.32 2.43 2.55 2.68 2.81 2.95 3.10
Staff Salaries 1.00 1.05 1.10 1.16 1.22 1.28 1.34 1.41 1.48 1.55
Others 0.87 0.91 0.96 1.01 1.06 1.11 1.17 1.22 1.29 1.35
Subtotal Operating Cost 3.87 4.06 4.27 4.48 4.70 4.94 5.19 5.45 5.72 6.00
Deductions
Admin & General (incl. base fee 1.5-2.5%) 0.67 0.70 0.74 0.78 0.81 0.86 0.90 0.94 0.99 1.04
Advertising & Sales (incl. Marketing Fee) 1.12 1.18 1.23 1.30 1.36 1.43 1.50 1.58 1.65 1.74
Total Deductions 0.00 1.79 1.88 1.97 2.07 2.18 2.28 2.40 2.52 2.64 2.78
Total Operating Cost 0.00 5.66 5.94 6.24 6.55 6.88 7.22 7.58 7.96 8.36 8.78
Financing Cost
Land 19.22
Soft Cost (5% of Land) 0.96
Financing Amount 68.0 64.8 61.7 58.8 56.0 53.3 50.8 48.4 46.1 43.9 41.8
Bank installments (4.75% reducing) 3.2 3.1 2.9 2.8 2.7 2.5 2.4 2.3 2.2 2.1 2.0
Total Financing Cost 23.4 3.1 2.9 2.8 2.7 2.5 2.4 2.3 2.2 2.1 2.0
Total Cost 23.41 8.74 8.87 9.03 9.21 9.41 9.64 9.88 10.15 10.45 10.77
Gross Operating Profit (GOP) -23.41 3.12 4.61 6.22 6.65 7.09 7.53 7.97 8.42 8.88 9.35
GOP Percentage 26.3% 34.2% 40.8% 41.9% 42.9% 43.9% 44.6% 45.3% 46.0% 46.5%
FF&E Reserve Fund 1-5% 0.12 0.18 0.24 0.29 0.34 0.34 0.34 0.34 0.34 0.34
Management Fee 9% 0.28 0.42 0.56 0.60 0.64 0.68 0.72 0.76 0.80 0.84
Adjusted GOP (AGOP) -23.41 2.72 4.02 5.42 5.76 6.11 6.51 6.91 7.33 7.74 8.17
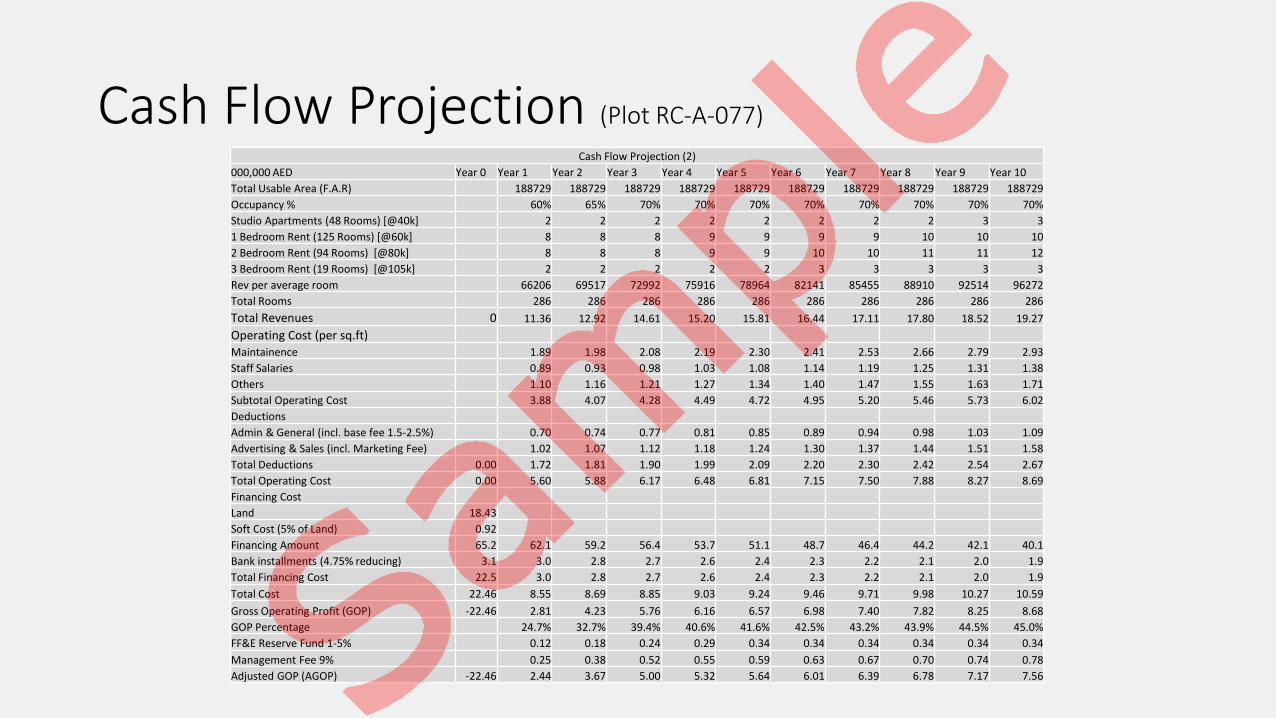
Cash Flow Projection (Plot RC-A-077)
Cash Flow Projection (2)
000,000 AED Year 0 Year 1 Year 2 Year 3 Year 4 Year 5 Year 6 Year 7 Year 8 Year 9 Year 10
Total Usable Area (F.A.R) 188729 188729 188729 188729 188729 188729 188729 188729 188729 188729
Occupancy % 60% 65% 70% 70% 70% 70% 70% 70% 70% 70%
Studio Apartments (48 Rooms) [@40k] 2 2 2 2 2 2 2 2 3 3
1 Bedroom Rent (125 Rooms) [@60k] 8 8 8 9 9 9 9 10 10 10
2 Bedroom Rent (94 Rooms) [@80k] 8 8 8 9 9 10 10 11 11 12
3 Bedroom Rent (19 Rooms) [@105k] 2 2 2 2 2 3 3 3 3 3
Rev per average room 66206 69517 72992 75916 78964 82141 85455 88910 92514 96272
Total Rooms 286 286 286 286 286 286 286 286 286 286
Total Revenues 0 11.36 12.92 14.61 15.20 15.81 16.44 17.11 17.80 18.52 19.27
Operating Cost (per sq.ft)Maintainence 1.89 1.98 2.08 2.19 2.30 2.41 2.53 2.66 2.79 2.93
Staff Salaries 0.89 0.93 0.98 1.03 1.08 1.14 1.19 1.25 1.31 1.38
Others 1.10 1.16 1.21 1.27 1.34 1.40 1.47 1.55 1.63 1.71
Subtotal Operating Cost 3.88 4.07 4.28 4.49 4.72 4.95 5.20 5.46 5.73 6.02
Deductions
Admin & General (incl. base fee 1.5-2.5%) 0.70 0.74 0.77 0.81 0.85 0.89 0.94 0.98 1.03 1.09
Advertising & Sales (incl. Marketing Fee) 1.02 1.07 1.12 1.18 1.24 1.30 1.37 1.44 1.51 1.58
Total Deductions 0.00 1.72 1.81 1.90 1.99 2.09 2.20 2.30 2.42 2.54 2.67
Total Operating Cost 0.00 5.60 5.88 6.17 6.48 6.81 7.15 7.50 7.88 8.27 8.69
Financing Cost
Land 18.43
Soft Cost (5% of Land) 0.92
Financing Amount 65.2 62.1 59.2 56.4 53.7 51.1 48.7 46.4 44.2 42.1 40.1
Bank installments (4.75% reducing) 3.1 3.0 2.8 2.7 2.6 2.4 2.3 2.2 2.1 2.0 1.9
Total Financing Cost 22.5 3.0 2.8 2.7 2.6 2.4 2.3 2.2 2.1 2.0 1.9
Total Cost 22.46 8.55 8.69 8.85 9.03 9.24 9.46 9.71 9.98 10.27 10.59
Gross Operating Profit (GOP) -22.46 2.81 4.23 5.76 6.16 6.57 6.98 7.40 7.82 8.25 8.68
GOP Percentage 24.7% 32.7% 39.4% 40.6% 41.6% 42.5% 43.2% 43.9% 44.5% 45.0%
FF&E Reserve Fund 1-5% 0.12 0.18 0.24 0.29 0.34 0.34 0.34 0.34 0.34 0.34
Management Fee 9% 0.25 0.38 0.52 0.55 0.59 0.63 0.67 0.70 0.74 0.78
Adjusted GOP (AGOP) -22.46 2.44 3.67 5.00 5.32 5.64 6.01 6.39 6.78 7.17 7.56
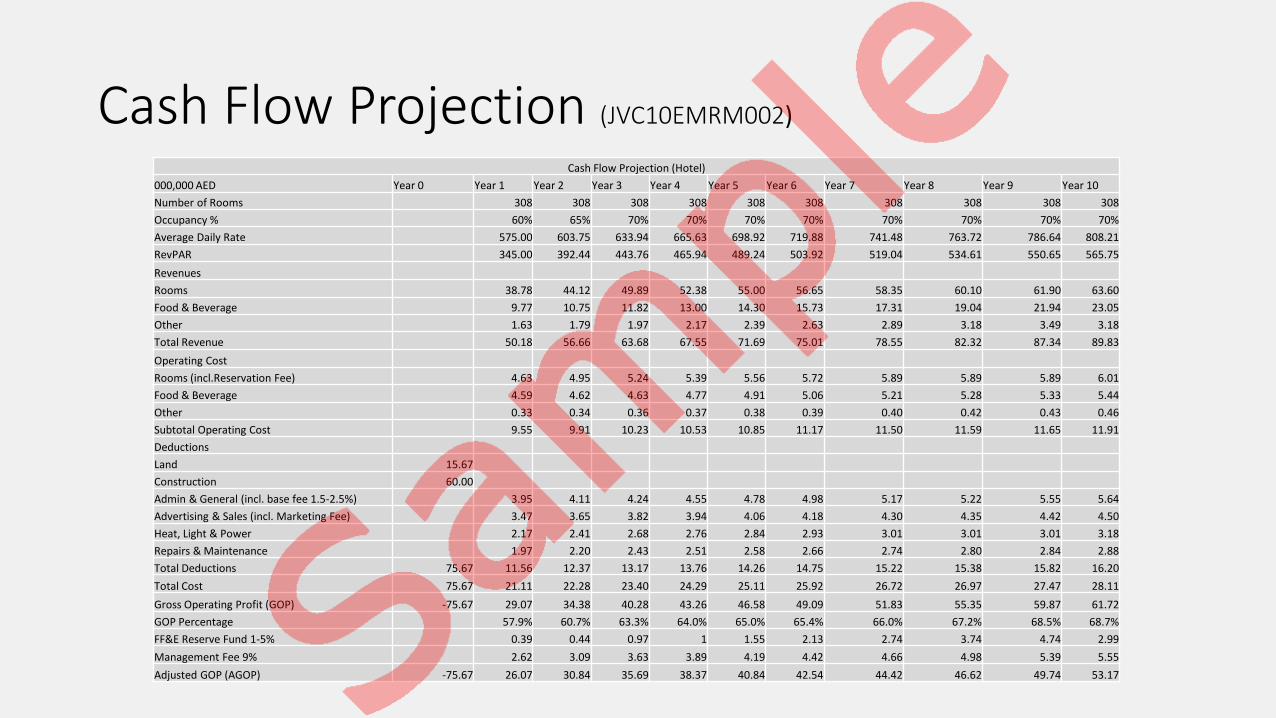
Cash Flow Projection (JVC10EMRM002)
Cash Flow Projection (Hotel)
000,000 AED Year 0 Year 1 Year 2 Year 3 Year 4 Year 5 Year 6 Year 7 Year 8 Year 9 Year 10
Number of Rooms 308 308 308 308 308 308 308 308 308 308
Occupancy % 60% 65% 70% 70% 70% 70% 70% 70% 70% 70%
Average Daily Rate 575.00 603.75 633.94 665.63 698.92 719.88 741.48 763.72 786.64 808.21
RevPAR 345.00 392.44 443.76 465.94 489.24 503.92 519.04 534.61 550.65 565.75
Revenues
Rooms 38.78 44.12 49.89 52.38 55.00 56.65 58.35 60.10 61.90 63.60
Food & Beverage 9.77 10.75 11.82 13.00 14.30 15.73 17.31 19.04 21.94 23.05
Other 1.63 1.79 1.97 2.17 2.39 2.63 2.89 3.18 3.49 3.18
Total Revenue 50.18 56.66 63.68 67.55 71.69 75.01 78.55 82.32 87.34 89.83
Operating Cost
Rooms (incl.Reservation Fee) 4.63 4.95 5.24 5.39 5.56 5.72 5.89 5.89 5.89 6.01
Food & Beverage 4.59 4.62 4.63 4.77 4.91 5.06 5.21 5.28 5.33 5.44
Other 0.33 0.34 0.36 0.37 0.38 0.39 0.40 0.42 0.43 0.46
Subtotal Operating Cost 9.55 9.91 10.23 10.53 10.85 11.17 11.50 11.59 11.65 11.91
Deductions
Land 15.67
Construction 60.00
Admin & General (incl. base fee 1.5-2.5%) 3.95 4.11 4.24 4.55 4.78 4.98 5.17 5.22 5.55 5.64
Advertising & Sales (incl. Marketing Fee) 3.47 3.65 3.82 3.94 4.06 4.18 4.30 4.35 4.42 4.50
Heat, Light & Power 2.17 2.41 2.68 2.76 2.84 2.93 3.01 3.01 3.01 3.18
Repairs & Maintenance 1.97 2.20 2.43 2.51 2.58 2.66 2.74 2.80 2.84 2.88
Total Deductions 75.67 11.56 12.37 13.17 13.76 14.26 14.75 15.22 15.38 15.82 16.20
Total Cost 75.67 21.11 22.28 23.40 24.29 25.11 25.92 26.72 26.97 27.47 28.11
Gross Operating Profit (GOP) -75.67 29.07 34.38 40.28 43.26 46.58 49.09 51.83 55.35 59.87 61.72
GOP Percentage 57.9% 60.7% 63.3% 64.0% 65.0% 65.4% 66.0% 67.2% 68.5% 68.7%
FF&E Reserve Fund 1-5% 0.39 0.44 0.97 1 1.55 2.13 2.74 3.74 4.74 2.99
Management Fee 9% 2.62 3.09 3.63 3.89 4.19 4.42 4.66 4.98 5.39 5.55
Adjusted GOP (AGOP) -75.67 26.07 30.84 35.69 38.37 40.84 42.54 44.42 46.62 49.74 53.17
G r o u p o f H o t e l s
You r S a n c t u m