Embed Size (px)
Citation preview
A Robust Job Recovery is Underway
Through August 2008, we were in a typical recession concentrated in housing, autos, and a financial sector that financed the overexpansion of these sectors. Then the government caused a complete panicinduced collapse, which resulted in the needless loss of at least 6.2 million jobs. The needless job losses are underscored by the fact that only 4.6 million (about 55%) of the total 8.4 million lost jobs since year-end 2007 were in manufacturing (including autos), construction, or finance.
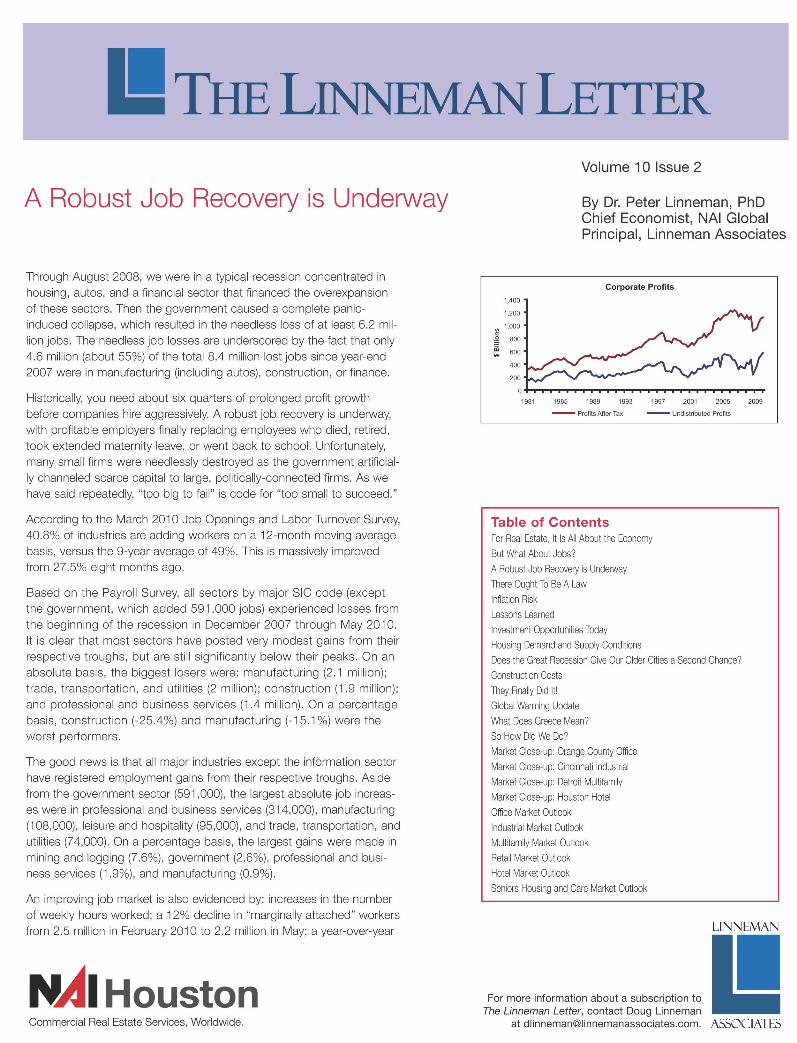
Historically, you need about six quarters of prolonged profit growth before companies hire aggressively. A robust job recovery is underway, with profitable employers finally replacing employees who died, retired, took extended maternity leave, or went back to school. Unfortunately, many small firms were needlessly destroyed as the government artificially channeled scarce capital to large, politically-connected firms. As we have said repeatedly, "too big to fail" is code for "too small to succeed."
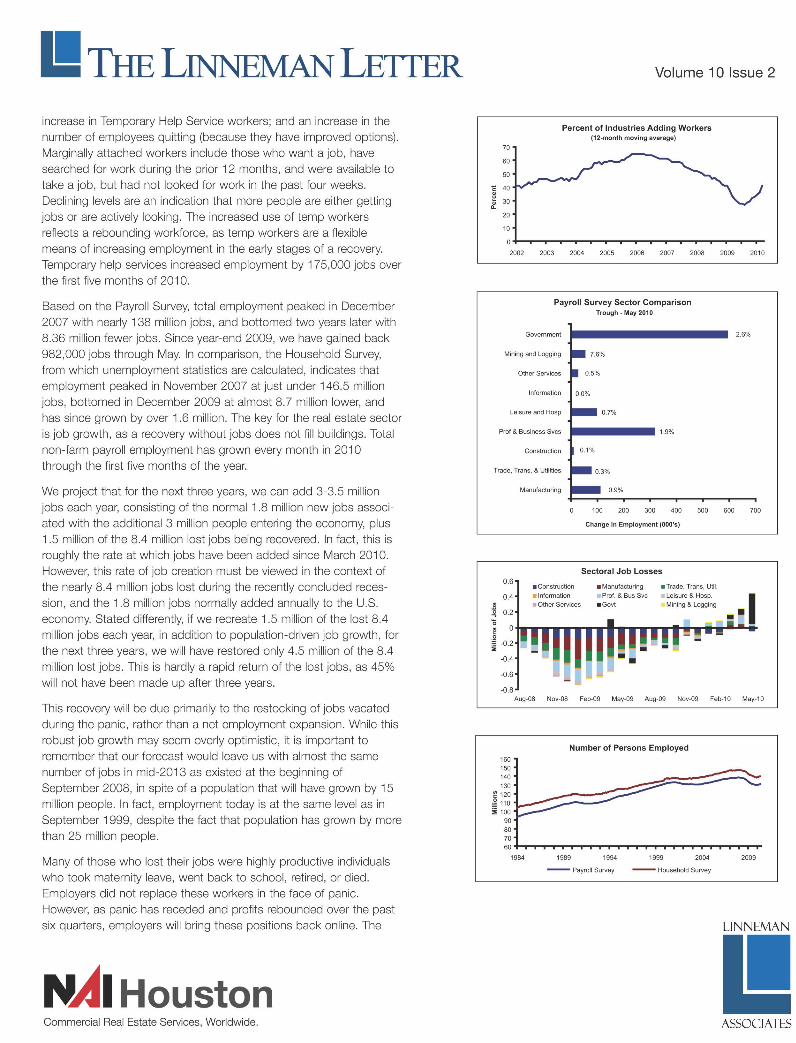
According to the March 2010 Job Openings and Labor Turnover Survey, 40.8% of industries are adding workers on a 12-month moving average basis, versus the 9-year average of 49%. This is massively improved from 27.5% eight months ago.
Based on the Payroll Survey, all sectors by major SIC code (except the government, which added 591,000 jobs) experienced losses from the beginning of the recession in December 2007 through May 2010. It is clear that most sectors have posted very modest gains from their respective troughs, but are still significantly below their peaks. On an absolute basis, the biggest losers were: manufacturing (2.1 million); trade, transportation, and utilities (2 million); construction (1.9 million); and professional and business services (1.4 million). On a percentage basis, construction (-25.4%) and manufacturing (-15.1 %) were the worst performers.
The good news is that all major industries except the information sector have registered employment gains from their respective troughs. Aside from the government sector (591,000), the largest absolute job increases were in professional and business services (314,000), manufacturing (108,000), leisure and hospitality (95,000), and trade, transportation, and utilities (74,000). On a percentage basis, the largest gains were made in mining and logging (7.6%), government (2.6%), professional and business services (1 .9%), and manufacturing (0.9%).
An improving job market is also evidenced by: increases in the number of weekly hours worked; a 12% decline in "marginally attached" workers from 2.5 million in February 2010 to 2.2 million in May; a year-over-year
HA IHouston Commercial Real Estate Services, Worldwide.
1.400
1.200
1.000
800
600
400
200
Volume 10 Issue 2
By Dr. Peter Linneman, PhD Chief Economist, NAI Global Principal, Linneman Associates
Corporate Profits
1981 1985 1989 1993 1997 2001 2005 2009
-- Profits AfterTax -- Undistributed Profits
Table of Contents For Real Estate, It Is All About the Economy
But What About Jobs?
A Robust Job Recovery is Underway
There Ought To Be A Law
Inflation Risk
Lessons Learned
Investment Opportunities Today
Housing Demand and Supply Conditions
Does the Great Recession Give Our Older Cities a Second Chance? Construction Costs
They Finally Did It!
Global Warming Update
What Does Greece Mean?
So How Did We Do?
Market Close-up: Orange County Office
Market Close-up: Cincinnati Industrial
Market Close-up: Detroit Multifamily
Market Close-up: Houston Hotel
Office Market Outlook
Industrial Market Out lock
Multifamily Market Outlook
Retail Market Outlook
Hotel Market Outlook
Seniors Housing and Care Market Outlook
For more information about a subscription to The Linneman Letter, contact Doug Linneman
at [email protected]. ASSOCIATES
increase in Temporary Help Service workers; and an increase in the number of employees quitting (because they have improved options). Marginally attached workers include those who want a job, have searched for work during the prior 12 months, and were available to take a job, but had not looked for work in the past four weeks. Declining levels are an indication that more people are either getting jobs or are actively looking. The increased use of temp workers reflects a rebounding workforce, as temp workers are a flexible means of increasing employment in the early stages of a recovery. Temporary help services increased employment by 175,000 jobs over the first five months of 2010.
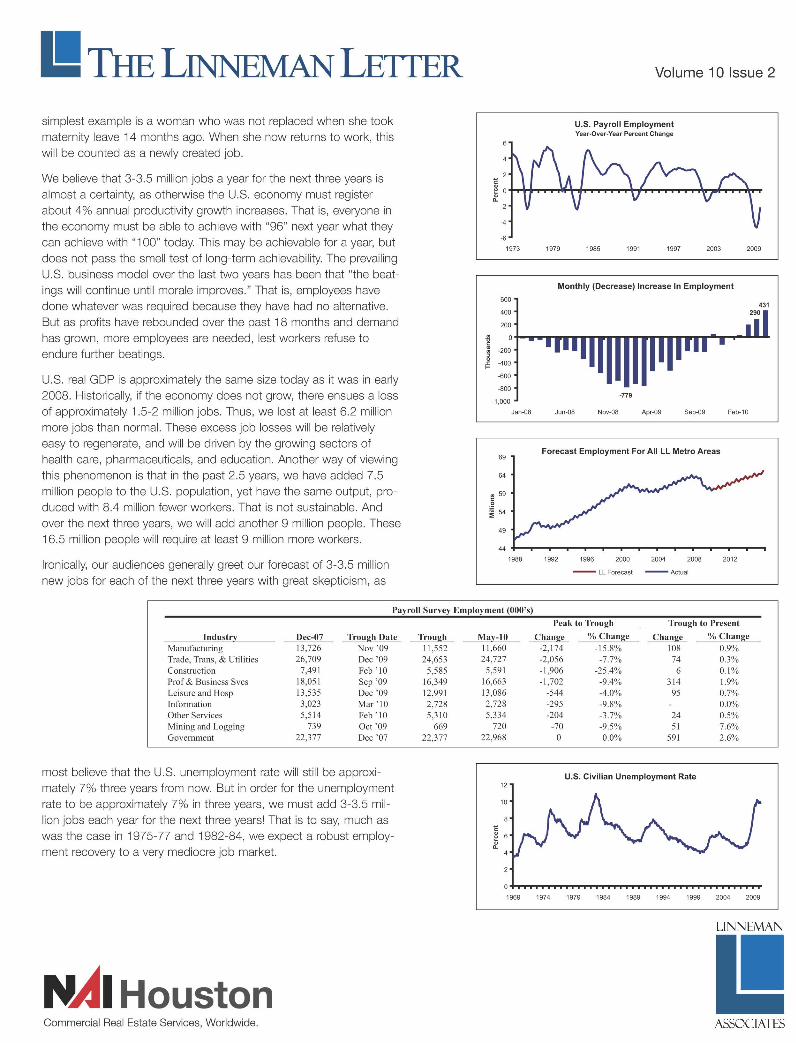
Based on the Payroll Survey, total employment peaked in December 2007 with nearly 138 million jobs, and bottomed two years later with 8.36 million fewer jobs. Since year-end 2009, we have gained back 982,000 jobs through May. In comparison, the Household Survey, from which unemployment statistics are calculated, indicates that employment peaked in November 2007 at just under 146.5 million jobs, bottomed in December 2009 at almost 8.7 million lower, and has since grown by over 1 .6 million. The key for the real estate sector is job growth, as a recovery without jobs does not fill buildings. Total non-farm payroll employment has grown every month in 2010 through the first five months of the year.
We project that for the next three years, we can add 3-3.5 million jobs each year, consisting of the normal 1.8 million new jobs associated with the additional 3 million people entering the economy, plus 1.5 million of the 8.4 million lost jobs being recovered. In fact, this is roughly the rate at which jobs have been added since March 2010. However, this rate of job creation must be viewed in the context of the nearly 8.4 million jobs lost during the recently concluded recession, and the 1.8 million jobs normally added annually to the U.S. economy. Stated differently, if we recreate 1.5 million of the lost 8.4 million jobs each year, in addition to population-driven job growth, for the next three years, we will have restored only 4.5 million of the 8.4 million lost jobs. This is hardly a rapid return of the lost jobs, as 45% will not have been made up after three years.
This recovery will be due primarily to the restocking of jobs vacated during the panic, rather than a net employment expansion. While this robust job growth may seem overly optimistic, it is important to remember that our forecast would leave us with almost the same number of jobs in mid-2013 as existed at the beginning of September 2008, in spite of a population that will have grown by 15 million people. In fact, employment today is at the same level as in September 1999, despite the fact that population has grown by more than 25 million people.
Many of those who lost their jobs were highly productive individuals who took maternity leave, went back to school, retired, or died. Employers did not replace these workers in the face of panic. However, as panic has receded and profits rebounded over the past six quarters, employers will bring these positions back online. The
HA I Houston Commercial Real Estate Services, Worldwide.
Volume 10 Issue 2
c
~ 0.
70
60
50
40
30
20
10
2002 2003
Percent of Industries Adding Workers (12-month moving average)
2004 2005 2006 2007 2008
Payroll Survey Sector Comparison Trough· May 2010
Government
Mining and Logging
Other Services
Information
Leisure and Hasp 0.7%
Prof & Business SVGS • _____ 1.9%
Construction
Trade, Trans, & Utilities
Manufacturing 0.9%
2009 2010
2.6%
100 200 300 400 500 600 700
. .c
0.6
0.4
~ 0.2
Change in Employment (000'5)
Sectoral Job Losses
• Construction _ Manufacturing _ Trade, Trans, Util.
• Information _ Prof. & Bus SVG • Leisure & Hasp.
. Other Services • Gov! Mining & Logg ing
'0 ~ Ot.~.n"~~~"rwnr~~.wn.~~~~ o ~ -0.2
-0.4
-0.6
-0.8 Aug-DB Nov-Oa Feb-09 May-09 Aug-09 Nov-09 Feb-10 May-10
160 150 140 130
~ 120 ~ 110 :i 100
90 80
Number of Persons Employed
70 60 ~~~~~~~~~~~~~~~~~~~
1984 1989 1994 1999 2004 2009
--Payroll Survey -- Household Survey
ASSOCIATES
simplest example is a woman who was not replaced when she took maternity leave 14 months ago. When she now returns to work, this will be counted as a newly created job.
We believe that 3-3.5 million jobs a year for the next three years is almost a certainty, as otherwise the U.S. economy must register about 4% annual productivity growth increases. That is, everyone in the economy must be able to achieve with "96" next year what they can achieve with "100" today. This may be achievable for a year, but does not pass the smell test of long-term achievability. The prevailing U.S. business model over the last two years has been that "the beatings will continue until morale improves." That is, employees have done whatever was required because they have had no alternative. But as profits have rebounded over the past 18 months and demand has grown, more employees are needed, lest workers refuse to endure further beatings.
U.S. real GOP is approximately the same size today as it was in early 2008. Historically, if the economy does not grow, there ensues a loss of approximately 1.5-2 million jobs. Thus, we lost at least 6.2 million more jobs than normal . These excess job losses will be relatively easy to regenerate, and will be driven by the growing sectors of health care, pharmaceuticals, and education. Another way of viewing this phenomenon is that in the past 2.5 years, we have added 7.5 million people to the U.S. population, yet have the same output, produced with 8.4 million fewer workers. That is not sustainable. And over the next three years, we will add another 9 million people. These 16.5 million people will require at least 9 million more workers.
Ironically, our audiences generally greet our forecast of 3-3.5 million new jobs for each of the next three years with great skepticism, as
c
Volume 10 Issue 2
U.S. Payroll Employment Year-Over-Year Percent Change
~ o~+t~~~~~~rr~~~~~~~~~~~ 0.
·2
.. ·6
1973
600
400
200
·200
..00
·600
·800
-1.000
69
64
~ 59 .2 i 54
49
Jan-OS
1988
1979 1985 1991 1997 2003 2009
Monthly (Decrease) Increase In Employment
-779
Jun-08 Nov-08 Apr-09 Sep-09 Feb-10
Forecast Employment For All LL Metro Areas
1992 1996 2000 2004 2008 2012
-- LL Forecast -- Actual
Payroll Survey Employment (OOO's)
lndustr~ Dec-07 Trough Date Manufacturing 13,726 Nov'09 Trade, Trans, & Utilities 26,709 Dec '09 Construction 7,491 Feb'IO Prof & Business Svcs 18,051 Sep'09 Leisure and Hasp 13,535 Dec '09 Information 3,023 Mar'lO Other Services 5,514 Feb'IO Mining and Logging 739 Oct '09 Government 22,377 Dec '07
most believe that the U.S. unemployment rate will still be approximately 7% three years from now. But in order for the unemployment rate to be approximately 7% in three years, we must add 3-3.5 million jobs each year for the next three years! That is to say, much as was the case in 1975-77 and 1982-84, we expect a robust employment recovery to a very mediocre job market.
HA IHouston Commercial Real Estate Services, Worldwide.
Trough 11,552 24,653
5,585 16,349 12,99 1 2,728 5,310
669 22,377
Peak to Trough Trough to Present
Ma~-l0 Change % Change Change % Change 11 ,660 -2 ,174 -15.8% 108 0.9% 24,727 -2,056 -7.7% 74 0.3%
5,591 -1 ,906 -25.4% 6 0.1% 16,663 -1 ,702 -9.4% 314 1.9% 13,086 -544 -4.0% 95 0.7% 2,728 -295 -9.8% 0.0% 5,334 -204 -3.7% 24 0.5%
720 -70 -9.5% 51 7.6% 22,968 0 0.0% 591 2.6%
U.S. Civilian Unemployment Rate
1969 1974 1979 1984 1989 1994 1999 2004 2009
ASSOCIATES