Embed Size (px)
Citation preview
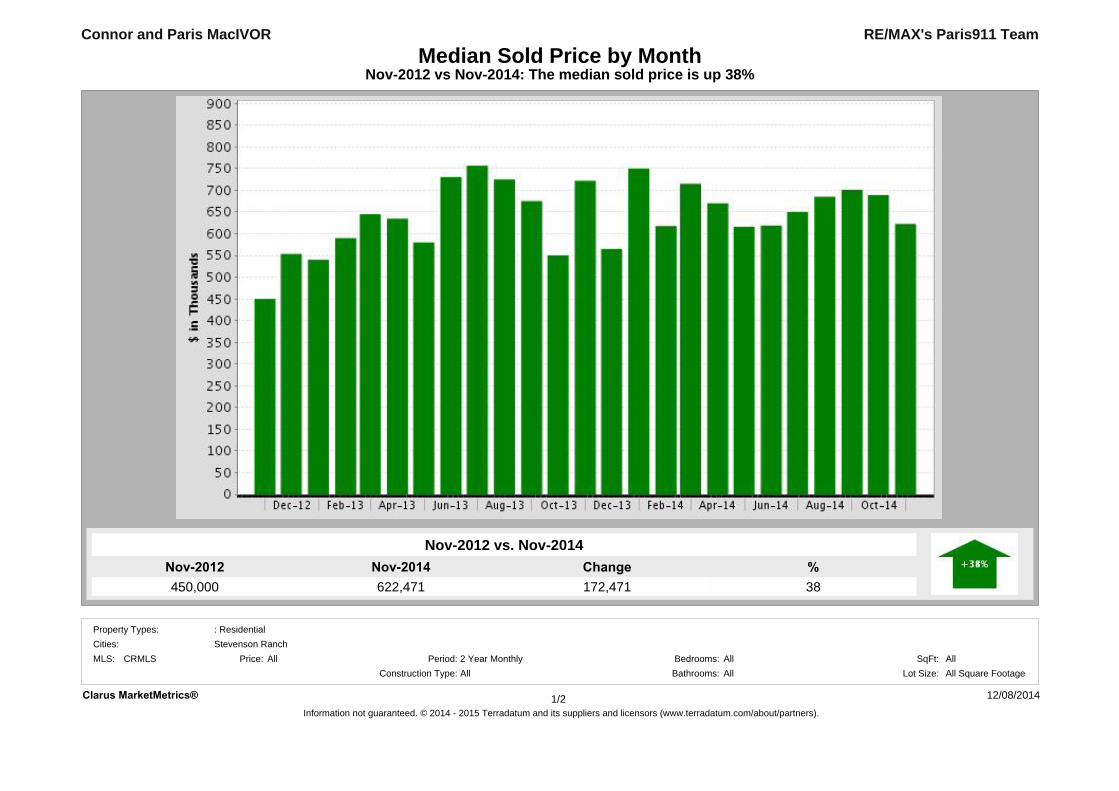
Nov-2014622,471
Nov-2012450,000
%38
Change172,471
Nov-2012 vs Nov-2014: The median sold price is up 38%Median Sold Price by Month
RE/MAX's Paris911 Team
Nov-2012 vs. Nov-2014
Connor and Paris MacIVOR
Clarus MarketMetrics® 12/08/2014Information not guaranteed. © 2014 - 2015 Terradatum and its suppliers and licensors (www.terradatum.com/about/partners).
1/2
MLS: CRMLS Bedrooms:AllAll
Construction Type:All2 Year Monthly SqFt:
Bathrooms: Lot Size:All All Square FootagePeriod:All
Cities:Property Types: : Residential
Stevenson RanchPrice:
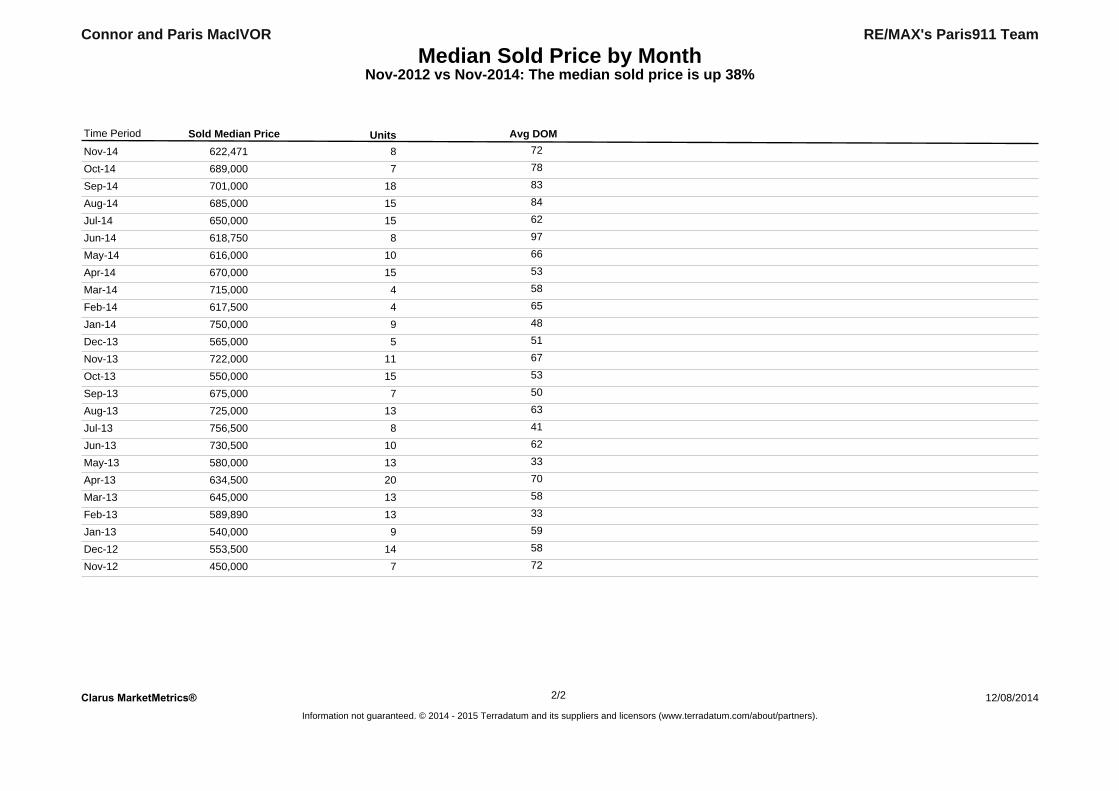
Median Sold Price by MonthNov-2012 vs Nov-2014: The median sold price is up 38%
RE/MAX's Paris911 TeamConnor and Paris MacIVOR
Sold Median Price Units Avg DOMTime Period
Nov-14 622,471 8 72
Oct-14 689,000 7 78
Sep-14 701,000 18 83
Aug-14 685,000 15 84
Jul-14 650,000 15 62
Jun-14 618,750 8 97
May-14 616,000 10 66
Apr-14 670,000 15 53
Mar-14 715,000 4 58
Feb-14 617,500 4 65
Jan-14 750,000 9 48
Dec-13 565,000 5 51
Nov-13 722,000 11 67
Oct-13 550,000 15 53
Sep-13 675,000 7 50
Aug-13 725,000 13 63
Jul-13 756,500 8 41
Jun-13 730,500 10 62
May-13 580,000 13 33
Apr-13 634,500 20 70
Mar-13 645,000 13 58
Feb-13 589,890 13 33
Jan-13 540,000 9 59
Dec-12 553,500 14 58
Nov-12 450,000 7 72
Clarus MarketMetrics® 12/08/2014Information not guaranteed. © 2014 - 2015 Terradatum and its suppliers and licensors (www.terradatum.com/about/partners).
22/
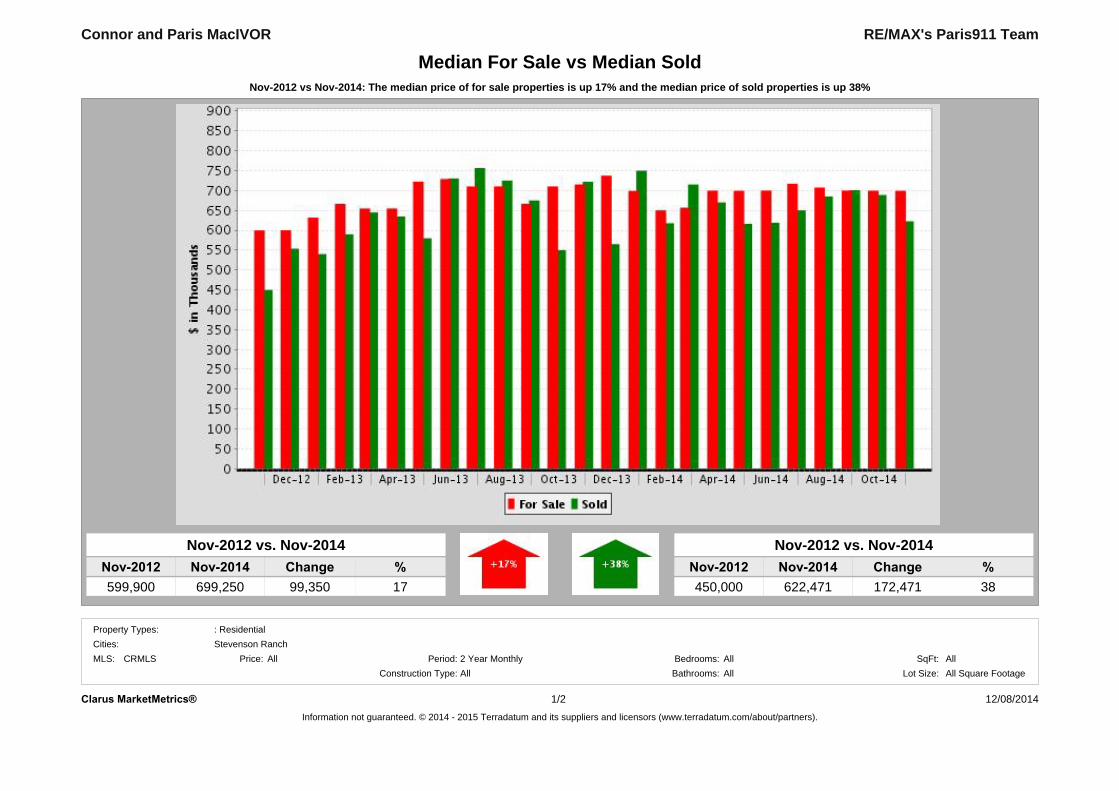
Nov-2012 vs Nov-2014: The median price of for sale properties is up 17% and the median price of sold properties is up 38%
RE/MAX's Paris911 Team
Nov-2012 vs. Nov-2014
599,900 17
Connor and Paris MacIVOR
699,250Nov-2014
Median For Sale vs Median Sold
ChangeNov-2012 %99,350
Nov-2012 Nov-2014 %450,000 38
Nov-2012 vs. Nov-2014
622,471Change172,471
Clarus MarketMetrics® 12/08/2014Information not guaranteed. © 2014 - 2015 Terradatum and its suppliers and licensors (www.terradatum.com/about/partners).
1/2
MLS: CRMLS Bedrooms:AllAll
Construction Type:All2 Year Monthly SqFt:
Bathrooms: Lot Size:All All Square FootagePeriod:All
Cities:Property Types: : Residential
Stevenson RanchPrice:
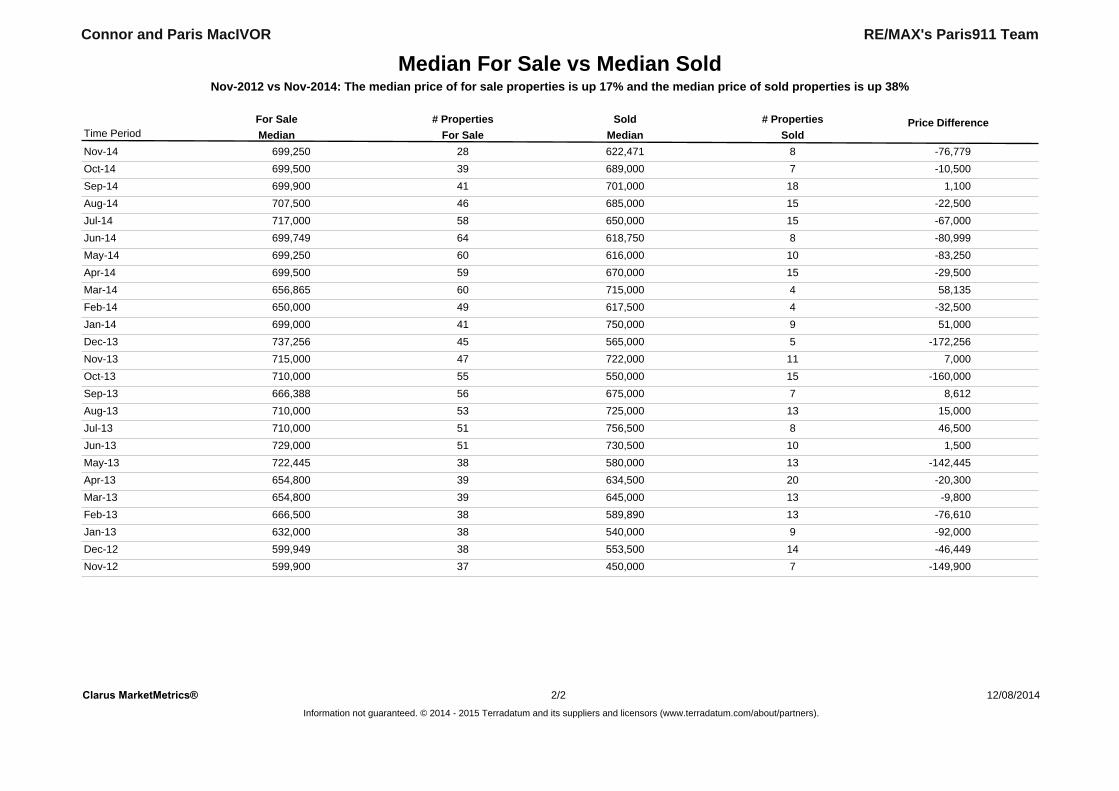
Median For Sale vs Median SoldNov-2012 vs Nov-2014: The median price of for sale properties is up 17% and the median price of sold properties is up 38%
RE/MAX's Paris911 TeamConnor and Paris MacIVOR
For SaleMedian SoldMedianFor Sale # Properties # PropertiesSold Price Difference
Time Period
Nov-14 28 8699,250 622,471 -76,779Oct-14 39 7699,500 689,000 -10,500Sep-14 41 18699,900 701,000 1,100Aug-14 46 15707,500 685,000 -22,500Jul-14 58 15717,000 650,000 -67,000Jun-14 64 8699,749 618,750 -80,999May-14 60 10699,250 616,000 -83,250Apr-14 59 15699,500 670,000 -29,500Mar-14 60 4656,865 715,000 58,135Feb-14 49 4650,000 617,500 -32,500Jan-14 41 9699,000 750,000 51,000Dec-13 45 5737,256 565,000 -172,256Nov-13 47 11715,000 722,000 7,000Oct-13 55 15710,000 550,000 -160,000Sep-13 56 7666,388 675,000 8,612Aug-13 53 13710,000 725,000 15,000Jul-13 51 8710,000 756,500 46,500Jun-13 51 10729,000 730,500 1,500May-13 38 13722,445 580,000 -142,445Apr-13 39 20654,800 634,500 -20,300Mar-13 39 13654,800 645,000 -9,800Feb-13 38 13666,500 589,890 -76,610Jan-13 38 9632,000 540,000 -92,000Dec-12 38 14599,949 553,500 -46,449Nov-12 37 7599,900 450,000 -149,900
Clarus MarketMetrics®Information not guaranteed. © 2014 - 2015 Terradatum and its suppliers and licensors (www.terradatum.com/about/partners).
12/08/201422/
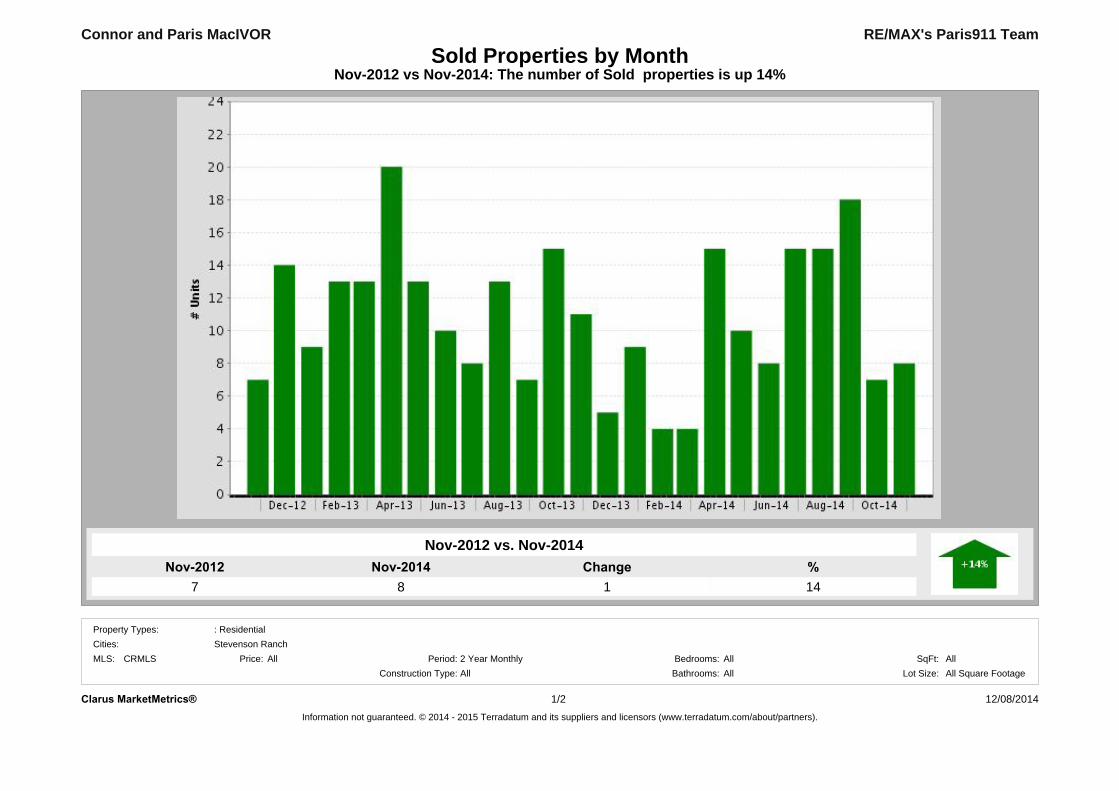
Nov-20148
Nov-20127
%14
Change1
Nov-2012 vs Nov-2014: The number of Sold properties is up 14%Sold Properties by Month
RE/MAX's Paris911 Team
Nov-2012 vs. Nov-2014
Connor and Paris MacIVOR
Clarus MarketMetrics® 12/08/2014Information not guaranteed. © 2014 - 2015 Terradatum and its suppliers and licensors (www.terradatum.com/about/partners).
1/2
MLS: CRMLS Bedrooms:AllAll
Construction Type:All2 Year Monthly SqFt:
Bathrooms: Lot Size:All All Square FootagePeriod:All
Cities:Property Types: : Residential
Stevenson RanchPrice:
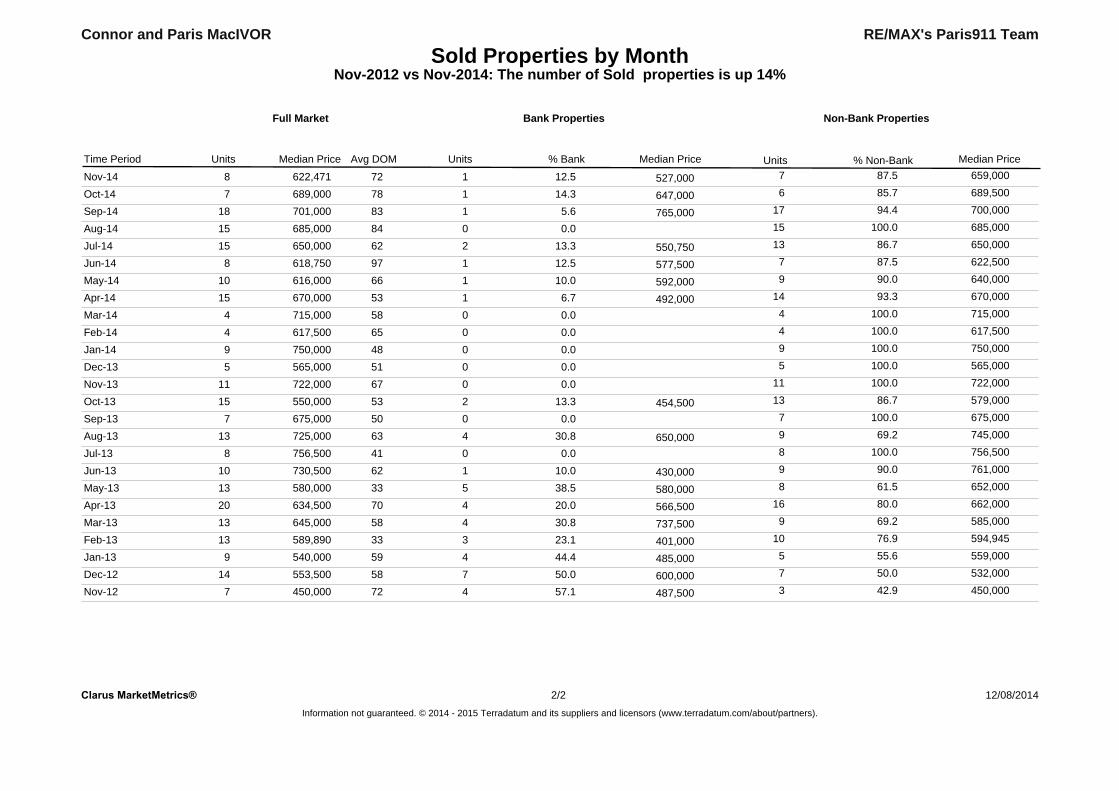
Sold Properties by MonthNov-2012 vs Nov-2014: The number of Sold properties is up 14%
RE/MAX's Paris911 TeamConnor and Paris MacIVOR
Time Period
Full Market
Units Median Price Avg DOM
Bank Properties
Units % Bank Median Price
Non-Bank Properties
Units % Non-Bank Median Price
Nov-14 622,4718 72 1 12.5 527,000 7 87.5 659,000
Oct-14 689,0007 78 1 14.3 647,000 6 85.7 689,500
Sep-14 701,00018 83 1 5.6 765,000 17 94.4 700,000
Aug-14 685,00015 84 0 0.0 15 100.0 685,000
Jul-14 650,00015 62 2 13.3 550,750 13 86.7 650,000
Jun-14 618,7508 97 1 12.5 577,500 7 87.5 622,500
May-14 616,00010 66 1 10.0 592,000 9 90.0 640,000
Apr-14 670,00015 53 1 6.7 492,000 14 93.3 670,000
Mar-14 715,0004 58 0 0.0 4 100.0 715,000
Feb-14 617,5004 65 0 0.0 4 100.0 617,500
Jan-14 750,0009 48 0 0.0 9 100.0 750,000
Dec-13 565,0005 51 0 0.0 5 100.0 565,000
Nov-13 722,00011 67 0 0.0 11 100.0 722,000
Oct-13 550,00015 53 2 13.3 454,500 13 86.7 579,000
Sep-13 675,0007 50 0 0.0 7 100.0 675,000
Aug-13 725,00013 63 4 30.8 650,000 9 69.2 745,000
Jul-13 756,5008 41 0 0.0 8 100.0 756,500
Jun-13 730,50010 62 1 10.0 430,000 9 90.0 761,000
May-13 580,00013 33 5 38.5 580,000 8 61.5 652,000
Apr-13 634,50020 70 4 20.0 566,500 16 80.0 662,000
Mar-13 645,00013 58 4 30.8 737,500 9 69.2 585,000
Feb-13 589,89013 33 3 23.1 401,000 10 76.9 594,945
Jan-13 540,0009 59 4 44.4 485,000 5 55.6 559,000
Dec-12 553,50014 58 7 50.0 600,000 7 50.0 532,000
Nov-12 450,0007 72 4 57.1 487,500 3 42.9 450,000
Clarus MarketMetrics® 12/08/2014Information not guaranteed. © 2014 - 2015 Terradatum and its suppliers and licensors (www.terradatum.com/about/partners).
22/
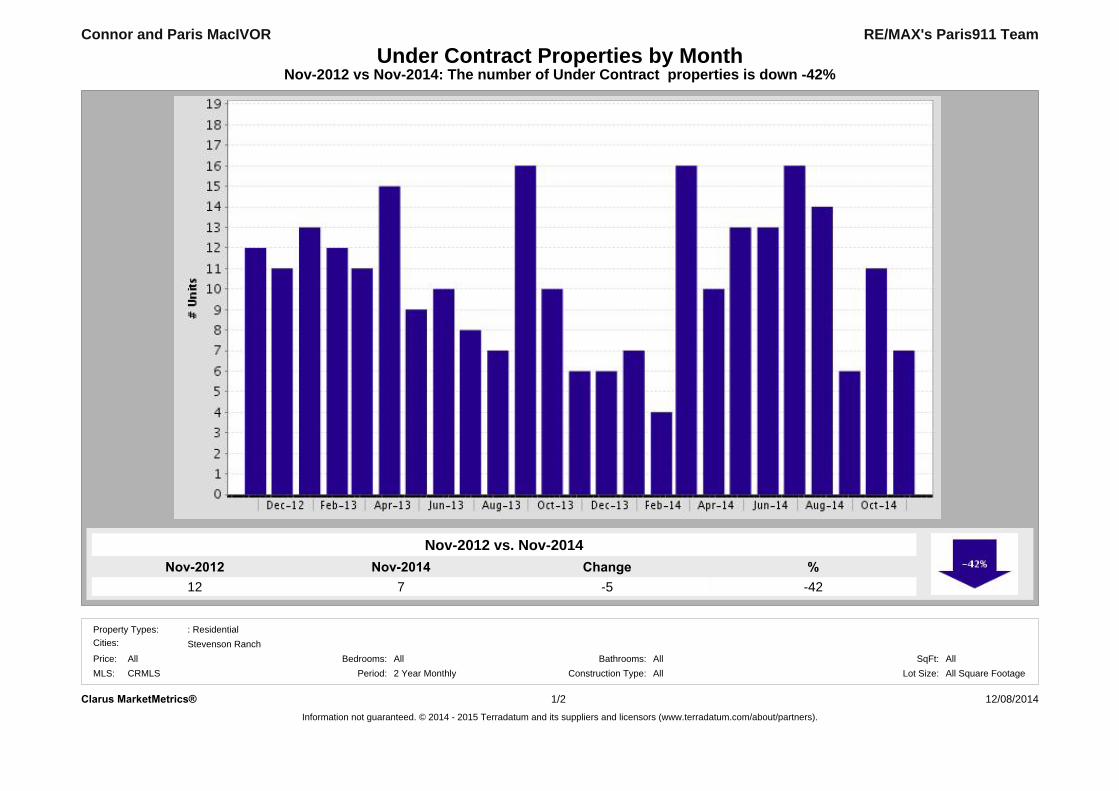
Nov-20147
Nov-201212
%-42
Change-5
Nov-2012 vs Nov-2014: The number of Under Contract properties is down -42%Under Contract Properties by Month
RE/MAX's Paris911 Team
Nov-2012 vs. Nov-2014
Connor and Paris MacIVOR
Clarus MarketMetrics® 12/08/2014Information not guaranteed. © 2014 - 2015 Terradatum and its suppliers and licensors (www.terradatum.com/about/partners).
1/2
AllBathrooms: SqFt:All
: Residential
All Square FootageConstruction Type: Lot Size:CRMLS
Stevenson Ranch
Period: 2 Year MonthlyPrice:MLS:
All AllAll
Property Types:
Bedrooms:
Cities:
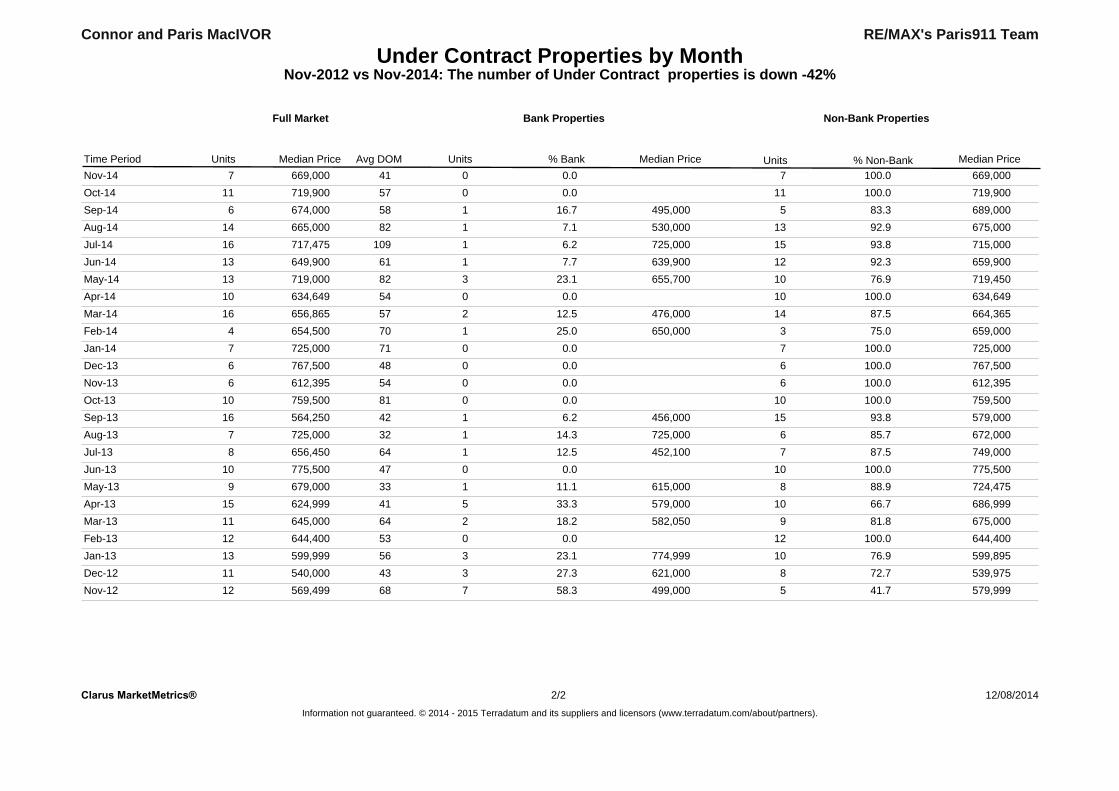
Under Contract Properties by MonthNov-2012 vs Nov-2014: The number of Under Contract properties is down -42%
RE/MAX's Paris911 TeamConnor and Paris MacIVOR
Median Price UnitsUnits Median Price% Non-Bank
Full Market
% BankAvg DOMMedian Price
Bank Properties
Units
Non-Bank Properties
Time PeriodNov-14 669,0007 41 669,000100.070.00Oct-14 719,90011 57 719,900100.0110.00Sep-14 674,0006 58 689,00083.35495,00016.71Aug-14 665,00014 82 675,00092.913530,0007.11Jul-14 717,47516 109 715,00093.815725,0006.21Jun-14 649,90013 61 659,90092.312639,9007.71May-14 719,00013 82 719,45076.910655,70023.13Apr-14 634,64910 54 634,649100.0100.00Mar-14 656,86516 57 664,36587.514476,00012.52Feb-14 654,5004 70 659,00075.03650,00025.01Jan-14 725,0007 71 725,000100.070.00Dec-13 767,5006 48 767,500100.060.00Nov-13 612,3956 54 612,395100.060.00Oct-13 759,50010 81 759,500100.0100.00Sep-13 564,25016 42 579,00093.815456,0006.21Aug-13 725,0007 32 672,00085.76725,00014.31Jul-13 656,4508 64 749,00087.57452,10012.51Jun-13 775,50010 47 775,500100.0100.00May-13 679,0009 33 724,47588.98615,00011.11Apr-13 624,99915 41 686,99966.710579,00033.35Mar-13 645,00011 64 675,00081.89582,05018.22Feb-13 644,40012 53 644,400100.0120.00Jan-13 599,99913 56 599,89576.910774,99923.13Dec-12 540,00011 43 539,97572.78621,00027.33Nov-12 569,49912 68 579,99941.75499,00058.37
Clarus MarketMetrics® 12/08/2014Information not guaranteed. © 2014 - 2015 Terradatum and its suppliers and licensors (www.terradatum.com/about/partners).
22/
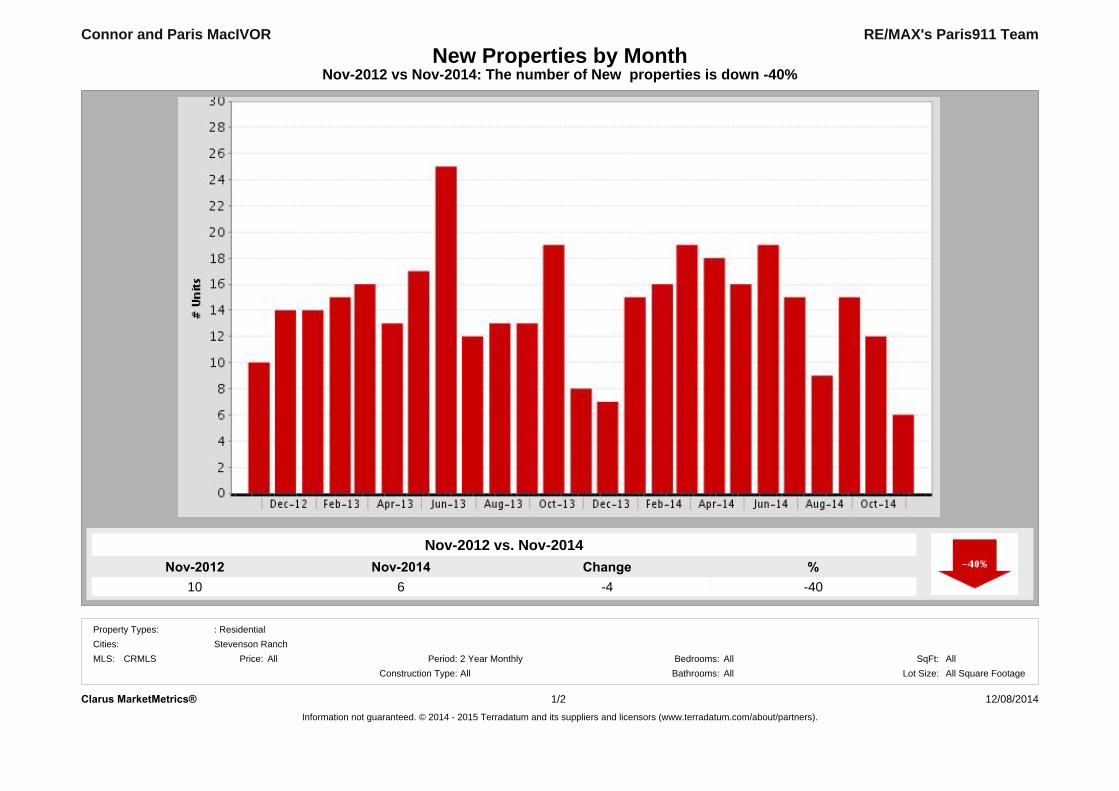
Nov-20146
Nov-201210
%-40
Change-4
Nov-2012 vs Nov-2014: The number of New properties is down -40%New Properties by Month
RE/MAX's Paris911 Team
Nov-2012 vs. Nov-2014
Connor and Paris MacIVOR
Clarus MarketMetrics® 12/08/2014Information not guaranteed. © 2014 - 2015 Terradatum and its suppliers and licensors (www.terradatum.com/about/partners).
1/2
MLS: CRMLS Bedrooms:AllAll
Construction Type:All2 Year Monthly SqFt:
Bathrooms: Lot Size:All All Square FootagePeriod:All
Cities:Property Types: : Residential
Stevenson RanchPrice:
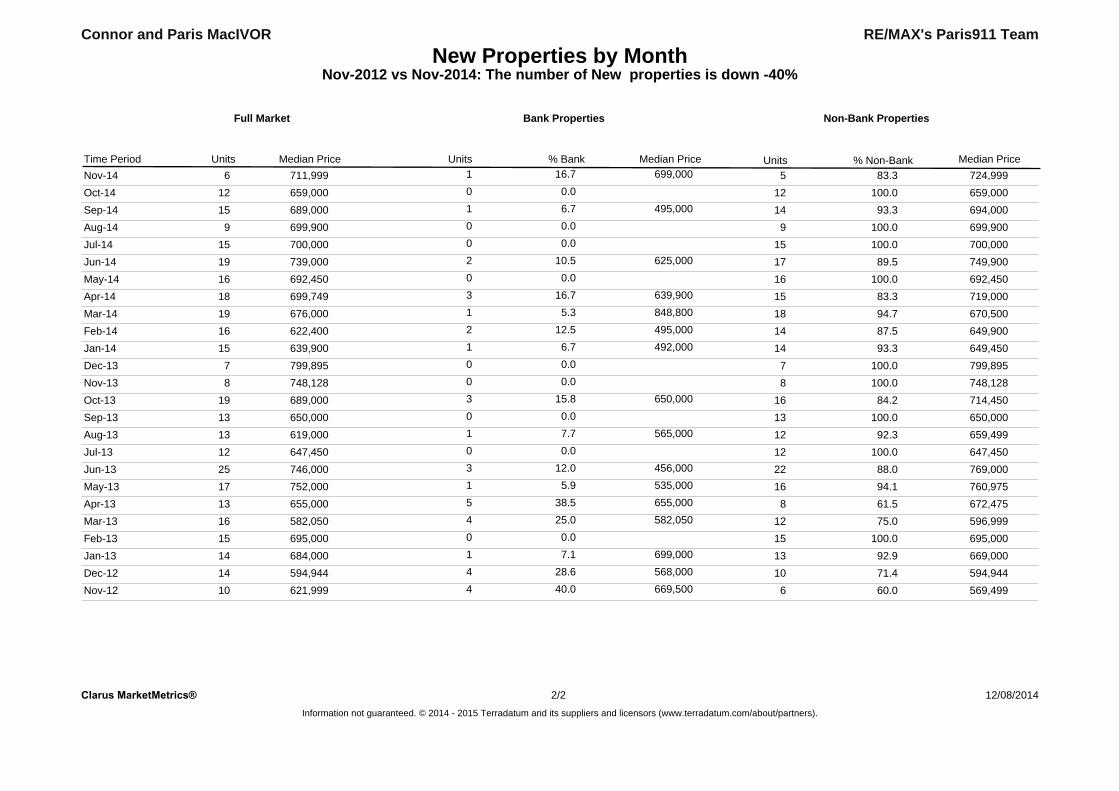
New Properties by MonthNov-2012 vs Nov-2014: The number of New properties is down -40%
RE/MAX's Paris911 TeamConnor and Paris MacIVOR
Median Price UnitsUnits Median Price% Non-Bank
Full Market
% BankMedian Price
Bank Properties
Units
Non-Bank Properties
Time PeriodNov-14 711,9996 1 16.7 699,000 5 83.3 724,999Oct-14 659,00012 0 0.0 12 100.0 659,000Sep-14 689,00015 1 6.7 495,000 14 93.3 694,000Aug-14 699,9009 0 0.0 9 100.0 699,900Jul-14 700,00015 0 0.0 15 100.0 700,000Jun-14 739,00019 2 10.5 625,000 17 89.5 749,900May-14 692,45016 0 0.0 16 100.0 692,450Apr-14 699,74918 3 16.7 639,900 15 83.3 719,000Mar-14 676,00019 1 5.3 848,800 18 94.7 670,500Feb-14 622,40016 2 12.5 495,000 14 87.5 649,900Jan-14 639,90015 1 6.7 492,000 14 93.3 649,450Dec-13 799,8957 0 0.0 7 100.0 799,895Nov-13 748,1288 0 0.0 8 100.0 748,128Oct-13 689,00019 3 15.8 650,000 16 84.2 714,450Sep-13 650,00013 0 0.0 13 100.0 650,000Aug-13 619,00013 1 7.7 565,000 12 92.3 659,499Jul-13 647,45012 0 0.0 12 100.0 647,450Jun-13 746,00025 3 12.0 456,000 22 88.0 769,000May-13 752,00017 1 5.9 535,000 16 94.1 760,975Apr-13 655,00013 5 38.5 655,000 8 61.5 672,475Mar-13 582,05016 4 25.0 582,050 12 75.0 596,999Feb-13 695,00015 0 0.0 15 100.0 695,000Jan-13 684,00014 1 7.1 699,000 13 92.9 669,000Dec-12 594,94414 4 28.6 568,000 10 71.4 594,944Nov-12 621,99910 4 40.0 669,500 6 60.0 569,499
Clarus MarketMetrics® 12/08/2014Information not guaranteed. © 2014 - 2015 Terradatum and its suppliers and licensors (www.terradatum.com/about/partners).
22/
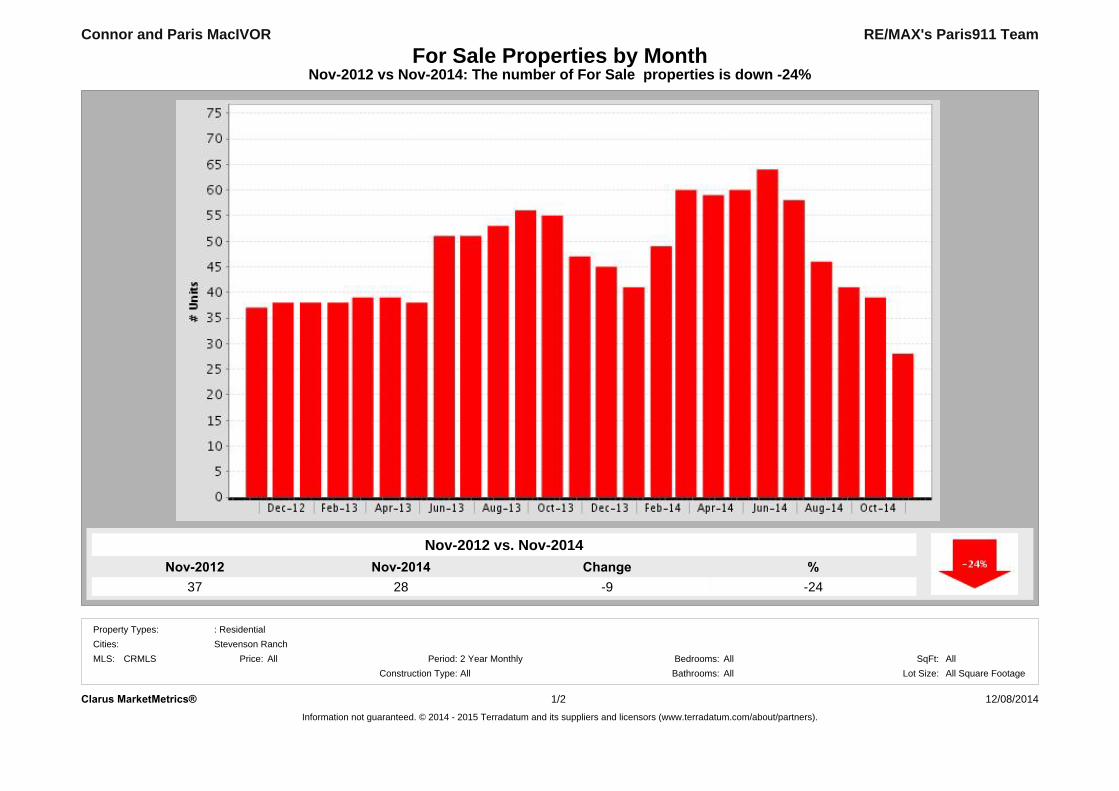
Nov-201428
Nov-201237
%-24
Change-9
Nov-2012 vs Nov-2014: The number of For Sale properties is down -24%For Sale Properties by Month
RE/MAX's Paris911 Team
Nov-2012 vs. Nov-2014
Connor and Paris MacIVOR
Clarus MarketMetrics® 12/08/2014Information not guaranteed. © 2014 - 2015 Terradatum and its suppliers and licensors (www.terradatum.com/about/partners).
1/2
MLS: CRMLS Bedrooms:AllAll
Construction Type:All2 Year Monthly SqFt:
Bathrooms: Lot Size:All All Square FootagePeriod:All
Cities:Property Types: : Residential
Stevenson RanchPrice:
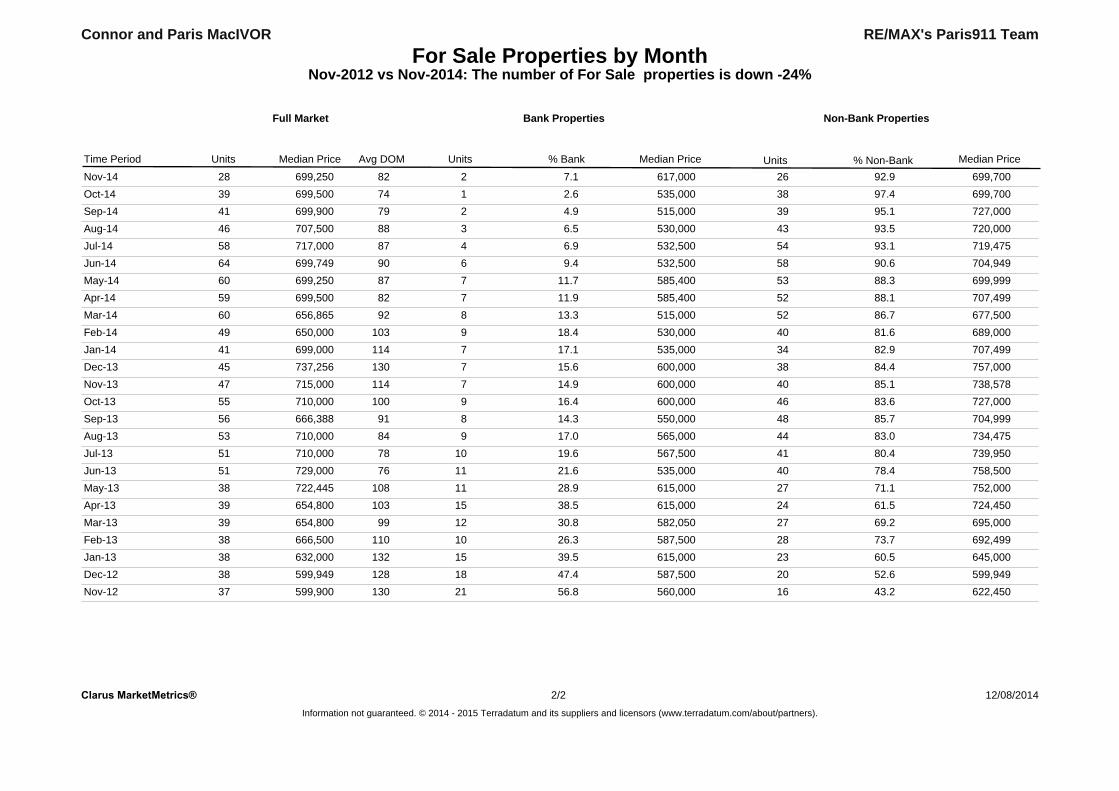
For Sale Properties by MonthNov-2012 vs Nov-2014: The number of For Sale properties is down -24%
RE/MAX's Paris911 TeamConnor and Paris MacIVOR
Median Price UnitsUnits Median Price% Non-Bank
Full Market
% BankAvg DOMMedian Price
Bank Properties
Units
Non-Bank Properties
Time Period
Nov-14 699,25028 82 2 7.1 617,000 26 92.9 699,700Oct-14 699,50039 74 1 2.6 535,000 38 97.4 699,700Sep-14 699,90041 79 2 4.9 515,000 39 95.1 727,000Aug-14 707,50046 88 3 6.5 530,000 43 93.5 720,000Jul-14 717,00058 87 4 6.9 532,500 54 93.1 719,475Jun-14 699,74964 90 6 9.4 532,500 58 90.6 704,949May-14 699,25060 87 7 11.7 585,400 53 88.3 699,999Apr-14 699,50059 82 7 11.9 585,400 52 88.1 707,499Mar-14 656,86560 92 8 13.3 515,000 52 86.7 677,500Feb-14 650,00049 103 9 18.4 530,000 40 81.6 689,000Jan-14 699,00041 114 7 17.1 535,000 34 82.9 707,499Dec-13 737,25645 130 7 15.6 600,000 38 84.4 757,000Nov-13 715,00047 114 7 14.9 600,000 40 85.1 738,578Oct-13 710,00055 100 9 16.4 600,000 46 83.6 727,000Sep-13 666,38856 91 8 14.3 550,000 48 85.7 704,999Aug-13 710,00053 84 9 17.0 565,000 44 83.0 734,475Jul-13 710,00051 78 10 19.6 567,500 41 80.4 739,950Jun-13 729,00051 76 11 21.6 535,000 40 78.4 758,500May-13 722,44538 108 11 28.9 615,000 27 71.1 752,000Apr-13 654,80039 103 15 38.5 615,000 24 61.5 724,450Mar-13 654,80039 99 12 30.8 582,050 27 69.2 695,000Feb-13 666,50038 110 10 26.3 587,500 28 73.7 692,499Jan-13 632,00038 132 15 39.5 615,000 23 60.5 645,000Dec-12 599,94938 128 18 47.4 587,500 20 52.6 599,949Nov-12 599,90037 130 21 56.8 560,000 16 43.2 622,450
Clarus MarketMetrics® 12/08/2014Information not guaranteed. © 2014 - 2015 Terradatum and its suppliers and licensors (www.terradatum.com/about/partners).
22/
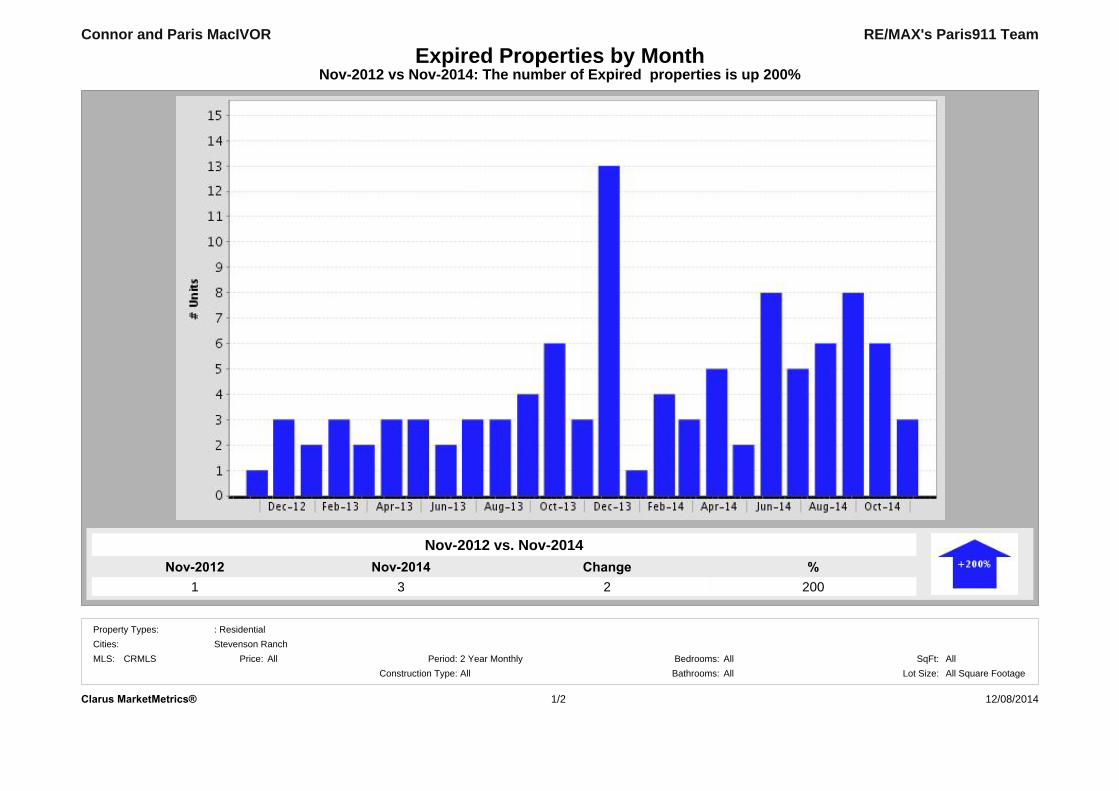
Nov-20143
Nov-20121
%200
Change2
Nov-2012 vs Nov-2014: The number of Expired properties is up 200%Expired Properties by Month
RE/MAX's Paris911 Team
Nov-2012 vs. Nov-2014
Connor and Paris MacIVOR
12/08/2014Clarus MarketMetrics® 1/2
MLS: CRMLS Bedrooms:AllAll
Construction Type:All2 Year Monthly SqFt:
Bathrooms: Lot Size:All All Square FootagePeriod:All
Cities:Property Types: : Residential
Stevenson RanchPrice:
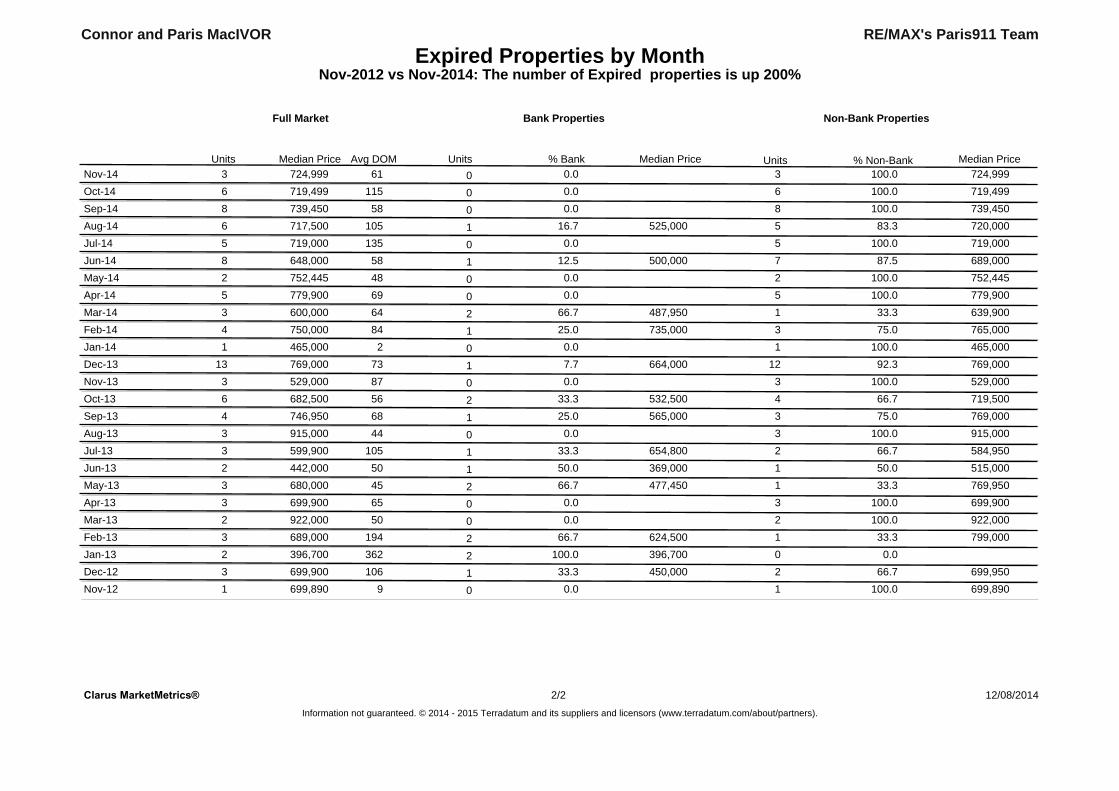
Expired Properties by MonthNov-2012 vs Nov-2014: The number of Expired properties is up 200%
RE/MAX's Paris911 TeamConnor and Paris MacIVOR
Median Price Units% BankAvg DOMUnits Median Price
Bank Properties
Units
Non-Bank Properties
% Non-Bank Median Price
Full Market
Nov-14 724,9993 61 0 0.0 3 100.0 724,999Oct-14 719,4996 115 0 0.0 6 100.0 719,499Sep-14 739,4508 58 0 0.0 8 100.0 739,450Aug-14 717,5006 105 1 16.7 525,000 5 83.3 720,000Jul-14 719,0005 135 0 0.0 5 100.0 719,000Jun-14 648,0008 58 1 12.5 500,000 7 87.5 689,000May-14 752,4452 48 0 0.0 2 100.0 752,445Apr-14 779,9005 69 0 0.0 5 100.0 779,900Mar-14 600,0003 64 2 66.7 487,950 1 33.3 639,900Feb-14 750,0004 84 1 25.0 735,000 3 75.0 765,000Jan-14 465,0001 2 0 0.0 1 100.0 465,000Dec-13 769,00013 73 1 7.7 664,000 12 92.3 769,000Nov-13 529,0003 87 0 0.0 3 100.0 529,000Oct-13 682,5006 56 2 33.3 532,500 4 66.7 719,500Sep-13 746,9504 68 1 25.0 565,000 3 75.0 769,000Aug-13 915,0003 44 0 0.0 3 100.0 915,000Jul-13 599,9003 105 1 33.3 654,800 2 66.7 584,950Jun-13 442,0002 50 1 50.0 369,000 1 50.0 515,000May-13 680,0003 45 2 66.7 477,450 1 33.3 769,950Apr-13 699,9003 65 0 0.0 3 100.0 699,900Mar-13 922,0002 50 0 0.0 2 100.0 922,000Feb-13 689,0003 194 2 66.7 624,500 1 33.3 799,000Jan-13 396,7002 362 2 100.0 396,700 0 0.0Dec-12 699,9003 106 1 33.3 450,000 2 66.7 699,950Nov-12 699,8901 9 0 0.0 1 100.0 699,890
Clarus MarketMetrics® 12/08/2014Information not guaranteed. © 2014 - 2015 Terradatum and its suppliers and licensors (www.terradatum.com/about/partners).
22/
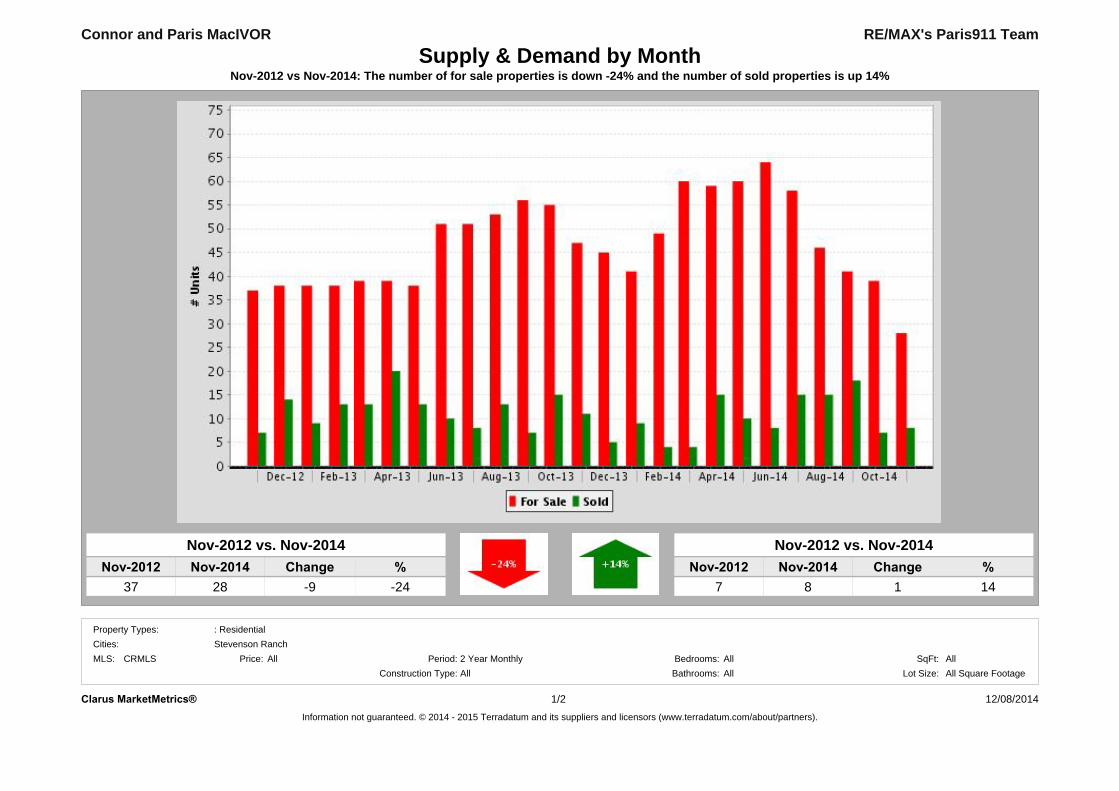
Nov-2012 vs Nov-2014: The number of for sale properties is down -24% and the number of sold properties is up 14%
RE/MAX's Paris911 Team
Nov-2012 vs. Nov-2014
37 -24
Connor and Paris MacIVOR
28Nov-2014
Supply & Demand by Month
ChangeNov-2012 %-9
Nov-2012 Nov-2014 %7 14
Nov-2012 vs. Nov-2014
8Change
1
Clarus MarketMetrics® 12/08/2014Information not guaranteed. © 2014 - 2015 Terradatum and its suppliers and licensors (www.terradatum.com/about/partners).
1/2
MLS: CRMLS Bedrooms:AllAll
Construction Type:All2 Year Monthly SqFt:
Bathrooms: Lot Size:All All Square FootagePeriod:All
Cities:Property Types: : Residential
Stevenson RanchPrice:
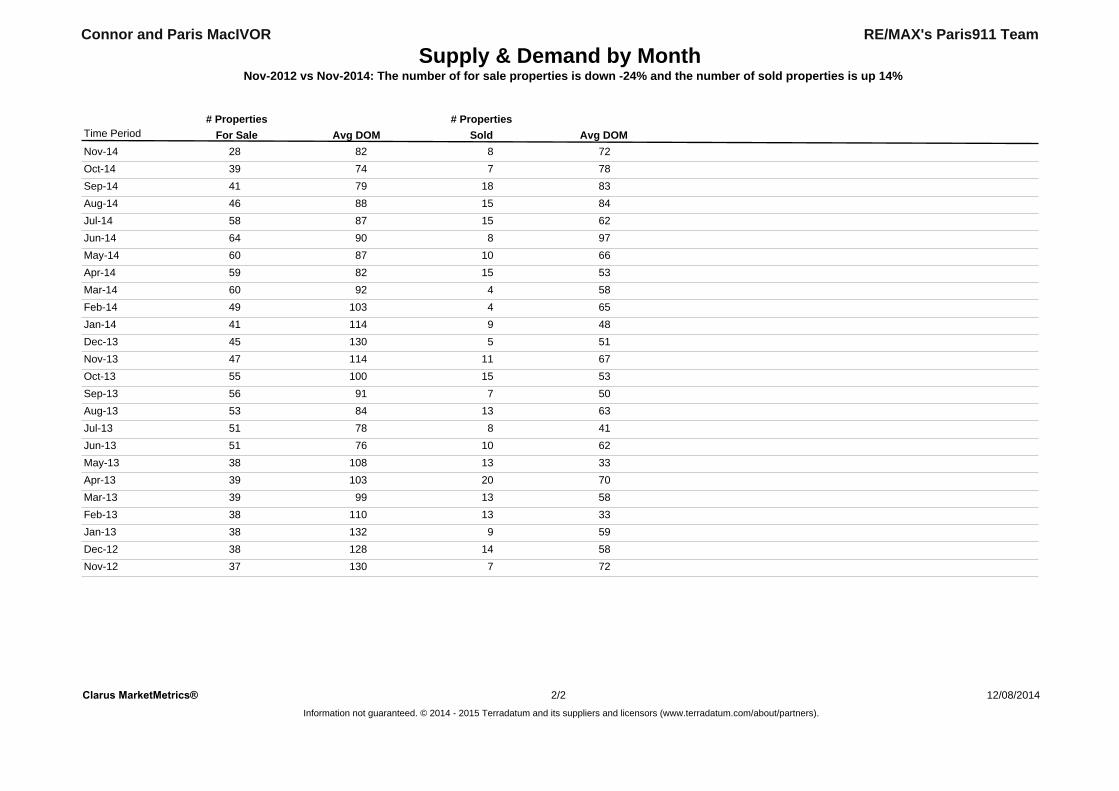
Supply & Demand by MonthNov-2012 vs Nov-2014: The number of for sale properties is down -24% and the number of sold properties is up 14%
Connor and Paris MacIVOR RE/MAX's Paris911 Team
For Sale Sold# Properties
Avg DOM Avg DOM# Properties
Time Period
Nov-14 82 7228 8Oct-14 74 7839 7Sep-14 79 8341 18Aug-14 88 8446 15Jul-14 87 6258 15Jun-14 90 9764 8May-14 87 6660 10Apr-14 82 5359 15Mar-14 92 5860 4Feb-14 103 6549 4Jan-14 114 4841 9Dec-13 130 5145 5Nov-13 114 6747 11Oct-13 100 5355 15Sep-13 91 5056 7Aug-13 84 6353 13Jul-13 78 4151 8Jun-13 76 6251 10May-13 108 3338 13Apr-13 103 7039 20Mar-13 99 5839 13Feb-13 110 3338 13Jan-13 132 5938 9Dec-12 128 5838 14Nov-12 130 7237 7
Clarus MarketMetrics® 12/08/2014Information not guaranteed. © 2014 - 2015 Terradatum and its suppliers and licensors (www.terradatum.com/about/partners).
22/
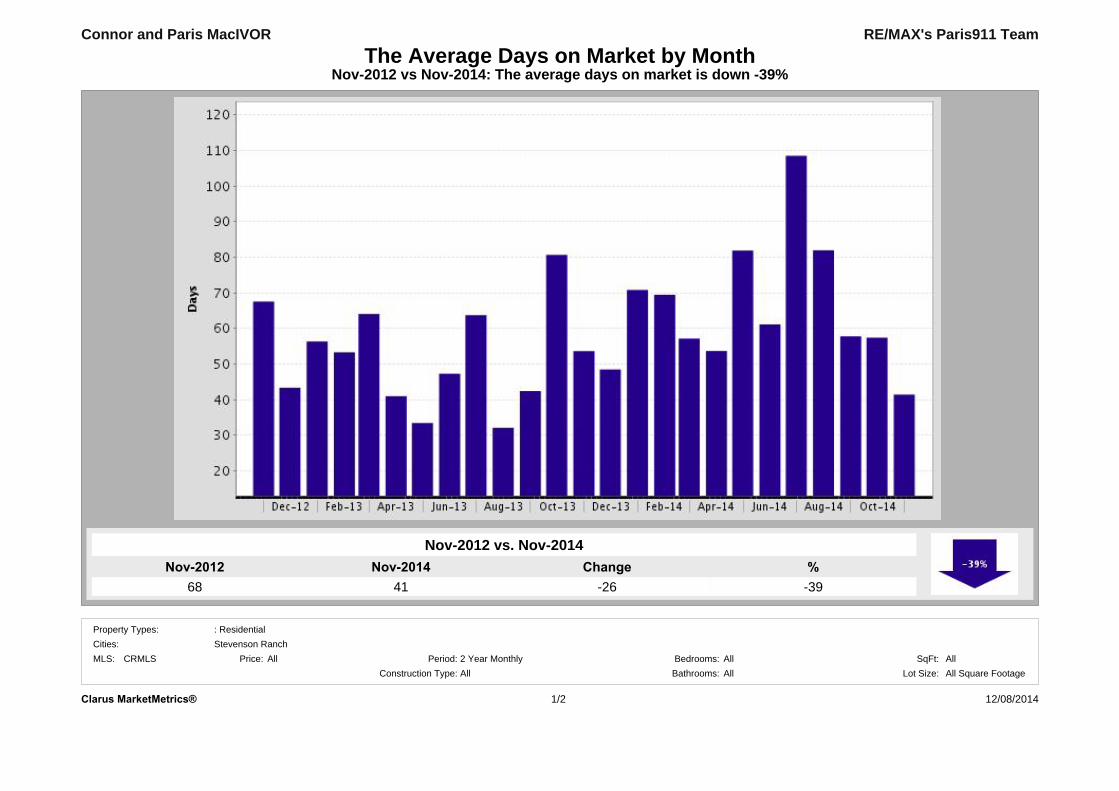
Nov-201441
Nov-201268
%-39
Change-26
Nov-2012 vs Nov-2014: The average days on market is down -39%The Average Days on Market by Month
RE/MAX's Paris911 Team
Nov-2012 vs. Nov-2014
Connor and Paris MacIVOR
Stevenson RanchAll 2 Year Monthly
Cities:Period:Price:
Property Types: : Residential
12/08/20141/2Clarus MarketMetrics®
All Square FootageBedrooms: All AllSqFt:
All Lot Size:Bathrooms:AllConstruction Type:MLS: CRMLS
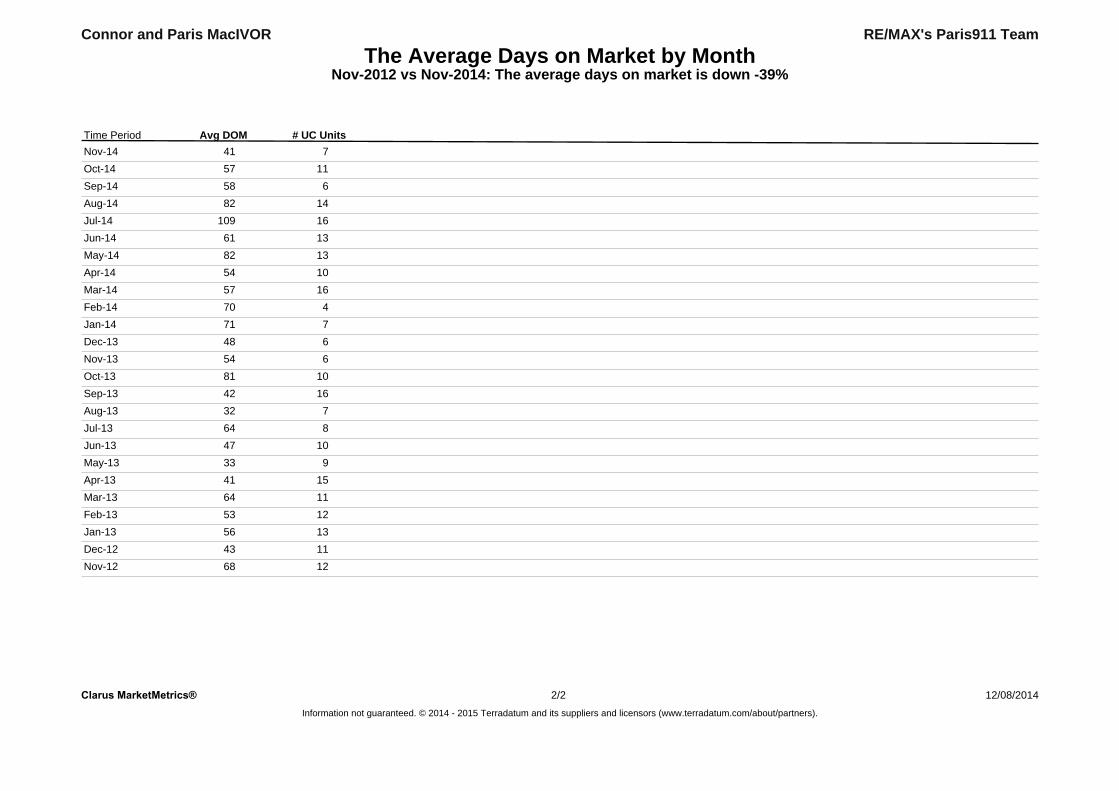
The Average Days on Market by MonthNov-2012 vs Nov-2014: The average days on market is down -39%
RE/MAX's Paris911 TeamConnor and Paris MacIVOR
# UC UnitsAvg DOMTime PeriodNov-14 741Oct-14 1157Sep-14 658Aug-14 1482Jul-14 16109Jun-14 1361May-14 1382Apr-14 1054Mar-14 1657Feb-14 470Jan-14 771Dec-13 648Nov-13 654Oct-13 1081Sep-13 1642Aug-13 732Jul-13 864Jun-13 1047May-13 933Apr-13 1541Mar-13 1164Feb-13 1253Jan-13 1356Dec-12 1143Nov-12 1268
Clarus MarketMetrics® 2/2 12/08/2014Information not guaranteed. © 2014 - 2015 Terradatum and its suppliers and licensors (www.terradatum.com/about/partners).
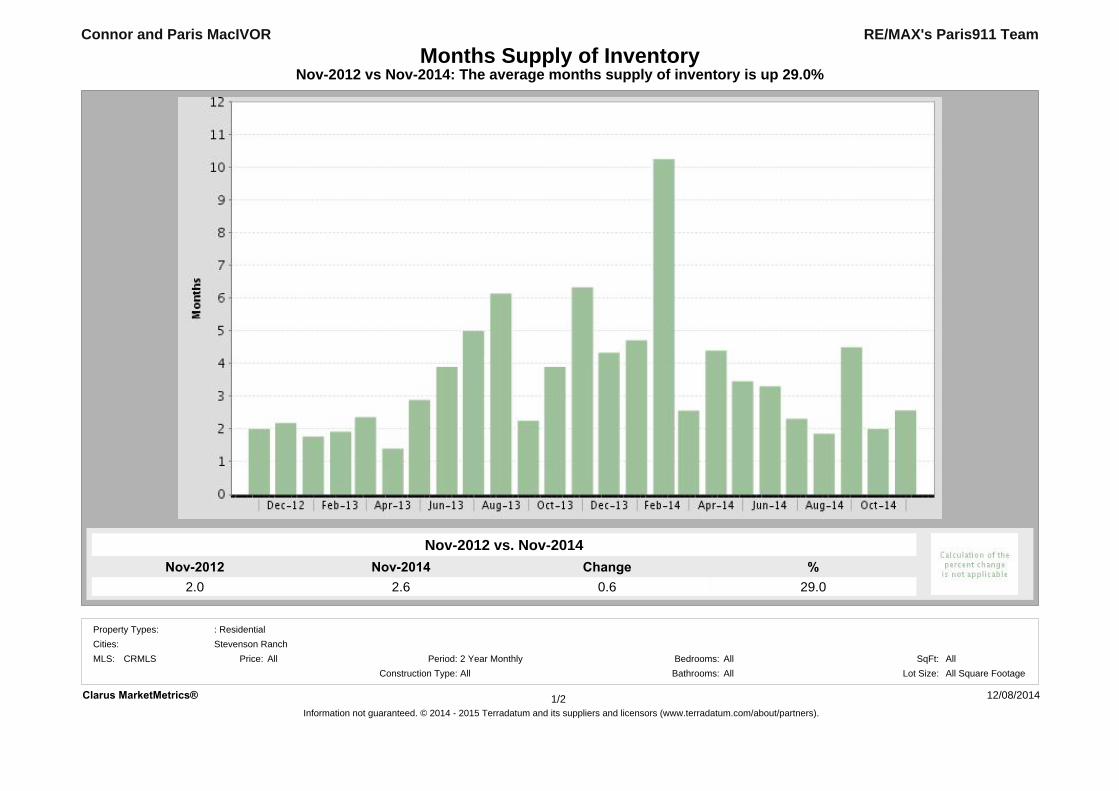
Nov-2012 vs Nov-2014: The average months supply of inventory is up 29.0%
RE/MAX's Paris911 Team
Nov-2012 vs. Nov-2014
2.0 29.0
Connor and Paris MacIVOR
2.6Nov-2014
Months Supply of Inventory
ChangeNov-2012 %0.6
Clarus MarketMetrics® 12/08/2014Information not guaranteed. © 2014 - 2015 Terradatum and its suppliers and licensors (www.terradatum.com/about/partners).
1/2
MLS: CRMLS Bedrooms:AllAll
Construction Type:All2 Year Monthly SqFt:
Bathrooms: Lot Size:All All Square FootagePeriod:All
Cities:Property Types: : Residential
Stevenson RanchPrice:
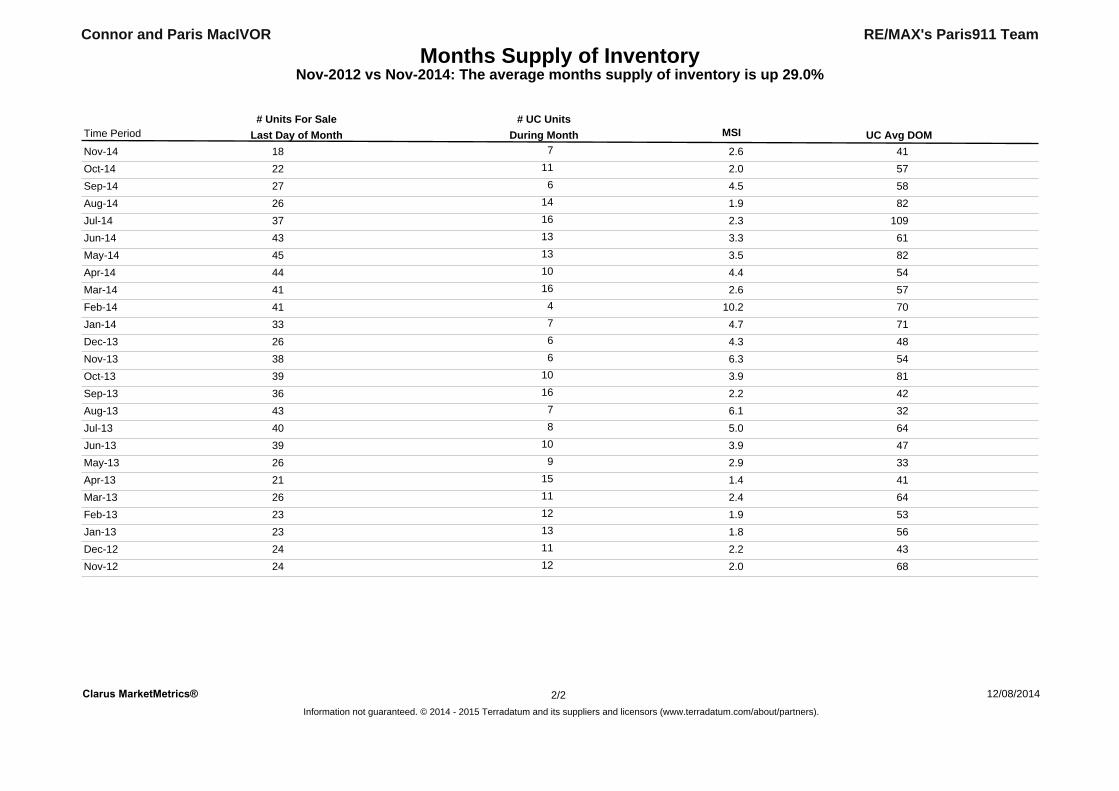
Months Supply of InventoryNov-2012 vs Nov-2014: The average months supply of inventory is up 29.0%
Connor and Paris MacIVOR RE/MAX's Paris911 Team
During MonthLast Day of Month MSI# Units For Sale # UC Units
UC Avg DOMTime Period
Nov-14 7 4118 2.6Oct-14 11 5722 2.0Sep-14 6 5827 4.5Aug-14 14 8226 1.9Jul-14 16 10937 2.3Jun-14 13 6143 3.3May-14 13 8245 3.5Apr-14 10 5444 4.4Mar-14 16 5741 2.6Feb-14 4 7041 10.2Jan-14 7 7133 4.7Dec-13 6 4826 4.3Nov-13 6 5438 6.3Oct-13 10 8139 3.9Sep-13 16 4236 2.2Aug-13 7 3243 6.1Jul-13 8 6440 5.0Jun-13 10 4739 3.9May-13 9 3326 2.9Apr-13 15 4121 1.4Mar-13 11 6426 2.4Feb-13 12 5323 1.9Jan-13 13 5623 1.8Dec-12 11 4324 2.2Nov-12 12 6824 2.0
Clarus MarketMetrics® 12/08/2014Information not guaranteed. © 2014 - 2015 Terradatum and its suppliers and licensors (www.terradatum.com/about/partners).
22/