Embed Size (px)
Citation preview
RetailREIT
Investor UpdateMay 2015

SRT Executive Summary
• Pure Play: 100% U.S. grocery-anchored asset base
• Focused Strategy: Build scale in large urban markets, diversifying across top grocers
• Embedded Growth: In-place rents are significantly below market; limited new supply
• Aligned Manager: Slate Asset Management LP has ~8% ownership of Slate Retail REIT
• U.S. REIT Structure: Strong cash flow coupled with conservative payout geared for
growth
Slate Retail REIT | 2

Why We’re Focused on GroceryOur strategy offers several attractive
characteristics in a volatile investment
landscape.
• The grocery business is non-cyclical and less
susceptible to economic fluctuation
• Grocery retailing is least threatened by the
increasing popularity of e-commerce
• Assets can be acquired in large U.S. markets for
significantly below replacement value
• Strong performing shopping centres with embedded
rental rate growth delivers “total returns”
99%Grocery purchases in the U.S. made in store
$884 blnU.S. grocery sales annually—the largest consumer segment by 70%
Source: Kantar Group, U.S. Commerce Department
Slate Retail REIT | 3

Significant Opportunity to GrowSlate Retail’s U.S. focus gives it access to more large markets than its Canadian peers—there are
51 U.S. cities with populations over 1 million. In Canada, there are six.
Large, fragmented U.S. investment landscape provides an opportunity to develop scale
Slate Retail ranks high amongst its peers in exposure to markets with over 1 million population
37,000 grocery storesnation-wide
<1% owned by largestlandlord
9%
19%
28% 28%
45%
66%72%
85%
Source: U.S. Census Bureau , Progressive Grocer Source: GMP Securities, company reports
Slate Retail REIT | 4

U.S. REIT StructureSlate Retail’s conservative approach provides stability and frees up cash flow for
future growth opportunities while still offering an attractive yield.
80.0%
66.3% 64.3%
77.9% 78.9%
87.1%
47.6%
85.5%82.3% 83.5% 81.1% 80.9%
90.8%
69.0%
Source: CIBC, SNL Financial, FactSet, company reports
U.S. Average: 71.7% Canada Average: 84.0% SRT
Slate Retail REIT | 5

The Best Exposure to GroceryAmong its North American peers, Slate Retail in the only vehicle with a 100%
grocery-anchored asset base.
100% 98%
87% 86% 84%
75% 75% 74% 73% 71%64%
57%50%
22% 20%
Source: GMP Securities, company reports
Slate Retail REIT | 6
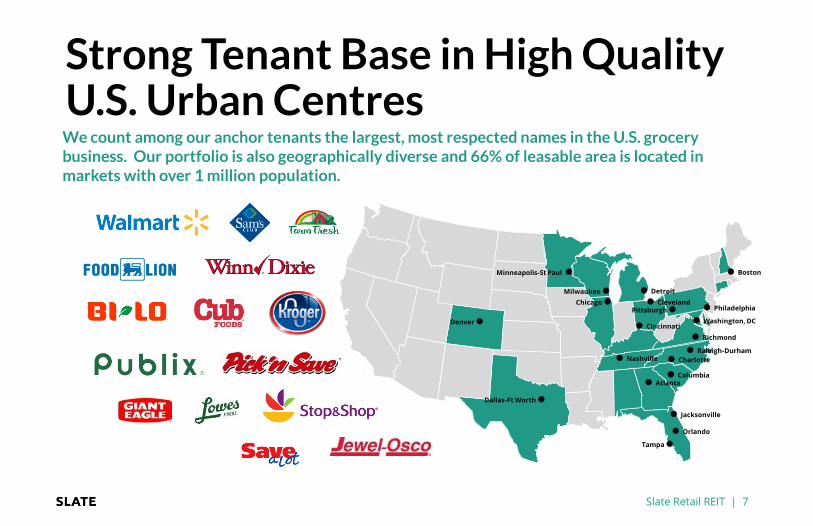
Strong Tenant Base in High Quality U.S. Urban Centres
Dallas-Ft Worth
Orlando
Minneapolis-St Paul
Tampa
Denver
Jacksonville
Philadelphia
Raleigh-Durham
Atlanta
Nashville
Washington, DC
Pittsburgh Cleveland
DetroitMilwaukee
Cincinnati
Charlotte
Boston
Richmond
Columbia
We count among our anchor tenants the largest, most respected names in the U.S. grocery business. Our portfolio is also geographically diverse and 66% of leasable area is located in markets with over 1 million population.
Slate Retail REIT | 7
Chicago

Well-Positioned in the CycleOccupancy has risen against a backdrop of diminished supply—a perfect
combination that’s fueling meaningful rental growth.
Net Completions of U.S. Community and Neighbourhood Shopping Centres 1999-2013 (Left)Grocery-Anchored Supermarkets and Shopping Centres Occupancy (Right)
Source: CoStar
784 755647 611
692783
883 890 847751
351
134 112 89 69
94.5%
94.1%
93.4%93.0%
93.2%93.4%
93.9%
91.0%
91.5%
92.0%
92.5%
93.0%
93.5%
94.0%
94.5%
95.0%
0
100
200
300
400
500
600
700
800
900
1,000
1999 2000 2001 2002 2003 2004 2005 2006 2007 2008 2009 2010 2011 2012 2013
Slate Retail REIT | 8
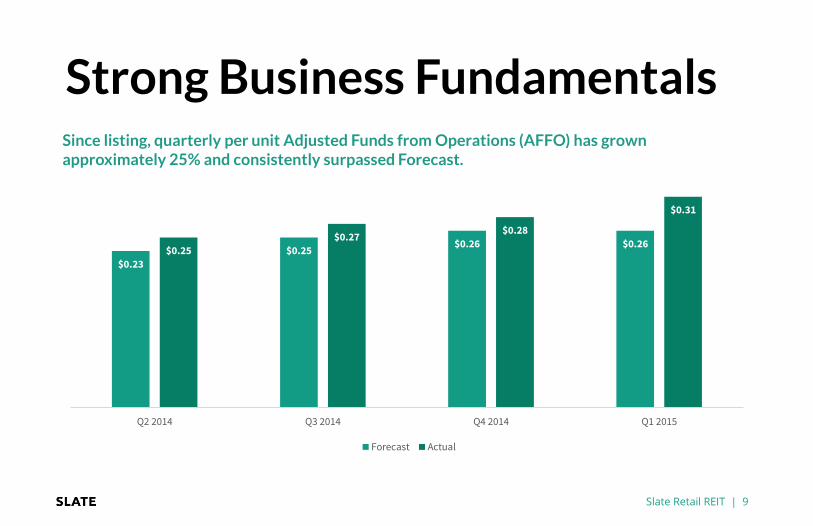
Strong Business Fundamentals
$0.23
$0.25 $0.26 $0.26
$0.25
$0.27 $0.28
$0.31
Q2 2014 Q3 2014 Q4 2014 Q1 2015
Forecast Actual
Since listing, quarterly per unit Adjusted Funds from Operations (AFFO) has grown approximately 25% and consistently surpassed Forecast.
Slate Retail REIT | 9
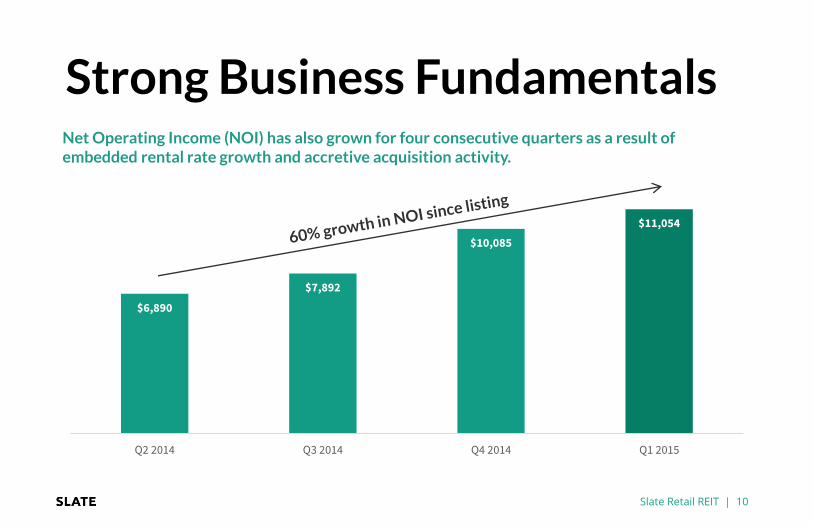
$6,890
$7,892
$10,085
$11,054
Q2 2014 Q3 2014 Q4 2014 Q1 2015
Strong Business FundamentalsNet Operating Income (NOI) has also grown for four consecutive quarters as a result of embedded rental rate growth and accretive acquisition activity.
Slate Retail REIT | 10

Strong Business FundamentalsSlate Retail REIT is a preferred counterparty and among the most active acquirers in the U.S. grocery-anchored segment. Since launching in 2011 our U.S. platform has acquired 59 assets in 56 separate transactions.
Initial PortfolioAcquisitions Since
Listing*SUSO 3 "Vend-In" Total
Assets 29 17 13 59
Square Feet (millions) 3.5 1.9 1.5 6.9
Cost Basis (millions) $435.0 $222.7 $195.0 $852.7
Cost Basis Per Square Foot $124 $117 $130 $124
*Includes committed transactions as at May 2015
Slate Retail REIT | 11

Strong Business FundamentalsWe estimate that Slate Retail REIT’s average portfolio rent is as much as 30% below market which, coupled with our hands-on approach to leasing, has generated consistently positive lease renewal spreads.
6.5%
5.7%
7.3%
8.7%
5.0%
5.5%
6.0%
6.5%
7.0%
7.5%
8.0%
8.5%
9.0%
Q3 2014 Q4 2014 YE 2014 Q1 2015
Tenants <10,000 Square Feet
Renewals Completed 22 21 59 14
Renewed Square Feet 42.2k 66.5k 166.0k 26.8k
Rental Rate Spreads on Renewal for Tenants Below 10,000 Square Feet
Slate Retail REIT | 12

An Experienced Manager with a Proven Track RecordSlate Retail leverages the sophisticated operations platform of real estate-focused owner-operator, Slate Asset Management LP.
Slate Retail REIT(TSX:SRT.un/SRT.u)
Slate Office REIT(TSX:SOT.un)
U.S. grocery-anchored retail Canadian “non-core” office focus
Private Alternative Investments
Canadian core and suburban office portfolios; western Canadian industrial and retail properties
Privately held partnerships with institutional equity Public REITs with institutional and retail equity
$2.5 billion AUM
Slate Retail REIT | 13
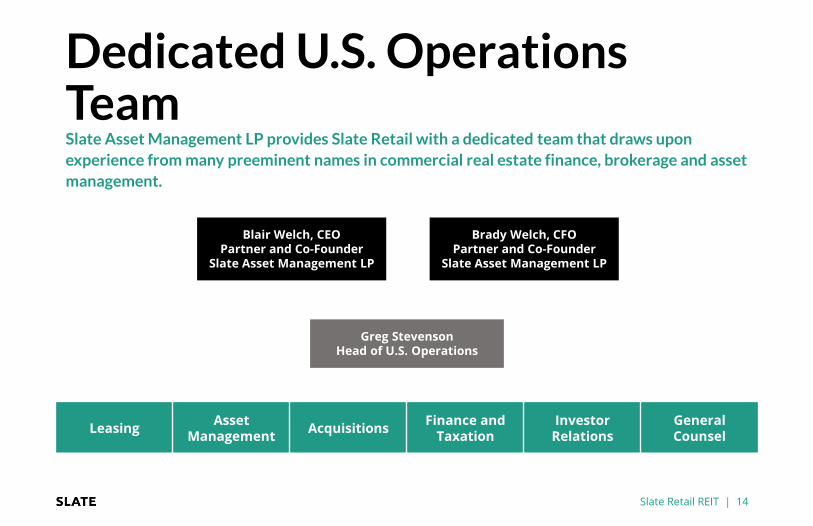
Dedicated U.S. Operations TeamSlate Asset Management LP provides Slate Retail with a dedicated team that draws upon
experience from many preeminent names in commercial real estate finance, brokerage and asset
management.
Greg StevensonHead of U.S. Operations
Blair Welch, CEOPartner and Co-Founder
Slate Asset Management LP
Brady Welch, CFOPartner and Co-Founder
Slate Asset Management LP
LeasingAsset
ManagementAcquisitions
Finance and Taxation
Investor Relations
General Counsel
Slate Retail REIT | 14

Best-in-Class GovernanceCommitted to strong governance, Slate Retail’s majority independent Board of Trustees brings
together a strategic combination of skillsets with vast real estate, finance and cross-border
experience.Committee
Independent Audit InvestmentCompensation,
Governance and Nomination
Tom Farley (Chair)Brookfield Canada Office Properties
Yes (Chair)
Sam Altman, JD, CFAJoddes Limited
Yes
Colum Bastable, FCA (IRL)Cushman & Wakefield
Yes (Chair)
Patrick FlatleyFidelity National Title Insurance
Yes
Peter Tesché, CFAP.T. Lloyd Associates
Yes (Chair)
Blair WelchSlate Asset Management LP
No
Brady WelchSlate Asset Management LP
No
Slate Retail REIT | 15

Alignment-Based Fee StructureAs an owner, we avoid high cost management contracts that do not produce results. With a
performance-based fee structure, the manager is incented to grow the platform with fellow
unitholders.
• Annual asset management fee equal to 40 bps of Gross Book Value
• Performance fee totalling 15% of FFO per unit above $1.28 (plus inflation mechanism)
• One-time acquisition fee equal to 75 bps of gross acquisition cost, capitalized upon closing
• No leasing, property management, construction, re-financing or disposition fees
• Unitholders have a clear path to internalization at $750 million of market capitalization
Slate Retail REIT | 16

Clear Growth StrategyInternally through below market rents, property enhancements and repositioning programs
How we do it:
• Implement a dedicated Slate U.S. operations team
• Eliminate operating inefficiencies
• Establish and cultivate relationships with anchor tenants
• Deploy top local leasing and property management professionals
Externally through our robust and growing pipeline of highly accretive acquisition opportunities
How we do it:
• Leverage reputation as preferred counterparty
• Acquire at discounts to peak and replacement value
• Identify large U.S. markets offering opportunity for scale
• Focus on well-developed retail nodes with strong economic/demographic fundamentals and limited risk of new development
Slate Retail REIT | 17

Sample Deal #1:
Westhaven Town CenterFranklin (Nashville), Tennessee
Acquired at significant discount to replacement cost• Sold by a motivated developer in need capital for unrelated projects,
Slate acquired Westhaven for an $149 per square foot
• Comparable shopping centres trade in the mid-6% cap rate range
Growing trade area with strong retail presence• Westhaven is the focal point of a master-planned community; Franklin
growth has surpassed that of the surrounding MSA and state
• Entry to the market of Publix, Whole Foods, Target and Walmart validates local demographic strength.
Compelling yield and attractive returns• Acquired at over an 8.0% cap rate; annual cash-on-cash returns of
~11%
Slate Retail REIT | 18

Westhaven Town CenterFranklin (Nashville), Tennessee
GLA (square feet) 97,052
Year Built 2008
Acquisition Date December 2012
Purchase Price $14.5 million
Per Square Foot $149
Occupancy 96.4%
AnchorHarris Teeter
(Kroger Co.)
5-mile demographics
Population 51,201
Avg. HH income $98,089
Cumulative % GLA Expiring NOI ($000s)
Update: It was announced in April 2015 that the Westhaven Harris Teeter will undergo a $3 million transformation into a Kroger Marketplace—the cost of which will be borne by the tenant. The anchor lease expires in late 2029.
$1,266$1,309 $1,298 $1,273
$1,309 $1,286
0.0%
25.0%
50.0%
75.0%
$1,000
$1,250
$1,500
2015 2016 2017 2018 2019 2020
Slate Retail REIT | 19

Sample Deal #2
Independence SquareCharlotte, North Carolina
Value created on acquisition • Slate assembled two adjacent “off-market” properties, each with a
grocery anchor, for a combined 8.2% cap rate
• Walmart Neighbourhood Market has 12.5 years of lease term—comparable stores typically trade in the low-6% cap rate range
• Super G Mart is a popular international foods grocer with growing sales and 15 years of lease term remaining
Strategic location• The property is situated in a highly populated in-fill node with great
visibility and signage along a major thoroughfare
• Minimal grocery competition within a three mile radius—the closest grocery stores are 1.5 miles to the north and 3 miles to the south
Slate Retail REIT | 20

GLA (square feet) 190,361
Year Built 1986/2000
Acquisition Date July 2013
Purchase Price $22.9 million
Per Square Foot $120
Occupancy 97.5%
AnchorsWalmart
Super G Mart
5-mile demographics
Population 212,950
Avg. HH income $76,904
Update: In December 2014, Independence Square was re-financed with 10-year 3.8% fixed-rate debt that valued the asset at a 6.75% cap rate. Equity repatriation of ~$2.1 million facilitated an SRT acquisition generating an additional $350k of Net Operating Income. The LTV ratio was unchanged.
Independence SquareCharlotte, North Carolina
Cumulative % GLA Expiring NOI ($000s)
$1,936
$2,008$2,065 $2,085 $2,107
$2,147
0.0%
25.0%
50.0%
$1,750
$2,000
$2,250
2015 2016 2017 2018 2019 2020
Slate Retail REIT | 21
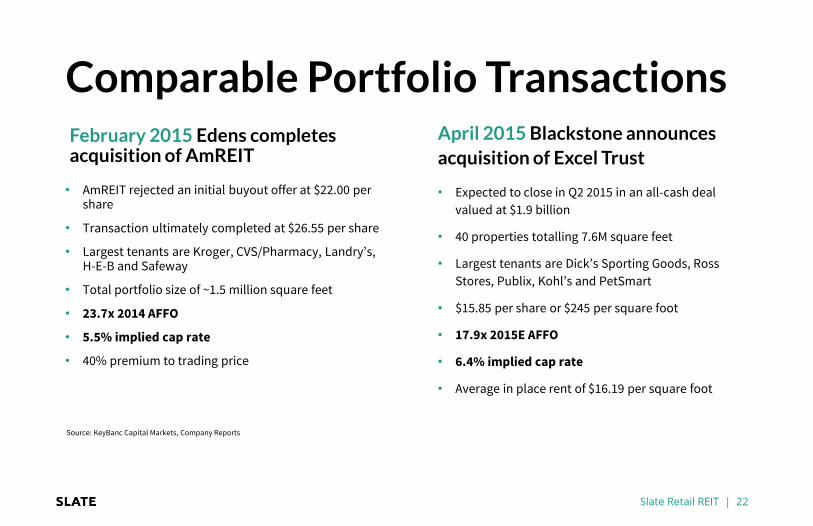
Comparable Portfolio TransactionsApril 2015 Blackstone announces
acquisition of Excel Trust
• Expected to close in Q2 2015 in an all-cash deal
valued at $1.9 billion
• 40 properties totalling 7.6M square feet
• Largest tenants are Dick’s Sporting Goods, Ross
Stores, Publix, Kohl’s and PetSmart
• $15.85 per share or $245 per square foot
• 17.9x 2015E AFFO
• 6.4% implied cap rate
• Average in place rent of $16.19 per square foot
Source: KeyBanc Capital Markets, Company Reports
February 2015 Edens completes acquisition of AmREIT
• AmREIT rejected an initial buyout offer at $22.00 per share
• Transaction ultimately completed at $26.55 per share
• Largest tenants are Kroger, CVS/Pharmacy, Landry’s, H-E-B and Safeway
• Total portfolio size of ~1.5 million square feet
• 23.7x 2014 AFFO
• 5.5% implied cap rate
• 40% premium to trading price
Slate Retail REIT | 22

Rent and Cap Rate Comparables
Market StateCapRate
Rent Per Square Foot Occupancy MSA State
CapRate
Rent Per Square Foot Occupancy
Atlanta GA 6.5% $ 12.67 91% Miami FL 5.9% $ 15.03 92%
Baltimore MD 6.2% $ 15.75 97% Greensboro NC 7.2% $ 10.96 91%
Boston MA 6.1% $ 16.95 98% Houston TX 6.5% $ 13.62 96%
Buffalo NY 7.2% $ 10.22 90% Jacksonville FL 6.5% $ 12.42 89%
Charleston SC 6.8% $ 10.87 90% Memphis TN 7.0% $ 12.00 94%
Charlotte NC 6.5% $ 14.11 91% Minneapolis MN 6.7% $ 12.68 95%
Charlottesville VA 6.2% $ 21.10 96% Nashville TN 7.0% $ 10.39 94%
Chicago IL 6.4% $ 15.18 95% New York NY 5.6% $ 22.10 96%
Cincinnati OH 7.2% $ 12.33 96% Orlando FL 6.6% $ 14.88 90%
Cleveland OH 7.2% $ 11.28 92% Philadelphia PA 6.4% $ 16.01 95%
Columbus OH 7.0% $ 11.96 97% Pittsburgh PA 6.8% $ 10.25 98%
Dallas-Ft Worth TX 6.5% $ 16.07 94% Raleigh-Durham NC 6.6% $ 14.30 95%
Dayton OH 7.2% $ 10.03 92% Richmond VA 6.5% $ 14.04 95%
Denver CO 6.5% $ 14.88 91% Tampa FL 6.5% $ 12.41 91%
Detroit MI 7.5% $ 10.76 92% Washington, DC DC 5.9% $ 22.59 96%
National Average 6.4% $ 14.57 94%
Slate Retail REIT (Q4 2014) 7.7% $ 9.86 96%
Source: Greet Street Advisors
Slate Retail REIT | 23
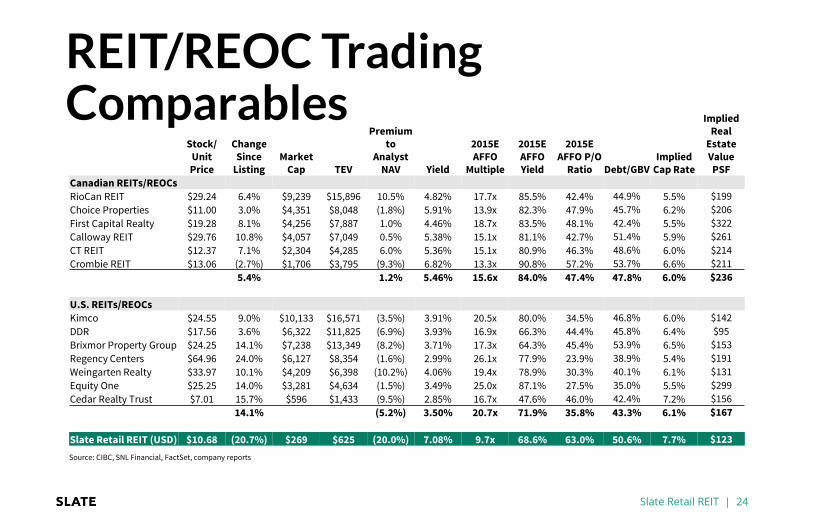
REIT/REOC Trading Comparables
Source: CIBC, SNL Financial, FactSet, company reports
Stock/Unit Price
Change Since
ListingMarket
Cap TEV
Premium to
Analyst NAV Yield
2015E AFFO
Multiple
2015E AFFO Yield
2015E AFFO P/O
Ratio Debt/GBVImplied
Cap Rate
Implied Real
Estate Value PSF
Canadian REITs/REOCs
RioCan REIT $29.24 6.4% $9,239 $15,896 10.5% 4.82% 17.7x 85.5% 42.4% 44.9% 5.5% $199
Choice Properties $11.00 3.0% $4,351 $8,048 (1.8%) 5.91% 13.9x 82.3% 47.9% 45.7% 6.2% $206
First Capital Realty $19.28 8.1% $4,256 $7,887 1.0% 4.46% 18.7x 83.5% 48.1% 42.4% 5.5% $322
Calloway REIT $29.76 10.8% $4,057 $7,049 0.5% 5.38% 15.1x 81.1% 42.7% 51.4% 5.9% $261
CT REIT $12.37 7.1% $2,304 $4,285 6.0% 5.36% 15.1x 80.9% 46.3% 48.6% 6.0% $214
Crombie REIT $13.06 (2.7%) $1,706 $3,795 (9.3%) 6.82% 13.3x 90.8% 57.2% 53.7% 6.6% $211
5.4% 1.2% 5.46% 15.6x 84.0% 47.4% 47.8% 6.0% $236
U.S. REITs/REOCs
Kimco $24.55 9.0% $10,133 $16,571 (3.5%) 3.91% 20.5x 80.0% 34.5% 46.8% 6.0% $142
DDR $17.56 3.6% $6,322 $11,825 (6.9%) 3.93% 16.9x 66.3% 44.4% 45.8% 6.4% $95
Brixmor Property Group $24.25 14.1% $7,238 $13,349 (8.2%) 3.71% 17.3x 64.3% 45.4% 53.9% 6.5% $153
Regency Centers $64.96 24.0% $6,127 $8,354 (1.6%) 2.99% 26.1x 77.9% 23.9% 38.9% 5.4% $191
Weingarten Realty $33.97 10.1% $4,209 $6,398 (10.2%) 4.06% 19.4x 78.9% 30.3% 40.1% 6.1% $131
Equity One $25.25 14.0% $3,281 $4,634 (1.5%) 3.49% 25.0x 87.1% 27.5% 35.0% 5.5% $299
Cedar Realty Trust $7.01 15.7% $596 $1,433 (9.5%) 2.85% 16.7x 47.6% 46.0% 42.4% 7.2% $156
14.1% (5.2%) 3.50% 20.7x 71.9% 35.8% 43.3% 6.1% $167
Slate Retail REIT (USD) $10.68 (20.7%) $269 $625 (20.0%) 7.08% 9.7x 68.6% 63.0% 50.6% 7.7% $123
Slate Retail REIT | 24

Investment Highlights• Unique Opportunity
• Pure-play on U.S. grocery-anchored real estate
• “Total Returns” strategy coupling strong cash flow and attractive cost basis
• U.S. REIT structure including conservative payout ratio geared for growth
• Clear Strategy Focused on Growth• Robust pipeline of accretive acquisition opportunities for well-capitalized buyers
• Embedded rental rate growth with modest capex requirements
• Approximate 60% increase in NOI since listing in Q2 2014
• Since listing, 3.4 million square feet of accretive acquisitions added to original 3.5 million square foot portfolio
• Best-in-Class Sponsor• Slate Asset Management LP is a hands-on owner/operator with a proven track record of creating value
• Significant alignment via ~8% ownership of Slate Retail REIT
• Performance-based fee structure with clear path to internalization
Slate Retail REIT | 25
Cautionary StatementsForward-Looking StatementsThis presentation contains forward-looking information within the meaning of applicable securities laws. These statements include, but are not limited to, statements concerningthe REIT’s objectives, its strategies to achieve those objectives, as well as statements with respect to management’s beliefs, plans, estimates, and intentions, and similarstatements concerning anticipated future events, results, circumstances, performance or expectations that are not historical facts. Readers should not place undue reliance onany such forward-looking statements. Forward-looking information involves known and unknown risks, uncertainties and other factors which may cause the actual results,performance or achievements of the REIT to be materially different from any future results, performance or achievements expressed or implied by the forward-lookinginformation. Actual results and developments are likely to differ, and may differ materially, from those expressed or implied by the forward-looking statements contained herein.Such forward-looking statements are based on a number of assumptions that may prove to be incorrect, including, but not limited to, the continued availability of mortgagefinancing and current interest rates; the extent of competition for properties; assumptions about the markets in which the REIT and its subsidiaries operate; the global and NorthAmerican economic environment; and changes in governmental regulations or tax laws. Although the forward-looking information contained in this presentation is based uponwhat management believes are reasonable assumptions, there can be no assurance that actual results will be consistent with these forward-looking statements. Certainstatements included in this presentation may be considered “financial outlook” for purposes of applicable securities laws, and such financial outlook may not be appropriate forpurposes other than this presentation. Except as required by applicable law, the REIT undertakes no obligation to publicly update or revise any forward-looking statement,whether as a result of new information, future events or otherwise.
Non-IFRS MeasuresThis presentation contains financial measures that do not have a standardized meaning under International Financial Reporting Standards (“IFRS”) as prescribed by theInternational Accounting Standards Board. Slate Retail uses the following non-IFRS financial measures: Funds from Operations (“FFO”), Adjusted Funds from Operations(“AFFO”), Net Operating Income (“NOI”), and Earnings Before Interest, Taxes, Depreciation and Amortization (“EBITDA”). Management believes that in addition to conventionalmeasures prepared in accordance with IFRS, investors in the real estate industry use these non-IFRS financial measures to evaluate the REIT’s performance and financialcondition. Accordingly, these non-IFRS financial measures are intended to provide additional information and should not be considered in isolation or as a substitute forperformance measures prepared in accordance with IFRS. In addition, they do not have standardized meanings and may not be comparable to measures used by other issuers inthe real estate industry or other industries.
Use of EstimatesThe preparation of the REIT financial statements in conformity with IFRS requires management to make estimates, judgments and assumptions that affect the reported amountsof assets and liabilities, disclosure of contingent assets and liabilities at the date of the financial statements and the reported amount of revenues and expenses during thereporting period. Management’s estimates are based on historical experience and other assumptions that are believed to be reasonable under the circumstances. Actual resultscould differ from those estimates under different assumptions.
Slate Retail REIT | 26
Where can our vision take you?
Slate Asset Management LP
Blair WelchPartner & Co-Founder
Brady WelchPartner & Co-Founder
Greg Stevenson, CFAVice-President,U.S. Operations
Conor McBroomVice-President,Investor Relations
+1 416 644 4267 +1 416 644 4263 +1 416 619 4285 +1 416 619 4284
[email protected] [email protected] [email protected] [email protected]
200 Front St W, Suite 2400Toronto, ON M5V 3K2 Canada
www.slateam.com
Slate Retail REIT | 27


![Investor Update Q1 FY16 [Company Update]](https://img.pdfslide.us/doc/110x75/577cb41b1a28aba7118c4de4/investor-update-q1-fy16-company-update.jpg)


![Result Update Presentation Q1 FY 16 [Company Update]](https://img.pdfslide.us/doc/110x75/577cb2961a28aba7118c175a/result-update-presentation-q1-fy-16-company-update.jpg)