Embed Size (px)
Citation preview
Annual Report on the San Francisco County Housing Market
Residential real estate activity in San Francisco County (Districts 1-10), comprised of single-family properties, townhomes and condominiums.
3 Quick Facts
5 Property Type Review
6 Bedroom Range Review
7 Square Foot Range Review
8 Price Range Review
9 Area Overviews10 Area Historical Prices
Annual Report on the San Francisco County Housing MarketResidential real estate activity in San Francisco County (Districts 1-10), comprised of single-family properties, townhomes and condominiums.
Current as of January 11, 2017. All data from the San Francisco MLS. Report © 2017 ShowingTime. | 2
With a new U.S. president from a different political party taking office in 2017, few are expecting federal policies to remain as they have under prior leadership. The incoming president has a deep history in real estate development and has shown a strong interest in funding massive infrastructure projects, two points that provide intrigue for the immediate future of residential real estate.
After several years of housing market improvement, 2016, as predicted, was not a pronounced triumph but more of a measured success. Markets took a steady and mostly profitable walk from month to month. Even as supply was short and shrinking, sales and prices were often increasing.
Interest rates were expected to rise throughout 2016, but they did not. Just as happened in 2015, the Federal Reserve waited until December 2016 to make a short-term rate increase. Incremental rate hikes are again expected in 2017. An economy that shows unemployment at a nine-year low coupled with higher wages inspires confidence.
Mortgage rates are not expected to grow by more than .75 percent throughout 2017, which should keep them below 5.0 percent. If they rise above that mark, we could see rate lock, and that could cause homeowners to stay put at locked-in rates instead of trading up for higher-rate properties. Such a situation would put a damper on an already strained inventory environment.
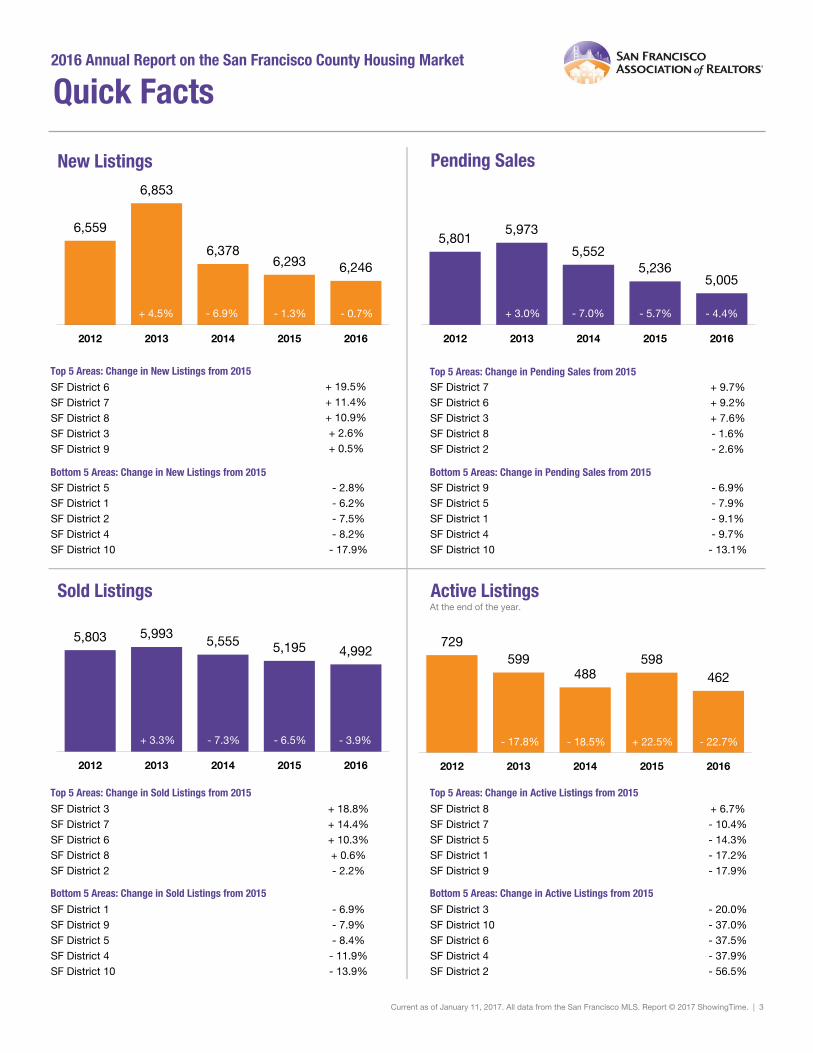
Sales: Pending sales decreased 4.4 percent to 5,005 to close out the year. Closed sales decreased 3.9 percent to 4,992 to close out the year.
Listings: Inventory was lower in year-over-year comparisons. There were 462 active listings at the end of 2016. New listings decreased by 0.7 percent to finish the year at 6,246. Low home supply is expected to continue throughout 2017.
Table of Contents
Prices: Home prices rose compared to last year. The overall median sales price was up 3.9 percent to $1,195,000 for the year. When inventory is low and demand is high, prices will rise. Prices should increase in most areas in 2017 but at a slower growth rate. Single Family homes were up 6.0 percent compared to last year, and Condo/TIC/Co-op were down 0.9 percent. We will likely need years of improved wage growth to account for recent price gains.
List Price Received: Sellers received 107.7 percent of their original list price received at sale, a year-over-year decrease of 3.5 percent.
Millennials continue to command attention as the next wave of home buyers, yet the rate at which this massive population is entering the market has been less than stellar. This may be due to a cultural change away from settling into marriage and parenthood until later in life, high student loan debt, or even reservations about a home being a wise investment in the wake of what the last recession did to their elders. That said, some have suggested that this group is simply willing to wait longer to buy, thus skipping the entry-level purchase altogether to land in their preferred home.
At the other end of the age and price spectrum, baby boomers are expected to make up nearly one-third of all buyers in 2017. By and large, this group is not looking to invest in oversized homes, yet we could see improvement in higher price ranges as a hedge against inflation and risk. Shifting wealth away from the stock market into valuable homes may be seen as a safer bet during a transition of power and a period of pronounced change.
SF District 6 + 19.5% SF District 7 + 9.7%SF District 7 + 11.4% SF District 6 + 9.2%SF District 8 + 10.9% SF District 3 + 7.6%SF District 3 + 2.6% SF District 8 - 1.6%SF District 9 + 0.5% SF District 2 - 2.6%
SF District 5 - 2.8% SF District 9 - 6.9%SF District 1 - 6.2% SF District 5 - 7.9%SF District 2 - 7.5% SF District 1 - 9.1%SF District 4 - 8.2% SF District 4 - 9.7%SF District 10 - 17.9% SF District 10 - 13.1%
SF District 3 + 18.8% SF District 8 + 6.7%SF District 7 + 14.4% SF District 7 - 10.4%SF District 6 + 10.3% SF District 5 - 14.3%SF District 8 + 0.6% SF District 1 - 17.2%SF District 2 - 2.2% SF District 9 - 17.9%
SF District 1 - 6.9% SF District 3 - 20.0%SF District 9 - 7.9% SF District 10 - 37.0%SF District 5 - 8.4% SF District 6 - 37.5%SF District 4 - 11.9% SF District 4 - 37.9%SF District 10 - 13.9% SF District 2 - 56.5%
At the end of the year.
2016 Annual Report on the San Francisco County Housing Market
Current as of January 11, 2017. All data from the San Francisco MLS. Report © 2017 ShowingTime. | 3
Bottom 5 Areas: Change in Sold Listings from 2015 Bottom 5 Areas: Change in Active Listings from 2015
Top 5 Areas: Change in Pending Sales from 2015
Bottom 5 Areas: Change in Pending Sales from 2015
Top 5 Areas: Change in Sold Listings from 2015 Top 5 Areas: Change in Active Listings from 2015
Bottom 5 Areas: Change in New Listings from 2015
Top 5 Areas: Change in New Listings from 2015
Quick Facts
729599
488598
462
2012 2013 2014 2015 2016
5,803 5,993 5,555 5,195 4,992
2012 2013 2014 2015 2016
5,8015,973
5,5525,236
5,005
2012 2013 2014 2015 2016
6,559
6,853
6,3786,293 6,246
2012 2013 2014 2015 2016
New Listings Pending Sales
+ 4.5% - 6.9% - 1.3%
Sold Listings Active Listings
- 0.7% + 3.0% - 7.0% - 5.7% - 4.4%
+ 3.3% - 7.3% - 6.5% - 3.9% - 17.8% - 18.5% + 22.5% - 22.7%
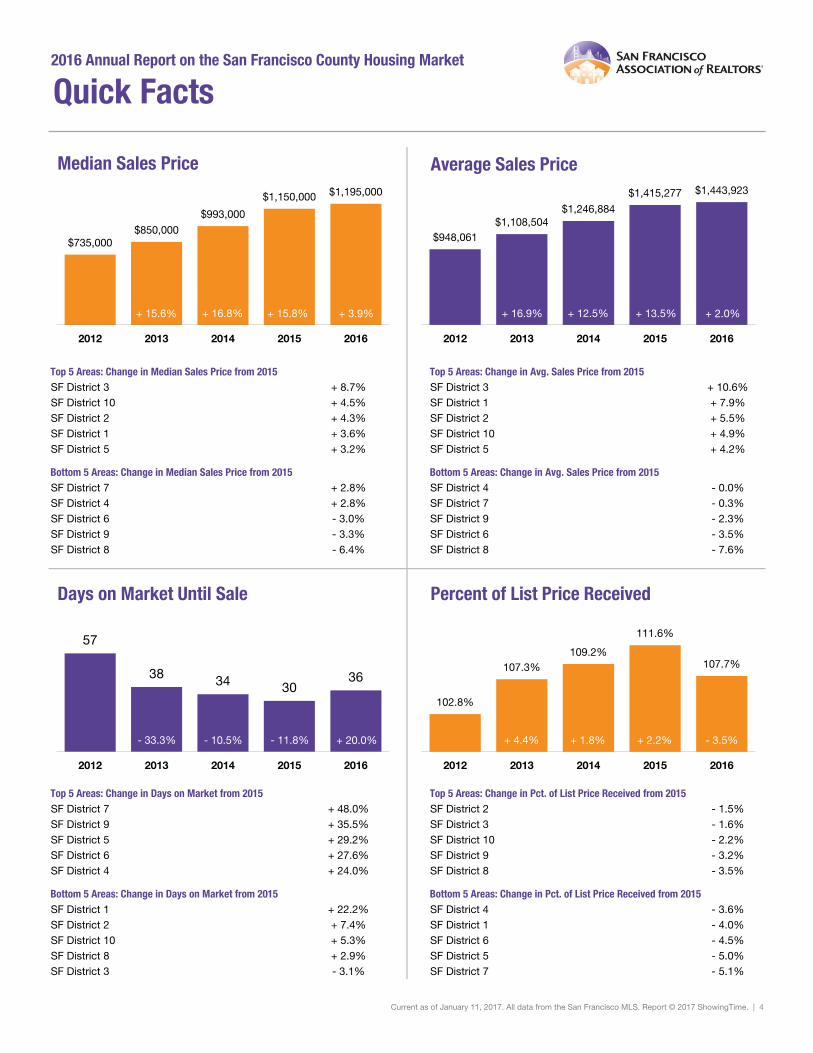
SF District 3 + 8.7% SF District 3 + 10.6%SF District 10 + 4.5% SF District 1 + 7.9%SF District 2 + 4.3% SF District 2 + 5.5%SF District 1 + 3.6% SF District 10 + 4.9%SF District 5 + 3.2% SF District 5 + 4.2%
SF District 7 + 2.8% SF District 4 - 0.0%SF District 4 + 2.8% SF District 7 - 0.3%SF District 6 - 3.0% SF District 9 - 2.3%SF District 9 - 3.3% SF District 6 - 3.5%SF District 8 - 6.4% SF District 8 - 7.6%
SF District 7 + 48.0% SF District 2 - 1.5%SF District 9 + 35.5% SF District 3 - 1.6%SF District 5 + 29.2% SF District 10 - 2.2%SF District 6 + 27.6% SF District 9 - 3.2%SF District 4 + 24.0% SF District 8 - 3.5%
SF District 1 + 22.2% SF District 4 - 3.6%SF District 2 + 7.4% SF District 1 - 4.0%SF District 10 + 5.3% SF District 6 - 4.5%SF District 8 + 2.9% SF District 5 - 5.0%SF District 3 - 3.1% SF District 7 - 5.1%
Current as of January 11, 2017. All data from the San Francisco MLS. Report © 2017 ShowingTime. | 4
Bottom 5 Areas: Change in Days on Market from 2015 Bottom 5 Areas: Change in Pct. of List Price Received from 2015
Top 5 Areas: Change in Days on Market from 2015 Top 5 Areas: Change in Pct. of List Price Received from 2015
Top 5 Areas: Change in Median Sales Price from 2015 Top 5 Areas: Change in Avg. Sales Price from 2015
Bottom 5 Areas: Change in Median Sales Price from 2015 Bottom 5 Areas: Change in Avg. Sales Price from 2015
2016 Annual Report on the San Francisco County Housing Market
Quick Facts
$735,000$850,000
$993,000
$1,150,000 $1,195,000
2012 2013 2014 2015 2016
102.8%
107.3%109.2%
111.6%
107.7%
2012 2013 2014 2015 2016
57
38 34 3036
2012 2013 2014 2015 2016
$948,061$1,108,504
$1,246,884
$1,415,277 $1,443,923
2012 2013 2014 2015 2016
Median Sales Price Average Sales Price
+ 15.6% + 16.8% + 15.8%
Days on Market Until Sale Percent of List Price Received
+ 3.9% + 16.9% + 12.5% + 13.5% + 2.0%
- 33.3% - 10.5% - 11.8% + 20.0% + 4.4% + 1.8% + 2.2% - 3.5%
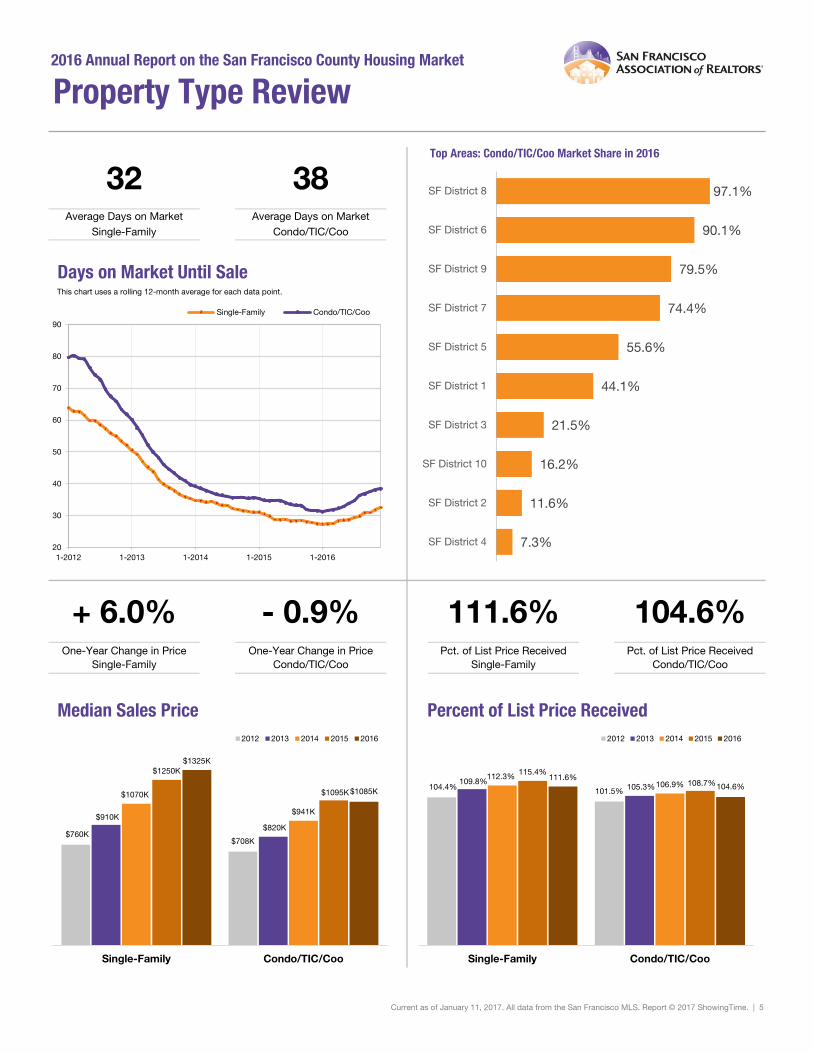
Top Areas: Condo/TIC/Coo Market Share in 2016SF District 8 97.1%SF District 6 90.1%SF District 9 79.5%SF District 7 74.4%SF District 5 55.6%SF District 1 44.1%SF District 3 21.5%SF District 10 16.2%SF District 2 11.6%SF District 4 7.3%
2016 Annual Report on the San Francisco County Housing Market
Current as of January 11, 2017. All data from the San Francisco MLS. Report © 2017 ShowingTime. | 5
One-Year Change in Price Single-Family
One-Year Change in Price Condo/TIC/Coo
Pct. of List Price Received Single-Family
Pct. of List Price Received Condo/TIC/Coo
+ 6.0% - 0.9% 111.6% 104.6%
This chart uses a rolling 12-month average for each data point.
Property Type Review
32 38Single-Family
Average Days on Market Average Days on Market Condo/TIC/Coo
104.4% 101.5%109.8%
105.3%112.3%
106.9%
115.4%108.7%
111.6%104.6%
Single-Family Condo/TIC/Coo
2012 2013 2014 2015 2016
$760K$708K
$910K$820K
$1070K
$941K
$1250K
$1095K
$1325K
$1085K
Single-Family Condo/TIC/Coo
2012 2013 2014 2015 2016
20
30
40
50
60
70
80
90
1-2012 1-2013 1-2014 1-2015 1-2016
Single-Family Condo/TIC/Coo
Days on Market Until Sale
Median Sales Price Percent of List Price Received
97.1%
90.1%
79.5%
74.4%
55.6%
44.1%
21.5%
16.2%
11.6%
7.3%
SF District 8
SF District 6
SF District 9
SF District 7
SF District 5
SF District 1
SF District 3
SF District 10
SF District 2
SF District 4
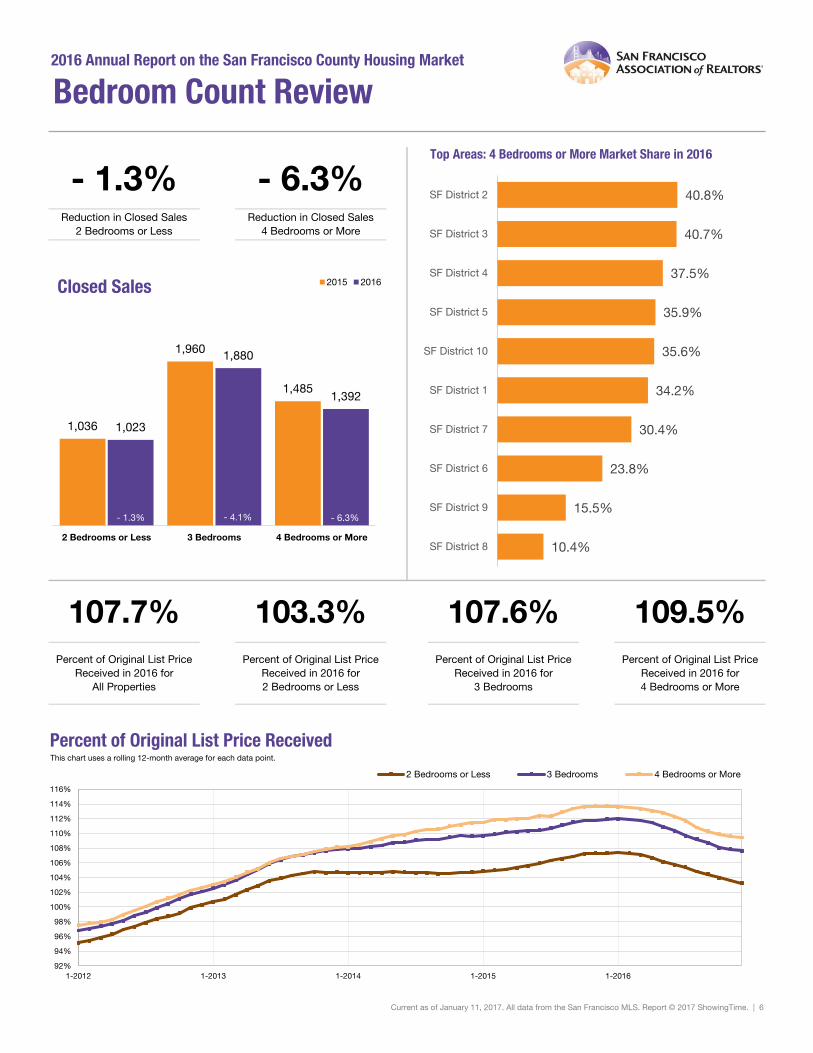
Top Areas: 4 Bedrooms or More Market Share in 2016SF District 2 40.8%SF District 3 40.7%SF District 4 37.5%SF District 5 35.9%SF District 10 35.6%SF District 1 34.2%SF District 7 30.4%SF District 6 23.8%SF District 9 15.5%SF District 8 10.4%
This chart uses a rolling 12-month average for each data point.
2016 Annual Report on the San Francisco County Housing Market
Current as of January 11, 2017. All data from the San Francisco MLS. Report © 2017 ShowingTime. | 6
107.7% 103.3% 107.6% 109.5%Percent of Original List Price
Received in 2016 forAll Properties
Percent of Original List Price Received in 2016 for2 Bedrooms or Less
Percent of Original List Price Received in 2016 for
3 Bedrooms
Percent of Original List Price Received in 2016 for4 Bedrooms or More
Reduction in Closed Sales2 Bedrooms or Less
Reduction in Closed Sales4 Bedrooms or More
Bedroom Count Review
- 1.3% - 6.3%
1,036
1,960
1,485
1,023
1,880
1,392
2 Bedrooms or Less 3 Bedrooms 4 Bedrooms or More
2015 2016
92%
94%
96%
98%
100%
102%
104%
106%
108%
110%
112%
114%
116%
1-2012 1-2013 1-2014 1-2015 1-2016
2 Bedrooms or Less 3 Bedrooms 4 Bedrooms or More
Closed Sales
Percent of Original List Price Received
- 1.3% - 4.1% - 6.3%
40.8%
40.7%
37.5%
35.9%
35.6%
34.2%
30.4%
23.8%
15.5%
10.4%
SF District 2
SF District 3
SF District 4
SF District 5
SF District 10
SF District 1
SF District 7
SF District 6
SF District 9
SF District 8
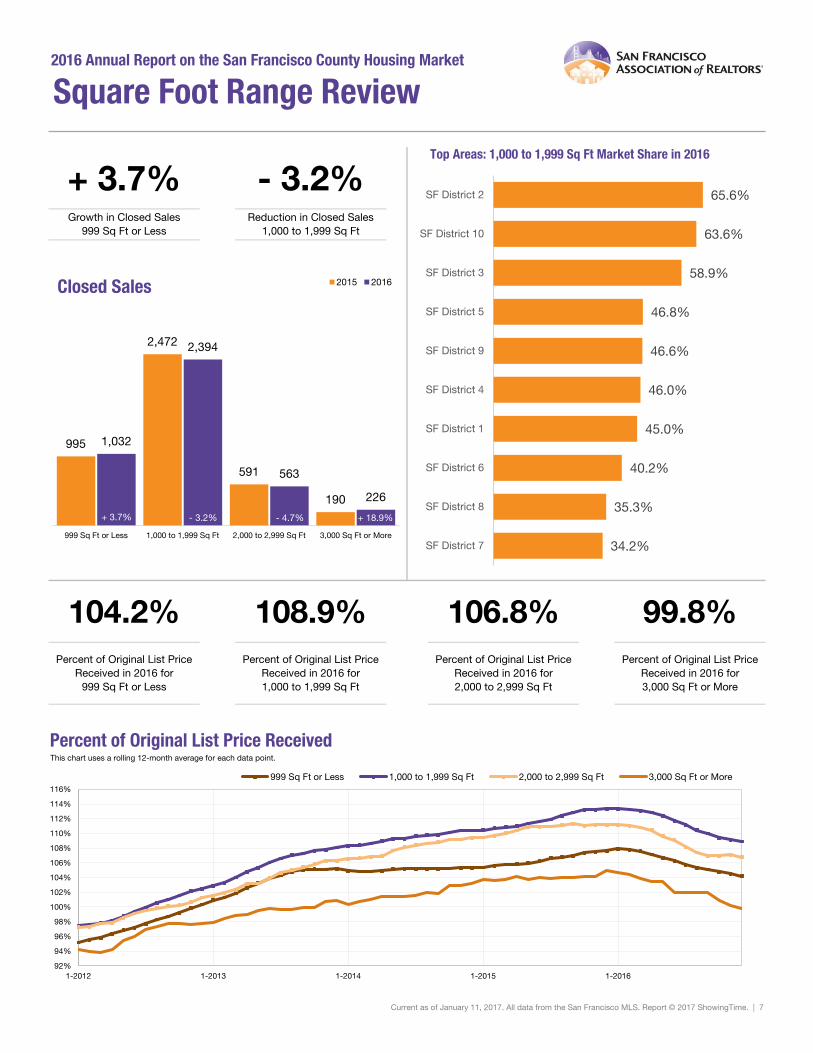
Top Areas: 1,000 to 1,999 Sq Ft Market Share in 2016SF District 2 65.6%SF District 10 63.6%SF District 3 58.9%SF District 5 46.8%SF District 9 46.6%SF District 4 46.0%SF District 1 45.0%SF District 6 40.2%SF District 8 35.3%SF District 7 34.2%
Current as of January 11, 2017. All data from the San Francisco MLS. Report © 2017 ShowingTime. | 7
Growth in Closed Sales999 Sq Ft or Less
Reduction in Closed Sales1,000 to 1,999 Sq Ft
104.2% 108.9% 106.8% 99.8%Percent of Original List Price
Received in 2016 for999 Sq Ft or Less
Percent of Original List Price Received in 2016 for1,000 to 1,999 Sq Ft
Percent of Original List Price Received in 2016 for2,000 to 2,999 Sq Ft
Percent of Original List Price Received in 2016 for3,000 Sq Ft or More
This chart uses a rolling 12-month average for each data point.
2016 Annual Report on the San Francisco County Housing Market
Square Foot Range Review
+ 3.7% - 3.2%
995
2,472
591
190
1,032
2,394
563
226
999 Sq Ft or Less 1,000 to 1,999 Sq Ft 2,000 to 2,999 Sq Ft 3,000 Sq Ft or More
2015 2016
92%
94%
96%
98%
100%
102%
104%
106%
108%
110%
112%
114%
116%
1-2012 1-2013 1-2014 1-2015 1-2016
999 Sq Ft or Less 1,000 to 1,999 Sq Ft 2,000 to 2,999 Sq Ft 3,000 Sq Ft or More
Closed Sales
Percent of Original List Price Received
+ 3.7% - 3.2% - 4.7% + 18.9%
65.6%
63.6%
58.9%
46.8%
46.6%
46.0%
45.0%
40.2%
35.3%
34.2%
SF District 2
SF District 10
SF District 3
SF District 5
SF District 9
SF District 4
SF District 1
SF District 6
SF District 8
SF District 7
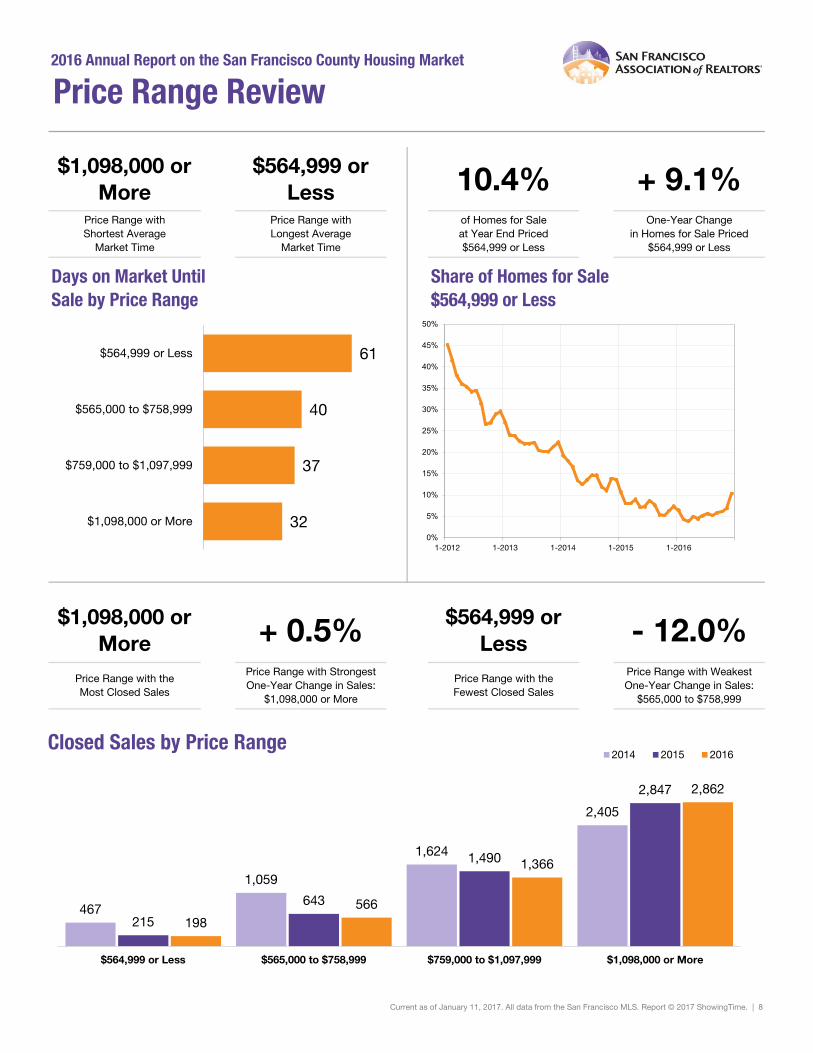
Price Range with the Most Closed Sales
Price Range with Strongest One-Year Change in Sales:
$1,098,000 or More
Price Range with the Fewest Closed Sales
Price Range with Weakest One-Year Change in Sales:
$565,000 to $758,999
+ 9.1%
2016 Annual Report on the San Francisco County Housing Market
Current as of January 11, 2017. All data from the San Francisco MLS. Report © 2017 ShowingTime. | 8
Price Range withShortest Average
Market Time
Price Range withLongest Average
Market Time
of Homes for Saleat Year End Priced $564,999 or Less
One-Year Changein Homes for Sale Priced
$564,999 or Less
$1,098,000 or More + 0.5% $564,999 or
Less - 12.0%
Share of Homes for Sale $564,999 or Less
Days on Market UntilSale by Price Range
Price Range Review
$1,098,000 or More
$564,999 or Less 10.4%
61
40
37
32
$564,999 or Less
$565,000 to $758,999
$759,000 to $1,097,999
$1,098,000 or More
467
1,059
1,624
2,405
215
643
1,490
2,847
198566
1,366
2,862
$564,999 or Less $565,000 to $758,999 $759,000 to $1,097,999 $1,098,000 or More
2014 2015 2016Closed Sales by Price Range
0%
5%
10%
15%
20%
25%
30%
35%
40%
45%
50%
1-2012 1-2013 1-2014 1-2015 1-2016
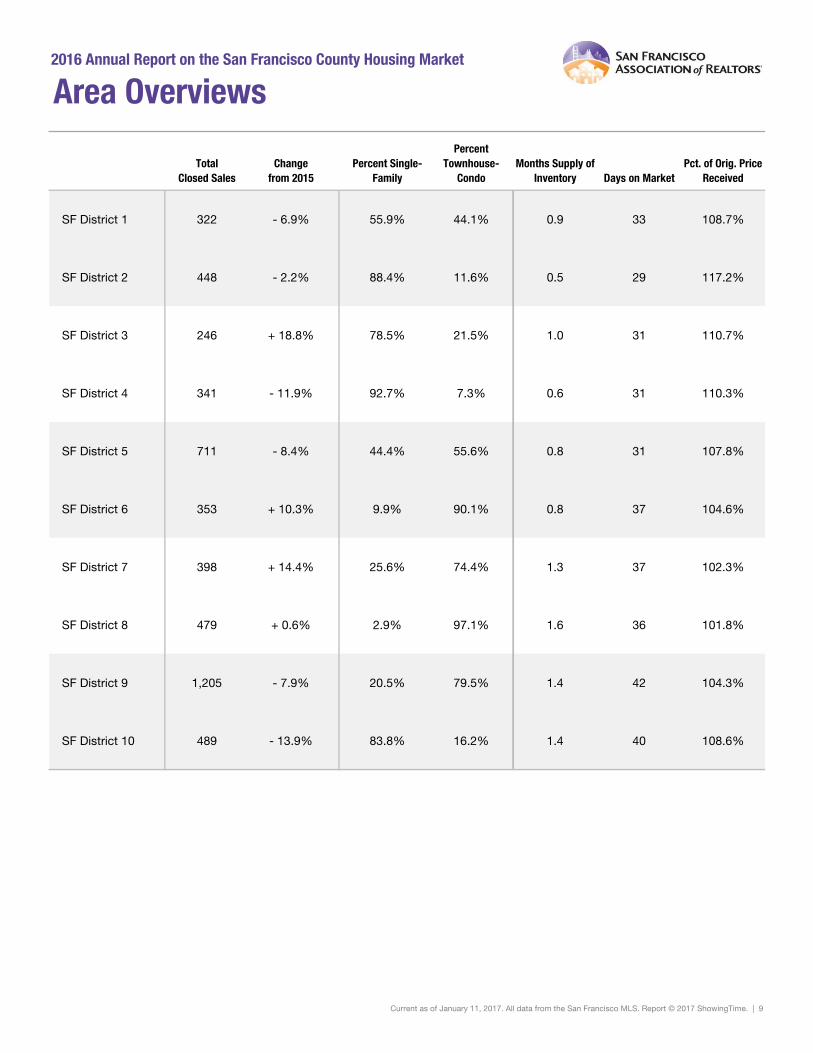
TotalClosed Sales
Changefrom 2015
Percent Single-Family
Percent Townhouse-
CondoMonths Supply of
Inventory Days on MarketPct. of Orig. Price
Received
SF District 1 322 - 6.9% 55.9% 44.1% 0.9 33 108.7%
SF District 2 448 - 2.2% 88.4% 11.6% 0.5 29 117.2%
SF District 3 246 + 18.8% 78.5% 21.5% 1.0 31 110.7%
SF District 4 341 - 11.9% 92.7% 7.3% 0.6 31 110.3%
SF District 5 711 - 8.4% 44.4% 55.6% 0.8 31 107.8%
SF District 6 353 + 10.3% 9.9% 90.1% 0.8 37 104.6%
SF District 7 398 + 14.4% 25.6% 74.4% 1.3 37 102.3%
SF District 8 479 + 0.6% 2.9% 97.1% 1.6 36 101.8%
SF District 9 1,205 - 7.9% 20.5% 79.5% 1.4 42 104.3%
SF District 10 489 - 13.9% 83.8% 16.2% 1.4 40 108.6%
Area Overviews
Current as of January 11, 2017. All data from the San Francisco MLS. Report © 2017 ShowingTime. | 9
2016 Annual Report on the San Francisco County Housing Market
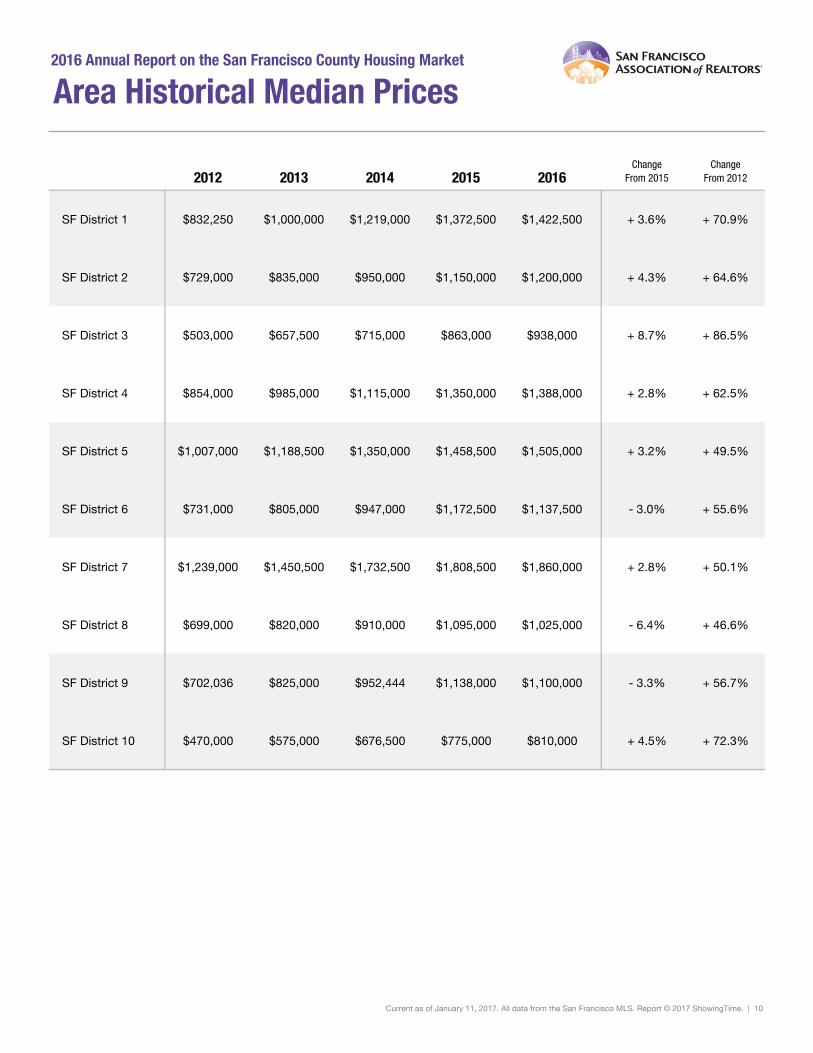
2012 2013 2014 2015 2016Change
From 2015Change
From 2012
SF District 1 $832,250 $1,000,000 $1,219,000 $1,372,500 $1,422,500 + 3.6% + 70.9%
SF District 2 $729,000 $835,000 $950,000 $1,150,000 $1,200,000 + 4.3% + 64.6%
SF District 3 $503,000 $657,500 $715,000 $863,000 $938,000 + 8.7% + 86.5%
SF District 4 $854,000 $985,000 $1,115,000 $1,350,000 $1,388,000 + 2.8% + 62.5%
SF District 5 $1,007,000 $1,188,500 $1,350,000 $1,458,500 $1,505,000 + 3.2% + 49.5%
SF District 6 $731,000 $805,000 $947,000 $1,172,500 $1,137,500 - 3.0% + 55.6%
SF District 7 $1,239,000 $1,450,500 $1,732,500 $1,808,500 $1,860,000 + 2.8% + 50.1%
SF District 8 $699,000 $820,000 $910,000 $1,095,000 $1,025,000 - 6.4% + 46.6%
SF District 9 $702,036 $825,000 $952,444 $1,138,000 $1,100,000 - 3.3% + 56.7%
SF District 10 $470,000 $575,000 $676,500 $775,000 $810,000 + 4.5% + 72.3%
Area Historical Median Prices2016 Annual Report on the San Francisco County Housing Market
Current as of January 11, 2017. All data from the San Francisco MLS. Report © 2017 ShowingTime. | 10


![PDR Housing estate renewal capability.FINAL[1]](https://img.pdfslide.us/doc/110x75/588b0d0a1a28abdf3b8b6293/pdr-housing-estate-renewal-capabilityfinal1.jpg)