Embed Size (px)
Citation preview
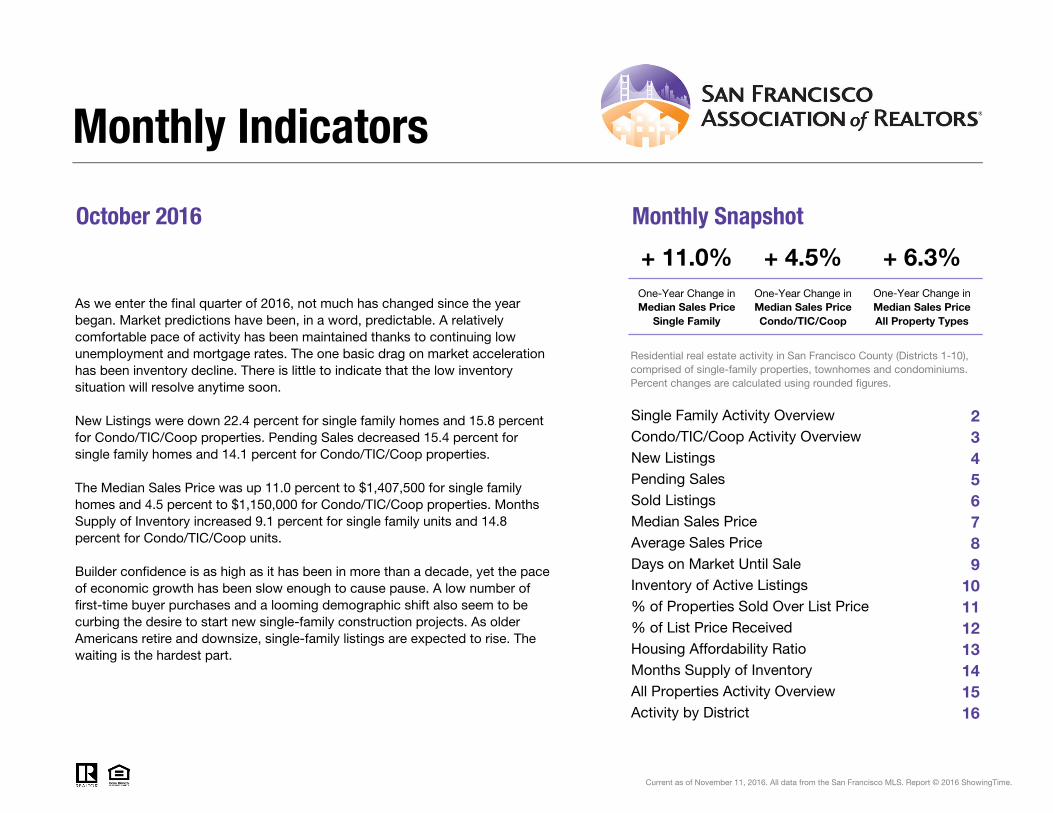
October 2016 Monthly Snapshot
One-Year Change in One-Year Change inMedian Sales Price
Single FamilyMedian Sales Price Condo/TIC/Coop
23456789
10111213141516
Current as of November 11, 2016. All data from the San Francisco MLS. Report © 2016 ShowingTime.
Condo/TIC/Coop Activity Overview
Inventory of Active Listings% of Properties Sold Over List Price% of List Price ReceivedHousing Affordability Ratio
All Properties Activity Overview
New ListingsPending SalesSold ListingsMedian Sales PriceAverage Sales PriceDays on Market Until Sale
Activity by District
Monthly Indicators
+ 11.0% + 4.5% + 6.3%One-Year Change in
As we enter the final quarter of 2016, not much has changed since the year began. Market predictions have been, in a word, predictable. A relatively comfortable pace of activity has been maintained thanks to continuing low unemployment and mortgage rates. The one basic drag on market acceleration has been inventory decline. There is little to indicate that the low inventory situation will resolve anytime soon.
New Listings were down 22.4 percent for single family homes and 15.8 percent for Condo/TIC/Coop properties. Pending Sales decreased 15.4 percent for single family homes and 14.1 percent for Condo/TIC/Coop properties.
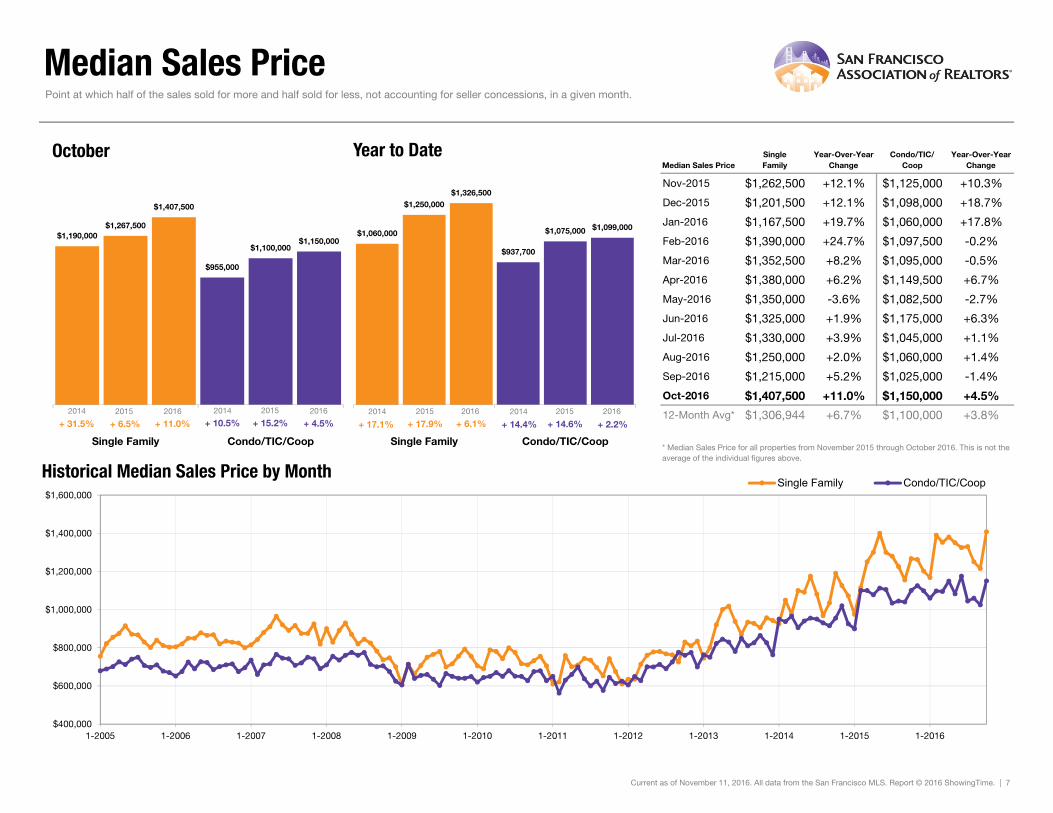
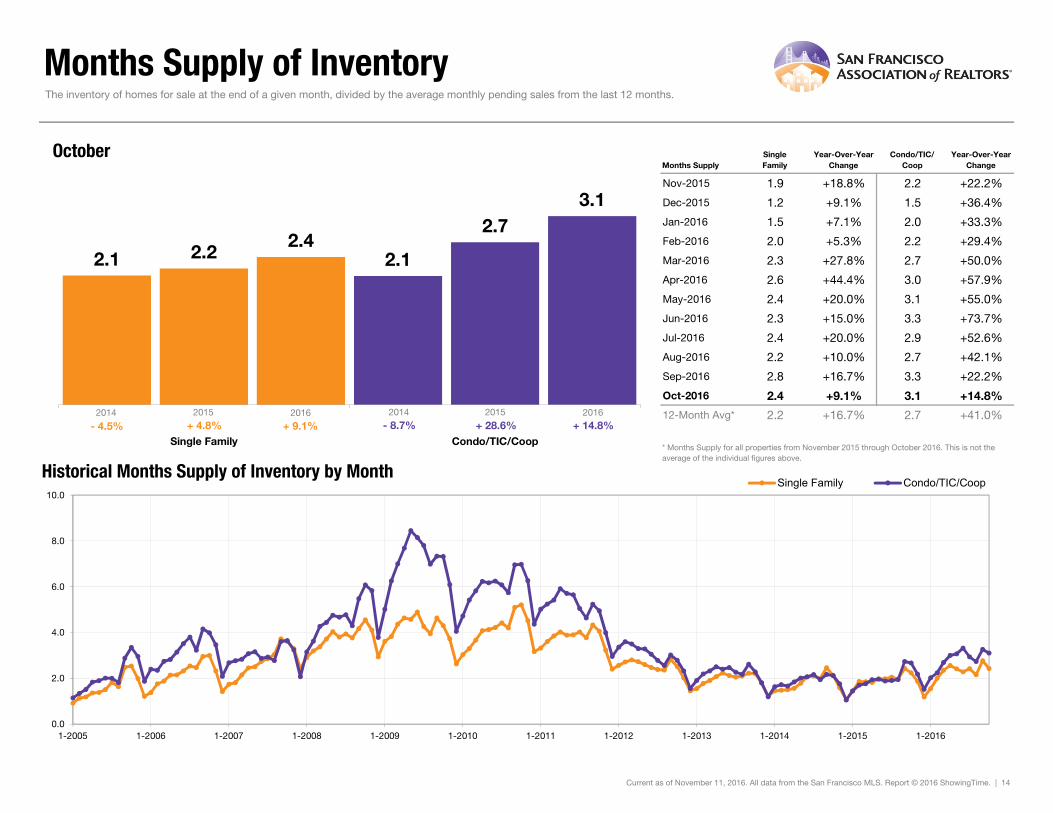
The Median Sales Price was up 11.0 percent to $1,407,500 for single family homes and 4.5 percent to $1,150,000 for Condo/TIC/Coop properties. Months Supply of Inventory increased 9.1 percent for single family units and 14.8 percent for Condo/TIC/Coop units.
Builder confidence is as high as it has been in more than a decade, yet the pace of economic growth has been slow enough to cause pause. A low number of first-time buyer purchases and a looming demographic shift also seem to be curbing the desire to start new single-family construction projects. As older Americans retire and downsize, single-family listings are expected to rise. The waiting is the hardest part.
Median Sales Price All Property Types
Residential real estate activity in San Francisco County (Districts 1-10), comprised of single-family properties, townhomes and condominiums. Percent changes are calculated using rounded figures.
Single Family Activity Overview
Months Supply of Inventory

Single Family Activity OverviewKey metrics by report month and for year-to-date (YTD) starting from the first of the year.
Key Metrics Historical Sparkbars 10-2015 10-2016 Percent Change YTD 2015 YTD 2016 Percent Change
- 3.8%2,435
1,808 - 5.5%
$1,326,500 + 6.1%
+ 4.1%
Pending Sales 266 225 - 15.4% - 6.4%2,013 1,885
New Listings 263 204 - 22.4% 2,530
Sold Listings 244 224 - 8.2% 1,913
Median Sales Price $1,267,500 $1,407,500 + 11.0% $1,250,000
31 + 14.8%
$1,706,561
-- --
Days on Market 27 27 0.0% 27
Avg. Sales Price $1,624,546 $2,012,029 + 23.9% $1,639,820
Active Listings 440 443 + 0.7% --
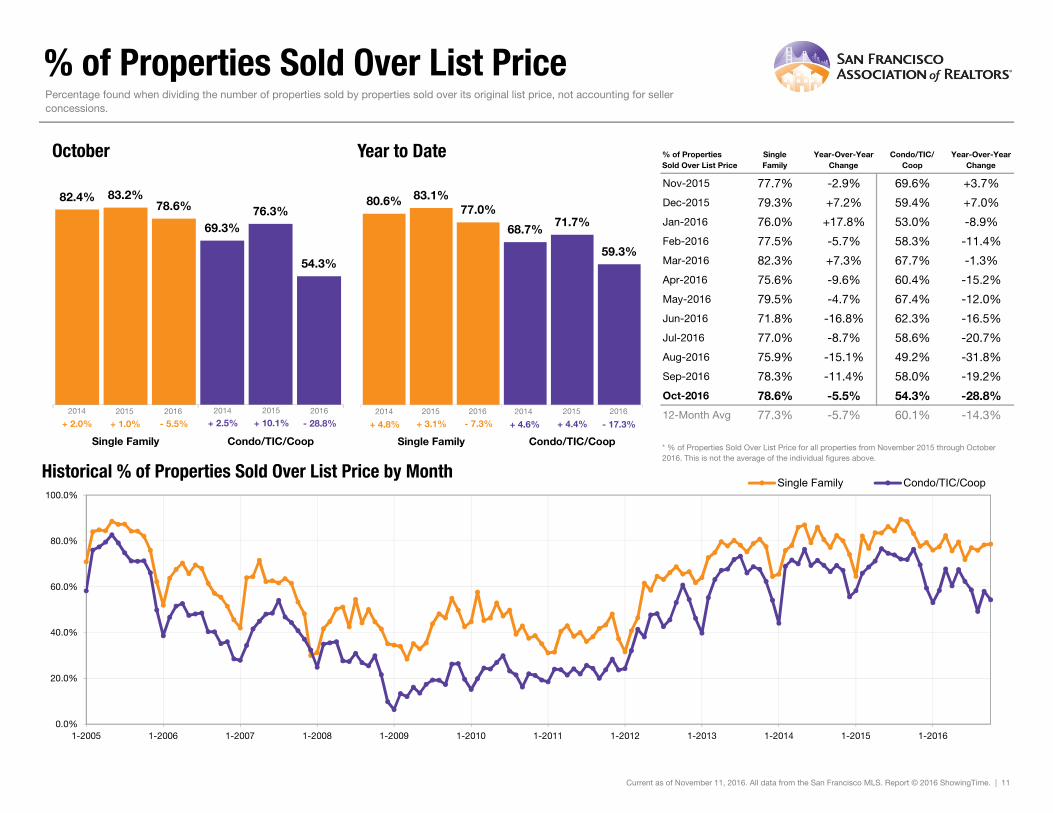
% of Properties Sold Over List Price 83.2% 78.6% - 5.5% 83.1%
39
77.0% - 7.3%
- 3.3%
41 + 5.1%
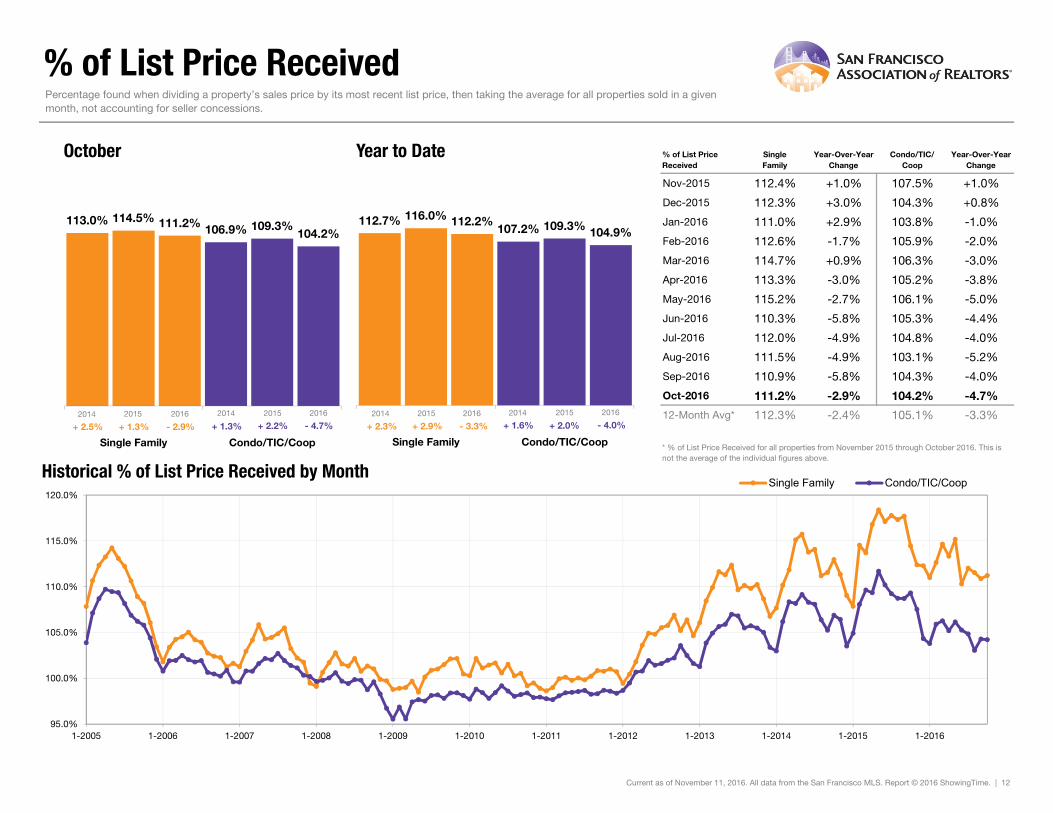
112.2%% of List Price Received 114.5% 111.2% - 2.9% 116.0%
Current as of November 11, 2016. All data from the San Francisco MLS. Report © 2016 ShowingTime. | 2
Months Supply 2.2 2.4 + 9.1% -- -- --
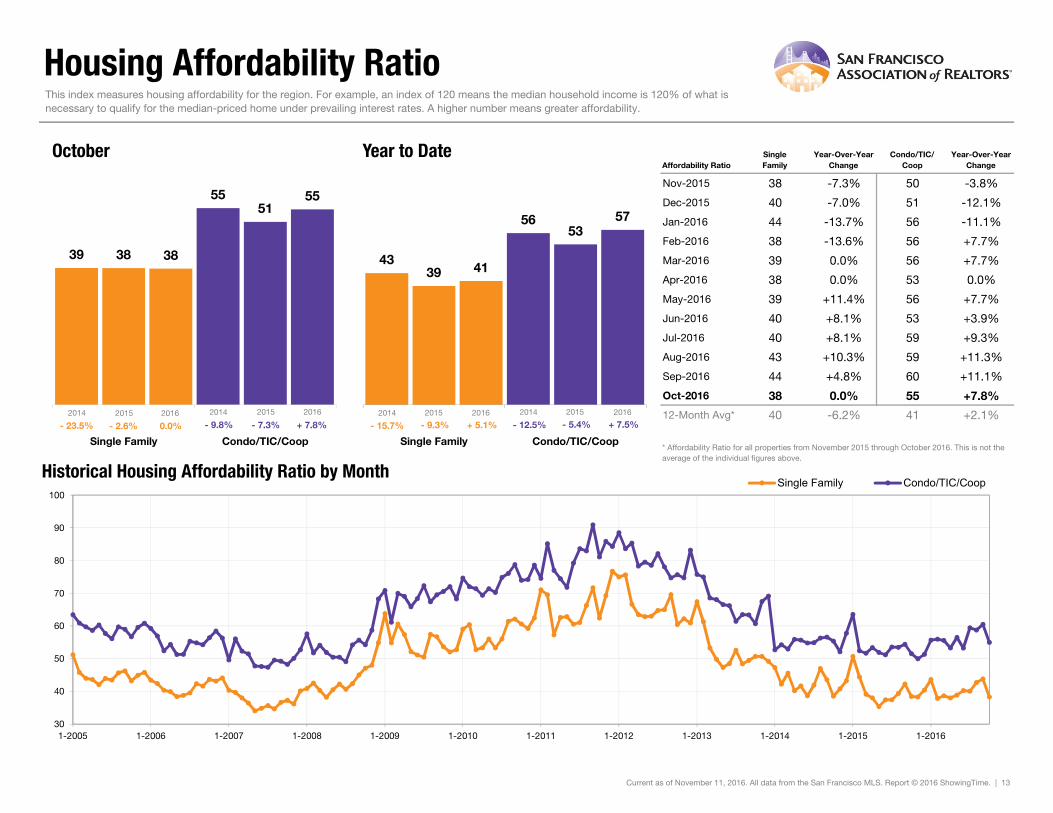
Affordability Ratio 38 38 0.0%
10-2013 10-2014 10-2015 10-2016
10-2013 10-2014 10-2015 10-2016
10-2013 10-2014 10-2015 10-2016
10-2013 10-2014 10-2015 10-2016
10-2013 10-2014 10-2015 10-2016
10-2013 10-2014 10-2015 10-2016
10-2013 10-2014 10-2015 10-2016
10-2013 10-2014 10-2015 10-2016
10-2013 10-2014 10-2015 10-2016
10-2013 10-2014 10-2015 10-2016
10-2013 10-2014 10-2015 10-2016
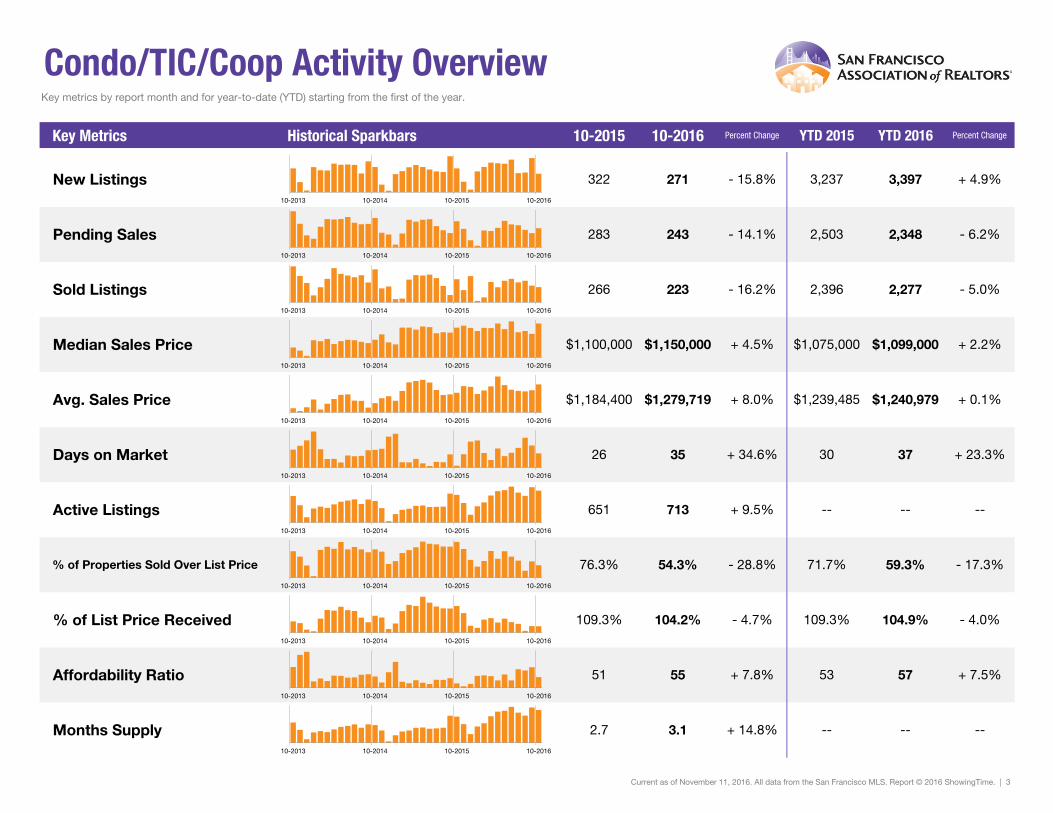
Condo/TIC/Coop Activity OverviewKey metrics by report month and for year-to-date (YTD) starting from the first of the year.
Key Metrics Historical Sparkbars 10-2015 10-2016 Percent Change YTD 2015 YTD 2016 Percent Change
+ 4.9%
Pending Sales 283 243 - 14.1% 2,503 2,348 - 6.2%
New Listings 322 271 - 15.8% 3,237 3,397
Sold Listings 266 223 - 16.2% 2,396 2,277 - 5.0%
Median Sales Price $1,100,000 $1,150,000 + 4.5% $1,075,000 $1,099,000 + 2.2%
+ 0.1%
37 + 23.3%
$1,240,979
-- --
Days on Market 26 35 + 34.6% 30
Avg. Sales Price $1,184,400 $1,279,719 + 8.0% $1,239,485
Active Listings 651 713 + 9.5% --
% of Properties Sold Over List Price 76.3% 54.3% - 28.8% 71.7%
53
59.3% - 17.3%
- 4.0%
57 + 7.5%
104.9%% of List Price Received 109.3% 104.2% - 4.7% 109.3%
Current as of November 11, 2016. All data from the San Francisco MLS. Report © 2016 ShowingTime. | 3
Months Supply 2.7 3.1 + 14.8% -- -- --
Affordability Ratio 51 55 + 7.8%
10-2013 10-2014 10-2015 10-2016
10-2013 10-2014 10-2015 10-2016
10-2013 10-2014 10-2015 10-2016
10-2013 10-2014 10-2015 10-2016
10-2013 10-2014 10-2015 10-2016
10-2013 10-2014 10-2015 10-2016
10-2013 10-2014 10-2015 10-2016
10-2013 10-2014 10-2015 10-2016
10-2013 10-2014 10-2015 10-2016
10-2013 10-2014 10-2015 10-2016
10-2013 10-2014 10-2015 10-2016
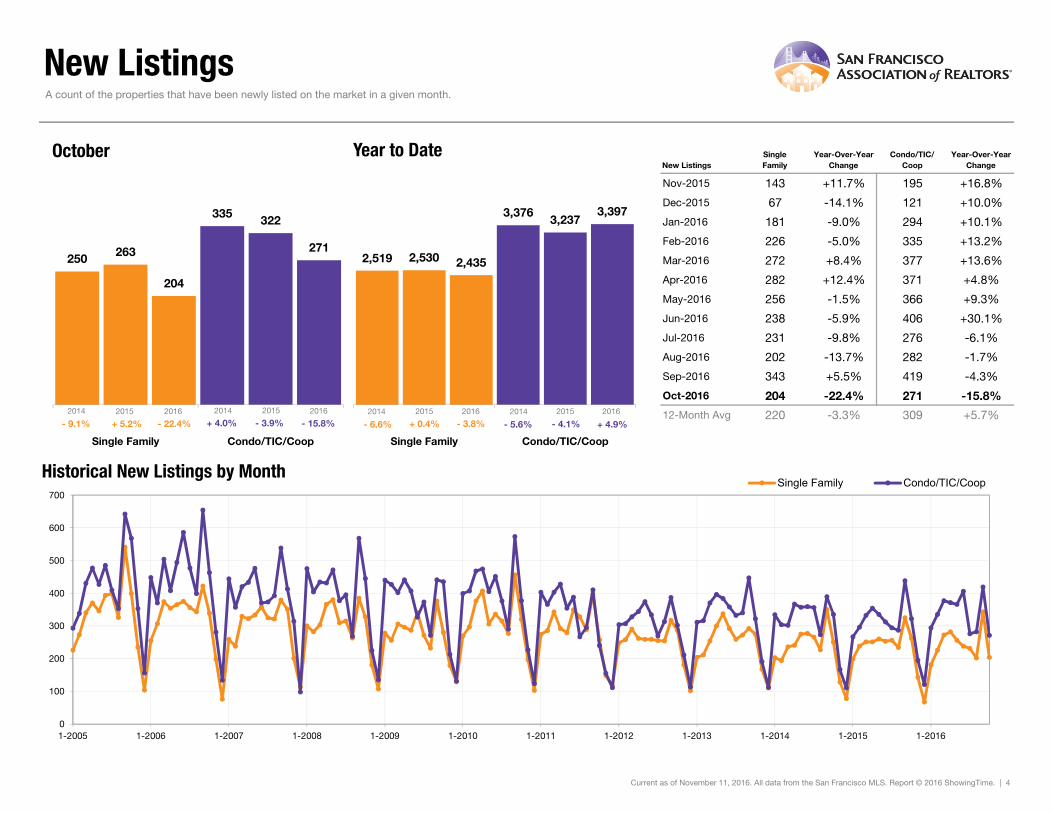
New Listings
New ListingsSingleFamily
Year-Over-YearChange
Condo/TIC/Coop
Year-Over-YearChange
Nov-2015 143 +11.7% 195 +16.8%
Dec-2015 67 -14.1% 121 +10.0%
Jan-2016 181 -9.0% 294 +10.1%
Feb-2016 226 -5.0% 335 +13.2%
Mar-2016 272 +8.4% 377 +13.6%
Apr-2016 282 +12.4% 371 +4.8%
May-2016 256 -1.5% 366 +9.3%
Jun-2016 238 -5.9% 406 +30.1%
Jul-2016 231 -9.8% 276 -6.1%
Aug-2016 202 -13.7% 282 -1.7%
Sep-2016 343 +5.5% 419 -4.3%
Oct-2016 204 -22.4% 271 -15.8%
12-Month Avg 220 -3.3% 309 +5.7%
Historical New Listings by Month
Current as of November 11, 2016. All data from the San Francisco MLS. Report © 2016 ShowingTime. | 4
A count of the properties that have been newly listed on the market in a given month.
250
335
263
322
204
271
Single Family Condo/TIC/Coop
October
0
100
200
300
400
500
600
700
1-2005 1-2006 1-2007 1-2008 1-2009 1-2010 1-2011 1-2012 1-2013 1-2014 1-2015 1-2016
Single Family Condo/TIC/Coop
2,519
3,376
2,530
3,237
2,435
3,397
Single Family Condo/TIC/Coop
Year to Date
2014 2015 2016
- 15.8%- 3.9%- 22.4%+ 5.2% - 4.1%- 3.8%+ 0.4% + 4.9%
2014 2015 2016 2014 2015 2016 2014 2015 2016
- 9.1% - 6.6% - 5.6%+ 4.0%
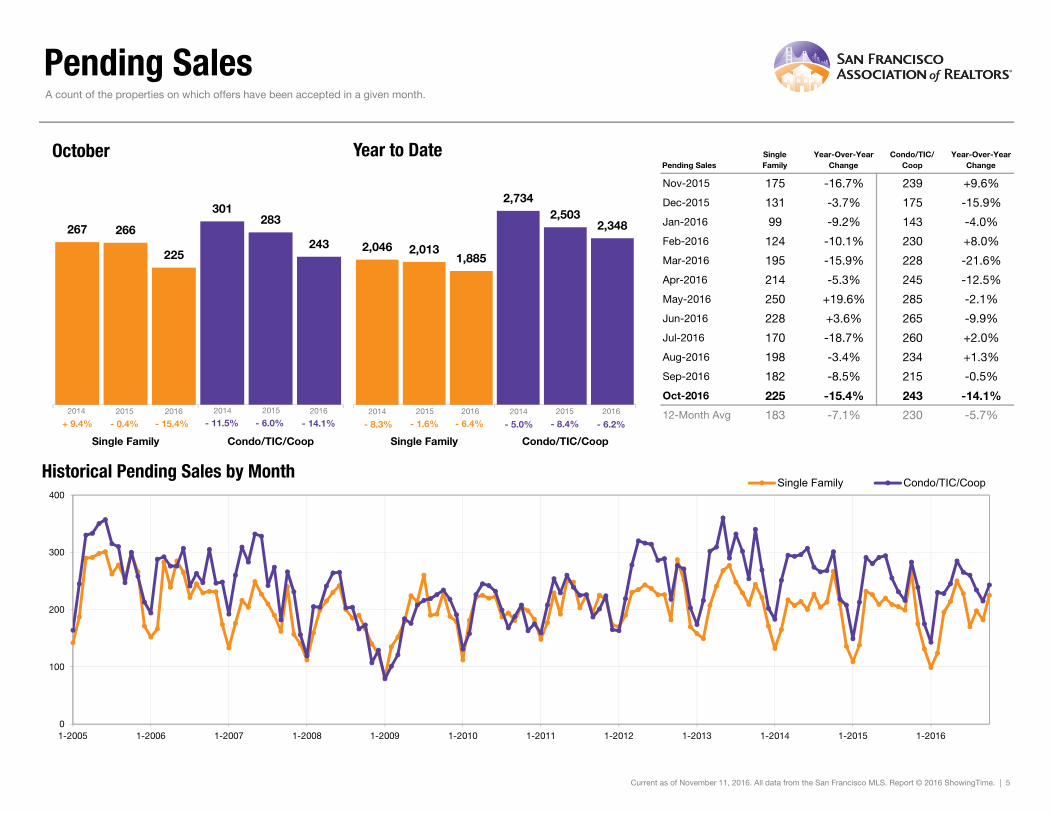
Pending Sales
Pending SalesSingleFamily
Year-Over-YearChange
Condo/TIC/Coop
Year-Over-YearChange
Nov-2015 175 -16.7% 239 +9.6%
Dec-2015 131 -3.7% 175 -15.9%
Jan-2016 99 -9.2% 143 -4.0%
Feb-2016 124 -10.1% 230 +8.0%
Mar-2016 195 -15.9% 228 -21.6%
Apr-2016 214 -5.3% 245 -12.5%
May-2016 250 +19.6% 285 -2.1%
Jun-2016 228 +3.6% 265 -9.9%
Jul-2016 170 -18.7% 260 +2.0%
Aug-2016 198 -3.4% 234 +1.3%
Sep-2016 182 -8.5% 215 -0.5%
Oct-2016 225 -15.4% 243 -14.1%
12-Month Avg 183 -7.1% 230 -5.7%
Historical Pending Sales by Month
Current as of November 11, 2016. All data from the San Francisco MLS. Report © 2016 ShowingTime. | 5
A count of the properties on which offers have been accepted in a given month.
267
301
266283
225243
Single Family Condo/TIC/Coop
October
0
100
200
300
400
1-2005 1-2006 1-2007 1-2008 1-2009 1-2010 1-2011 1-2012 1-2013 1-2014 1-2015 1-2016
Single Family Condo/TIC/Coop
2,046
2,734
2,013
2,503
1,885
2,348
Single Family Condo/TIC/Coop
Year to Date
2014 2015 2016
- 14.1%- 6.0%- 15.4%- 0.4% - 8.4%- 6.4%- 1.6% - 6.2%
2014 2015 2016 2014 2015 2016 2014 2015 2016
+ 9.4% - 8.3% - 5.0%- 11.5%
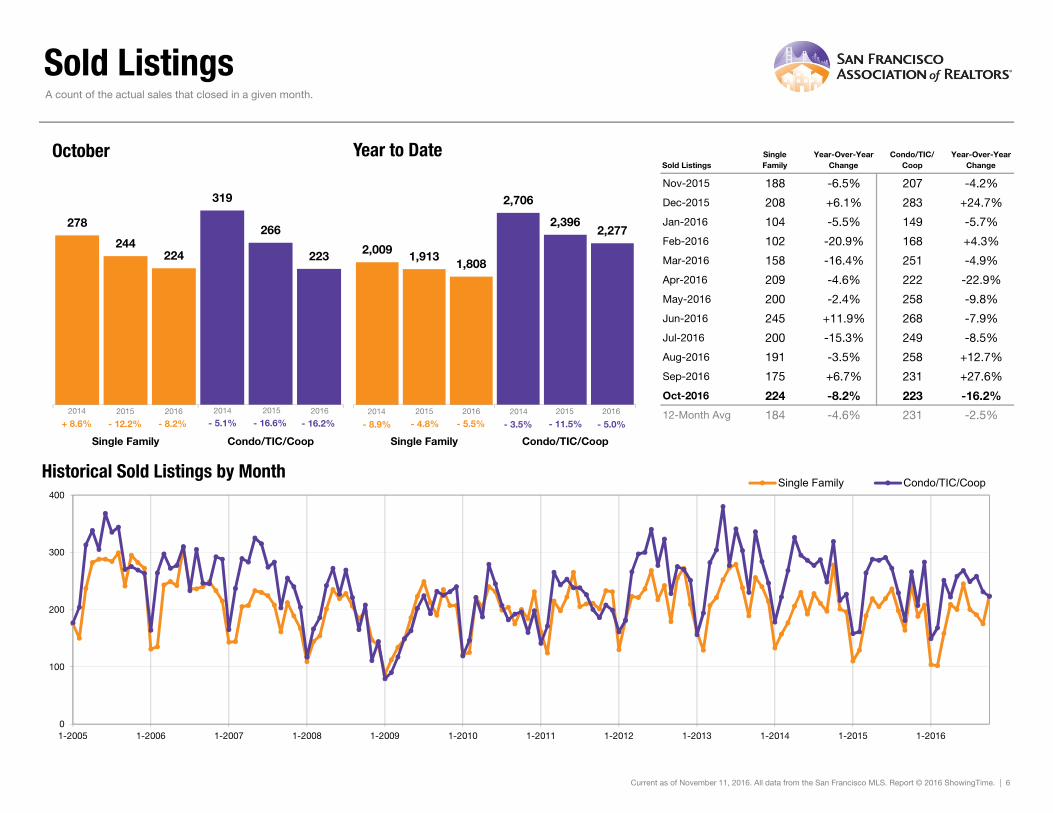
Sold Listings
Sold ListingsSingleFamily
Year-Over-YearChange
Condo/TIC/Coop
Year-Over-YearChange
Nov-2015 188 -6.5% 207 -4.2%
Dec-2015 208 +6.1% 283 +24.7%
Jan-2016 104 -5.5% 149 -5.7%
Feb-2016 102 -20.9% 168 +4.3%
Mar-2016 158 -16.4% 251 -4.9%
Apr-2016 209 -4.6% 222 -22.9%
May-2016 200 -2.4% 258 -9.8%
Jun-2016 245 +11.9% 268 -7.9%
Jul-2016 200 -15.3% 249 -8.5%
Aug-2016 191 -3.5% 258 +12.7%
Sep-2016 175 +6.7% 231 +27.6%
Oct-2016 224 -8.2% 223 -16.2%
12-Month Avg 184 -4.6% 231 -2.5%
Historical Sold Listings by Month
Current as of November 11, 2016. All data from the San Francisco MLS. Report © 2016 ShowingTime. | 6
A count of the actual sales that closed in a given month.
278
319
244266
224 223
Single Family Condo/TIC/Coop
October
0
100
200
300
400
1-2005 1-2006 1-2007 1-2008 1-2009 1-2010 1-2011 1-2012 1-2013 1-2014 1-2015 1-2016
Single Family Condo/TIC/Coop
2,009
2,706
1,913
2,396
1,808
2,277
Single Family Condo/TIC/Coop
Year to Date
2014 2015 2016
- 16.2%- 16.6%- 8.2%- 12.2% - 11.5%- 5.5%- 4.8% - 5.0%
2014 2015 2016 2014 2015 2016 2014 2015 2016
+ 8.6% - 8.9% - 3.5%- 5.1%
Median Sales Price
Median Sales PriceSingleFamily
Year-Over-YearChange
Condo/TIC/Coop
Year-Over-YearChange
Nov-2015 $1,262,500 +12.1% $1,125,000 +10.3%
Dec-2015 $1,201,500 +12.1% $1,098,000 +18.7%
Jan-2016 $1,167,500 +19.7% $1,060,000 +17.8%
Feb-2016 $1,390,000 +24.7% $1,097,500 -0.2%
Mar-2016 $1,352,500 +8.2% $1,095,000 -0.5%
Apr-2016 $1,380,000 +6.2% $1,149,500 +6.7%
May-2016 $1,350,000 -3.6% $1,082,500 -2.7%
Jun-2016 $1,325,000 +1.9% $1,175,000 +6.3%
Jul-2016 $1,330,000 +3.9% $1,045,000 +1.1%
Aug-2016 $1,250,000 +2.0% $1,060,000 +1.4%
Sep-2016 $1,215,000 +5.2% $1,025,000 -1.4%
Oct-2016 $1,407,500 +11.0% $1,150,000 +4.5%
12-Month Avg* $1,306,944 +6.7% $1,100,000 +3.8%
Historical Median Sales Price by Month* Median Sales Price for all properties from November 2015 through October 2016. This is not the average of the individual figures above.
Current as of November 11, 2016. All data from the San Francisco MLS. Report © 2016 ShowingTime. | 7
Point at which half of the sales sold for more and half sold for less, not accounting for seller concessions, in a given month.
$1,190,000
$955,000
$1,267,500
$1,100,000
$1,407,500
$1,150,000
Single Family Condo/TIC/Coop
October
$400,000
$600,000
$800,000
$1,000,000
$1,200,000
$1,400,000
$1,600,000
1-2005 1-2006 1-2007 1-2008 1-2009 1-2010 1-2011 1-2012 1-2013 1-2014 1-2015 1-2016
Single Family Condo/TIC/Coop
$1,060,000
$937,700
$1,250,000
$1,075,000
$1,326,500
$1,099,000
Single Family Condo/TIC/Coop
Year to Date
2014 2015 2016
+ 4.5%+ 15.2%+ 11.0%+ 6.5% + 14.6%+ 6.1%+ 17.9% + 2.2%
2014 2015 2016 2014 2015 2016 2014 2015 2016
+ 31.5% + 17.1% + 14.4%+ 10.5%
Average Sales Price
Avg. Sales PriceSingleFamily
Year-Over-YearChange
Condo/TIC/Coop
Year-Over-YearChange
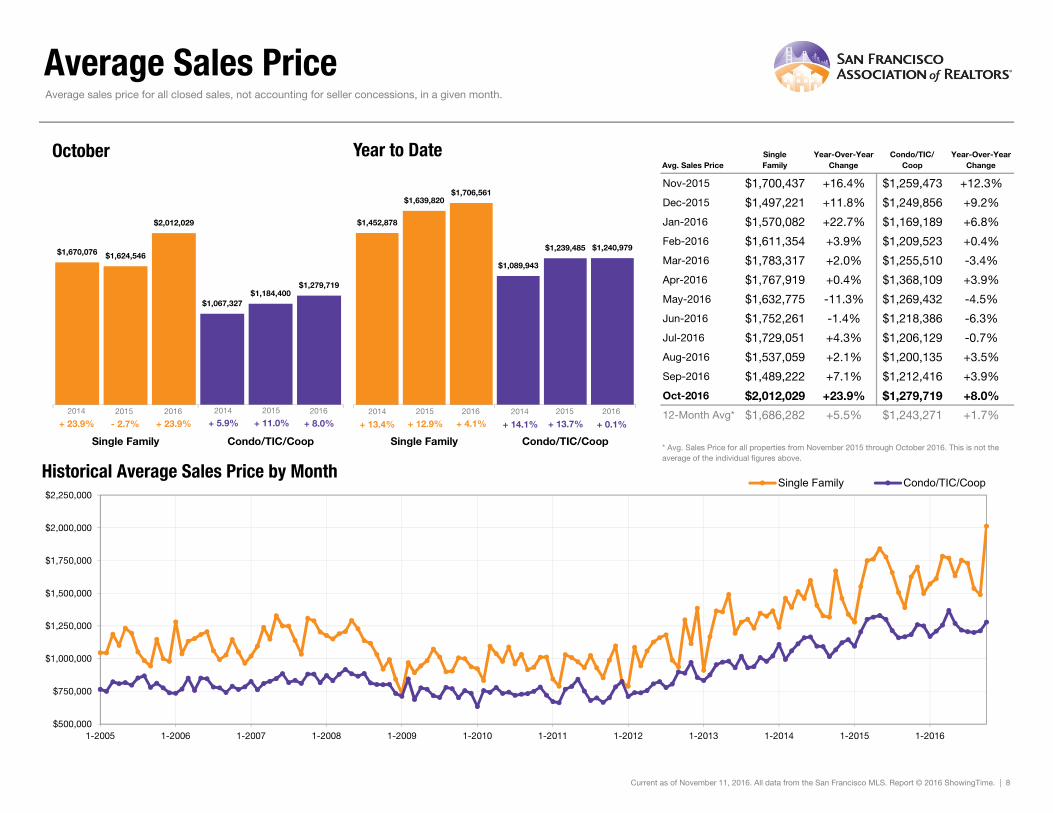
Nov-2015 $1,700,437 +16.4% $1,259,473 +12.3%
Dec-2015 $1,497,221 +11.8% $1,249,856 +9.2%
Jan-2016 $1,570,082 +22.7% $1,169,189 +6.8%
Feb-2016 $1,611,354 +3.9% $1,209,523 +0.4%
Mar-2016 $1,783,317 +2.0% $1,255,510 -3.4%
Apr-2016 $1,767,919 +0.4% $1,368,109 +3.9%
May-2016 $1,632,775 -11.3% $1,269,432 -4.5%
Jun-2016 $1,752,261 -1.4% $1,218,386 -6.3%
Jul-2016 $1,729,051 +4.3% $1,206,129 -0.7%
Aug-2016 $1,537,059 +2.1% $1,200,135 +3.5%
Sep-2016 $1,489,222 +7.1% $1,212,416 +3.9%
Oct-2016 $2,012,029 +23.9% $1,279,719 +8.0%
12-Month Avg* $1,686,282 +5.5% $1,243,271 +1.7%
Historical Average Sales Price by Month* Avg. Sales Price for all properties from November 2015 through October 2016. This is not the average of the individual figures above.
Current as of November 11, 2016. All data from the San Francisco MLS. Report © 2016 ShowingTime. | 8
Average sales price for all closed sales, not accounting for seller concessions, in a given month.
$1,670,076
$1,067,327
$1,624,546
$1,184,400
$2,012,029
$1,279,719
Single Family Condo/TIC/Coop
October
$500,000
$750,000
$1,000,000
$1,250,000
$1,500,000
$1,750,000
$2,000,000
$2,250,000
1-2005 1-2006 1-2007 1-2008 1-2009 1-2010 1-2011 1-2012 1-2013 1-2014 1-2015 1-2016
Single Family Condo/TIC/Coop
$1,452,878
$1,089,943
$1,639,820
$1,239,485
$1,706,561
$1,240,979
Single Family Condo/TIC/Coop
Year to Date
2014 2015 2016
+ 8.0%+ 11.0%+ 23.9%- 2.7% + 13.7%+ 4.1%+ 12.9% + 0.1%
2014 2015 2016 2014 2015 2016 2014 2015 2016
+ 23.9% + 13.4% + 14.1%+ 5.9%
Days on Market Until Sale
Days on MarketSingleFamily
Year-Over-YearChange
Condo/TIC/Coop
Year-Over-YearChange
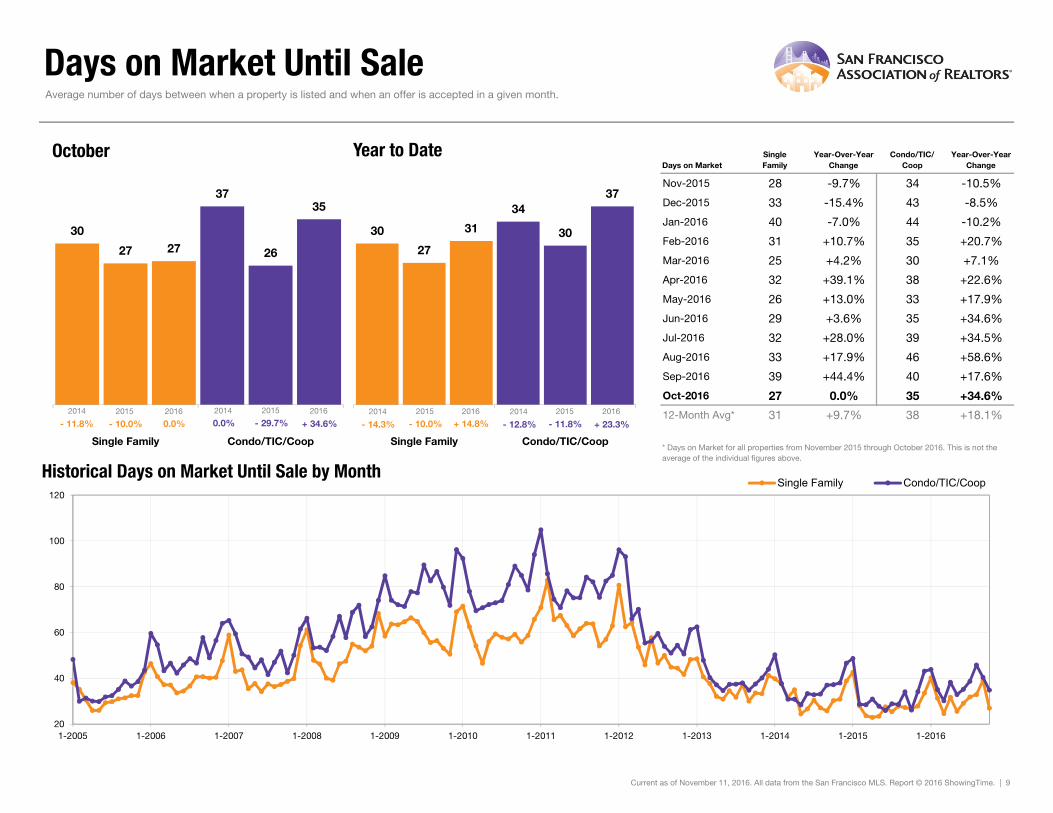
Nov-2015 28 -9.7% 34 -10.5%
Dec-2015 33 -15.4% 43 -8.5%
Jan-2016 40 -7.0% 44 -10.2%
Feb-2016 31 +10.7% 35 +20.7%
Mar-2016 25 +4.2% 30 +7.1%
Apr-2016 32 +39.1% 38 +22.6%
May-2016 26 +13.0% 33 +17.9%
Jun-2016 29 +3.6% 35 +34.6%
Jul-2016 32 +28.0% 39 +34.5%
Aug-2016 33 +17.9% 46 +58.6%
Sep-2016 39 +44.4% 40 +17.6%
Oct-2016 27 0.0% 35 +34.6%
12-Month Avg* 31 +9.7% 38 +18.1%
Historical Days on Market Until Sale by Month* Days on Market for all properties from November 2015 through October 2016. This is not the average of the individual figures above.
Current as of November 11, 2016. All data from the San Francisco MLS. Report © 2016 ShowingTime. | 9
Average number of days between when a property is listed and when an offer is accepted in a given month.
30
37
27 2627
35
Single Family Condo/TIC/Coop
October
20
40
60
80
100
120
1-2005 1-2006 1-2007 1-2008 1-2009 1-2010 1-2011 1-2012 1-2013 1-2014 1-2015 1-2016
Single Family Condo/TIC/Coop
30
34
273031
37
Single Family Condo/TIC/Coop
Year to Date
2014 2015 2016
+ 34.6%- 29.7%0.0%- 10.0% - 11.8%+ 14.8%- 10.0% + 23.3%
2014 2015 2016 2014 2015 2016 2014 2015 2016
- 11.8% - 14.3% - 12.8%0.0%
Inventory of Active Listings
Active ListingsSingleFamily
Year-Over-YearChange
Condo/TIC/Coop
Year-Over-YearChange
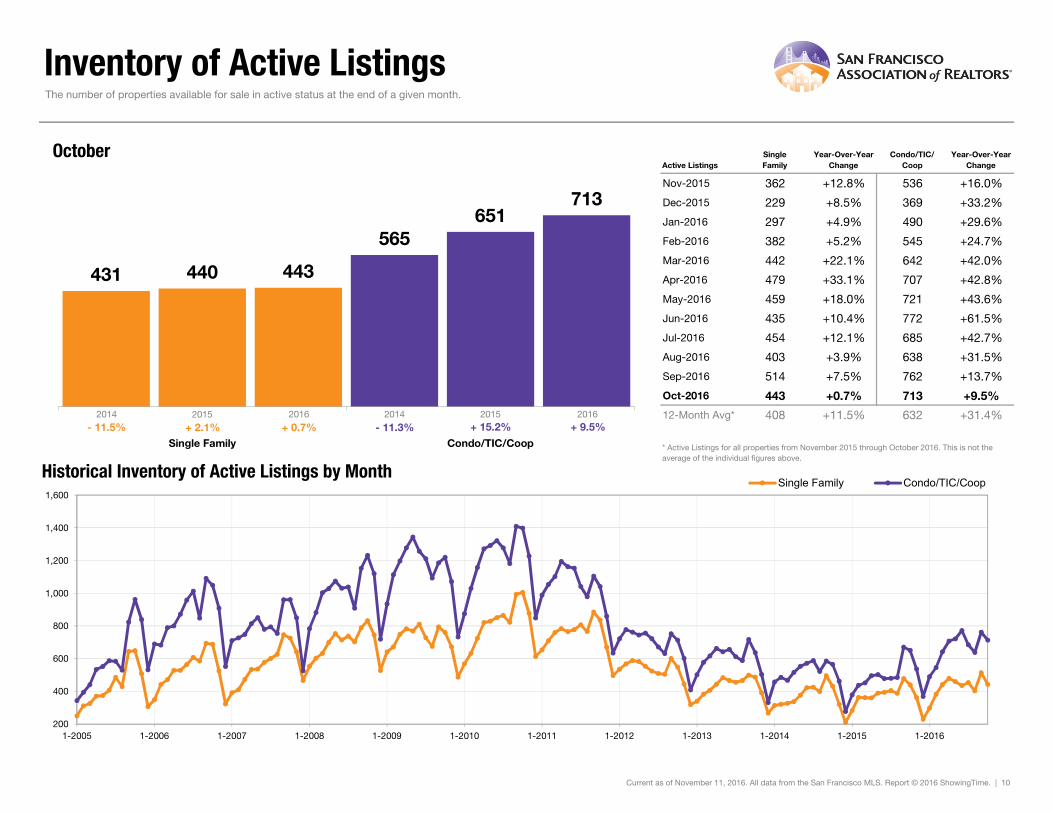
Nov-2015 362 +12.8% 536 +16.0%
Dec-2015 229 +8.5% 369 +33.2%
Jan-2016 297 +4.9% 490 +29.6%
Feb-2016 382 +5.2% 545 +24.7%
Mar-2016 442 +22.1% 642 +42.0%
Apr-2016 479 +33.1% 707 +42.8%
May-2016 459 +18.0% 721 +43.6%
Jun-2016 435 +10.4% 772 +61.5%
Jul-2016 454 +12.1% 685 +42.7%
Aug-2016 403 +3.9% 638 +31.5%
Sep-2016 514 +7.5% 762 +13.7%
Oct-2016 443 +0.7% 713 +9.5%
12-Month Avg* 408 +11.5% 632 +31.4%
Historical Inventory of Active Listings by Month* Active Listings for all properties from November 2015 through October 2016. This is not the average of the individual figures above.
Current as of November 11, 2016. All data from the San Francisco MLS. Report © 2016 ShowingTime. | 10
The number of properties available for sale in active status at the end of a given month.
431
565
440
651
443
713
Single Family Condo/TIC/Coop
October
200
400
600
800
1,000
1,200
1,400
1,600
1-2005 1-2006 1-2007 1-2008 1-2009 1-2010 1-2011 1-2012 1-2013 1-2014 1-2015 1-2016
Single Family Condo/TIC/Coop
2014 2015 2016+ 9.5%+ 15.2%+ 0.7%+ 2.1%
2014 2015 2016
- 11.5% - 11.3%
% of Properties Sold Over List Price
% of Properties Sold Over List Price
SingleFamily
Year-Over-YearChange
Condo/TIC/Coop
Year-Over-YearChange
Nov-2015 77.7% -2.9% 69.6% +3.7%
Dec-2015 79.3% +7.2% 59.4% +7.0%
Jan-2016 76.0% +17.8% 53.0% -8.9%
Feb-2016 77.5% -5.7% 58.3% -11.4%
Mar-2016 82.3% +7.3% 67.7% -1.3%
Apr-2016 75.6% -9.6% 60.4% -15.2%
May-2016 79.5% -4.7% 67.4% -12.0%
Jun-2016 71.8% -16.8% 62.3% -16.5%
Jul-2016 77.0% -8.7% 58.6% -20.7%
Aug-2016 75.9% -15.1% 49.2% -31.8%
Sep-2016 78.3% -11.4% 58.0% -19.2%
Oct-2016 78.6% -5.5% 54.3% -28.8%
12-Month Avg 77.3% -5.7% 60.1% -14.3%
Historical % of Properties Sold Over List Price by Month* % of Properties Sold Over List Price for all properties from November 2015 through October 2016. This is not the average of the individual figures above.
Current as of November 11, 2016. All data from the San Francisco MLS. Report © 2016 ShowingTime. | 11
Percentage found when dividing the number of properties sold by properties sold over its original list price, not accounting for seller concessions.
82.4%
69.3%
83.2%76.3%78.6%
54.3%
Single Family Condo/TIC/Coop
October
0.0%
20.0%
40.0%
60.0%
80.0%
100.0%
1-2005 1-2006 1-2007 1-2008 1-2009 1-2010 1-2011 1-2012 1-2013 1-2014 1-2015 1-2016
Single Family Condo/TIC/Coop
80.6%
68.7%
83.1%
71.7%77.0%
59.3%
Single Family Condo/TIC/Coop
Year to Date
2014 2015 2016
- 28.8%+ 10.1%- 5.5%+ 1.0% + 4.4%- 7.3%+ 3.1% - 17.3%
2014 2015 2016 2014 2015 2016 2014 2015 2016
+ 2.0% + 4.8% + 4.6%+ 2.5%
% of List Price Received
% of List Price Received
SingleFamily
Year-Over-YearChange
Condo/TIC/Coop
Year-Over-YearChange
Nov-2015 112.4% +1.0% 107.5% +1.0%
Dec-2015 112.3% +3.0% 104.3% +0.8%
Jan-2016 111.0% +2.9% 103.8% -1.0%
Feb-2016 112.6% -1.7% 105.9% -2.0%
Mar-2016 114.7% +0.9% 106.3% -3.0%
Apr-2016 113.3% -3.0% 105.2% -3.8%
May-2016 115.2% -2.7% 106.1% -5.0%
Jun-2016 110.3% -5.8% 105.3% -4.4%
Jul-2016 112.0% -4.9% 104.8% -4.0%
Aug-2016 111.5% -4.9% 103.1% -5.2%
Sep-2016 110.9% -5.8% 104.3% -4.0%
Oct-2016 111.2% -2.9% 104.2% -4.7%
12-Month Avg* 112.3% -2.4% 105.1% -3.3%
Historical % of List Price Received by Month* % of List Price Received for all properties from November 2015 through October 2016. This is not the average of the individual figures above.
Current as of November 11, 2016. All data from the San Francisco MLS. Report © 2016 ShowingTime. | 12
Percentage found when dividing a property’s sales price by its most recent list price, then taking the average for all properties sold in a given month, not accounting for seller concessions.
113.0%106.9%
114.5%109.3%111.2%
104.2%
Single Family Condo/TIC/Coop
October
112.7%107.2%
116.0%109.3%112.2%
104.9%
Single Family Condo/TIC/Coop
Year to Date
95.0%
100.0%
105.0%
110.0%
115.0%
120.0%
1-2005 1-2006 1-2007 1-2008 1-2009 1-2010 1-2011 1-2012 1-2013 1-2014 1-2015 1-2016
Single Family Condo/TIC/Coop
2014 2015 2016
- 4.7%+ 2.2%- 2.9%+ 1.3%
2014 2015 2016
+ 2.5% + 1.3%2014 2015 2016
- 4.0%+ 2.0%- 3.3%+ 2.9%
2014 2015 2016
+ 2.3% + 1.6%
Housing Affordability Ratio
Affordability RatioSingleFamily
Year-Over-YearChange
Condo/TIC/Coop
Year-Over-YearChange
Nov-2015 38 -7.3% 50 -3.8%
Dec-2015 40 -7.0% 51 -12.1%
Jan-2016 44 -13.7% 56 -11.1%
Feb-2016 38 -13.6% 56 +7.7%
Mar-2016 39 0.0% 56 +7.7%
Apr-2016 38 0.0% 53 0.0%
May-2016 39 +11.4% 56 +7.7%
Jun-2016 40 +8.1% 53 +3.9%
Jul-2016 40 +8.1% 59 +9.3%
Aug-2016 43 +10.3% 59 +11.3%
Sep-2016 44 +4.8% 60 +11.1%
Oct-2016 38 0.0% 55 +7.8%
12-Month Avg* 40 -6.2% 41 +2.1%
Historical Housing Affordability Ratio by Month* Affordability Ratio for all properties from November 2015 through October 2016. This is not the average of the individual figures above.
Current as of November 11, 2016. All data from the San Francisco MLS. Report © 2016 ShowingTime. | 13
This index measures housing affordability for the region. For example, an index of 120 means the median household income is 120% of what is necessary to qualify for the median-priced home under prevailing interest rates. A higher number means greater affordability.
39
55
38
51
38
55
Single Family Condo/TIC/Coop
October
30
40
50
60
70
80
90
100
1-2005 1-2006 1-2007 1-2008 1-2009 1-2010 1-2011 1-2012 1-2013 1-2014 1-2015 1-2016
Single Family Condo/TIC/Coop
2014 2015 2016
+ 7.8%- 7.3%0.0%- 2.6%
2014 2015 2016
- 23.5% - 9.8%
43
56
39
53
41
57
Single Family Condo/TIC/Coop
Year to Date
2014 2015 2016
+ 7.5%- 5.4%+ 5.1%- 9.3%2014 2015 2016
- 15.7% - 12.5%
Months Supply of Inventory
Months SupplySingleFamily
Year-Over-YearChange
Condo/TIC/Coop
Year-Over-YearChange
Nov-2015 1.9 +18.8% 2.2 +22.2%
Dec-2015 1.2 +9.1% 1.5 +36.4%
Jan-2016 1.5 +7.1% 2.0 +33.3%
Feb-2016 2.0 +5.3% 2.2 +29.4%
Mar-2016 2.3 +27.8% 2.7 +50.0%
Apr-2016 2.6 +44.4% 3.0 +57.9%
May-2016 2.4 +20.0% 3.1 +55.0%
Jun-2016 2.3 +15.0% 3.3 +73.7%
Jul-2016 2.4 +20.0% 2.9 +52.6%
Aug-2016 2.2 +10.0% 2.7 +42.1%
Sep-2016 2.8 +16.7% 3.3 +22.2%
Oct-2016 2.4 +9.1% 3.1 +14.8%
12-Month Avg* 2.2 +16.7% 2.7 +41.0%
Historical Months Supply of Inventory by Month* Months Supply for all properties from November 2015 through October 2016. This is not the average of the individual figures above.
Current as of November 11, 2016. All data from the San Francisco MLS. Report © 2016 ShowingTime. | 14
The inventory of homes for sale at the end of a given month, divided by the average monthly pending sales from the last 12 months.
2.1 2.12.22.7
2.4
3.1
Single Family Condo/TIC/Coop
October
0.0
2.0
4.0
6.0
8.0
10.0
1-2005 1-2006 1-2007 1-2008 1-2009 1-2010 1-2011 1-2012 1-2013 1-2014 1-2015 1-2016
Single Family Condo/TIC/Coop
2014 2015 2016+ 14.8%+ 28.6%+ 9.1%+ 4.8%
2014 2015 2016
- 4.5% - 8.7%
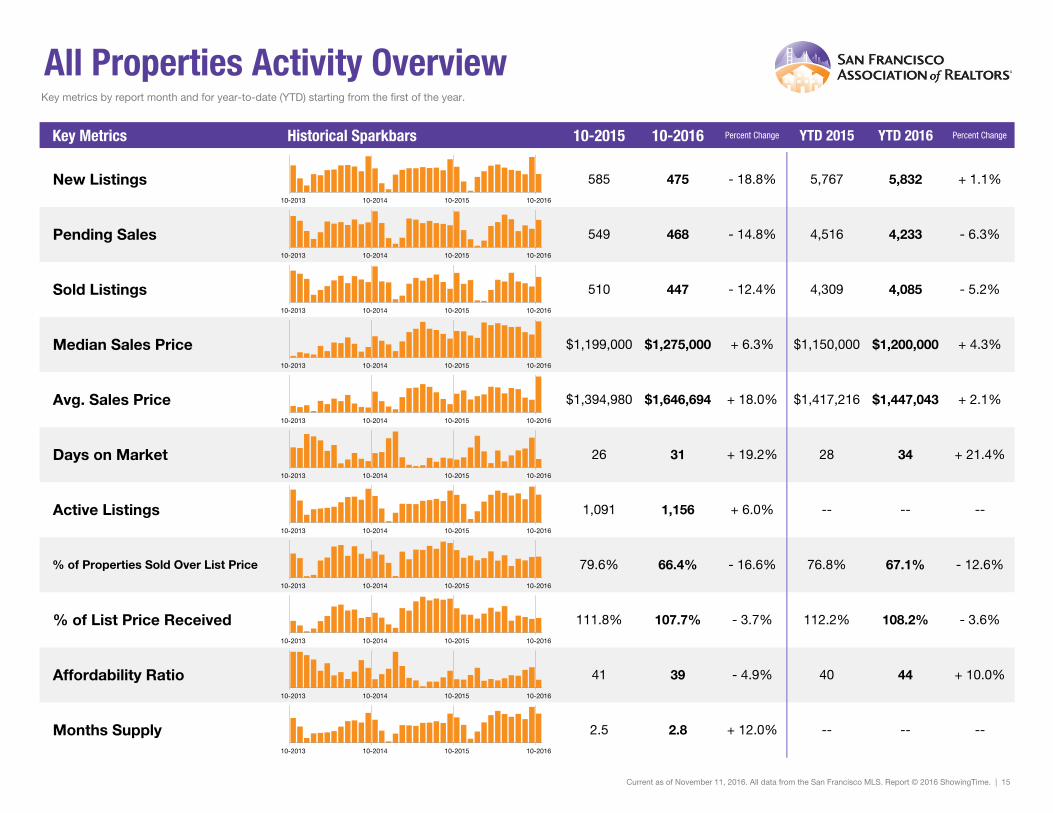
All Properties Activity OverviewKey metrics by report month and for year-to-date (YTD) starting from the first of the year.
Key Metrics Historical Sparkbars 10-2015 10-2016 Percent Change YTD 2015 YTD 2016 Percent Change
+ 1.1%
Pending Sales 549 468 - 14.8% 4,516 4,233 - 6.3%
New Listings 585 475 - 18.8% 5,767 5,832
Sold Listings 510 447 - 12.4% 4,309 4,085 - 5.2%
Median Sales Price $1,199,000 $1,275,000 + 6.3% $1,150,000 $1,200,000 + 4.3%
+ 2.1%
34 + 21.4%
$1,447,043
-- --
Days on Market 26 31 + 19.2% 28
Avg. Sales Price $1,394,980 $1,646,694 + 18.0% $1,417,216
Active Listings 1,091 1,156 + 6.0% --
% of Properties Sold Over List Price 79.6% 66.4% - 16.6% 76.8%
40
67.1% - 12.6%
- 3.6%
44 + 10.0%
108.2%% of List Price Received 111.8% 107.7% - 3.7% 112.2%
Current as of November 11, 2016. All data from the San Francisco MLS. Report © 2016 ShowingTime. | 15
Months Supply 2.5 2.8 + 12.0% -- -- --
Affordability Ratio 41 39 - 4.9%
10-2013 10-2014 10-2015 10-2016
10-2013 10-2014 10-2015 10-2016
10-2013 10-2014 10-2015 10-2016
10-2013 10-2014 10-2015 10-2016
10-2013 10-2014 10-2015 10-2016
10-2013 10-2014 10-2015 10-2016
10-2013 10-2014 10-2015 10-2016
10-2013 10-2014 10-2015 10-2016
10-2013 10-2014 10-2015 10-2016
10-2013 10-2014 10-2015 10-2016
10-2013 10-2014 10-2015 10-2016
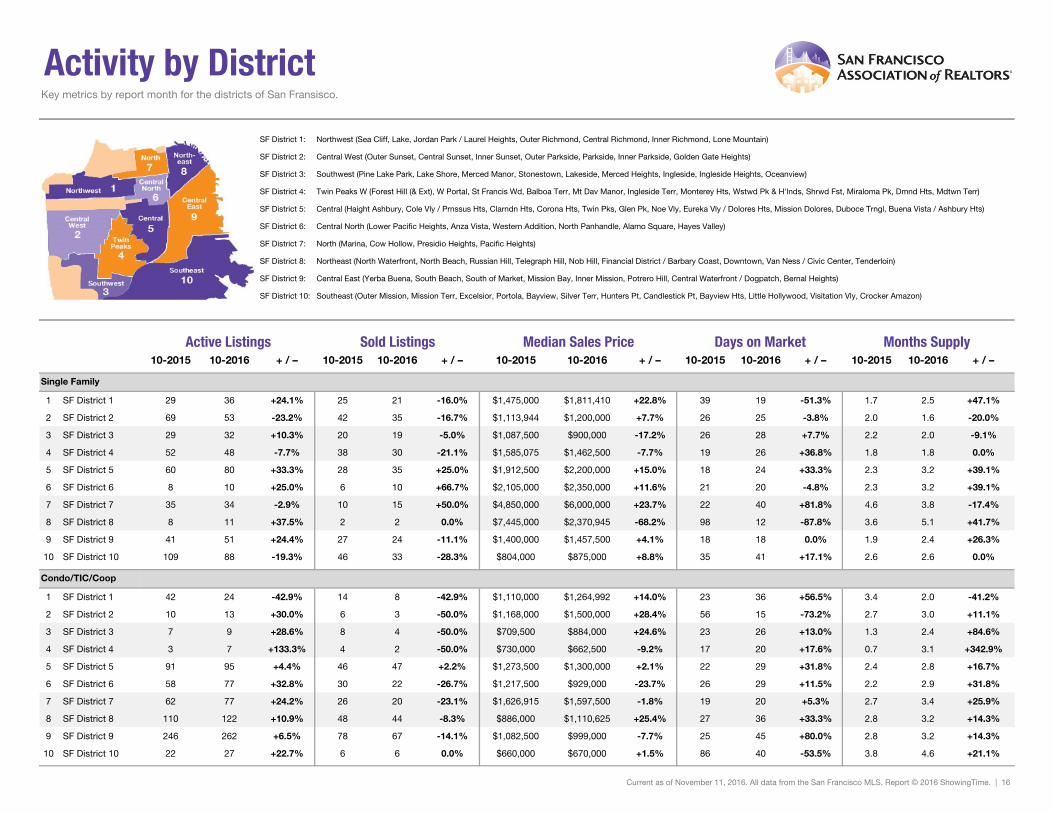
Activity by District
SF District 1: Northwest (Sea Cliff, Lake, Jordan Park / Laurel Heights, Outer Richmond, Central Richmond, Inner Richmond, Lone Mountain)
SF District 2: Central West (Outer Sunset, Central Sunset, Inner Sunset, Outer Parkside, Parkside, Inner Parkside, Golden Gate Heights)
SF District 3: Southwest (Pine Lake Park, Lake Shore, Merced Manor, Stonestown, Lakeside, Merced Heights, Ingleside, Ingleside Heights, Oceanview)
SF District 4: Twin Peaks W (Forest Hill (& Ext), W Portal, St Francis Wd, Balboa Terr, Mt Dav Manor, Ingleside Terr, Monterey Hts, Wstwd Pk & H'lnds, Shrwd Fst, Miraloma Pk, Dmnd Hts, Mdtwn Terr)
SF District 5: Central (Haight Ashbury, Cole Vly / Prnssus Hts, Clarndn Hts, Corona Hts, Twin Pks, Glen Pk, Noe Vly, Eureka Vly / Dolores Hts, Mission Dolores, Duboce Trngl, Buena Vista / Ashbury Hts)
SF District 6: Central North (Lower Pacific Heights, Anza Vista, Western Addition, North Panhandle, Alamo Square, Hayes Valley)
SF District 7: North (Marina, Cow Hollow, Presidio Heights, Pacific Heights)
SF District 8: Northeast (North Waterfront, North Beach, Russian Hill, Telegraph Hill, Nob Hill, Financial District / Barbary Coast, Downtown, Van Ness / Civic Center, Tenderloin)
SF District 9: Central East (Yerba Buena, South Beach, South of Market, Mission Bay, Inner Mission, Potrero Hill, Central Waterfront / Dogpatch, Bernal Heights)
SF District 10: Southeast (Outer Mission, Mission Terr, Excelsior, Portola, Bayview, Silver Terr, Hunters Pt, Candlestick Pt, Bayview Hts, Little Hollywood, Visitation Vly, Crocker Amazon)
10-2015 10-2016 + / – 10-2015 10-2016 + / – 10-2015 10-2016 + / – 10-2015 10-2016 + / – 10-2015 10-2016 + / –
Single Family
1 SF District 1 29 36 +24.1% 25 21 -16.0% $1,475,000 $1,811,410 +22.8% 39 19 -51.3% 1.7 2.5 +47.1%
2 SF District 2 69 53 -23.2% 42 35 -16.7% $1,113,944 $1,200,000 +7.7% 26 25 -3.8% 2.0 1.6 -20.0%
3 SF District 3 29 32 +10.3% 20 19 -5.0% $1,087,500 $900,000 -17.2% 26 28 +7.7% 2.2 2.0 -9.1%
4 SF District 4 52 48 -7.7% 38 30 -21.1% $1,585,075 $1,462,500 -7.7% 19 26 +36.8% 1.8 1.8 0.0%
5 SF District 5 60 80 +33.3% 28 35 +25.0% $1,912,500 $2,200,000 +15.0% 18 24 +33.3% 2.3 3.2 +39.1%
6 SF District 6 8 10 +25.0% 6 10 +66.7% $2,105,000 $2,350,000 +11.6% 21 20 -4.8% 2.3 3.2 +39.1%
7 SF District 7 35 34 -2.9% 10 15 +50.0% $4,850,000 $6,000,000 +23.7% 22 40 +81.8% 4.6 3.8 -17.4%
8 SF District 8 8 11 +37.5% 2 2 0.0% $7,445,000 $2,370,945 -68.2% 98 12 -87.8% 3.6 5.1 +41.7%
9 SF District 9 41 51 +24.4% 27 24 -11.1% $1,400,000 $1,457,500 +4.1% 18 18 0.0% 1.9 2.4 +26.3%
10 SF District 10 109 88 -19.3% 46 33 -28.3% $804,000 $875,000 +8.8% 35 41 +17.1% 2.6 2.6 0.0%
Condo/TIC/Coop
1 SF District 1 42 24 -42.9% 14 8 -42.9% $1,110,000 $1,264,992 +14.0% 23 36 +56.5% 3.4 2.0 -41.2%
2 SF District 2 10 13 +30.0% 6 3 -50.0% $1,168,000 $1,500,000 +28.4% 56 15 -73.2% 2.7 3.0 +11.1%
3 SF District 3 7 9 +28.6% 8 4 -50.0% $709,500 $884,000 +24.6% 23 26 +13.0% 1.3 2.4 +84.6%
4 SF District 4 3 7 +133.3% 4 2 -50.0% $730,000 $662,500 -9.2% 17 20 +17.6% 0.7 3.1 +342.9%
5 SF District 5 91 95 +4.4% 46 47 +2.2% $1,273,500 $1,300,000 +2.1% 22 29 +31.8% 2.4 2.8 +16.7%
6 SF District 6 58 77 +32.8% 30 22 -26.7% $1,217,500 $929,000 -23.7% 26 29 +11.5% 2.2 2.9 +31.8%
7 SF District 7 62 77 +24.2% 26 20 -23.1% $1,626,915 $1,597,500 -1.8% 19 20 +5.3% 2.7 3.4 +25.9%
8 SF District 8 110 122 +10.9% 48 44 -8.3% $886,000 $1,110,625 +25.4% 27 36 +33.3% 2.8 3.2 +14.3%
9 SF District 9 246 262 +6.5% 78 67 -14.1% $1,082,500 $999,000 -7.7% 25 45 +80.0% 2.8 3.2 +14.3%
10 SF District 10 22 27 +22.7% 6 6 0.0% $660,000 $670,000 +1.5% 86 40 -53.5% 3.8 4.6 +21.1%
Key metrics by report month for the districts of San Fransisco.
Current as of November 11, 2016. All data from the San Francisco MLS. Report © 2016 ShowingTime. | 16
Active Listings Sold Listings Median Sales Price Days on Market Months Supply