Embed Size (px)
Citation preview

July 2016 Monthly Snapshot
One-Year Change in One-Year Change inMedian Sales Price
Single FamilyMedian Sales Price Condo/TIC/Coop
23456789
10111213141516
Monthly Indicators
+ 6.4% + 1.0% + 0.9%One-Year Change in
Even as prices rise in many communities, homes are selling faster now than they have in the past several years. This creates a situation where buyers need to move fast in order to secure homes, and they may have to pay more for them. While increasing prices generally coax more selling activity, there has been some hesitancy among potential sellers who worry that they will not be able to buy a desirable and reasonably priced home once they sell.
New Listings were down 23.0 percent for single family homes and 26.5 percent for Condo/TIC/Coop properties. Pending Sales decreased 20.1 percent for single family homes but increased 0.4 percent for Condo/TIC/Coop properties.
The Median Sales Price was up 6.4 percent to $1,362,500 for single family homes and 1.0 percent to $1,044,000 for Condo/TIC/Coop properties. Months Supply of Inventory remained flat for single family units but was up 26.3 percent for Condo/TIC/Coop units.
Low housing supply has already prevented an outright national boon in sales activity, despite a continuation of near record-low mortgage rates and an unemployment rate under 5.0 percent deep into 2016. The issue is not purchasing power. Many areas are falling behind last year's closed sales totals simply because of lack of available inventory. As this continues, higher prices may put a deeper squeeze on the current buyer pool.
Median Sales Price All Property Types
Residential real estate activity in San Francisco County (Districts 1-10), comprised of single-family properties, townhomes and condominiums. Percent changes are calculated using rounded figures.
Single Family Activity Overview
Months Supply of Inventory
Current as of August 11, 2016. All data from the San Francisco MLS. Report © 2016 ShowingTime.
Condo/TIC/Coop Activity Overview
Inventory of Active Listings% of Properties Sold Over List Price% of List Price ReceivedHousing Affordability Ratio
All Properties Activity Overview
New ListingsPending SalesSold ListingsMedian Sales PriceAverage Sales PriceDays on Market Until Sale
Activity by District

Single Family Activity OverviewKey metrics by report month and for year-to-date (YTD) starting from the first of the year.
Key Metrics Historical Sparkbars 7-2015 7-2016 Percent Change YTD 2015 YTD 2016 Percent Change
Current as of August 11, 2016. All data from the San Francisco MLS. Report © 2016 ShowingTime. | 2
Months Supply 2.0 2.0 0.0% -- -- --
Affordability Ratio 37 39 + 5.4%
% of List Price Received 117.8% 112.1% - 4.8% 115.8%
38
76.9% - 5.5%
- 2.6%
39 + 2.6%
112.8%
% of Properties Sold Over List Price 84.3% 77.0% - 8.7% 81.4%
Active Listings 403 379 - 6.0% --
Avg. Sales Price $1,657,986 $1,744,031 + 5.2% $1,694,255
Days on Market 25 32 + 28.0% 26 30 + 15.4%
$1,713,100
-- --
Median Sales Price $1,280,000 $1,362,500 + 6.4% $1,250,000
Sold Listings 236 196 - 16.9% 1,307
New Listings 256 197 - 23.0% 1,707
Pending Sales 209 167 - 20.1% - 4.6%1,343 1,281
- 4.7%1,626
1,212 - 7.3%
$1,350,000 + 8.0%
+ 1.1%
7-2013 7-2014 7-2015 7-2016
7-2013 7-2014 7-2015 7-2016
7-2013 7-2014 7-2015 7-2016
7-2013 7-2014 7-2015 7-2016
7-2013 7-2014 7-2015 7-2016
7-2013 7-2014 7-2015 7-2016
7-2013 7-2014 7-2015 7-2016
7-2013 7-2014 7-2015 7-2016
7-2013 7-2014 7-2015 7-2016
7-2013 7-2014 7-2015 7-2016
7-2013 7-2014 7-2015 7-2016

Condo/TIC/Coop Activity OverviewKey metrics by report month and for year-to-date (YTD) starting from the first of the year.
Key Metrics Historical Sparkbars 7-2015 7-2016 Percent Change YTD 2015 YTD 2016 Percent Change
Current as of August 11, 2016. All data from the San Francisco MLS. Report © 2016 ShowingTime. | 3
Months Supply 1.9 2.4 + 26.3% -- -- --
Affordability Ratio 54 59 + 9.3%
% of List Price Received 109.2% 104.9% - 3.9% 109.4%
51
62.1% - 12.4%
- 3.6%
57 + 11.8%
105.5%
% of Properties Sold Over List Price 73.9% 59.8% - 19.1% 70.9%
Active Listings 480 569 + 18.5% --
Avg. Sales Price $1,214,445 $1,203,440 - 0.9% $1,266,212
Days on Market 29 39 + 34.5% 30
$1,100,000 + 2.1%
- 1.6%
36 + 20.0%
$1,246,583
-- --
Sold Listings 272 246 - 9.6% 1,720 1,557 - 9.5%
Median Sales Price $1,033,509 $1,044,000 + 1.0% $1,077,000
+ 6.1%
Pending Sales 255 256 + 0.4% 1,773 1,649 - 7.0%
New Listings 294 216 - 26.5% 2,190 2,3247-2013 7-2014 7-2015 7-2016
7-2013 7-2014 7-2015 7-2016
7-2013 7-2014 7-2015 7-2016
7-2013 7-2014 7-2015 7-2016
7-2013 7-2014 7-2015 7-2016
7-2013 7-2014 7-2015 7-2016
7-2013 7-2014 7-2015 7-2016
7-2013 7-2014 7-2015 7-2016
7-2013 7-2014 7-2015 7-2016
7-2013 7-2014 7-2015 7-2016
7-2013 7-2014 7-2015 7-2016

New Listings
New ListingsSingleFamily
Year-Over-YearChange
Condo/TIC/Coop
Year-Over-YearChange
Aug-2015 234 +3.5% 286 +4.8%
Sep-2015 325 -7.1% 438 +12.6%
Oct-2015 263 +5.2% 321 -4.2%
Nov-2015 143 +11.7% 195 +16.8%
Dec-2015 67 -14.1% 120 +9.1%
Jan-2016 180 -9.5% 293 +9.7%
Feb-2016 225 -5.5% 332 +12.2%
Mar-2016 272 +8.4% 373 +12.3%
Apr-2016 281 +12.0% 369 +4.2%
May-2016 251 -3.1% 357 +6.6%
Jun-2016 220 -13.0% 384 +23.1%
Jul-2016 197 -23.0% 216 -26.5%
12-Month Avg 222 -3.0% 307 +6.4%
Historical New Listings by Month
Current as of August 11, 2016. All data from the San Francisco MLS. Report © 2016 ShowingTime. | 4
A count of the properties that have been newly listed on the market in a given month.
266
356
256
294
197216
Single Family Condo/TIC/Coop
July
0
100
200
300
400
500
600
700
1-2005 1-2006 1-2007 1-2008 1-2009 1-2010 1-2011 1-2012 1-2013 1-2014 1-2015 1-2016
Single Family Condo/TIC/Coop
1,692
2,379
1,707
2,190
1,626
2,324
Single Family Condo/TIC/Coop
Year to Date
2014 2015 2016
- 26.5%- 17.4%- 23.0%- 3.8% - 7.9%- 4.7%+ 0.9% + 6.1%
2014 2015 2016 2014 2015 2016 2014 2015 2016
+ 2.7% - 8.9% - 3.6%+ 7.2%

Pending Sales
Pending SalesSingleFamily
Year-Over-YearChange
Condo/TIC/Coop
Year-Over-YearChange
Aug-2015 205 +0.5% 231 -13.2%
Sep-2015 199 -6.6% 216 -19.4%
Oct-2015 265 -0.7% 283 -6.0%
Nov-2015 175 -16.7% 239 +9.6%
Dec-2015 131 -3.7% 175 -15.9%
Jan-2016 100 -8.3% 142 -4.7%
Feb-2016 124 -10.1% 228 +7.0%
Mar-2016 195 -15.9% 228 -21.6%
Apr-2016 214 -5.3% 245 -12.5%
May-2016 250 +19.6% 286 -1.7%
Jun-2016 231 +5.0% 264 -10.2%
Jul-2016 167 -20.1% 256 +0.4%
12-Month Avg 188 -4.9% 233 -7.9%
Historical Pending Sales by Month
A count of the properties on which offers have been accepted in a given month.
Current as of August 11, 2016. All data from the San Francisco MLS. Report © 2016 ShowingTime. | 5
227
274
209
255
167
256
Single Family Condo/TIC/Coop
July
0
100
200
300
400
1-2005 1-2006 1-2007 1-2008 1-2009 1-2010 1-2011 1-2012 1-2013 1-2014 1-2015 1-2016
Single Family Condo/TIC/Coop
1,362
1,899
1,343
1,773
1,281
1,649
Single Family Condo/TIC/Coop
Year to Date
2014 2015 2016
+ 0.4%- 6.9%- 20.1%- 7.9% - 6.6%- 4.6%- 1.4% - 7.0%
2014 2015 2016 2014 2015 2016 2014 2015 2016
- 8.5% - 12.0% - 4.2%- 17.5%

Sold Listings
Sold ListingsSingleFamily
Year-Over-YearChange
Condo/TIC/Coop
Year-Over-YearChange
Aug-2015 198 -6.2% 229 -20.2%
Sep-2015 164 -16.8% 181 -27.0%
Oct-2015 243 -12.6% 266 -16.6%
Nov-2015 188 -6.5% 207 -4.2%
Dec-2015 208 +6.1% 283 +24.7%
Jan-2016 105 -4.5% 149 -5.7%
Feb-2016 102 -20.9% 165 +2.5%
Mar-2016 158 -16.4% 251 -4.9%
Apr-2016 209 -4.6% 221 -23.3%
May-2016 198 -3.4% 258 -9.8%
Jun-2016 244 +11.4% 267 -8.2%
Jul-2016 196 -16.9% 246 -9.6%
12-Month Avg 184 -7.4% 227 -9.7%
Historical Sold Listings by Month
A count of the actual sales that closed in a given month.
Current as of August 11, 2016. All data from the San Francisco MLS. Report © 2016 ShowingTime. | 6
228
277
236
272
196
246
Single Family Condo/TIC/Coop
July
0
100
200
300
400
1-2005 1-2006 1-2007 1-2008 1-2009 1-2010 1-2011 1-2012 1-2013 1-2014 1-2015 1-2016
Single Family Condo/TIC/Coop
1,323
1,852
1,307
1,720
1,212
1,557
Single Family Condo/TIC/Coop
Year to Date
2014 2015 2016
- 9.6%- 1.8%- 16.9%+ 3.5% - 7.1%- 7.3%- 1.2% - 9.5%
2014 2015 2016 2014 2015 2016 2014 2015 2016
- 18.3% - 13.1% - 4.2%- 18.8%

Median Sales Price
Median Sales PriceSingleFamily
Year-Over-YearChange
Condo/TIC/Coop
Year-Over-YearChange
Aug-2015 $1,225,444 +26.6% $1,045,000 +12.4%
Sep-2015 $1,155,000 +11.6% $1,040,000 +13.7%
Oct-2015 $1,270,000 +6.7% $1,100,000 +15.2%
Nov-2015 $1,262,500 +12.1% $1,125,000 +10.3%
Dec-2015 $1,201,500 +12.1% $1,098,000 +18.7%
Jan-2016 $1,175,000 +20.5% $1,060,000 +17.8%
Feb-2016 $1,390,000 +24.7% $1,095,000 -0.5%
Mar-2016 $1,352,500 +8.2% $1,095,000 -0.5%
Apr-2016 $1,380,000 +6.2% $1,150,000 +6.7%
May-2016 $1,355,000 -3.2% $1,082,500 -2.7%
Jun-2016 $1,330,000 +2.3% $1,175,000 +6.8%
Jul-2016 $1,362,500 +6.4% $1,044,000 +1.0%
12-Month Avg* $1,300,000 +10.6% $1,100,000 +8.9%
Historical Median Sales Price by Month
Point at which half of the sales sold for more and half sold for less, not accounting for seller concessions, in a given month.
* Median Sales Price for all properties from August 2015 through July 2016. This is not the average of the individual figures above.
Current as of August 11, 2016. All data from the San Francisco MLS. Report © 2016 ShowingTime. | 7
$1,081,000
$950,000
$1,280,000
$1,033,509
$1,362,500
$1,044,000
Single Family Condo/TIC/Coop
July
$400,000
$600,000
$800,000
$1,000,000
$1,200,000
$1,400,000
$1,600,000
1-2005 1-2006 1-2007 1-2008 1-2009 1-2010 1-2011 1-2012 1-2013 1-2014 1-2015 1-2016
Single Family Condo/TIC/Coop
$1,050,000
$940,000
$1,250,000
$1,077,000
$1,350,000
$1,100,000
Single Family Condo/TIC/Coop
Year to Date
2014 2015 2016
+ 1.0%+ 8.8%+ 6.4%+ 18.4% + 14.6%+ 8.0%+ 19.0% + 2.1%
2014 2015 2016 2014 2015 2016 2014 2015 2016
+ 24.3% + 16.8% + 14.7%+ 11.8%
Average Sales Price
Avg. Sales PriceSingleFamily
Year-Over-YearChange
Condo/TIC/Coop
Year-Over-YearChange
Aug-2015 $1,505,629 +13.5% $1,159,211 +6.2%
Sep-2015 $1,390,736 +5.6% $1,166,494 +14.9%
Oct-2015 $1,627,981 -2.5% $1,184,400 +11.0%
Nov-2015 $1,700,437 +16.4% $1,259,473 +12.3%
Dec-2015 $1,497,221 +11.8% $1,249,856 +9.2%
Jan-2016 $1,573,224 +23.0% $1,169,189 +6.8%
Feb-2016 $1,611,354 +3.9% $1,210,302 +0.5%
Mar-2016 $1,783,317 +2.0% $1,255,510 -3.4%
Apr-2016 $1,767,919 +0.4% $1,371,042 +4.1%
May-2016 $1,643,626 -10.7% $1,269,432 -4.5%
Jun-2016 $1,754,934 -1.2% $1,218,455 -6.2%
Jul-2016 $1,744,031 +5.2% $1,203,440 -0.9%
12-Month Avg* $1,639,935 +3.8% $1,229,157 +3.4%
Historical Average Sales Price by Month
Average sales price for all closed sales, not accounting for seller concessions, in a given month.
* Avg. Sales Price for all properties from August 2015 through July 2016. This is not the average of the individual figures above.
Current as of August 11, 2016. All data from the San Francisco MLS. Report © 2016 ShowingTime. | 8
$1,406,722
$1,094,531
$1,657,986
$1,214,445
$1,744,031
$1,203,440
Single Family Condo/TIC/Coop
July
$600,000
$800,000
$1,000,000
$1,200,000
$1,400,000
$1,600,000
$1,800,000
$2,000,000
1-2005 1-2006 1-2007 1-2008 1-2009 1-2010 1-2011 1-2012 1-2013 1-2014 1-2015 1-2016
Single Family Condo/TIC/Coop
$1,447,695
$1,103,512
$1,694,255
$1,266,212
$1,713,100
$1,246,583
Single Family Condo/TIC/Coop
Year to Date
2014 2015 2016
- 0.9%+ 11.0%+ 5.2%+ 17.9% + 14.7%+ 1.1%+ 17.0% - 1.6%
2014 2015 2016 2014 2015 2016 2014 2015 2016
+ 9.9% + 13.7% + 15.9%+ 7.5%

Days on Market Until Sale
Days on MarketSingleFamily
Year-Over-YearChange
Condo/TIC/Coop
Year-Over-YearChange
Aug-2015 28 +3.7% 29 -12.1%
Sep-2015 27 +3.8% 34 -8.1%
Oct-2015 25 -16.7% 26 -29.7%
Nov-2015 28 -9.7% 34 -10.5%
Dec-2015 33 -15.4% 43 -8.5%
Jan-2016 40 -7.0% 44 -10.2%
Feb-2016 31 +10.7% 35 +20.7%
Mar-2016 25 +4.2% 30 +7.1%
Apr-2016 32 +39.1% 38 +22.6%
May-2016 24 +4.3% 33 +17.9%
Jun-2016 29 +3.6% 35 +34.6%
Jul-2016 32 +28.0% 39 +34.5%
12-Month Avg* 29 +2.5% 35 +3.4%
Historical Days on Market Until Sale by Month
Average number of days between when a property is listed and when an offer is accepted in a given month.
* Days on Market for all properties from August 2015 through July 2016. This is not the average of the individual figures above.
Current as of August 11, 2016. All data from the San Francisco MLS. Report © 2016 ShowingTime. | 9
3033
2529
32
39
Single Family Condo/TIC/Coop
July
20
40
60
80
100
120
1-2005 1-2006 1-2007 1-2008 1-2009 1-2010 1-2011 1-2012 1-2013 1-2014 1-2015 1-2016
Single Family Condo/TIC/Coop
3134
26
3030
36
Single Family Condo/TIC/Coop
Year to Date
2014 2015 2016
+ 34.5%- 12.1%+ 28.0%- 16.7% - 11.8%+ 15.4%- 16.1% + 20.0%
2014 2015 2016 2014 2015 2016 2014 2015 2016
- 6.3% - 11.4% - 15.0%- 10.8%
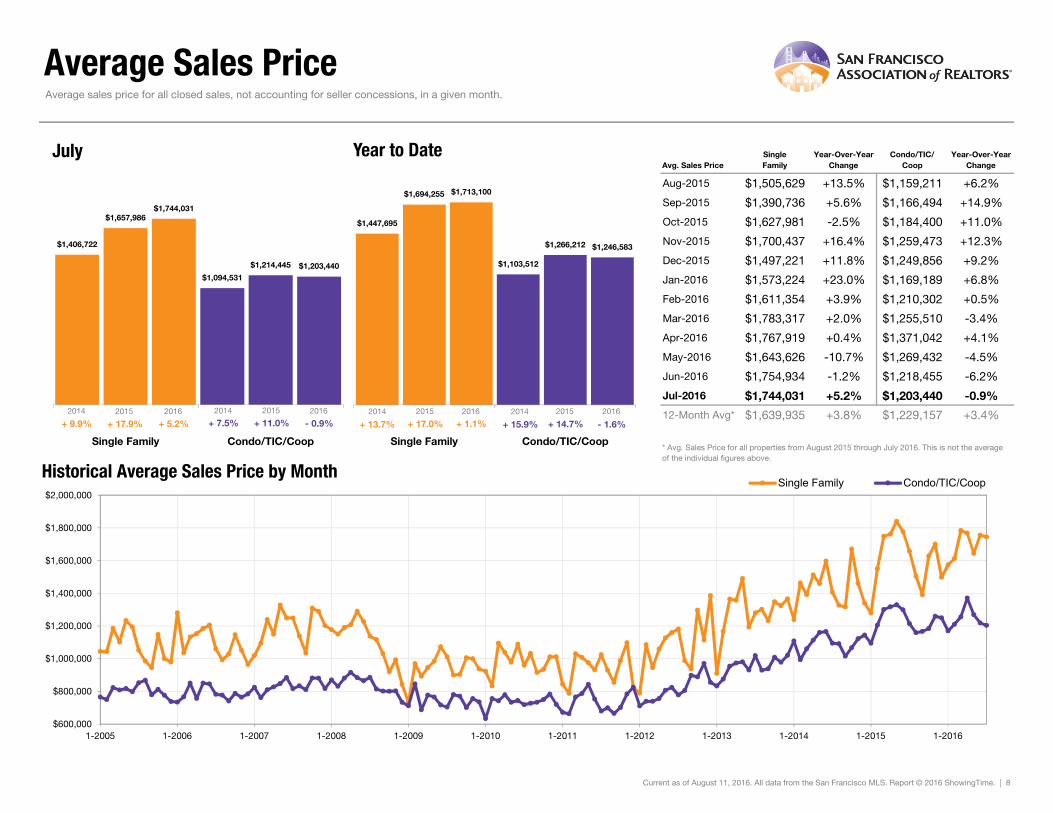
Inventory of Active Listings
Active ListingsSingleFamily
Year-Over-YearChange
Condo/TIC/Coop
Year-Over-YearChange
Aug-2015 386 -3.0% 484 -7.3%
Sep-2015 476 -3.6% 669 +14.4%
Oct-2015 439 +2.1% 648 +14.7%
Nov-2015 361 +12.8% 533 +15.4%
Dec-2015 227 +8.1% 365 +31.8%
Jan-2016 293 +3.9% 486 +28.6%
Feb-2016 377 +4.1% 538 +23.1%
Mar-2016 437 +21.1% 631 +39.6%
Apr-2016 472 +31.5% 694 +40.2%
May-2016 446 +15.2% 694 +38.2%
Jun-2016 395 +0.8% 721 +50.8%
Jul-2016 379 -6.0% 569 +18.5%
12-Month Avg* 391 +6.6% 586 +24.8%
Historical Inventory of Active Listings by Month
The number of properties available for sale in active status at the end of a given month.
* Active Listings for all properties from August 2015 through July 2016. This is not the average of the individual figures above.
Current as of August 11, 2016. All data from the San Francisco MLS. Report © 2016 ShowingTime. | 10
425
588
403480
379
569
Single Family Condo/TIC/Coop
July
200
400
600
800
1,000
1,200
1,400
1,600
1-2005 1-2006 1-2007 1-2008 1-2009 1-2010 1-2011 1-2012 1-2013 1-2014 1-2015 1-2016
Single Family Condo/TIC/Coop
2014 2015 2016+ 18.5%- 18.4%- 6.0%- 5.2%
2014 2015 2016
- 6.6% - 3.9%

% of Properties Sold Over List Price
% of Properties Sold Over List Price
SingleFamily
Year-Over-YearChange
Condo/TIC/Coop
Year-Over-YearChange
Aug-2015 89.4% +10.9% 72.1% +4.0%
Sep-2015 88.4% +14.5% 71.8% +8.0%
Oct-2015 83.1% +0.8% 76.3% +10.1%
Nov-2015 77.7% -2.9% 69.6% +3.7%
Dec-2015 79.3% +7.2% 59.4% +7.0%
Jan-2016 76.2% +18.1% 53.0% -8.9%
Feb-2016 77.5% -5.7% 58.2% -11.6%
Mar-2016 82.3% +7.3% 67.7% -1.3%
Apr-2016 75.6% -9.6% 60.6% -14.9%
May-2016 79.8% -4.3% 67.4% -12.0%
Jun-2016 72.1% -16.5% 62.5% -15.8%
Jul-2016 77.0% -8.7% 59.8% -19.1%
12-Month Avg 79.8% -0.6% 65.3% -5.2%
Historical % of Properties Sold Over List Price by Month
Percentage found when dividing the number of properties sold by properties sold over its original list price, not accounting for seller concessions.
* % of Properties Sold Over List Price for all properties from August 2015 through July 2016. This is not the average of the individual figures above.
Current as of August 11, 2016. All data from the San Francisco MLS. Report © 2016 ShowingTime. | 11
86.0%
71.5%
84.3%
73.9%77.0%
59.8%
Single Family Condo/TIC/Coop
July
0.0%
20.0%
40.0%
60.0%
80.0%
100.0%
1-2005 1-2006 1-2007 1-2008 1-2009 1-2010 1-2011 1-2012 1-2013 1-2014 1-2015 1-2016
Single Family Condo/TIC/Coop
80.8%
68.7%
81.4%
70.9%76.9%
62.1%
Single Family Condo/TIC/Coop
Year to Date
2014 2015 2016
- 19.1%+ 3.4%- 8.7%- 2.0% + 3.2%- 5.5%+ 0.7% - 12.4%
2014 2015 2016 2014 2015 2016 2014 2015 2016
+ 10.1% + 5.9% + 5.7%- 2.5%

% of List Price Received
% of List Price Received
SingleFamily
Year-Over-YearChange
Condo/TIC/Coop
Year-Over-YearChange
Aug-2015 117.3% +5.5% 108.7% +2.2%
Sep-2015 117.7% +5.5% 108.7% +3.3%
Oct-2015 114.5% +1.3% 109.3% +2.2%
Nov-2015 112.4% +1.0% 107.5% +1.0%
Dec-2015 112.3% +3.0% 104.3% +0.8%
Jan-2016 110.9% +2.8% 103.8% -1.0%
Feb-2016 112.6% -1.7% 106.0% -1.9%
Mar-2016 114.7% +0.9% 106.3% -3.0%
Apr-2016 113.3% -3.0% 105.2% -3.8%
May-2016 115.4% -2.5% 106.1% -5.0%
Jun-2016 110.3% -5.8% 105.3% -4.4%
Jul-2016 112.1% -4.8% 104.9% -3.9%
12-Month Avg* 113.7% -0.1% 106.4% -1.4%
Historical % of List Price Received by Month
Percentage found when dividing a property’s sales price by its most recent list price, then taking the average for all properties sold in a given month, not accounting for seller concessions.
* % of List Price Received for all properties from August 2015 through July 2016. This is not the average of the individual figures above.
Current as of August 11, 2016. All data from the San Francisco MLS. Report © 2016 ShowingTime. | 12
114.1%108.1%
117.8%109.2%112.1%
104.9%
Single Family Condo/TIC/Coop
July
113.1%107.6%
115.8%109.4%112.8%
105.5%
Single Family Condo/TIC/Coop
Year to Date
95.0%
100.0%
105.0%
110.0%
115.0%
120.0%
1-2005 1-2006 1-2007 1-2008 1-2009 1-2010 1-2011 1-2012 1-2013 1-2014 1-2015 1-2016
Single Family Condo/TIC/Coop
2014 2015 2016
- 3.9%+ 1.0%- 4.8%+ 3.2%
2014 2015 2016
+ 4.1% + 1.2%2014 2015 2016
- 3.6%+ 1.7%- 2.6%+ 2.4%
2014 2015 2016
+ 2.6% + 2.0%

Housing Affordability Ratio
Affordability RatioSingleFamily
Year-Over-YearChange
Condo/TIC/Coop
Year-Over-YearChange
Aug-2015 39 -17.0% 53 -5.4%
Sep-2015 42 -4.5% 54 -5.3%
Oct-2015 38 -2.6% 51 -7.3%
Nov-2015 38 -7.3% 50 -3.8%
Dec-2015 40 -7.0% 51 -12.1%
Jan-2016 43 -15.7% 56 -11.1%
Feb-2016 38 -13.6% 56 +7.7%
Mar-2016 39 0.0% 56 +7.7%
Apr-2016 38 0.0% 53 0.0%
May-2016 39 +11.4% 56 +7.7%
Jun-2016 40 +8.1% 53 +3.9%
Jul-2016 39 +5.4% 59 +9.3%
12-Month Avg* 40 -5.5% 41 +8.0%
Historical Housing Affordability Ratio by Month
This index measures housing affordability for the region. For example, an index of 120 means the median household income is 120% of what is necessary to qualify for the median-priced home under prevailing interest rates. A higher number means greater affordability.
* Affordability Ratio for all properties from August 2015 through July 2016. This is not the average of the individual figures above.
Current as of August 11, 2016. All data from the San Francisco MLS. Report © 2016 ShowingTime. | 13
42
55
37
54
39
59
Single Family Condo/TIC/Coop
July
30
40
50
60
70
80
90
100
1-2005 1-2006 1-2007 1-2008 1-2009 1-2010 1-2011 1-2012 1-2013 1-2014 1-2015 1-2016
Single Family Condo/TIC/Coop
2014 2015 2016
+ 9.3%- 1.8%+ 5.4%- 11.9%
2014 2015 2016
- 20.8% - 9.8%
43
55
38
51
39
57
Single Family Condo/TIC/Coop
Year to Date
2014 2015 2016
+ 11.8%- 7.3%+ 2.6%- 11.6%2014 2015 2016
- 15.7% - 14.1%

Months Supply of Inventory
Months SupplySingleFamily
Year-Over-YearChange
Condo/TIC/Coop
Year-Over-YearChange
Aug-2015 2.0 0.0% 1.9 0.0%
Sep-2015 2.4 -4.0% 2.7 +22.7%
Oct-2015 2.2 +4.8% 2.7 +28.6%
Nov-2015 1.9 +18.8% 2.2 +22.2%
Dec-2015 1.2 +9.1% 1.5 +36.4%
Jan-2016 1.5 +7.1% 2.0 +33.3%
Feb-2016 2.0 +5.3% 2.2 +29.4%
Mar-2016 2.3 +27.8% 2.6 +44.4%
Apr-2016 2.5 +38.9% 2.9 +52.6%
May-2016 2.3 +15.0% 3.0 +50.0%
Jun-2016 2.1 +5.0% 3.1 +63.2%
Jul-2016 2.0 0.0% 2.4 +26.3%
12-Month Avg* 2.0 +10.5% 2.4 +35.5%
Historical Months Supply of Inventory by Month
The inventory of homes for sale at the end of a given month, divided by the average monthly pending sales from the last 12 months.
* Months Supply for all properties from August 2015 through July 2016. This is not the average of the individual figures above.
Current as of August 11, 2016. All data from the San Francisco MLS. Report © 2016 ShowingTime. | 14
2.1 2.22.0 1.92.0
2.4
Single Family Condo/TIC/Coop
July
0.0
2.0
4.0
6.0
8.0
10.0
1-2005 1-2006 1-2007 1-2008 1-2009 1-2010 1-2011 1-2012 1-2013 1-2014 1-2015 1-2016
Single Family Condo/TIC/Coop
2014 2015 2016+ 26.3%- 13.6%0.0%- 4.8%
2014 2015 2016
+ 5.0% - 4.3%

All Properties Activity OverviewKey metrics by report month and for year-to-date (YTD) starting from the first of the year.
Key Metrics Historical Sparkbars 7-2015 7-2016 Percent Change YTD 2015 YTD 2016 Percent Change
Current as of August 11, 2016. All data from the San Francisco MLS. Report © 2016 ShowingTime. | 15
Months Supply 2.0 2.3 + 15.0% -- -- --
Affordability Ratio 39 44 + 12.8%
% of List Price Received 113.2% 108.1% - 4.5% 112.2%
39
68.6% - 9.1%
- 3.1%
43 + 10.3%
108.7%
% of Properties Sold Over List Price 78.7% 67.4% - 14.4% 75.5%
Active Listings 883 948 + 7.4% --
Avg. Sales Price $1,420,500 $1,443,159 + 1.6% $1,451,033
Days on Market 27 36 + 33.3% 29
$1,200,000 + 4.3%
- 0.0%
33 + 13.8%
$1,450,779
-- --
Sold Listings 508 442 - 13.0% 3,027 2,769 - 8.5%
Median Sales Price $1,150,000 $1,160,000 + 0.9% $1,150,000
+ 1.4%
Pending Sales 464 423 - 8.8% 3,116 2,930 - 6.0%
New Listings 550 413 - 24.9% 3,897 3,9507-2013 7-2014 7-2015 7-2016
7-2013 7-2014 7-2015 7-2016
7-2013 7-2014 7-2015 7-2016
7-2013 7-2014 7-2015 7-2016
7-2013 7-2014 7-2015 7-2016
7-2013 7-2014 7-2015 7-2016
7-2013 7-2014 7-2015 7-2016
7-2013 7-2014 7-2015 7-2016
7-2013 7-2014 7-2015 7-2016
7-2013 7-2014 7-2015 7-2016
7-2013 7-2014 7-2015 7-2016

Activity by District
SF District 1: Northwest (Sea Cliff, Lake, Jordan Park / Laurel Heights, Outer Richmond, Central Richmond, Inner Richmond, Lone Mountain)
SF District 2: Central West (Outer Sunset, Central Sunset, Inner Sunset, Outer Parkside, Parkside, Inner Parkside, Golden Gate Heights)
SF District 3: Southwest (Pine Lake Park, Lake Shore, Merced Manor, Stonestown, Lakeside, Merced Heights, Ingleside, Ingleside Heights, Oceanview)
SF District 4: Twin Peaks W (Forest Hill (& Ext), W Portal, St Francis Wd, Balboa Terr, Mt Dav Manor, Ingleside Terr, Monterey Hts, Wstwd Pk & H'lnds, Shrwd Fst, Miraloma Pk, Dmnd Hts, Mdtwn Terr)
SF District 5: Central (Haight Ashbury, Cole Vly / Prnssus Hts, Clarndn Hts, Corona Hts, Twin Pks, Glen Pk, Noe Vly, Eureka Vly / Dolores Hts, Mission Dolores, Duboce Trngl, Buena Vista / Ashbury Hts)
SF District 6: Central North (Lower Pacific Heights, Anza Vista, Western Addition, North Panhandle, Alamo Square, Hayes Valley)
SF District 7: North (Marina, Cow Hollow, Presidio Heights, Pacific Heights)
SF District 8: Northeast (North Waterfront, North Beach, Russian Hill, Telegraph Hill, Nob Hill, Financial District / Barbary Coast, Downtown, Van Ness / Civic Center, Tenderloin)
SF District 9: Central East (Yerba Buena, South Beach, South of Market, Mission Bay, Inner Mission, Potrero Hill, Central Waterfront / Dogpatch, Bernal Heights)
SF District 10: Southeast (Outer Mission, Mission Terr, Excelsior, Portola, Bayview, Silver Terr, Hunters Pt, Candlestick Pt, Bayview Hts, Little Hollywood, Visitation Vly, Crocker Amazon)
7-2015 7-2016 + / – 7-2015 7-2016 + / – 7-2015 7-2016 + / – 7-2015 7-2016 + / – 7-2015 7-2016 + / –
Single Family
1 SF District 1 37 33 -10.8% 20 12 -40.0% $1,500,000 $2,275,000 +51.7% 19 26 +36.8% 2.1 2.3 +9.5%
2 SF District 2 47 43 -8.5% 46 35 -23.9% $1,226,000 $1,280,000 +4.4% 22 26 +18.2% 1.3 1.3 0.0%
3 SF District 3 31 25 -19.4% 13 14 +7.7% $900,000 $1,217,500 +35.3% 22 20 -9.1% 2.5 1.5 -40.0%
4 SF District 4 40 47 +17.5% 37 32 -13.5% $1,555,000 $1,405,000 -9.6% 24 35 +45.8% 1.4 1.8 +28.6%
5 SF District 5 45 46 +2.2% 34 27 -20.6% $2,162,500 $1,950,000 -9.8% 19 34 +78.9% 1.7 1.9 +11.8%
6 SF District 6 9 8 -11.1% 7 2 -71.4% $2,800,000 $1,962,000 -29.9% 31 61 +96.8% 2.7 2.9 +7.4%
7 SF District 7 17 29 +70.6% 7 12 +71.4% $6,500,000 $4,119,500 -36.6% 83 73 -12.0% 1.9 3.6 +89.5%
8 SF District 8 8 14 +75.0% 2 0 -100.0% $2,407,500 $0 -100.0% 14 0 -100.0% 3.6 6.2 +72.2%
9 SF District 9 41 40 -2.4% 24 22 -8.3% $1,255,000 $1,395,000 +11.2% 22 20 -9.1% 2.0 1.8 -10.0%
10 SF District 10 128 94 -26.6% 46 40 -13.0% $827,500 $799,000 -3.4% 31 31 0.0% 3.1 2.4 -22.6%
Condo/TIC/Coop
1 SF District 1 29 32 +10.3% 24 14 -41.7% $1,115,000 $1,032,500 -7.4% 35 27 -22.9% 2.1 2.6 +23.8%
2 SF District 2 8 14 +75.0% 3 5 +66.7% $1,155,000 $990,000 -14.3% 25 33 +32.0% 2.2 3.3 +50.0%
3 SF District 3 13 8 -38.5% 2 4 +100.0% $572,500 $730,000 +27.5% 14 29 +107.1% 2.8 1.8 -35.7%
4 SF District 4 9 6 -33.3% 4 2 -50.0% $720,000 $662,500 -8.0% 24 55 +129.2% 2.0 1.9 -5.0%
5 SF District 5 61 68 +11.5% 35 44 +25.7% $1,380,000 $1,150,000 -16.7% 22 29 +31.8% 1.6 2.0 +25.0%
6 SF District 6 47 60 +27.7% 26 38 +46.2% $1,027,500 $1,027,500 0.0% 23 41 +78.3% 1.8 2.3 +27.8%
7 SF District 7 27 45 +66.7% 38 23 -39.5% $1,177,500 $1,150,000 -2.3% 28 42 +50.0% 1.1 2.2 +100.0%
8 SF District 8 80 80 0.0% 38 34 -10.5% $1,052,500 $1,105,000 +5.0% 31 35 +12.9% 2.0 2.0 0.0%
9 SF District 9 189 236 +24.9% 95 78 -17.9% $1,003,000 $950,000 -5.3% 30 47 +56.7% 2.1 2.8 +33.3%
10 SF District 10 17 20 +17.6% 7 4 -42.9% $670,000 $625,000 -6.7% 46 19 -58.7% 3.0 3.5 +16.7%
Key metrics by report month for the districts of San Fransisco.
Current as of August 11, 2016. All data from the San Francisco MLS. Report © 2016 ShowingTime. | 16
Active Listings Sold Listings Median Sales Price Days on Market Months Supply