Embed Size (px)
Citation preview
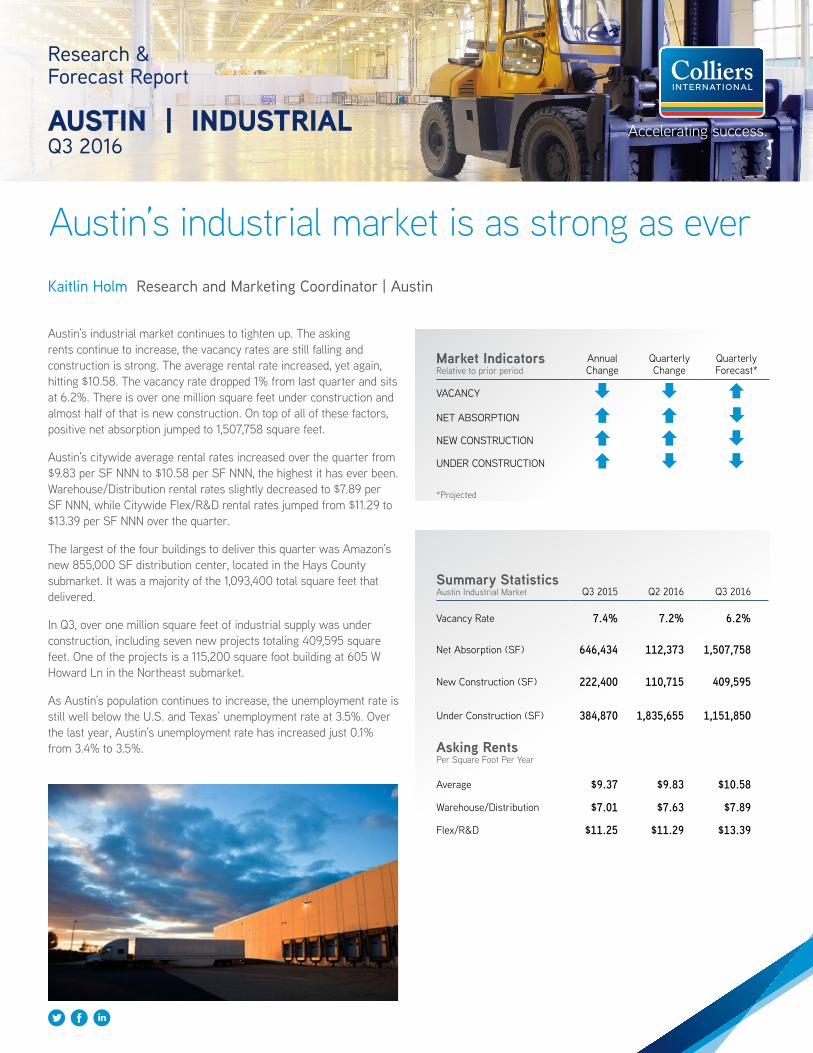
Austin’s industrial market is as strong as ever
Research & Forecast Report
AUSTIN | INDUSTRIALQ3 2016
Kaitlin Holm Research and Marketing Coordinator | Austin
Austin’s industrial market continues to tighten up. The asking rents continue to increase, the vacancy rates are still falling and construction is strong. The average rental rate increased, yet again, hitting $10.58. The vacancy rate dropped 1% from last quarter and sits at 6.2%. There is over one million square feet under construction and almost half of that is new construction. On top of all of these factors, positive net absorption jumped to 1,507,758 square feet.
Austin’s citywide average rental rates increased over the quarter from $9.83 per SF NNN to $10.58 per SF NNN, the highest it has ever been. Warehouse/Distribution rental rates slightly decreased to $7.89 per SF NNN, while Citywide Flex/R&D rental rates jumped from $11.29 to $13.39 per SF NNN over the quarter.
The largest of the four buildings to deliver this quarter was Amazon’s new 855,000 SF distribution center, located in the Hays County submarket. It was a majority of the 1,093,400 total square feet that delivered.
In Q3, over one million square feet of industrial supply was under construction, including seven new projects totaling 409,595 square feet. One of the projects is a 115,200 square foot building at 605 W Howard Ln in the Northeast submarket.
As Austin’s population continues to increase, the unemployment rate is still well below the U.S. and Texas’ unemployment rate at 3.5%. Over the last year, Austin’s unemployment rate has increased just 0.1% from 3.4% to 3.5%.
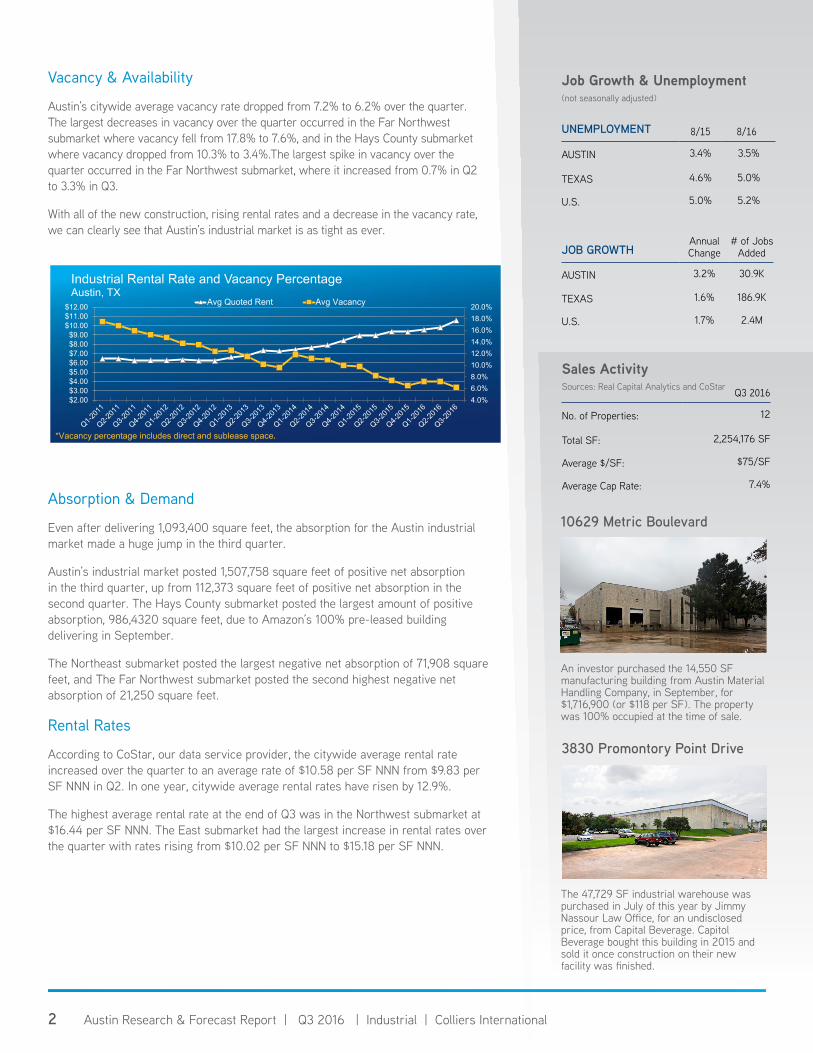
Vacancy & Availability
Summary Statistics Austin Industrial Market Q3 2015 Q2 2016 Q3 2016
Vacancy Rate 7.4% 7.2% 6.2%
Net Absorption (SF) 646,434 112,373 1,507,758
New Construction (SF) 222,400 110,715 409,595
Under Construction (SF) 384,870 1,835,655 1,151,850
Asking Rents Per Square Foot Per Year
Average $9.37 $9.83 $10.58
Warehouse/Distribution $7.01 $7.63 $7.89
Flex/R&D $11.25 $11.29 $13.39
Market IndicatorsRelative to prior period
AnnualChange
Quarterly Change
Quarterly Forecast*
VACANCY
NET ABSORPTION
NEW CONSTRUCTION
UNDER CONSTRUCTION
*Projected
An investor purchased the 14,550 SF manufacturing building from Austin Material Handling Company, in September, for $1,716,900 (or $118 per SF). The property was 100% occupied at the time of sale.
10629 Metric Boulevard
Job Growth & Unemployment(not seasonally adjusted)
UNEMPLOYMENT 8/15 8/16
AUSTIN 3.4% 3.5%
TEXAS 4.6% 5.0%
U.S. 5.0% 5.2%
JOB GROWTHAnnual Change
# of Jobs Added
AUSTIN 3.2% 30.9K
TEXAS 1.6% 186.9K
U.S. 1.7% 2.4M
The 47,729 SF industrial warehouse was purchased in July of this year by Jimmy Nassour Law Office, for an undisclosed price, from Capital Beverage. Capitol Beverage bought this building in 2015 and sold it once construction on their new facility was finished.
2 Austin Research & Forecast Report | Q3 2016 | Industrial | Colliers International
Sales ActivitySources: Real Capital Analytics and CoStar Q3 2016
No. of Properties: 12
Total SF: 2,254,176 SF
Average $/SF: $75/SF
Average Cap Rate: 7.4%
3830 Promontory Point Drive
Vacancy & Availability
Austin’s citywide average vacancy rate dropped from 7.2% to 6.2% over the quarter. The largest decreases in vacancy over the quarter occurred in the Far Northwest submarket where vacancy fell from 17.8% to 7.6%, and in the Hays County submarket where vacancy dropped from 10.3% to 3.4%.The largest spike in vacancy over the quarter occurred in the Far Northwest submarket, where it increased from 0.7% in Q2 to 3.3% in Q3.
With all of the new construction, rising rental rates and a decrease in the vacancy rate, we can clearly see that Austin’s industrial market is as tight as ever.
4.0%6.0%8.0%10.0%12.0%14.0%16.0%18.0%20.0%
$2.00$3.00$4.00$5.00$6.00$7.00$8.00$9.00
$10.00$11.00$12.00
Industrial Rental Rate and Vacancy Percentage Austin, TX
Avg Quoted Rent Avg Vacancy
*Vacancy percentage includes direct and sublease space.
Absorption & Demand
Even after delivering 1,093,400 square feet, the absorption for the Austin industrial market made a huge jump in the third quarter.
Austin’s industrial market posted 1,507,758 square feet of positive net absorption in the third quarter, up from 112,373 square feet of positive net absorption in the second quarter. The Hays County submarket posted the largest amount of positive absorption, 986,4320 square feet, due to Amazon’s 100% pre-leased building delivering in September.
The Northeast submarket posted the largest negative net absorption of 71,908 square feet, and The Far Northwest submarket posted the second highest negative net absorption of 21,250 square feet.
Rental Rates
According to CoStar, our data service provider, the citywide average rental rate increased over the quarter to an average rate of $10.58 per SF NNN from $9.83 per SF NNN in Q2. In one year, citywide average rental rates have risen by 12.9%.
The highest average rental rate at the end of Q3 was in the Northwest submarket at $16.44 per SF NNN. The East submarket had the largest increase in rental rates over the quarter with rates rising from $10.02 per SF NNN to $15.18 per SF NNN.

3 Austin Research & Forecast Report | Q3 2016 | Industrial | Colliers International33
Q3 2016 Top Industrial Lease TransactionsBUILDING NAME/ADDRESS SUBMARKET SF TENANT LEASE DATE
15833 Long Vista Drive North Ind 104,146 Daryl Flood Logistics1 Jul-16
1100 E Howard Ln North Ind 80,000 Intelligent Logistics Jul-16
12555 Harris Branch Parkway Far Northeast Ind 48,037 Schenker Inc1 Jul-16
10200 McKalla Pl North Ind 37,800 Resale Resource1 Aug-16
11700 Stonehollow Dr North Ind 33,900 Goodman1 Sep-16
16310 Bratton Ln North Ind 33,600 Abrams and Company Publishers1 Sep-16
3815 A Jarrett Way North Ind 32,000 Manna Freight Systems Inc Sep-16
2315 Rutland Drive North Ind 26,526 Ferguson Enterprises Inc1 Aug-16
6301 E Stassney Ln Southeast Ind 25,600 Aspire Food Group Sep-16
12317 Technology Blvd Northwest Ind 24,207 Undisclosed Jul-16
Leasing ActivityAustin’s industrial leasing activity was just under 600,000 square feet in Q3 2016. The bulk of the major leases signed in the second quarter were in the North submarket, totaling 418,000 square feet. The largest lease signed was a 104,146 square foot renewal signed by Daryl Flood Logistics. Intelligent Logistics, who will occupy 80,000 square feet at 1100 E Howard Ln in the North submarket, also signed this quarter.
1 Renewal 2 Expansion3 Sublease
AUSTIN INDUSTRIAL MARKET STATISTICAL SUMMARY Q3 2016
Market # Bldgs
Rentable Area
Direct Vacant
SF
Direct Vacancy
Rate
Sublet Vacant
SF
Sublet Vacancy
Rate
Total Va-cant SF
Total Vacancy
Rate
3Q16 Net Absorption
2Q16 Net Absorp-
tion
3Q16 Comple-
tions
2Q16 Comple-
tions
SF Under Construc-
tion
Austin Total 806 50,431,190 2,949,364 5.8% 332,595 0.7% 3,281,959 6.5% 141,773 (42,578) 72,000 334,870 1,787,440
Central 32 1,155,810 68,064 5.9% 3,925 0.3% 71,989 6.2% (6,651) 4,421 - - -
East 66 3,932,774 481,010 12.2% 43,280 1.1% 524,290 13.3% 20,000 (149,009) - - 500,000
Far Northeast
35 2,512,744 371,683 14.8% 30,000 1.2% 401,683 16.0% (42,638) (126,075) - 154,370 96,000
Far Northwest
18 797,361 6,300 0.8% - 0.0% 6,300 0.8% 56,663 9,036 - - -
Hays County
39 2,322,975 113,162 4.9% 127,682 5.5% 240,844 10.4% 75,263 (165,737) - - 855,000
North 217 13,739,422 634,351 4.6% 24,535 0.2% 658,886 4.8% 42,195 93,573 - - 80,340
Northeast 114 7,786,610 365,382 4.7% 19,352 0.2% 384,734 4.9% 100,530 77,794 - 20,500 - Northwest 29 2,611,605 238,944 9.1% 11,084 0.4% 250,028 9.6% 1,353 (179,340) - - - Round Rock 49 2,656,709 248,420 9.4% 17,600 0.7% 266,020 10.0% (83,269) 200,411 - - - South 41 1,668,816 74,952 4.5% 11,437 0.7% 86,389 5.2% 18,266 (39,769) - - - Southeast 161 11,036,333 347,096 3.1% 26,200 0.2% 373,296 3.4% (29,939) 210,997 72,000 160,000 256,100
Southwest 5 210,031 - 0.0% 17,500 8.3% 17,500 8.3% (10,000) 21,120 - - -
Austin Industrial Market Summary

4 Austin Research & Forecast Report | Q2 2015 | Office | Colliers International4 North American Research & Forecast Report | Q4 2014 | Office Market Outlook | Colliers International
Copyright © 2015 Colliers International.The information contained herein has been obtained from sources deemed reliable. While every reasonable effort has been made to ensure its accuracy, we cannot guarantee it. No responsibility is assumed for any inaccuracies. Readers are encouraged to consult their professional advisors prior to acting on any of the material contained in this report.
Colliers International | Market000 Address, Suite # 000 Address, Suite #+1 000 000 0000colliers.com/<<market>>
4 North American Research & Forecast Report | Q4 2014 | Office Market Outlook | Colliers International
Copyright © 2015 Colliers International.The information contained herein has been obtained from sources deemed reliable. While every reasonable effort has been made to ensure its accuracy, we cannot guarantee it. No responsibility is assumed for any inaccuracies. Readers are encouraged to consult their professional advisors prior to acting on any of the material contained in this report.
Colliers International | Austin111 Congress Avenue, Suite 750 Austin, Texas 78701+1 512 539 3000colliers.com/texas/austin
FOR MORE INFORMATION Broker Contacts:Travis HicksVice President | Austin+1 512 539 [email protected]
Bentley SmithSenior Associate | Austin+1 512 539 [email protected]
Research Contact:Kaitlin HolmResearch and Marketing Coordinator | Austin+1 512 565 [email protected]
BUILDING ADDRESS SUBMARKET RBA % LEASED DEVELOPER ESTIMATED
DELIVERY DATE BUILDING DESCRIPTION
2121 Scarbrough Dr. - Bldg 4 North 80,340 63.2% Clarion Sep-16 Industrial Warehouse
955 County Road 118 Georgetown 48,215 0.0% HOWMAT Development LP Nov-16 Industrial Warehouse
7307 Burleson Rd - Lot 7 Southeast 62,500 50.0% Industrial Group Southwest, LLC Dec-16 Industrial
Capitol Wright Distribution Center Highway 290 East East 500,000 100.0% Capitol Wright Distributing Dec-16 Industrial Distribution
Harris Ridge Business Center- Bldg 1 1100 E Howard Ln Far Northeast 51,200 50.0% HPI Real Estate Jan-17 Industrial Warehouse
7307 Burelson Rd - Action Gypsum Supply Southeast Ind 30,000 100.0% Industrial Group Southwest, LLC Nov-16 Flex
4717 Priem Ln - Bldg 8 Far Northeast Ind 20,000 75.0% Tack Development Ltd Dec-16 Industrial Warehouse
7307 Burleson Rd - Lot 2 Southeast Ind 35,000 0.0% Industrial Group Southwest, LLC Dec-16 Flex
7307 Burleson Rd - Lot 3 Southeast Ind 35,000 0.0% Industrial Group Southwest, LLC Dec-16 Flex
7307 Burleson Rd - Lot 4 Southeast Ind 40,000 0.0% Industrial Group Southwest, LLC Dec-16 Flex
7307 Burleson Rd - Lot 5 Southeast Ind 50,000 0.0% Industrial Group Southwest, LLC Dec-16 Flex
401 Center Ridge Dr - Bldg 2.1 Northeast Ind 84,395 0.0% Prologis Jan-17 Flex
605 W Howard Ln - Bldg 3.1 Northeast Ind 115,200 0.0% Prologis Jan-17 Industrial Warehouse
Q3 2016 Industrial Under Construction - 20,000 SF or greater
XM SF
Q3 2016 Highlights