Embed Size (px)
Citation preview
$532,032
$415,454
Second Quarter 2017 Second Quarter 2016
Condo Market Report TREB Member Inquiries:
(416) 443-8158Media/Public Inquiries:
(416) 443-8152
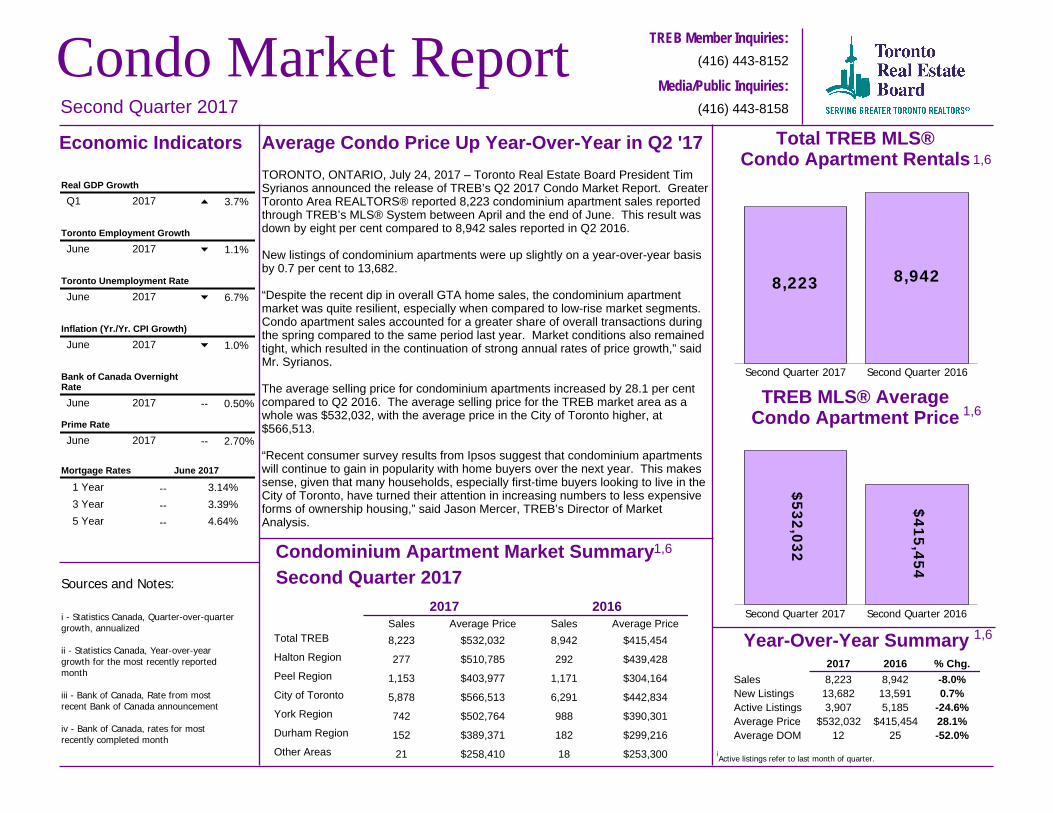
Average Condo Price Up Year-Over-Year in Q2 '17TORONTO, ONTARIO, July 24, 2017 – Toronto Real Estate Board President TimSyrianos announced the release of TREB’s Q2 2017 Condo Market Report. GreaterToronto Area REALTORS® reported 8,223 condominium apartment sales reportedthrough TREB’s MLS® System between April and the end of June. This result wasdown by eight per cent compared to 8,942 sales reported in Q2 2016.
New listings of condominium apartments were up slightly on a year-over-year basisby 0.7 per cent to 13,682.
“Despite the recent dip in overall GTA home sales, the condominium apartmentmarket was quite resilient, especially when compared to low-rise market segments.Condo apartment sales accounted for a greater share of overall transactions duringthe spring compared to the same period last year. Market conditions also remainedtight, which resulted in the continuation of strong annual rates of price growth,” saidMr. Syrianos.
The average selling price for condominium apartments increased by 28.1 per centcompared to Q2 2016. The average selling price for the TREB market area as awhole was $532,032, with the average price in the City of Toronto higher, at$566,513.
“Recent consumer survey results from Ipsos suggest that condominium apartmentswill continue to gain in popularity with home buyers over the next year. This makessense, given that many households, especially first-time buyers looking to live in theCity of Toronto, have turned their attention in increasing numbers to less expensiveforms of ownership housing,” said Jason Mercer, TREB’s Director of MarketAnalysis.
TREB MLS® AverageCondo Apartment Price
Economic Indicators
Condominium Apartment Market SummarySources and Notes:
i - Statistics Canada, Quarter-over-quartergrowth, annualized
ii - Statistics Canada, Year-over-yeargrowth for the most recently reportedmonth
iii - Bank of Canada, Rate from mostrecent Bank of Canada announcement
iv - Bank of Canada, rates for mostrecently completed month
8,223 8,942
Second Quarter 2017 Second Quarter 2016
Real GDP GrowthQ1 2017 3.7%
Toronto Employment GrowthJune 2017 1.1%
Toronto Unemployment RateJune 2017 6.7%
Inflation (Yr./Yr. CPI Growth)June 2017 1.0%
Bank of Canada OvernightRateJune 2017 -- 0.50%
Prime RateJune 2017 -- 2.70%
2017 2016Sales Average Price Sales Average Price
Total TREB
Halton Region
Peel Region
City of Toronto
York Region
Durham Region
Other Areas
8,223 $532,032 8,942 $415,454
277 $510,785 292 $439,428
1,153 $403,977 1,171 $304,164
5,878 $566,513 6,291 $442,834
742 $502,764 988 $390,301
152 $389,371 182 $299,216
21 $258,410 18 $253,300
Second Quarter 2017
Second Quarter 2017Total TREB MLS®
Condo Apartment Rentals
Year-Over-Year Summary
1,6
1,6
1,6
2017 2016 % Chg.SalesNew ListingsActive ListingsAverage PriceAverage DOM
8,223 8,942 -8.0%13,682 13,591 0.7%3,907 5,185 -24.6%
$532,032 $415,454 28.1%12 25 -52.0%
Active listings refer to last month of quarter.i
Mortgage Rates June 20171 Year3 Year5 Year
3.14%3.39%4.64%
1 Year3 Year5 Year
------
1,6

Toronto Real Estate Board
Condo Market Report, Second Quarter 2017
SUMMARY OF CONDOMINIUM APARTMENT TRANSACTIONS SECOND QUARTER 2017ALL TREB AREAS
2
Sales Dollar Volume Average Price Median Price New Listings Active Listings Avg. SP / LP Avg. DOMTREB TotalHalton Region
BurlingtonHalton HillsMiltonOakville
Peel RegionBramptonCaledonMississauga
City of TorontoToronto WestToronto CentralToronto East
York RegionAuroraE. GwillimburyGeorginaKingMarkhamNewmarketRichmond HillVaughanWhitchurch-Stouffville
Durham RegionAjaxBrockClaringtonOshawaPickeringScugogUxbridgeWhitby
Dufferin CountyOrangeville
Simcoe CountyAdjala-TosorontioBradford WestGwillimburyEssaInnisfilNew Tecumseth
8,223 $4,374,895,207 $532,032 $460,000 13,682 3,907 105% 12277 $141,487,326 $510,785 $430,000 414 152 102% 1794 $42,251,072 $449,479 $410,500 122 35 104% 126 $2,639,000 $439,833 $430,500 10 6 102% 2253 $24,377,200 $459,947 $470,000 108 31 104% 11
124 $72,220,054 $582,420 $457,500 174 80 101% 221,153 $465,784,986 $403,977 $380,000 1,904 552 105% 12182 $65,346,126 $359,045 $357,000 284 86 105% 123 $2,040,000 $680,000 $685,000 0 0 99% 21
968 $398,398,860 $411,569 $386,000 1,620 466 105% 125,878 $3,329,960,941 $566,513 $490,000 9,772 2,708 105% 121,257 $584,702,672 $465,157 $425,000 1,903 535 104% 133,852 $2,427,591,552 $630,216 $540,000 6,557 1,825 105% 12769 $317,666,717 $413,091 $385,000 1,312 348 108% 12742 $373,050,893 $502,764 $450,000 1,323 410 104% 1216 $8,270,900 $516,931 $469,500 34 15 101% 150 - - - 0 0 - -0 - - - 3 3 - -11 $5,248,210 $477,110 $419,900 7 1 101% 17
299 $152,732,021 $510,809 $455,000 556 163 106% 1118 $8,414,900 $467,494 $442,000 20 1 105% 12
189 $89,283,469 $472,399 $435,000 332 93 104% 11205 $106,544,793 $519,731 $467,500 370 131 102% 134 $2,556,600 $639,150 $649,400 1 3 103% 70
152 $59,184,461 $389,371 $368,250 235 65 107% 1135 $13,668,348 $390,524 $375,000 39 9 106% 120 - - - 0 0 - -27 $9,134,400 $338,311 $330,000 56 20 104% 928 $9,390,959 $335,391 $313,789 47 16 115% 932 $13,658,977 $426,843 $407,500 54 15 110% 101 $435,000 $435,000 $435,000 1 0 109% 62 $799,900 $399,950 $399,950 1 0 98% 2427 $12,096,877 $448,032 $405,000 37 5 103% 1415 $3,468,600 $231,240 $232,000 17 7 98% 2015 $3,468,600 $231,240 $232,000 17 7 98% 206 $1,958,000 $326,333 $296,500 17 13 101% 170 - - - 0 0 - -2 $590,000 $295,000 $295,000 4 4 100% 110 - - - 0 0 - -0 - - - 4 4 - -4 $1,368,000 $342,000 $316,500 9 5 101% 21
1 1 1 1 2 3 4 5

Toronto Real Estate Board
SUMMARY OF CONDOMINIUM APARTMENT TRANSACTIONS SECOND QUARTER 2017CITY OF TORONTO
3
Sales Dollar Volume Average Price Median Price New Listings Active Listings Avg. SP / LP Avg. DOMTREB TotalCity of Toronto TotalToronto West
Toronto W01Toronto W02Toronto W03Toronto W04Toronto W05Toronto W06Toronto W07Toronto W08Toronto W09Toronto W10
Toronto CentralToronto C01Toronto C02Toronto C03Toronto C04Toronto C06Toronto C07Toronto C08Toronto C09Toronto C10Toronto C11Toronto C12Toronto C13Toronto C14Toronto C15
Toronto EastToronto E01Toronto E02Toronto E03Toronto E04Toronto E05Toronto E06Toronto E07Toronto E08Toronto E09Toronto E10Toronto E11
8,223 $4,374,895,207 $532,032 $460,000 13,682 3,907 105% 125,878 $3,329,960,941 $566,513 $490,000 9,772 2,708 105% 121,257 $584,702,672 $465,157 $425,000 1,903 535 104% 13124 $64,679,525 $521,609 $490,000 188 40 106% 1261 $32,895,327 $539,268 $457,500 90 23 108% 924 $10,273,400 $428,058 $403,750 29 5 104% 1288 $32,795,989 $372,682 $363,000 120 24 106% 1478 $25,103,099 $321,835 $310,000 122 44 102% 14
392 $203,925,873 $520,219 $470,000 549 146 104% 1515 $8,861,000 $590,733 $469,000 17 3 106% 10
301 $146,533,380 $486,822 $430,000 456 119 105% 1151 $20,405,801 $400,114 $430,000 84 29 102% 12
123 $39,229,278 $318,937 $331,500 248 102 103% 143,852 $2,427,591,552 $630,216 $540,000 6,557 1,825 105% 121,629 $1,022,305,731 $627,566 $550,000 2,771 763 105% 12141 $183,091,561 $1,298,522 $830,000 256 104 98% 2647 $34,435,280 $732,666 $635,000 91 28 106% 1751 $39,593,589 $776,345 $615,000 82 31 104% 1665 $31,026,238 $477,327 $475,000 98 26 106% 13
228 $133,288,004 $584,597 $552,500 447 125 109% 11622 $375,129,959 $603,103 $559,725 958 270 106% 1235 $47,094,435 $1,345,555 $860,000 66 19 101% 16
119 $76,796,099 $645,345 $575,000 211 52 104% 1086 $33,477,306 $389,271 $373,710 124 23 105% 1124 $24,075,250 $1,003,135 $875,000 40 8 108% 18
149 $74,122,228 $497,465 $430,000 197 42 108% 10367 $204,319,637 $556,729 $508,000 717 189 109% 10289 $148,836,235 $515,004 $455,000 499 145 106% 11769 $317,666,717 $413,091 $385,000 1,312 348 108% 1254 $34,321,490 $635,583 $618,500 88 11 107% 830 $19,586,907 $652,897 $589,000 50 8 103% 1831 $11,508,380 $371,238 $292,000 47 9 102% 11
112 $38,459,901 $343,392 $350,000 192 56 107% 1199 $43,740,177 $441,820 $425,000 159 45 107% 1013 $6,444,700 $495,746 $483,000 19 6 103% 25
135 $52,480,943 $388,748 $385,000 252 79 108% 1148 $17,209,188 $358,525 $318,750 84 25 110% 8
159 $66,107,028 $415,767 $396,500 295 79 111% 1115 $3,528,700 $235,247 $199,000 17 4 108% 1473 $24,279,303 $332,593 $350,000 109 26 106% 14
Condo Market Report, Second Quarter 2017
1 1 1 1 2 3 4 5
Toronto Real Estate Board
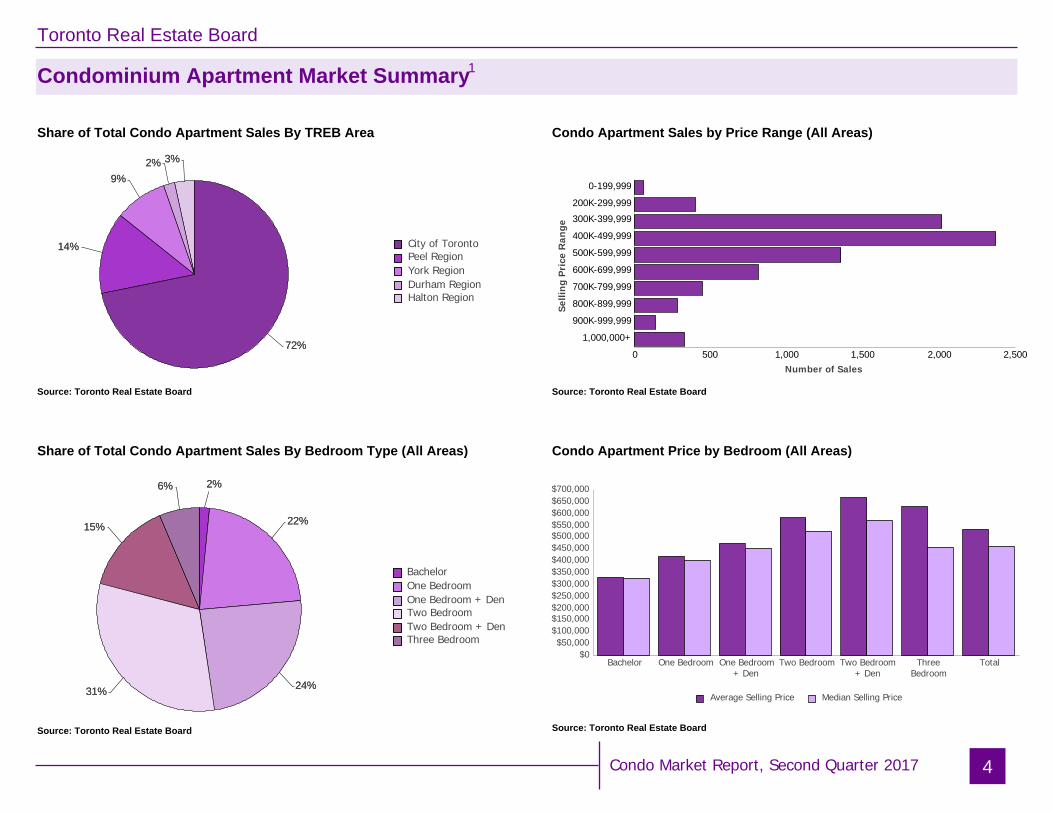
Condominium Apartment Market Summary
4
Condo Apartment Sales by Price Range (All Areas)
Source: Toronto Real Estate Board
Source: Toronto Real Estate Board
Condo Apartment Price by Bedroom (All Areas)
72%
14%
9%2% 3%
72%
14%
9%2% 3%
City of TorontoPeel RegionYork RegionDurham RegionHalton Region
2%
22%
24%31%
15%
6% 2%
22%
24%31%
15%
6%
BachelorOne BedroomOne Bedroom + DenTwo BedroomTwo Bedroom + DenThree Bedroom
0 500 1,000 1,500 2,000 2,500
0-199,999200K-299,999300K-399,999400K-499,999500K-599,999600K-699,999700K-799,999800K-899,999900K-999,999
1,000,000+
Selli
ng P
rice
Ran
ge
Number of Sales
$0$50,000
$100,000$150,000$200,000$250,000$300,000$350,000$400,000$450,000$500,000$550,000$600,000$650,000$700,000
Bachelor One Bedroom One Bedroom+ Den
Two Bedroom Two Bedroom+ Den
ThreeBedroom
Total
Average Selling Price Median Selling Price
Source: Toronto Real Estate Board
Source: Toronto Real Estate Board
Share of Total Condo Apartment Sales By TREB Area
Share of Total Condo Apartment Sales By Bedroom Type (All Areas)
Condo Market Report, Second Quarter 2017
1

Toronto Real Estate Board
Sub-Market Breakdown: Downtown Core
5
Condo Apartment Sales by Price Range (Downtown Core)
Source: Toronto Real Estate Board
Condo Apartment Price by Bedroom Type (Downtown Core)
Source: Toronto Real Estate Board
Source: Toronto Real Estate Board
Condo Apartment Sales By Bedroom Type (Downtown Core)
0 200 400 600 800
0-199,999
200K-299,999
300K-399,999
400K-499,999
500K-599,999
600K-699,999
700K-799,999
800K-899,999
900K-999,999
1,000,000+
Selli
ng P
rice
Ran
ge
Number of Sales
$0$100,000$200,000$300,000$400,000$500,000$600,000$700,000$800,000$900,000
$1,000,000$1,100,000$1,200,000$1,300,000$1,400,000
BachelorOne Bedroom
One Bedroom + DenTwo Bedroom
Two Bedroom + DenThree Bedroom
Total
Average Selling Price Median Selling Price0 100 200 300 400 500 600 700 800
92
722
675
499
220
43
Bachelor
One Bedroom
One Bedroom + Den
Two Bedroom
Two Bedroom + Den
Three Bedroom
Condo Market Report, Second Quarter 2017
1
Toronto Real Estate Board
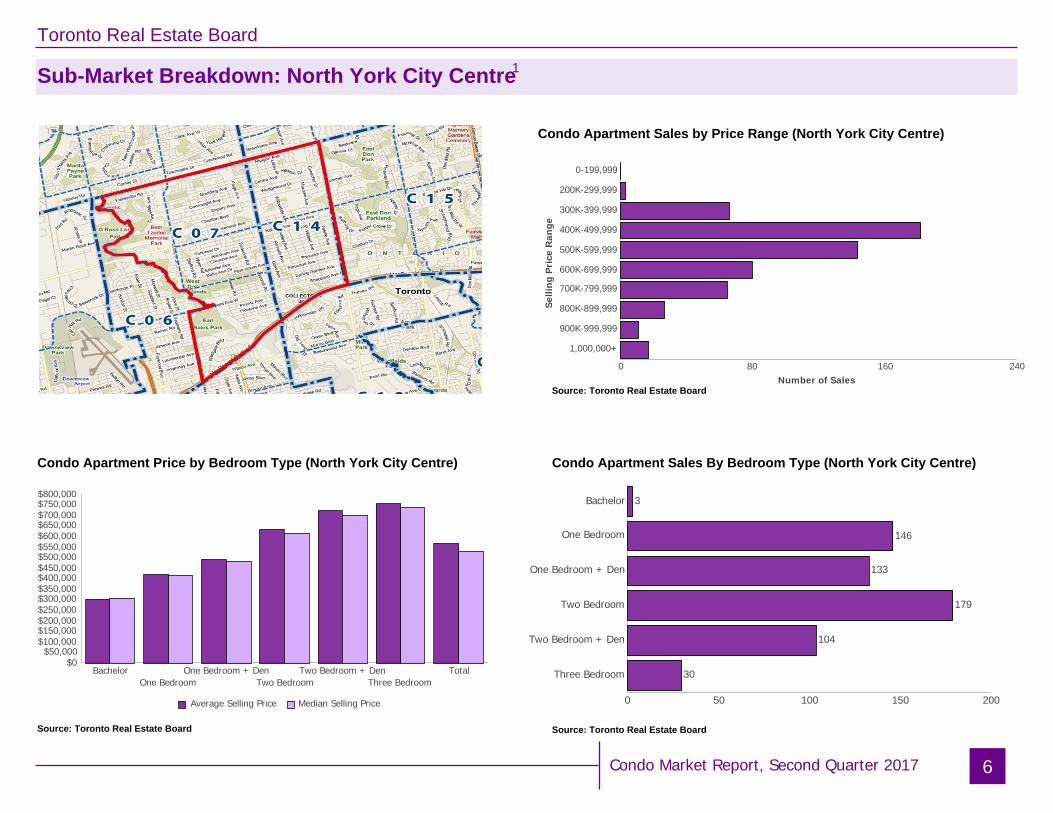
Sub-Market Breakdown: North York City Centre
6
Condo Apartment Sales by Price Range (North York City Centre)
Source: Toronto Real Estate Board
Condo Apartment Price by Bedroom Type (North York City Centre)
Source: Toronto Real Estate Board
Source: Toronto Real Estate Board
Condo Apartment Sales By Bedroom Type (North York City Centre)
0 50 100 150 200
3
146
133
179
104
30
Bachelor
One Bedroom
One Bedroom + Den
Two Bedroom
Two Bedroom + Den
Three Bedroom$0
$50,000$100,000$150,000$200,000$250,000$300,000$350,000$400,000$450,000$500,000$550,000$600,000$650,000$700,000$750,000$800,000
BachelorOne Bedroom
One Bedroom + DenTwo Bedroom
Two Bedroom + DenThree Bedroom
Total
Average Selling Price Median Selling Price
Condo Market Report, Second Quarter 2017
0 80 160 240
0-199,999
200K-299,999
300K-399,999
400K-499,999
500K-599,999
600K-699,999
700K-799,999
800K-899,999
900K-999,999
1,000,000+
Selli
ng P
rice
Ran
ge
Number of Sales
1
Toronto Real Estate Board
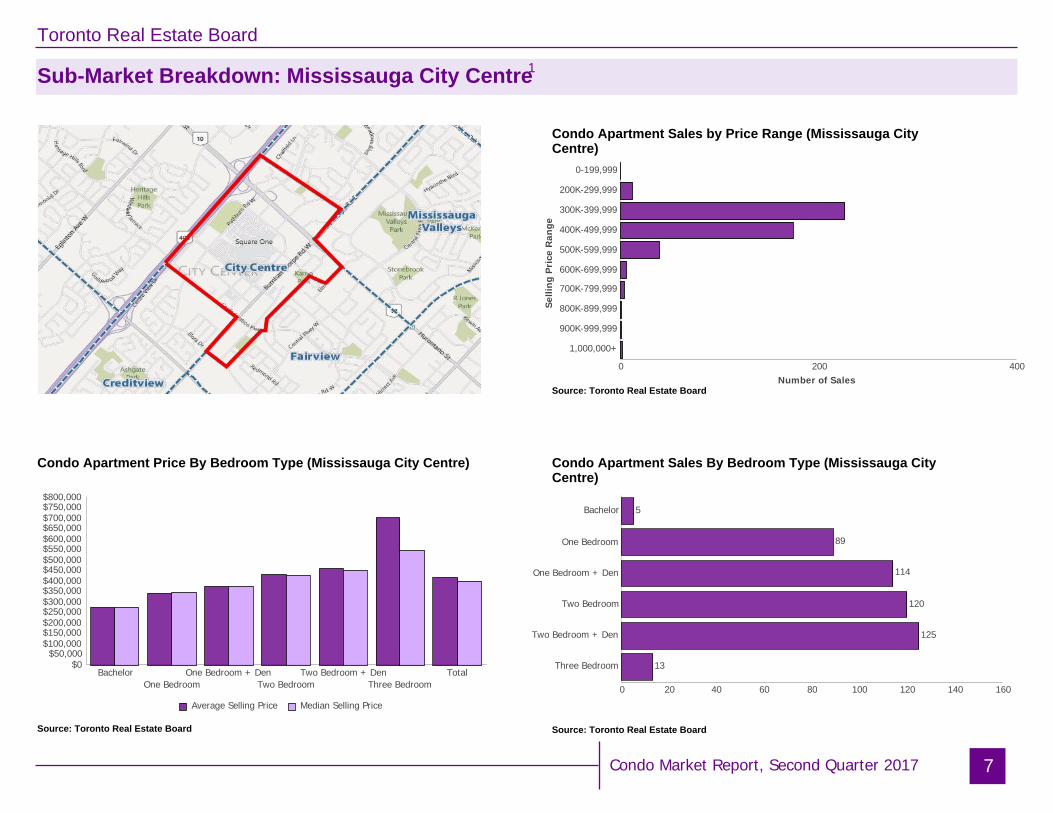
Sub-Market Breakdown: Mississauga City Centre
7
Condo Apartment Sales by Price Range (Mississauga CityCentre)
Source: Toronto Real Estate Board
Condo Apartment Price By Bedroom Type (Mississauga City Centre)
Source: Toronto Real Estate Board
Source: Toronto Real Estate Board
Condo Apartment Sales By Bedroom Type (Mississauga CityCentre)
0 20 40 60 80 100 120 140 160
5
89
114
120
125
13
Bachelor
One Bedroom
One Bedroom + Den
Two Bedroom
Two Bedroom + Den
Three Bedroom$0$50,000
$100,000$150,000$200,000$250,000$300,000$350,000$400,000$450,000$500,000$550,000$600,000$650,000$700,000$750,000$800,000
BachelorOne Bedroom
One Bedroom + DenTwo Bedroom
Two Bedroom + DenThree Bedroom
Total
Average Selling Price Median Selling Price
Condo Market Report, Second Quarter 2017
0 200 400
0-199,999
200K-299,999
300K-399,999
400K-499,999
500K-599,999
600K-699,999
700K-799,999
800K-899,999
900K-999,999
1,000,000+
Selli
ng P
rice
Ran
ge
Number of Sales
1

Toronto Real Estate Board
Rental Market Summary
8
Strong Annual Growth in Average Rents in Q2 2017
Source: Toronto Real Estate Board
Number of Units Rented
Source: Toronto Real Estate Board
Average One-Bedroom Rents
Number of Units Listed
Source: Toronto Real Estate Board
Greater Toronto Area REALTORS® reported 8,553 condominium apartmentlease transactions through TREB’s MLS® System during the second quarter of2017. This result was inline with the second quarter of 2016.
The number of condominium apartments listed for rent at some point duringthe second quarter was down on a year-over-year basis by 3.1 per cent.
The average one-bedroom condominium apartment rent for the TREB marketarea as a whole was up by 8.8 per cent year-over-year to $1,861. Theaverage two-bedroom rent was up by 8.7 per cent year-over-year to $2,533.
$0
$400
$800
$1,200
$1,600
$2,000
$2,400
Total TREB Downtown Core North York City Centre Mississauga City Centre
20172016
Q2 2017 vs. Q2 2016
Q2 2017 vs. Q2 2016 Q2 2017 vs. Q2 2016
0
5001,000
1,5002,000
2,500
3,0003,500
4,0004,500
5,000
5,5006,000
Downtown Core North York City Centre Mississauga City Centre
20172016
0
500
1,000
1,500
2,000
2,500
3,000
3,500
4,000
Downtown Core North York City Centre Mississauga City Centre
20172016
Condo Market Report, Second Quarter 2017
Toronto Real Estate Board
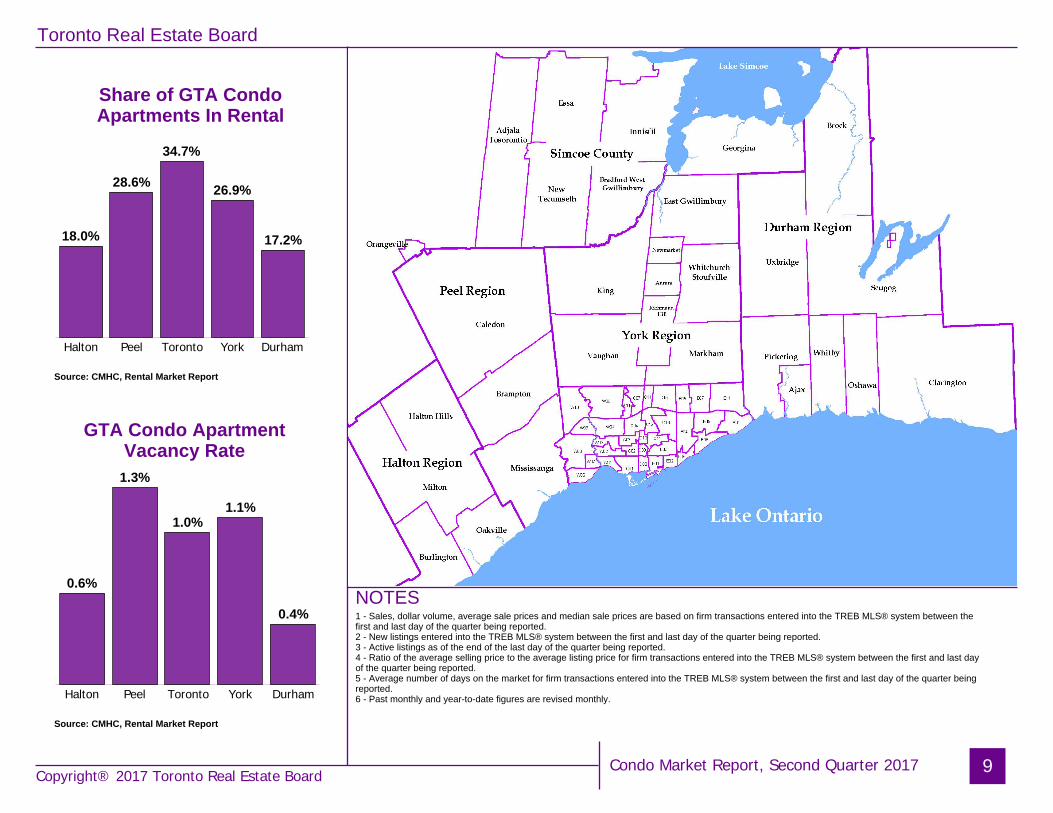
Share of GTA CondoApartments In Rental
NOTES1 - Sales, dollar volume, average sale prices and median sale prices are based on firm transactions entered into the TREB MLS® system between thefirst and last day of the quarter being reported.2 - New listings entered into the TREB MLS® system between the first and last day of the quarter being reported.3 - Active listings as of the end of the last day of the quarter being reported.4 - Ratio of the average selling price to the average listing price for firm transactions entered into the TREB MLS® system between the first and last dayof the quarter being reported.5 - Average number of days on the market for firm transactions entered into the TREB MLS® system between the first and last day of the quarter beingreported.6 - Past monthly and year-to-date figures are revised monthly.
9
Source: CMHC, Rental Market Report
Source: CMHC, Rental Market Report
18.0%
28.6%
34.7%
26.9%
17.2%
Halton Peel Toronto York Durham
0.6%
1.3%
1.0%1.1%
0.4%
Halton Peel Toronto York Durham
GTA Condo ApartmentVacancy Rate
Condo Market Report, Second Quarter 2017 Copyright® 2017 Toronto Real Estate Board


![Ekaterina Bazyka Market Update [Condo] MIAMI BEACH](https://img.pdfslide.us/doc/110x75/577d25ef1a28ab4e1e9fecb5/ekaterina-bazyka-market-update-condo-miami-beach.jpg)