Embed Size (px)
Citation preview
ORIGIN FUND III20160330ria
Disclaimer: This Investment Summary is being furnished on a confidential basis to investors. By its acceptance hereof, each recipient agrees that this Investment Summary shall not be reproduced or distributed to others, at any time, without the prior written consent of Manager III, LLC and that the recipient will keep permanently confidential all information herein not already in the public domain.
This Investment Summary is not an offer to sell, or the solicitation of an offer to purchase, the Fund’s securities. Any such offer or solicitation will be made only by means of a Confidential Private Placement Memorandum (the “PPM”). This Investment Summary excludes material information contained in the PPM, including, but not limited to, risk factors. Investors should make a decision to invest solely on the information provided in the PPM.
This Investment Summary includes financial projections and other forward-looking statements that relate to future events and circumstances. Sentences or phrases that use words such as “expects,” “anticipates,” “hopes,” “plans,” “may,” “can,” “will,” “projects,” and others, are often used in forward-looking statements, but their absence does not mean a statement is not forward-looking. Such statements reflect Origin’s current opinion and are designed to help readers understand Origin’s thinking. By their very nature, however, such statements are subject to certain risks and uncertainties that could cause actual results to differ materially from those projected. Investors are cautioned not to place undue reliance on these forward-looking statements, which are specific to the date hereof.
Results of prior funds may not be indicative of returns from the Fund being formed and do not reflect the returns through the full life of the such prior funds.
Table of Contents Origin Fund III
Executive Summary . . . . . . . . . . . . . . . . . . . . . . . . . . . . . .
Our Team . . . . . . . . . . . . . . . . . . . . . . . . . . . . . . . . . . . . . . .
Benefits of Private Real Estate . . . . . . . . . . . . . . . . . . . .
Our Strategy . . . . . . . . . . . . . . . . . . . . . . . . . . . . . . . . . . . .
Our Track Record . . . . . . . . . . . . . . . . . . . . . . . . . . . . . . . .
Appendix . . . . . . . . . . . . . . . . . . . . . . . . . . . . . . . . . . . . . . .
4
5
6
9
16
20
4Fund IIIExecutive Summary
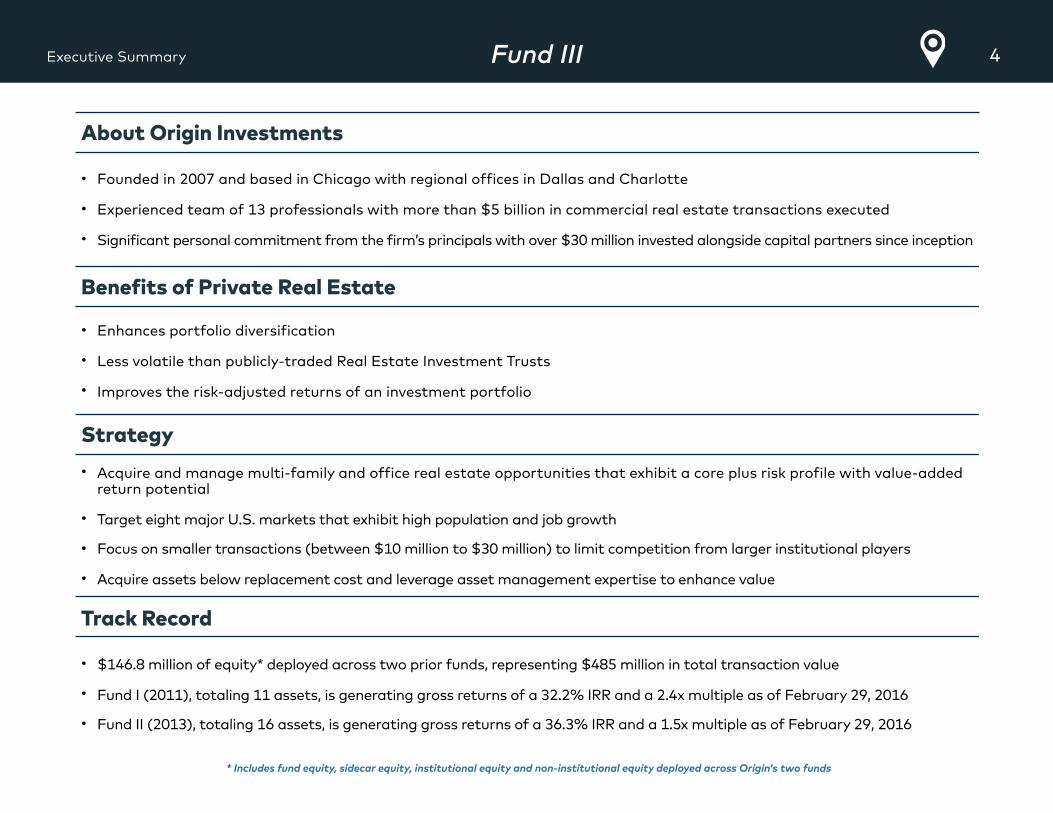
About Origin Investments
• Founded in 2007 and based in Chicago with regional offices in Dallas and Charlotte
• Experienced team of 13 professionals with more than $5 billion in commercial real estate transactions executed
• Significant personal commitment from the firm’s principals with over $30 million invested alongside capital partners since inception
Benefits of Private Real Estate
• Enhances portfolio diversification
• Less volatile than publicly-traded Real Estate Investment Trusts
• Improves the risk-adjusted returns of an investment portfolio
Strategy
• Acquire and manage multi-family and office real estate opportunities that exhibit a core plus risk profile with value-added return potential
• Target eight major U.S. markets that exhibit high population and job growth
• Focus on smaller transactions (between $10 million to $30 million) to limit competition from larger institutional players
• Acquire assets below replacement cost and leverage asset management expertise to enhance value
Track Record
• $146.8 million of equity* deployed across two prior funds, representing $485 million in total transaction value
• Fund I (2011), totaling 11 assets, is generating gross returns of a 32.2% IRR and a 2.4x multiple as of February 29, 2016
• Fund II (2013), totaling 16 assets, is generating gross returns of a 36.3% IRR and a 1.5x multiple as of February 29, 2016
* Includes fund equity, sidecar equity, institutional equity and non-institutional equity deployed across Origin’s two funds

5Experienced and Cohesive TeamOur Team
Michael EpiscopePrincipal16+ yrs. of CRE exp. 8+ yrs. at Origin
David SchererPrincipal17+ yrs. of CRE exp. 8+ yrs. at Origin
Marc Turner
Director of Asset Management
19+ yrs. of CRE exp.
Dave WelkManaging Director of
Acquisitions12+ yrs. of CRE exp.
Matt OzeeVP of Acquisitions
– Texas6+ yrs. of CRE exp.
Michael McVickar
General Counsel
25+ yrs. of CRE exp.
Priya Venkataraman
Controller9+ yrs. of CRE exp.
Nick TannCreative Lead
15+ yrs. of design exp.
Benjamin HarrisCapital Markets
Associate3+ yrs. of CRE exp.
Kyle VerhasseltAssociate
3+ yrs. of CRE exp.
Melissa Harris
VP of Marketing
15+ yrs. of journalism exp.
Ashley FoghtAdministrative
Assistant10+ yrs. of management exp.
Tom Briney
10+ yrs. of CRE exp.
VP of Acquisitions – Southeast
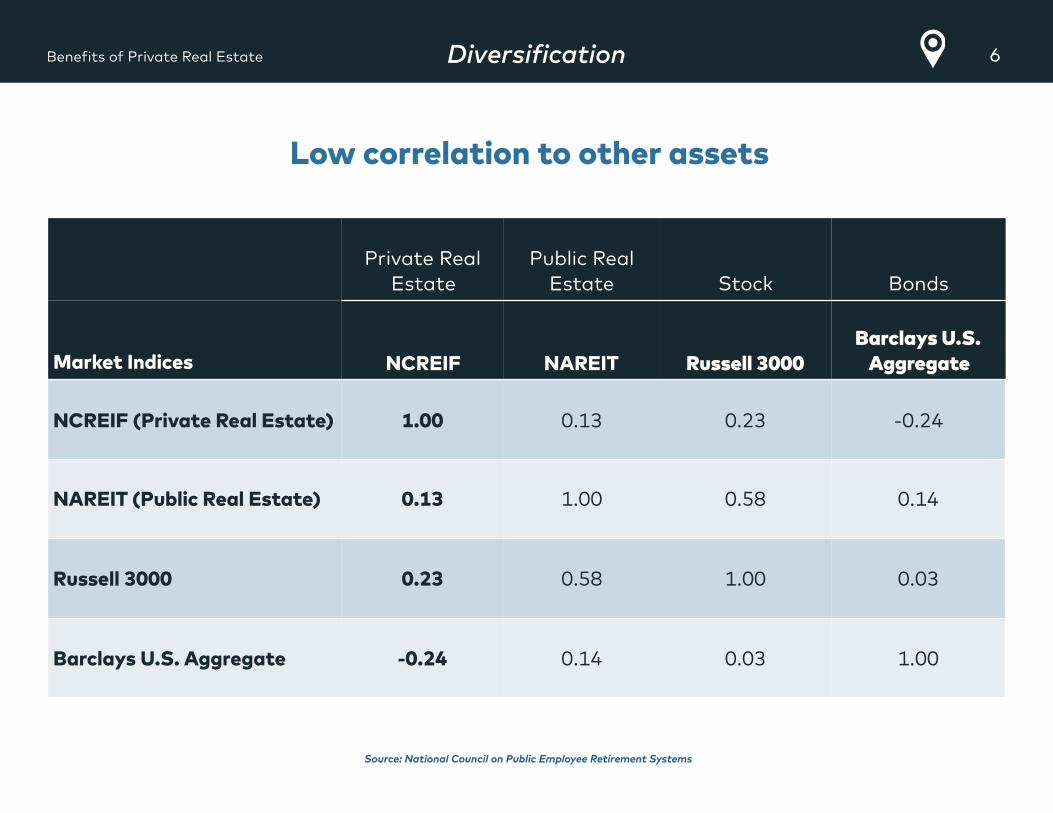
6DiversificationBenefits of Private Real Estate
Private Real Estate
Public Real Estate Stock Bonds
Market Indices NCREIF NAREIT Russell 3000Barclays U.S.
Aggregate
NCREIF (Private Real Estate) 1.00 0.13 0.23 -0.24
NAREIT (Public Real Estate) 0.13 1.00 0.58 0.14
Russell 3000 0.23 0.58 1.00 0.03
Barclays U.S. Aggregate -0.24 0.14 0.03 1.00
Low correlation to other assets
Source: National Council on Public Employee Retirement Systems
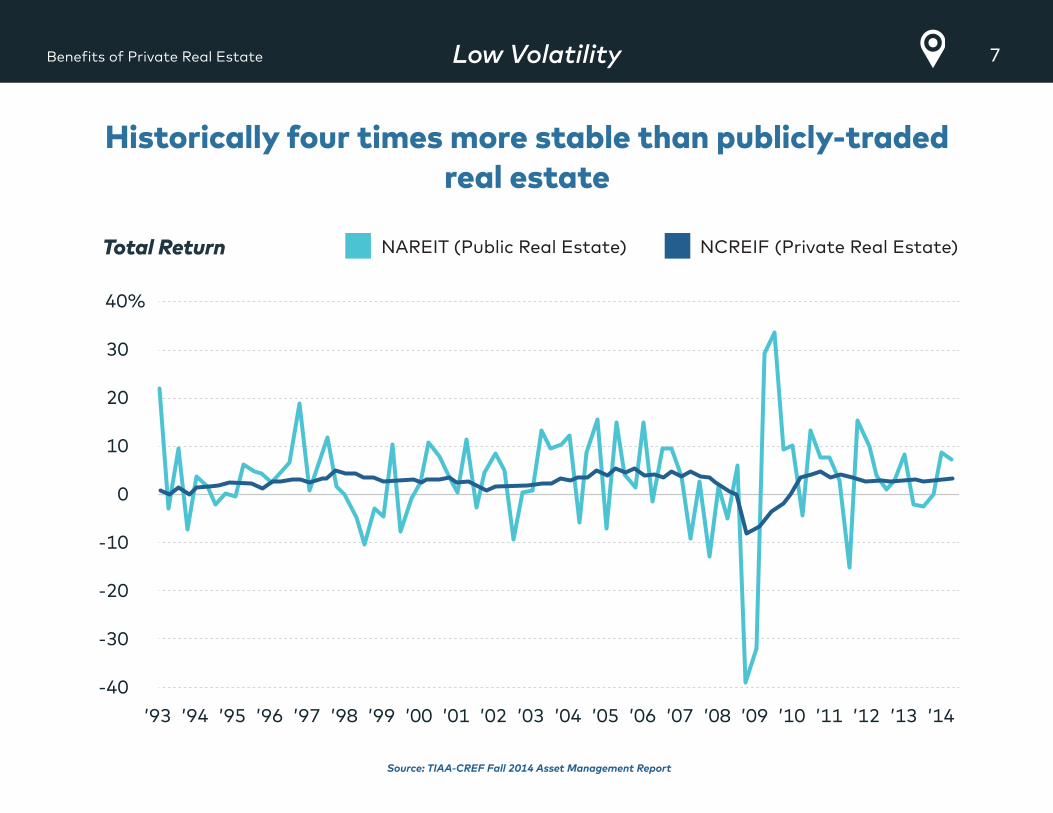
7Low VolatilityBenefits of Private Real Estate
Source: TIAA-CREF Fall 2014 Asset Management Report
Historically four times more stable than publicly-traded real estate
Total Return
’93-40
-30
-20
-10
0
10
20
30
40%
’94 ’95 ’96 ’97 ’98 ’99 ’00 ’01 ’02 ’03 ’04 ’05 ’06 ’07 ’08 ’09 ’10 ’11 ’12 ’13 ’14
NAREIT (Public Real Estate) NCREIF (Private Real Estate)
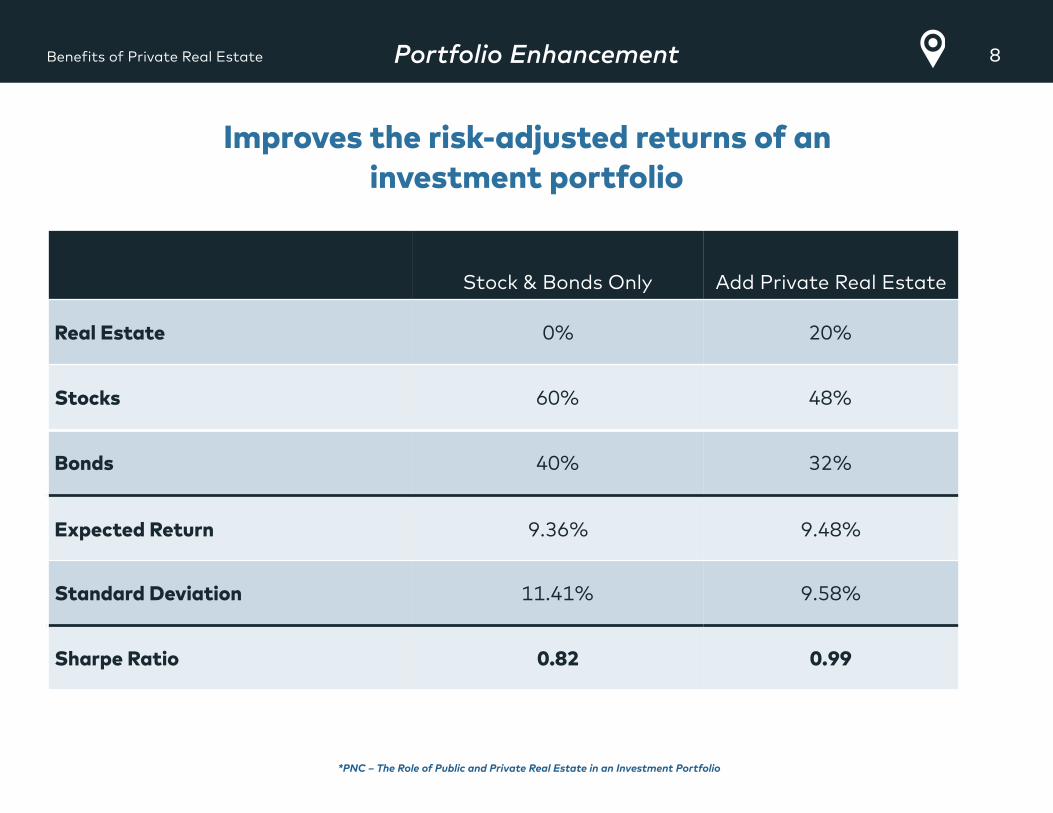
8Portfolio EnhancementBenefits of Private Real Estate
*PNC – The Role of Public and Private Real Estate in an Investment Portfolio
Stock & Bonds Only Add Private Real Estate
Real Estate 0% 20%
Stocks 60% 48%
Bonds 40% 32%
Expected Return 9.36% 9.48%
Standard Deviation 11.41% 9.58%
Sharpe Ratio 0.82 0.99
Improves the risk-adjusted returns of an investment portfolio
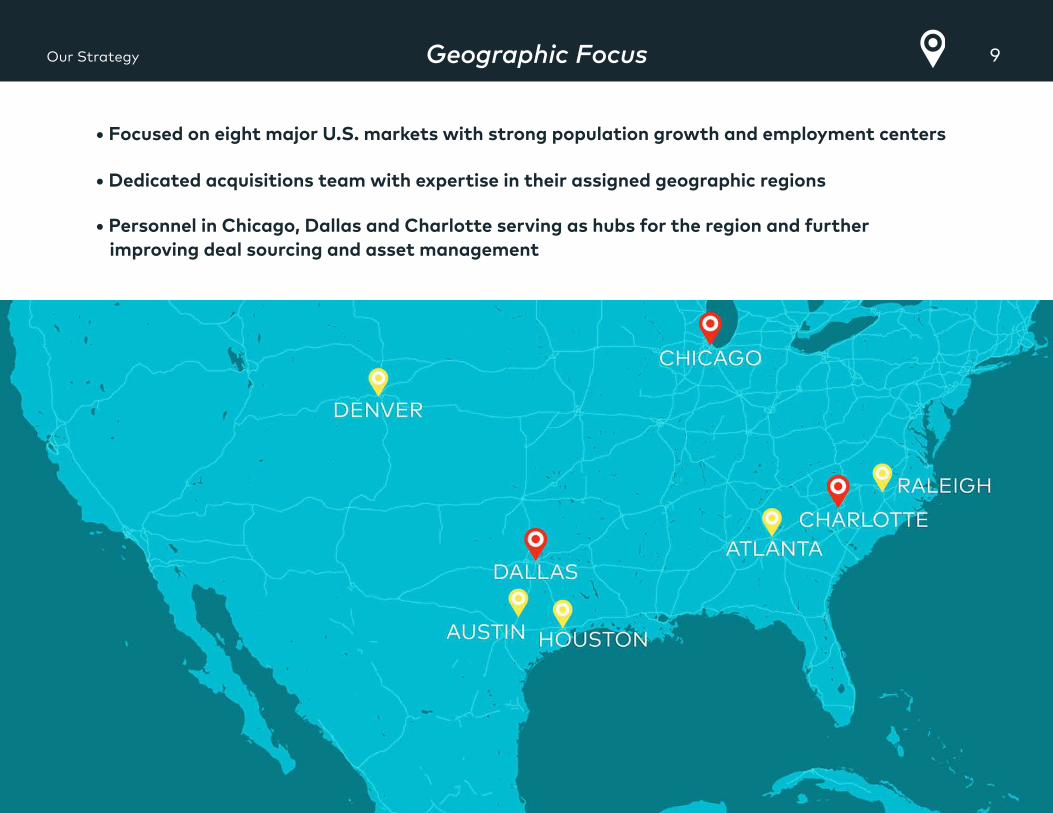
9Geographic FocusOur Strategy
• Focused on eight major U.S. markets with strong population growth and employment centers
• Dedicated acquisitions team with expertise in their assigned geographic regions
• Personnel in Chicago, Dallas and Charlotte serving as hubs for the region and further improving deal sourcing and asset management
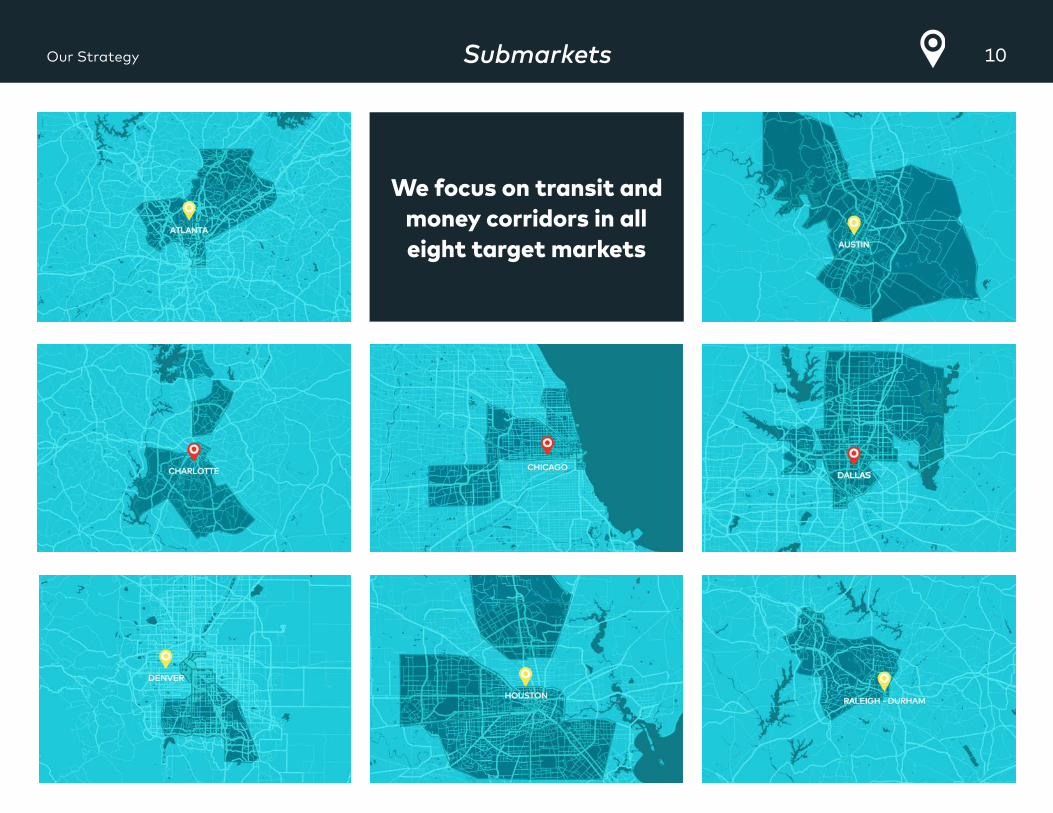
10SubmarketsOur Strategy
We focus on transit and money corridors in all eight target markets
11Market OpportunityOur Strategy
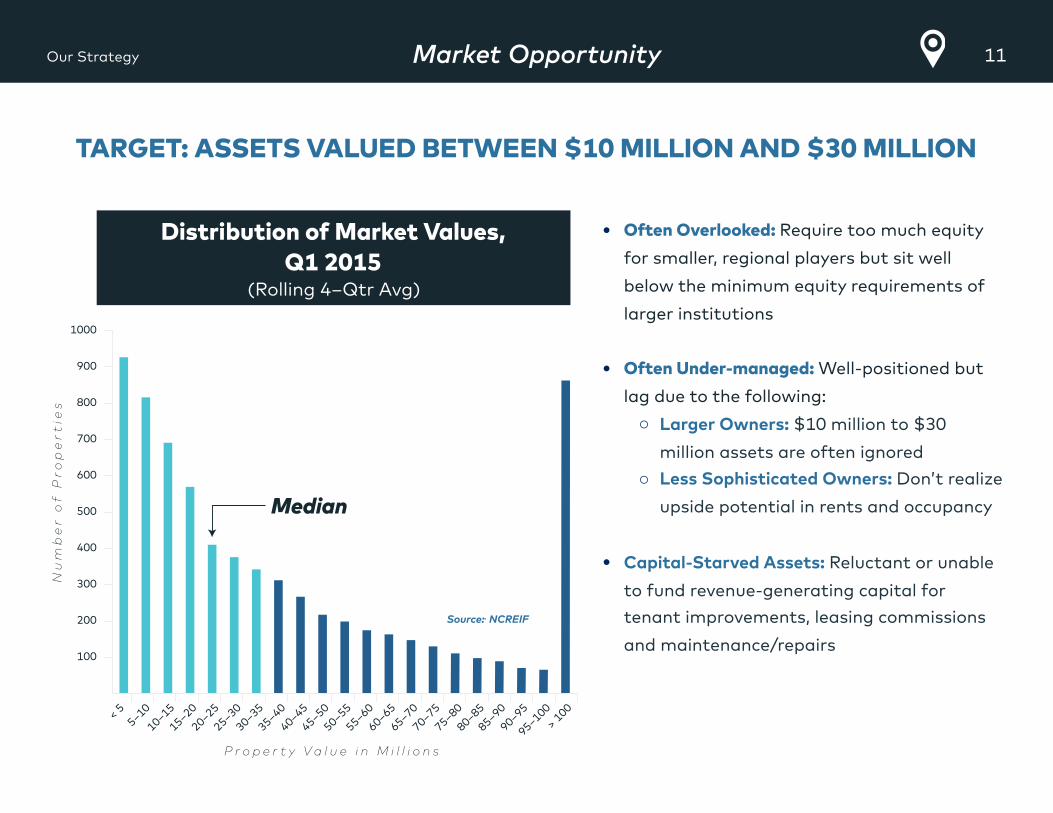
TARGET: ASSETS VALUED BETWEEN $10 MILLION AND $30 MILLION
Source:. NCREIF
• Often Overlooked: Require too much equity
for smaller, regional players but sit well
below the minimum equity requirements of
larger institutions
• Often Under-managed: Well-positioned but
lag due to the following: o Larger Owners: $10 million to $30
million assets are often ignored o Less Sophisticated Owners: Don’t realize
upside potential in rents and occupancy
• Capital-Starved Assets: Reluctant or unable
to fund revenue-generating capital for
tenant improvements, leasing commissions
and maintenance/repairs
Distribution of Market Values, Q1 2015
(Rolling 4–Qtr Avg)
< 55–10
10–15
15–20
20–25
25–30
30–35
35–40
40–45
45–50
50–55
55–60
60–65
65–70
70–75
75–80
80–85
85–90
90–95
95–100> 100
100
200
300
400
500
600
700
800
900
1000
Median
P r o p e r t y V a l u e i n M i l l i o n s
Nu
mb
er
of
Pro
pe
rtie
s
12Asset ManagementOur Strategy
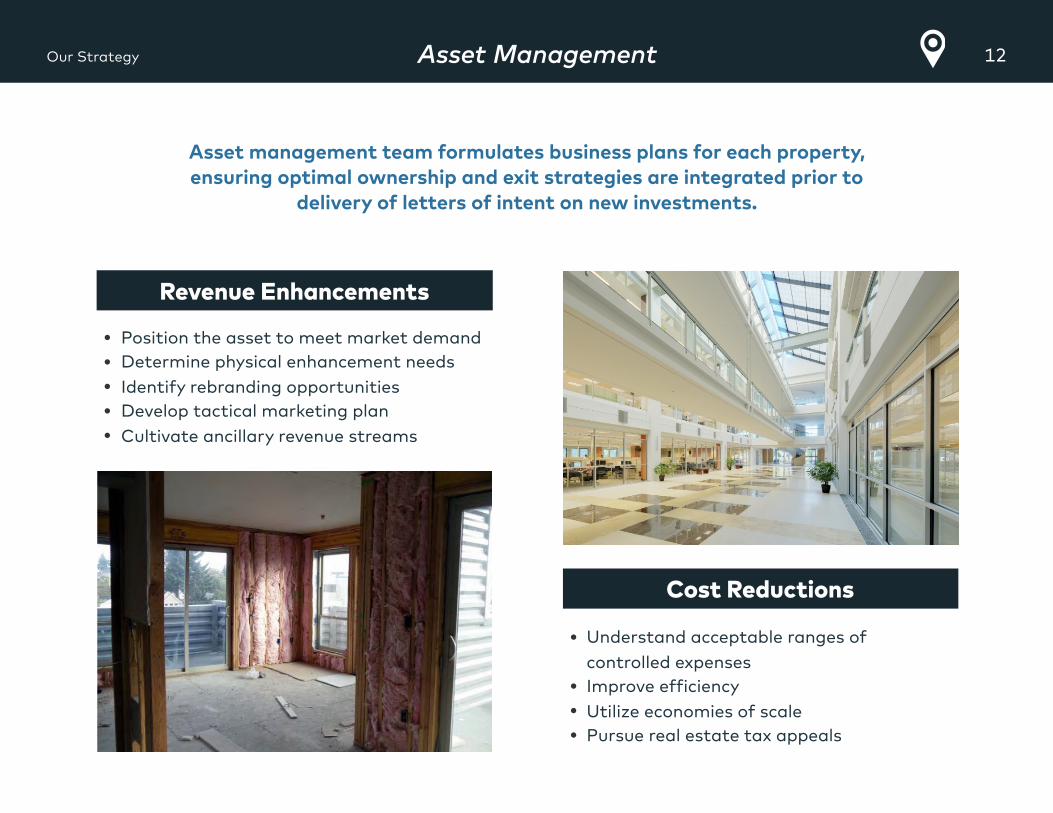
• Understand acceptable ranges of controlled expenses
• Improve efficiency • Utilize economies of scale • Pursue real estate tax appeals
Asset management team formulates business plans for each property, ensuring optimal ownership and exit strategies are integrated prior to
delivery of letters of intent on new investments.
Cost Reductions
Revenue Enhancements
• Position the asset to meet market demand • Determine physical enhancement needs
• Identify rebranding opportunities • Develop tactical marketing plan
• Cultivate ancillary revenue streams
13Downside ProtectionOur Strategy
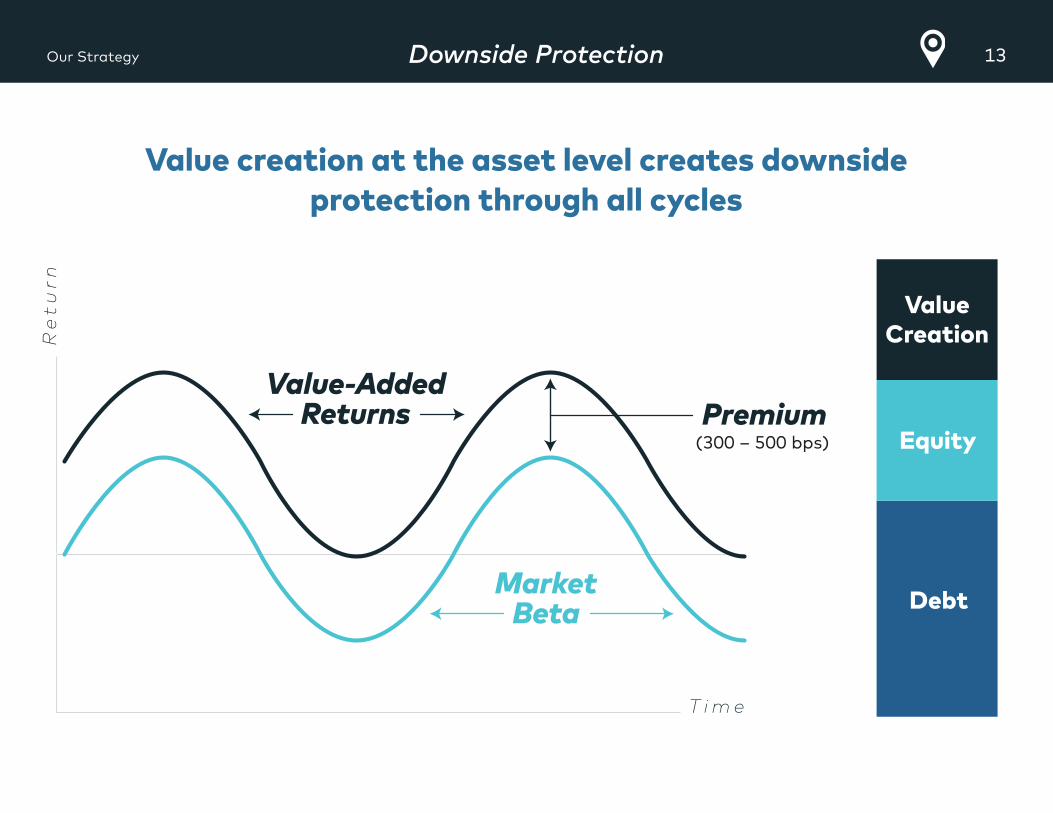
Debt
Equity
ValueCreationR
et
urn
T i m e
MarketBeta
PremiumValue-Added
Returns(300 – 500 bps)
Value creation at the asset level creates downside protection through all cycles
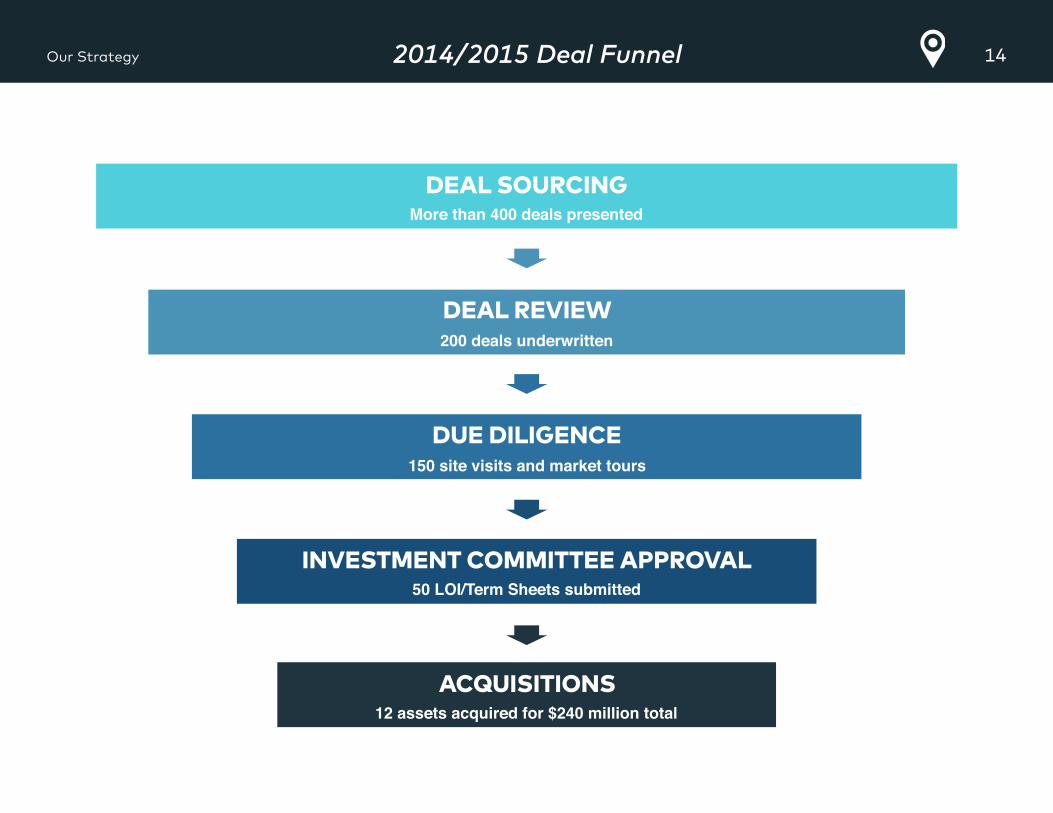
142014/2015 Deal FunnelOur Strategy
DEAL SOURCINGMore than 400 deals presented
DEAL REVIEW200 deals underwritten
DUE DILIGENCE150 site visits and market tours
ACQUISITIONS12 assets acquired for $240 million total
INVESTMENT COMMITTEE APPROVAL50 LOI/Term Sheets submitted
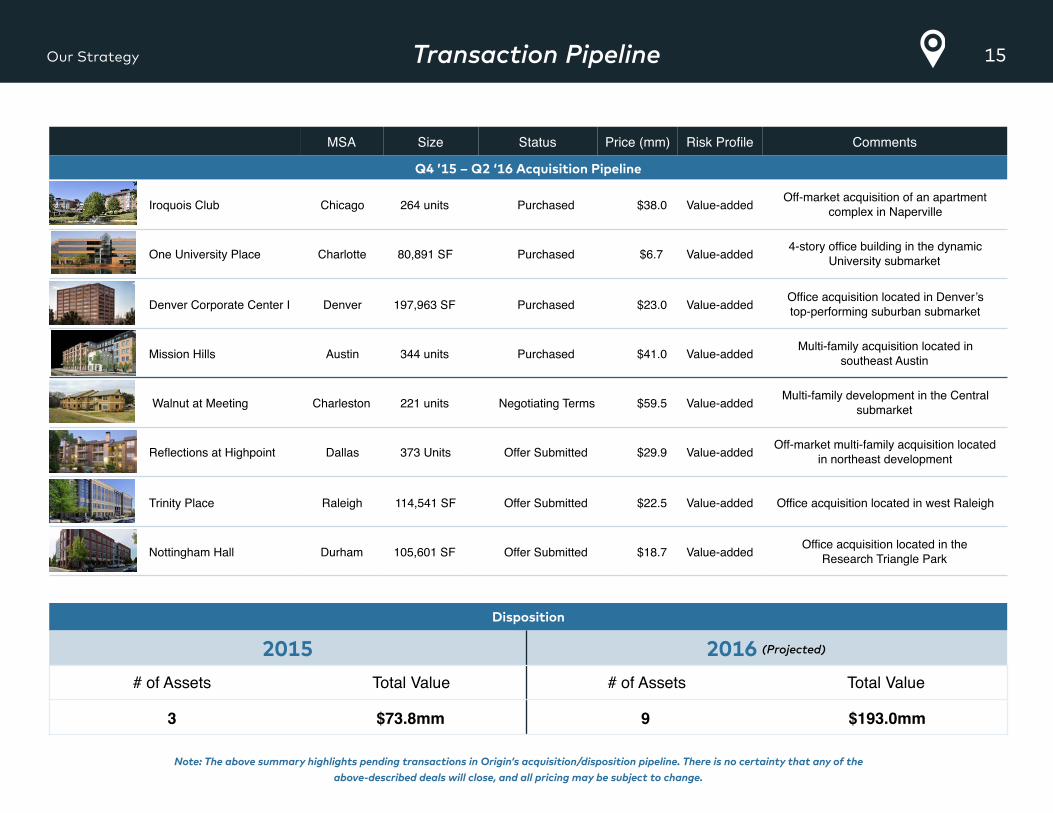
15Transaction PipelineOur Strategy
Note: The above summary highlights pending transactions in Origin’s acquisition/disposition pipeline. There is no certainty that any of the above-described deals will close, and all pricing may be subject to change.
MSA Size Status Price (mm) Risk Profile Comments
Q4 ’15 – Q2 ‘16 Acquisition Pipeline
Iroquois Club Chicago 264 units Purchased $38.0 Value-added Off-market acquisition of an apartment complex in Naperville
One University Place Charlotte 80,891 SF Purchased $6.7 Value-added 4-story office building in the dynamicUniversity submarket
Denver Corporate Center I Denver 197,963 SF Purchased $23.0 Value-added Office acquisition located in Denver’s top-performing suburban submarket
Mission Hills Austin 344 units Purchased $41.0 Value-added Multi-family acquisition located in southeast Austin
Walnut at Meeting Charleston 221 units Negotiating Terms $59.5 Value-added Multi-family development in the Central submarket
Reflections at Highpoint Dallas 373 Units Offer Submitted $29.9 Value-added Off-market multi-family acquisition locatedin northeast development
Trinity Place Raleigh 114,541 SF Offer Submitted $22.5 Value-added Office acquisition located in west Raleigh
Nottingham Hall Durham 105,601 SF Offer Submitted $18.7 Value-added Office acquisition located in the Research Triangle Park
Disposition
2015 2016 (Projected)
# of Assets Total Value # of Assets Total Value
3 $73.8mm 9 $193.0mm
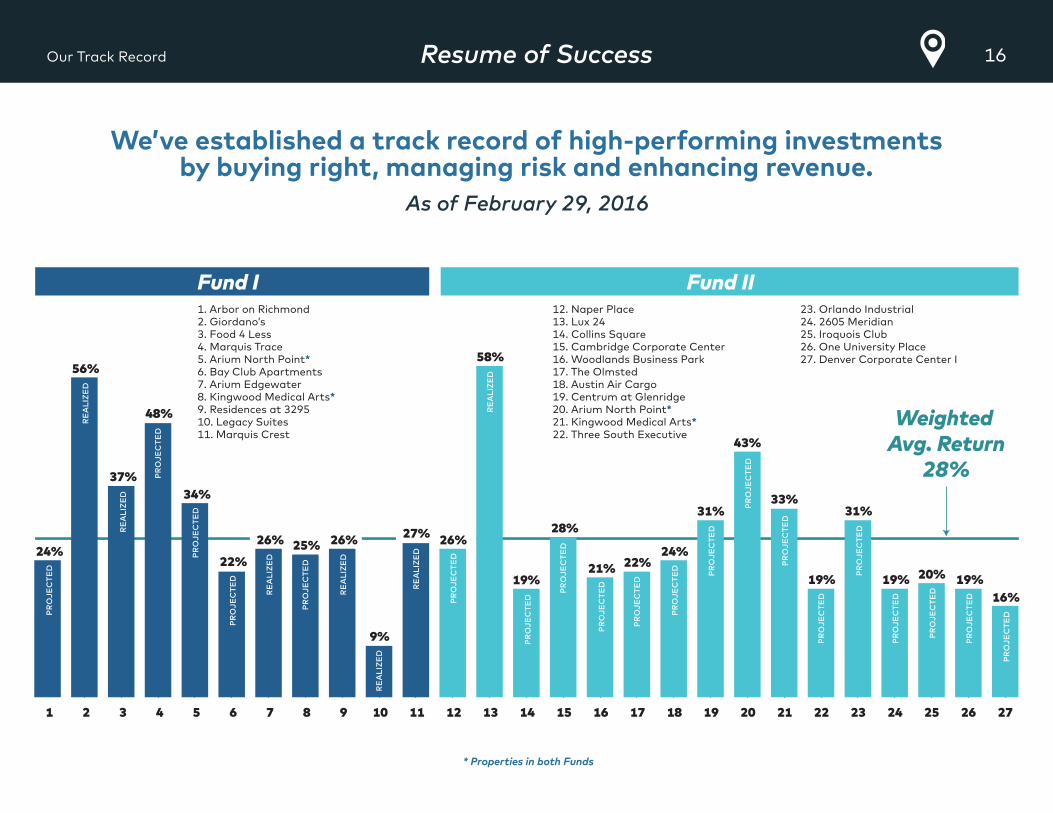
16Resume of SuccessOur Track Record
We’ve established a track record of high-performing investments by buying right, managing risk and enhancing revenue.
As of February 29, 2016
Weighted Avg. Return
28%
PROJE
CTE
D
REALIZED
REALIZED
56%
REALIZED
37%
REALIZED24%
27% 26%
REALIZED
REALIZED
PROJE
CTE
D
PROJE
CTE
D
48%
PROJE
CTE
D
34%
PROJE
CTE
D
22%
PROJE
CTE
D
25%26%
REALIZED
26%
REALIZED
58%
PROJE
CTE
D
19%
PROJE
CTE
D
22%
PROJE
CTE
D PROJE
CTE
D
31%
PROJE
CTE
D
33%PROJE
CTE
D
43%
PROJE
CTE
D
28%
PROJE
CTE
D
21% PROJE
CTE
D
31%
PROJE
CTE
D
20%
PROJE
CTE
D
19%
PROJE
CTE
D
19%
PROJE
CTE
D
19%
PROJE
CTE
D
16%
9%
12. Naper Place13. Lux 2414. Collins Square15. Cambridge Corporate Center16. Woodlands Business Park17. The Olmsted18. Austin Air Cargo19. Centrum at Glenridge20. Arium North Point*21. Kingwood Medical Arts*22. Three South Executive
23. Orlando Industrial24. 2605 Meridian25. Iroquois Club26. One University Place27. Denver Corporate Center I
Fund IIFund I
1 2 3 4 5 6 7 8 9 10 11 12 13 14 15 16 17 18 19 20 21 22 23 24 25 26 27
1. Arbor on Richmond 2. Giordano’s 3. Food 4 Less 4. Marquis Trace 5. Arium North Point*6. Bay Club Apartments7. Arium Edgewater8. Kingwood Medical Arts*9. Residences at 329510. Legacy Suites11. Marquis Crest
24%
* Properties in both Funds
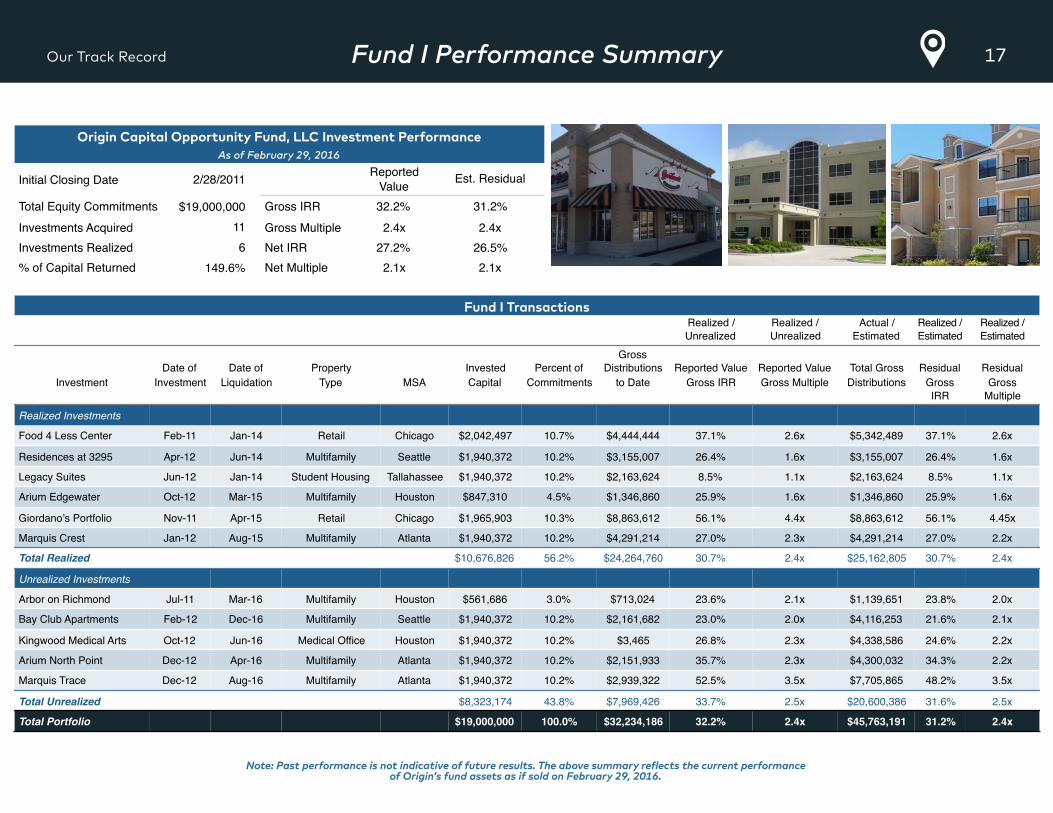
17Fund I Performance SummaryOur Track Record
Origin Capital Opportunity Fund, LLC Investment Performance As of February 29, 2016
Initial Closing Date 2/28/2011 Reported Value Est. Residual
Total Equity Commitments $19,000,000 Gross IRR 32.2% 31.2%Investments Acquired 11 Gross Multiple 2.4x 2.4xInvestments Realized 6 Net IRR 27.2% 26.5%% of Capital Returned 149.6% Net Multiple 2.1x 2.1x
Fund I TransactionsRealized / Unrealized
Realized / Unrealized
Actual / Estimated
Realized / Estimated
Realized / Estimated
Date of Date of Property Invested Percent ofGross
Distributions Reported Value Reported Value Total Gross Residual ResidualInvestment Investment Liquidation Type MSA Capital Commitments to Date Gross IRR Gross Multiple Distributions Gross
IRRGross
Multiple
Realized Investments
Food 4 Less Center Feb-11 Jan-14 Retail Chicago $2,042,497 10.7% $4,444,444 37.1% 2.6x $5,342,489 37.1% 2.6x
Residences at 3295 Apr-12 Jun-14 Multifamily Seattle $1,940,372 10.2% $3,155,007 26.4% 1.6x $3,155,007 26.4% 1.6x
Legacy Suites Jun-12 Jan-14 Student Housing Tallahassee $1,940,372 10.2% $2,163,624 8.5% 1.1x $2,163,624 8.5% 1.1x
Arium Edgewater Oct-12 Mar-15 Multifamily Houston $847,310 4.5% $1,346,860 25.9% 1.6x $1,346,860 25.9% 1.6x
Giordano’s Portfolio Nov-11 Apr-15 Retail Chicago $1,965,903 10.3% $8,863,612 56.1% 4.4x $8,863,612 56.1% 4.45x
Marquis Crest Jan-12 Aug-15 Multifamily Atlanta $1,940,372 10.2% $4,291,214 27.0% 2.3x $4,291,214 27.0% 2.2x
Total Realized $10,676,826 56.2% $24,264,760 30.7% 2.4x $25,162,805 30.7% 2.4x
Unrealized Investments
Arbor on Richmond Jul-11 Mar-16 Multifamily Houston $561,686 3.0% $713,024 23.6% 2.1x $1,139,651 23.8% 2.0x
Bay Club Apartments Feb-12 Dec-16 Multifamily Seattle $1,940,372 10.2% $2,161,682 23.0% 2.0x $4,116,253 21.6% 2.1x
Kingwood Medical Arts Oct-12 Jun-16 Medical Office Houston $1,940,372 10.2% $3,465 26.8% 2.3x $4,338,586 24.6% 2.2x
Arium North Point Dec-12 Apr-16 Multifamily Atlanta $1,940,372 10.2% $2,151,933 35.7% 2.3x $4,300,032 34.3% 2.2x
Marquis Trace Dec-12 Aug-16 Multifamily Atlanta $1,940,372 10.2% $2,939,322 52.5% 3.5x $7,705,865 48.2% 3.5x
Total Unrealized $8,323,174 43.8% $7,969,426 33.7% 2.5x $20,600,386 31.6% 2.5x
Total Portfolio $19,000,000 100.0% $32,234,186 32.2% 2.4x $45,763,191 31.2% 2.4x
Note: Past performance is not indicative of future results. The above summary reflects the current performance of Origin’s fund assets as if sold on February 29, 2016.
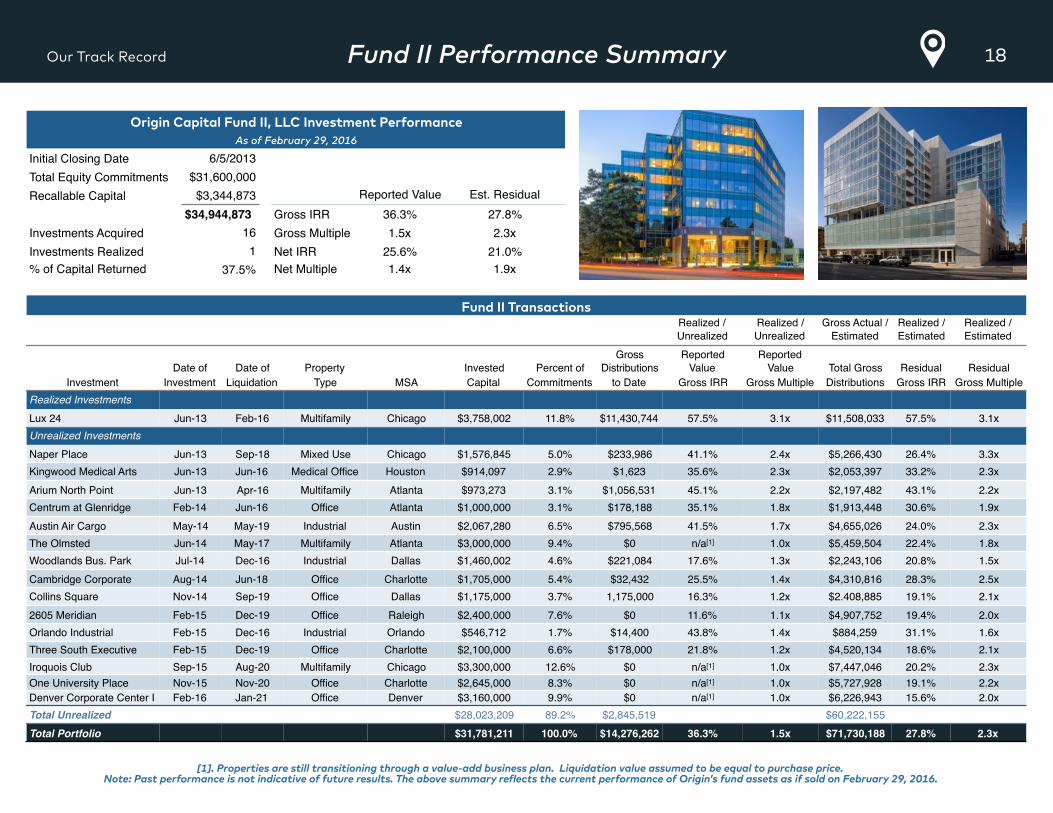
18Fund II Performance SummaryOur Track Record
[1]. Properties are still transitioning through a value-add business plan. Liquidation value assumed to be equal to purchase price. Note: Past performance is not indicative of future results. The above summary reflects the current performance of Origin’s fund assets as if sold on February 29, 2016.
Origin Capital Fund II, LLC Investment Performance As of February 29, 2016
Initial Closing Date 6/5/2013Total Equity Commitments $31,600,000Recallable Capital $3,344,873 Reported Value Est. Residual
$34,944,873 Gross IRR 36.3% 27.8%Investments Acquired 16 Gross Multiple 1.5x 2.3xInvestments Realized 1 Net IRR 25.6% 21.0%% of Capital Returned 37.5% Net Multiple 1.4x 1.9x
Fund II TransactionsRealized / Unrealized
Realized / Unrealized
Gross Actual / Estimated
Realized / Estimated
Realized / Estimated
Date of Date of Property Invested Percent ofGross
DistributionsReported
ValueReported
Value Total Gross Residual ResidualInvestment Investment Liquidation Type MSA Capital Commitments to Date Gross IRR Gross Multiple Distributions Gross IRR Gross Multiple
Realized InvestmentsLux 24 Jun-13 Feb-16 Multifamily Chicago $3,758,002 11.8% $11,430,744 57.5% 3.1x $11,508,033 57.5% 3.1x Unrealized InvestmentsNaper Place Jun-13 Sep-18 Mixed Use Chicago $1,576,845 5.0% $233,986 41.1% 2.4x $5,266,430 26.4% 3.3xKingwood Medical Arts Jun-13 Jun-16 Medical Office Houston $914,097 2.9% $1,623 35.6% 2.3x $2,053,397 33.2% 2.3xArium North Point Jun-13 Apr-16 Multifamily Atlanta $973,273 3.1% $1,056,531 45.1% 2.2x $2,197,482 43.1% 2.2xCentrum at Glenridge Feb-14 Jun-16 Office Atlanta $1,000,000 3.1% $178,188 35.1% 1.8x $1,913,448 30.6% 1.9xAustin Air Cargo May-14 May-19 Industrial Austin $2,067,280 6.5% $795,568 41.5% 1.7x $4,655,026 24.0% 2.3xThe Olmsted Jun-14 May-17 Multifamily Atlanta $3,000,000 9.4% $0 n/a[1] 1.0x $5,459,504 22.4% 1.8xWoodlands Bus. Park Jul-14 Dec-16 Industrial Dallas $1,460,002 4.6% $221,084 17.6% 1.3x $2,243,106 20.8% 1.5xCambridge Corporate Aug-14 Jun-18 Office Charlotte $1,705,000 5.4% $32,432 25.5% 1.4x $4,310,816 28.3% 2.5xCollins Square Nov-14 Sep-19 Office Dallas $1,175,000 3.7% 1,175,000 16.3% 1.2x $2.408,885 19.1% 2.1x2605 Meridian Feb-15 Dec-19 Office Raleigh $2,400,000 7.6% $0 11.6% 1.1x $4,907,752 19.4% 2.0xOrlando Industrial Feb-15 Dec-16 Industrial Orlando $546,712 1.7% $14,400 43.8% 1.4x $884,259 31.1% 1.6xThree South Executive Feb-15 Dec-19 Office Charlotte $2,100,000 6.6% $178,000 21.8% 1.2x $4,520,134 18.6% 2.1xIroquois Club Sep-15 Aug-20 Multifamily Chicago $3,300,000 12.6% $0 n/a[1] 1.0x $7,447,046 20.2% 2.3xOne University Place Nov‐15 Nov‐20 Office Charlotte $2,645,000 8.3% $0 n/a[1] 1.0x $5,727,928 19.1% 2.2x Denver Corporate Center I Feb‐16 Jan‐21 Office Denver $3,160,000 9.9% $0 n/a[1] 1.0x $6,226,943 15.6% 2.0x Total Unrealized $28,023,209 89.2% $2,845,519 $60,222,155Total Portfolio $31,781,211 100.0% $14,276,262 36.3% 1.5x $71,730,188 27.8% 2.3x
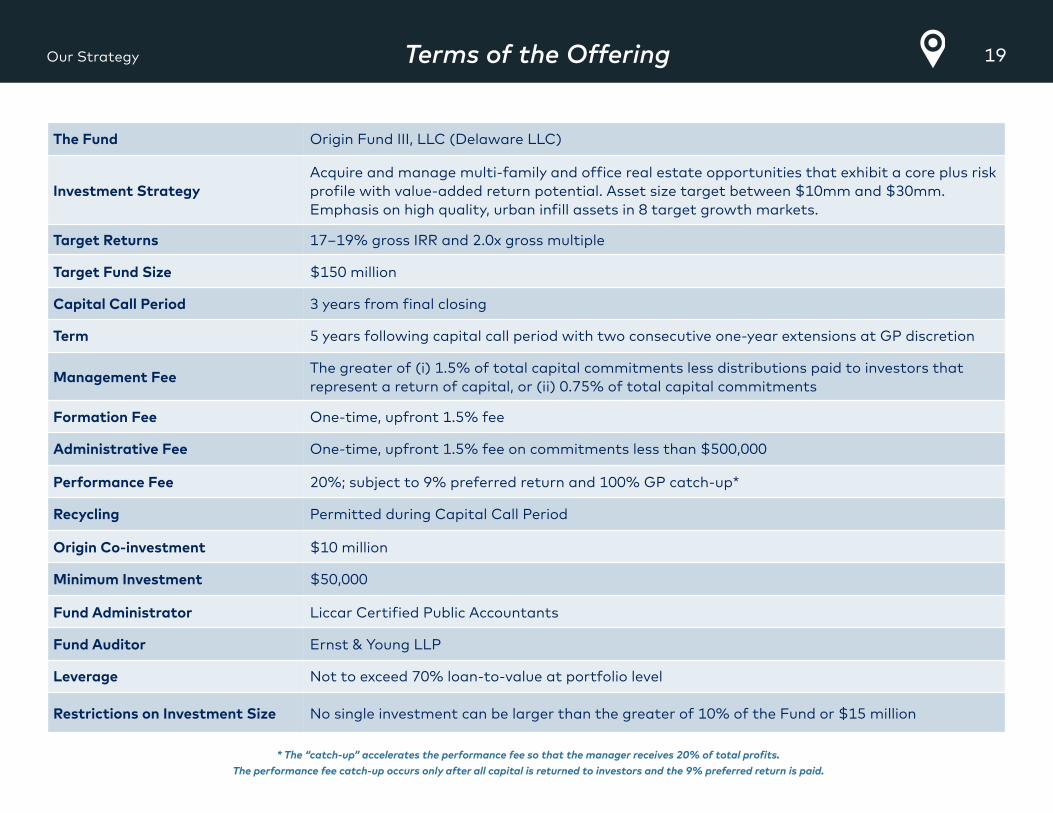
19Terms of the OfferingOur Strategy
The Fund Origin Fund III, LLC (Delaware LLC)
Investment StrategyAcquire and manage multi-family and office real estate opportunities that exhibit a core plus risk profile with value-added return potential. Asset size target between $10mm and $30mm. Emphasis on high quality, urban infill assets in 8 target growth markets.
Target Returns 17–19% gross IRR and 2.0x gross multiple
Target Fund Size $150 million
Capital Call Period 3 years from final closing
Term 5 years following capital call period with two consecutive one-year extensions at GP discretion
Management FeeThe greater of (i) 1.5% of total capital commitments less distributions paid to investors that represent a return of capital, or (ii) 0.75% of total capital commitments
Formation Fee One-time, upfront 1.5% fee
Administrative Fee One-time, upfront 1.5% fee on commitments less than $500,000
Performance Fee 20%; subject to 9% preferred return and 100% GP catch-up*
Recycling Permitted during Capital Call Period
Origin Co-investment $10 million
Minimum Investment $50,000
Fund Administrator Liccar Certified Public Accountants
Fund Auditor Ernst & Young LLP
Leverage Not to exceed 70% loan-to-value at portfolio level
Restrictions on Investment Size No single investment can be larger than the greater of 10% of the Fund or $15 million
* The “catch-up” accelerates the performance fee so that the manager receives 20% of total profits. The performance fee catch-up occurs only after all capital is returned to investors and the 9% preferred return is paid.
Appendix
Examples
Case Studies
Team Bios
Contact Information
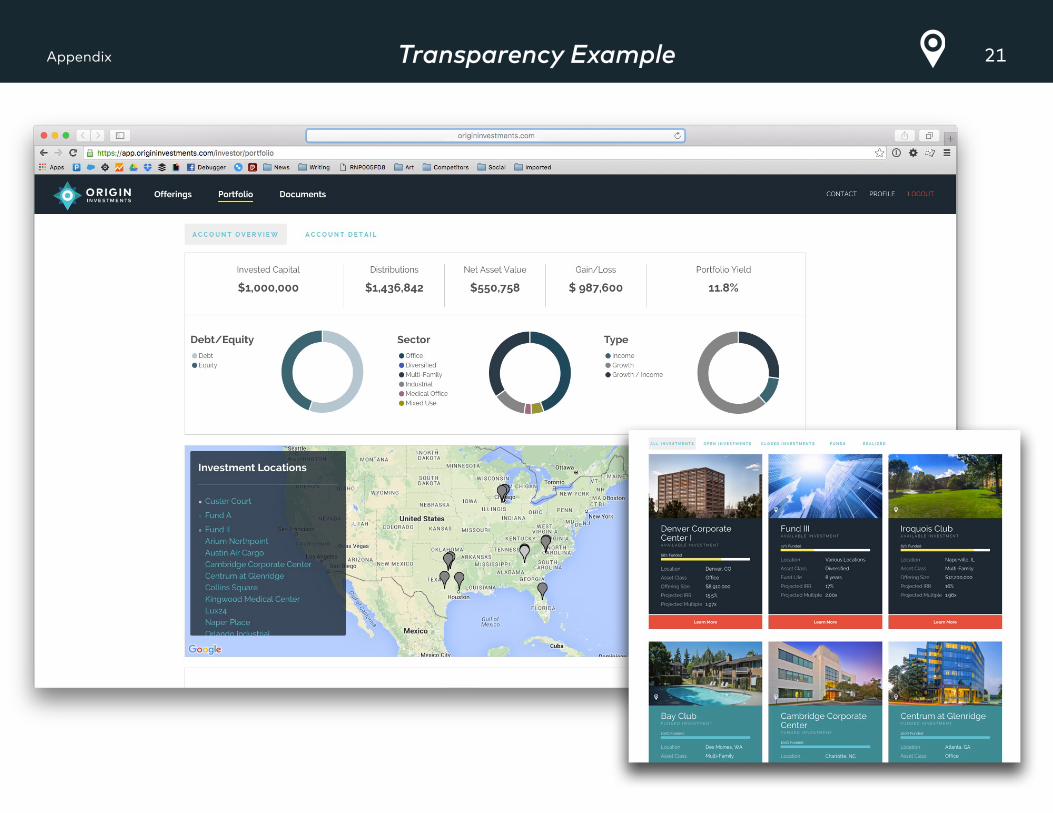
21Transparency ExampleAppendix
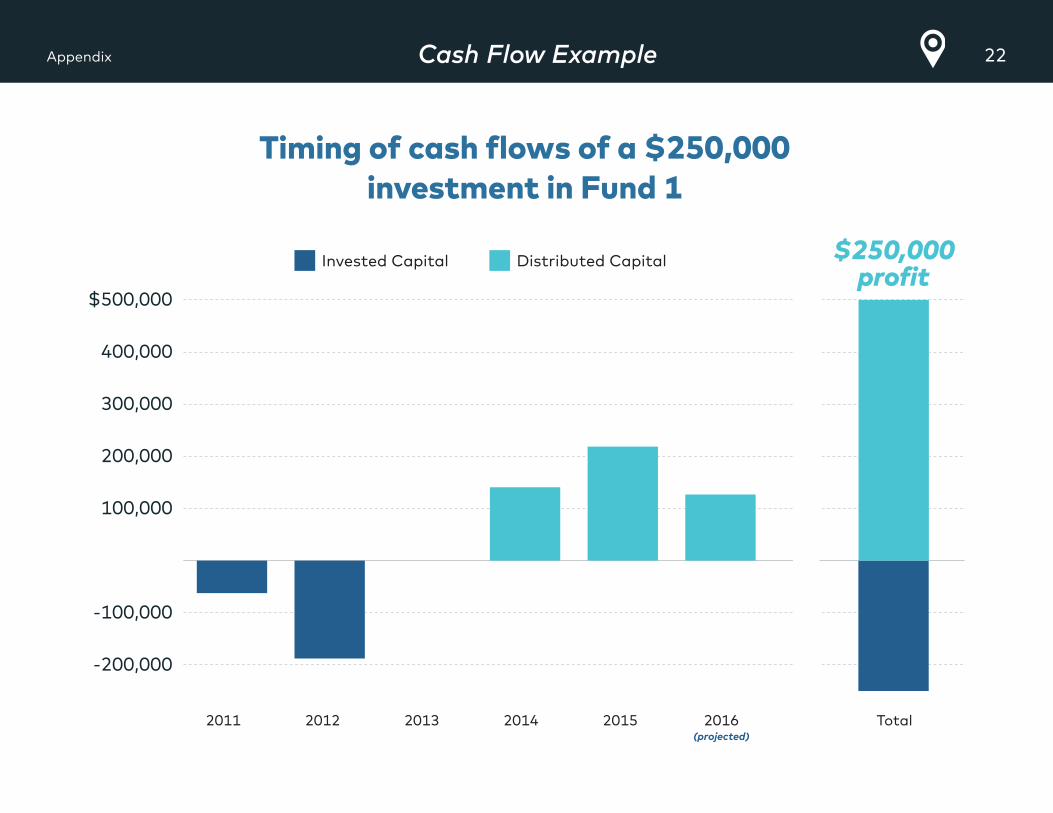
22Cash Flow ExampleAppendix
Timing of cash flows of a $250,000 investment in Fund 1
-200,000
-100,000
100,000
200,000
300,000
400,000
$500,000
2011 2012 2013 2014 2015 2016(projected)
Total
Invested Capital Distributed Capital $250,000profit
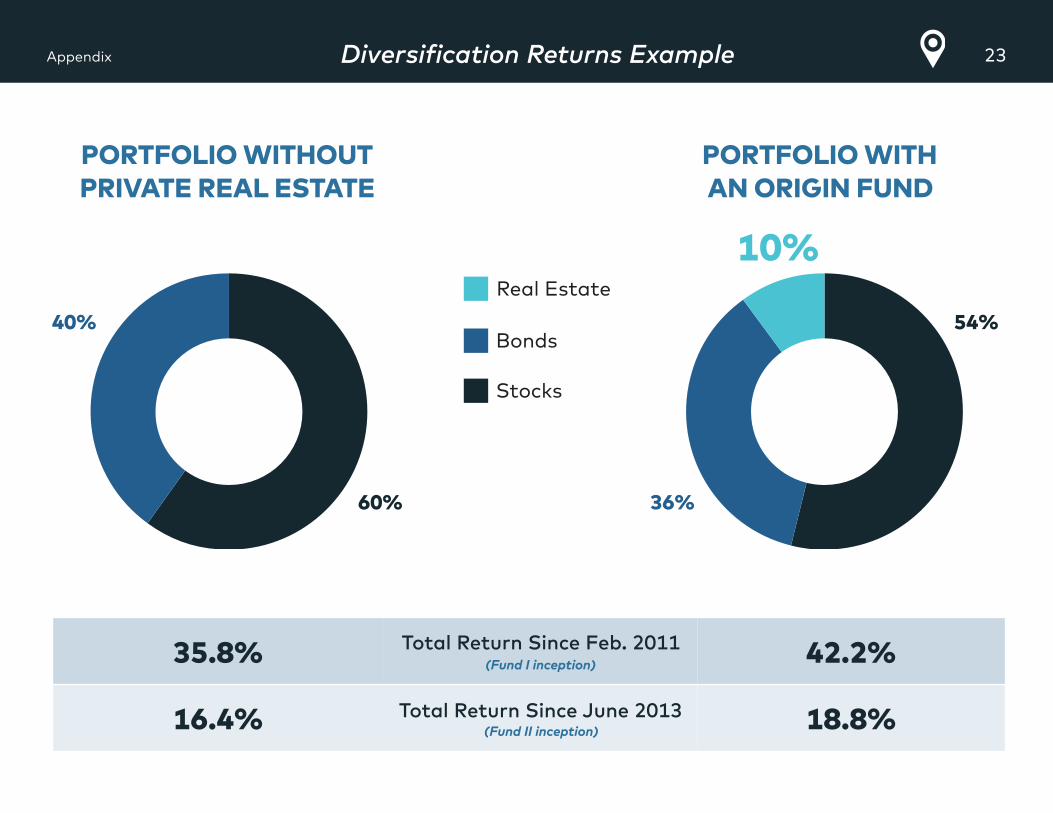
23Diversification Returns ExampleAppendix
35.8% Total Return Since Feb. 2011 (Fund I inception) 42.2%
16.4% Total Return Since June 2013 (Fund II inception) 18.8%
PORTFOLIO WITHOUT PRIVATE REAL ESTATE
PORTFOLIO WITH AN ORIGIN FUND
Real Estate
Bonds
Stocks
40%
60% 36%
10%
54%
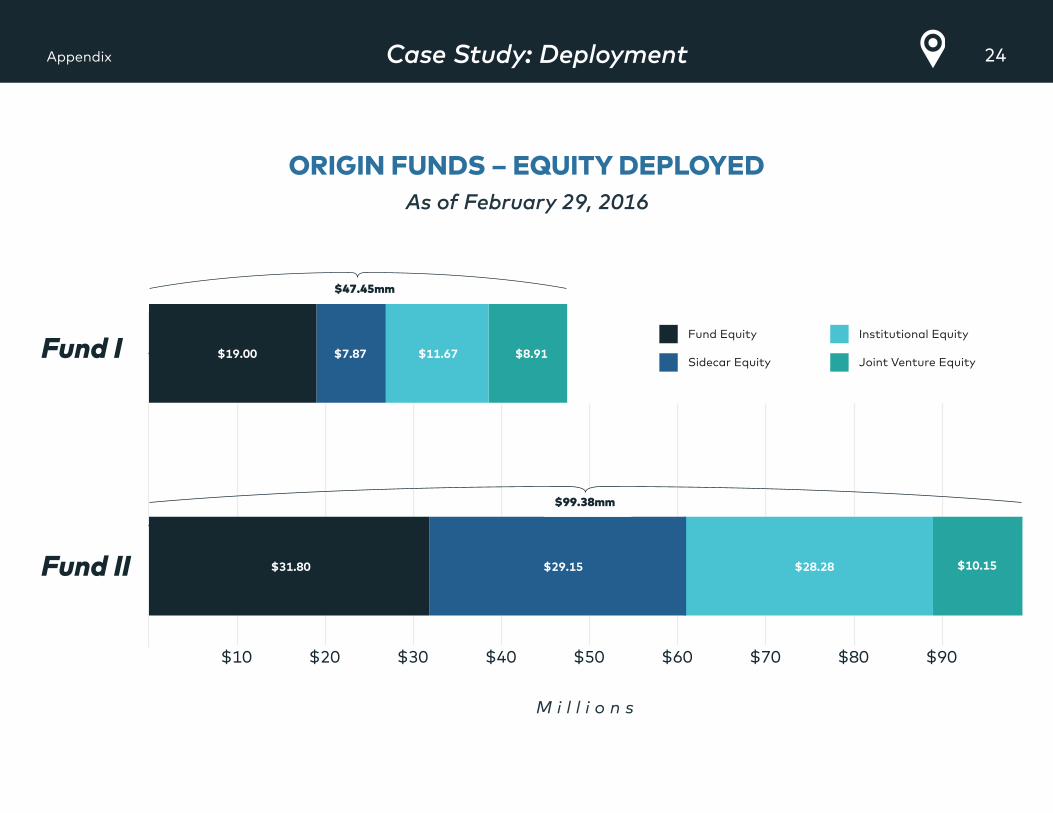
24Case Study: DeploymentAppendix
ORIGIN FUNDS – EQUITY DEPLOYED As of February 29, 2016
M i l l i o n s
Fund I
Fund II
$10 $20 $30 $40 $50 $60 $70 $80 $90
$19.00
$31.80 $29.15 $28.28 $10.15
$7.87
$47.45mm
$99.38mm
$11.67 $8.91
Fund Equity
Sidecar Equity
Institutional Equity
Joint Venture Equity
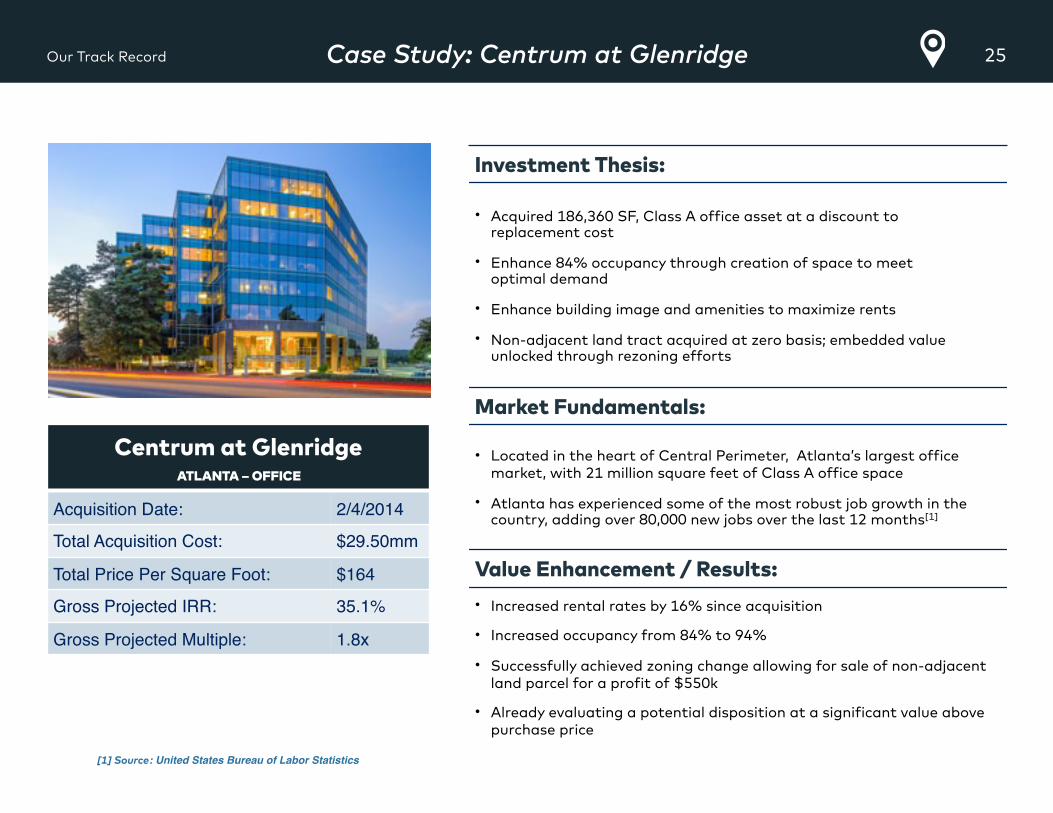
25Case Study: Centrum at GlenridgeOur Track Record
[1] Source: United States Bureau of Labor Statistics
Centrum at Glenridge ATLANTA – OFFICE
Acquisition Date: 2/4/2014
Total Acquisition Cost: $29.50mm
Total Price Per Square Foot: $164
Gross Projected IRR: 35.1%
Gross Projected Multiple: 1.8x
Investment Thesis:
• Acquired 186,360 SF, Class A office asset at a discount to replacement cost
• Enhance 84% occupancy through creation of space to meet optimal demand
• Enhance building image and amenities to maximize rents
• Non-adjacent land tract acquired at zero basis; embedded value unlocked through rezoning efforts
Market Fundamentals:
• Located in the heart of Central Perimeter, Atlanta’s largest office market, with 21 million square feet of Class A office space
• Atlanta has experienced some of the most robust job growth in the country, adding over 80,000 new jobs over the last 12 months[1]
Value Enhancement / Results:• Increased rental rates by 16% since acquisition
• Increased occupancy from 84% to 94%
• Successfully achieved zoning change allowing for sale of non-adjacent land parcel for a profit of $550k
• Already evaluating a potential disposition at a significant value above purchase price
26Case Study: Lux 24Our Track Record
[1] Source: REIS* Includes $16.75 million purchase price plus repositioning costs
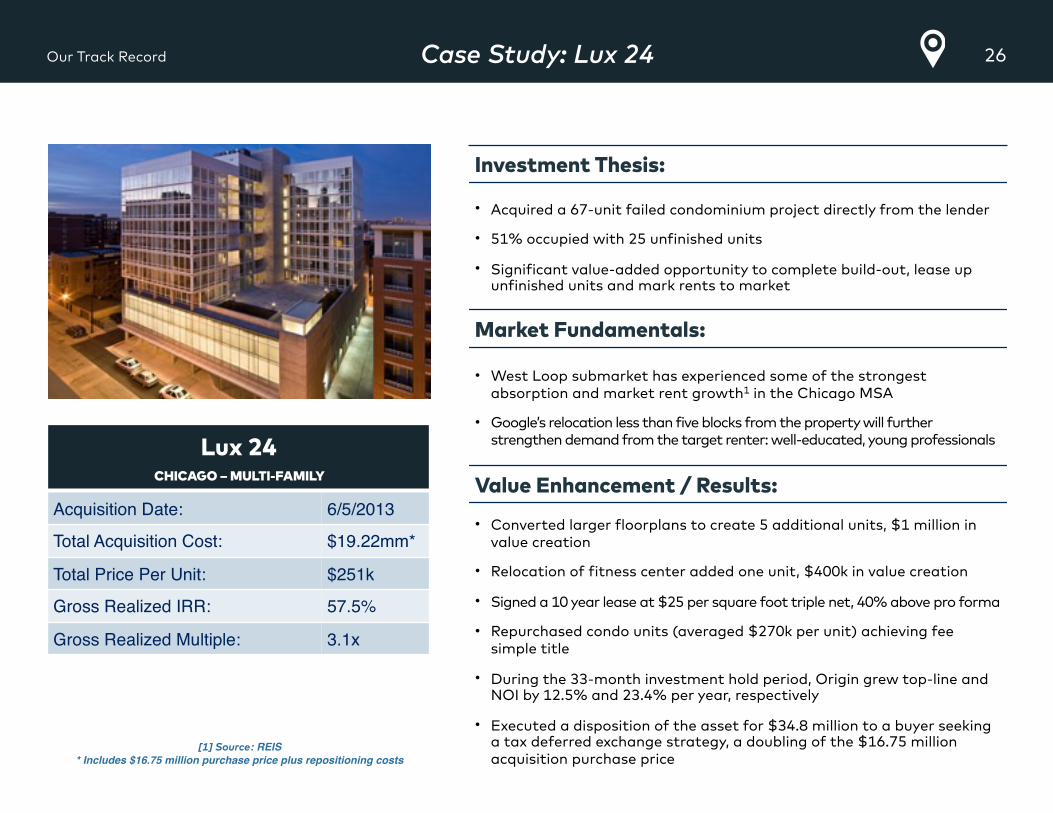
Lux 24 CHICAGO – MULTI-FAMILY
Acquisition Date: 6/5/2013
Total Acquisition Cost: $19.22mm*
Total Price Per Unit: $251k
Gross Realized IRR: 57.5%
Gross Realized Multiple: 3.1x
Investment Thesis:
• Acquired a 67-unit failed condominium project directly from the lender
• 51% occupied with 25 unfinished units
• Significant value-added opportunity to complete build-out, lease up unfinished units and mark rents to market
Market Fundamentals:
• West Loop submarket has experienced some of the strongest absorption and market rent growth1 in the Chicago MSA
• Google’s relocation less than five blocks from the property will further strengthen demand from the target renter: well-educated, young professionals
Value Enhancement / Results:
• Converted larger floorplans to create 5 additional units, $1 million in value creation
• Relocation of fitness center added one unit, $400k in value creation
• Signed a 10 year lease at $25 per square foot triple net, 40% above pro forma
• Repurchased condo units (averaged $270k per unit) achieving fee simple title
• During the 33-month investment hold period, Origin grew top-line and NOI by 12.5% and 23.4% per year, respectively
• Executed a disposition of the asset for $34.8 million to a buyer seeking a tax deferred exchange strategy, a doubling of the $16.75 million acquisition purchase price
27Case Study: Asset ManagementAppendix
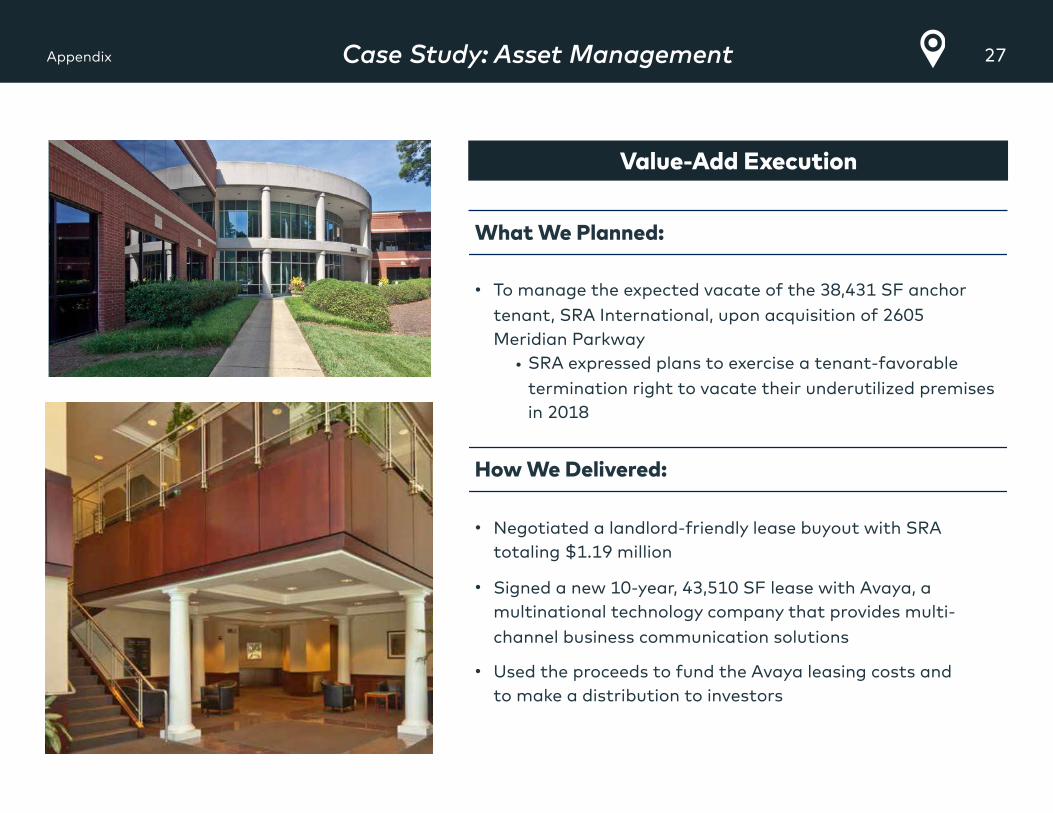
What We Planned:
• To manage the expected vacate of the 38,431 SF anchor tenant, SRA International, upon acquisition of 2605 Meridian Parkway
• SRA expressed plans to exercise a tenant-favorable termination right to vacate their underutilized premises in 2018
How We Delivered:
• Negotiated a landlord-friendly lease buyout with SRA totaling $1.19 million
• Signed a new 10-year, 43,510 SF lease with Avaya, a multinational technology company that provides multi-channel business communication solutions
• Used the proceeds to fund the Avaya leasing costs and to make a distribution to investors
Value-Add Execution
28Tax Efficiency ExampleAppendix
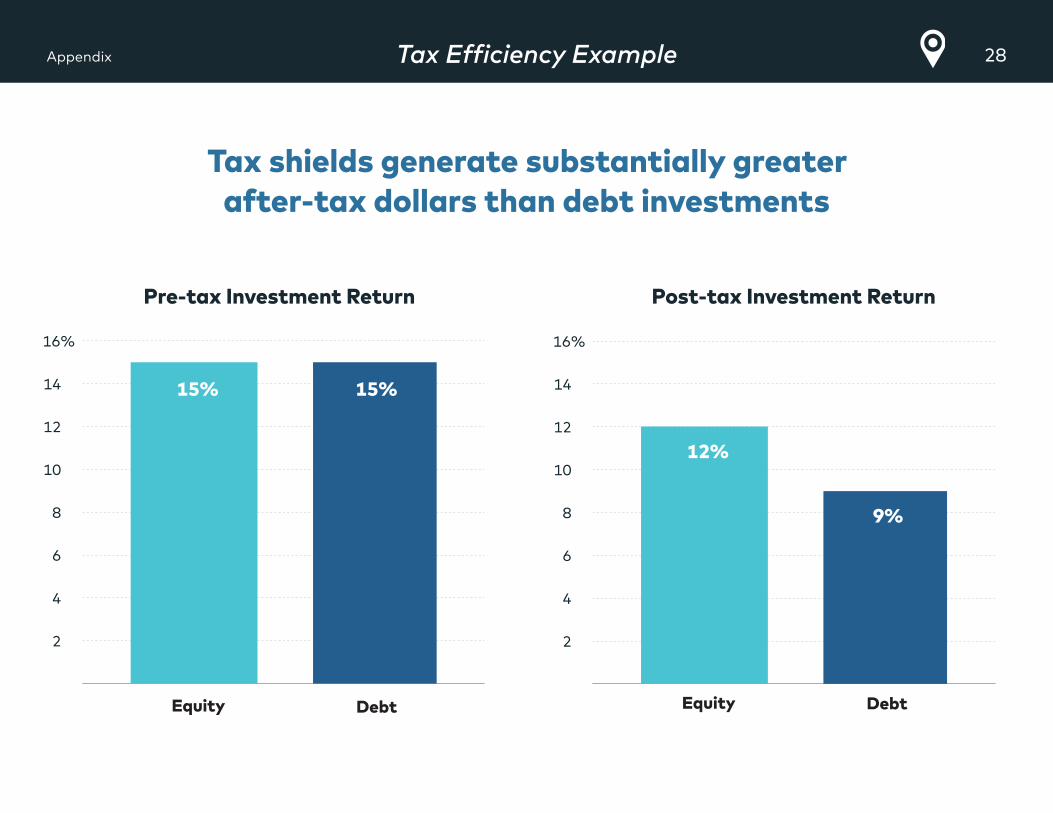
Pre-tax Investment Return Post-tax Investment Return
Tax shields generate substantially greater after-tax dollars than debt investments
2
4
6
8
10
12
14
16%
DebtEquity
2
4
6
8
10
12
14
16%
DebtEquity
15% 15%
12%
9%
29Team BiosAppendix
David Scherer formed Origin Investments in 2007, along with co-founder Michael Episcope. He has over 17 years of experience in real estate investing, finance, development and asset management.
As Principal, David co-chairs the Investment Committee and oversees the analysis, acquisition, and asset management teams at Origin. He also assembles and leads Origin’s team of investment professionals, who share more than $5 billion of transactional experience.
Prior to forming Origin, David spent eight years at a privately-financed hedge fund, where he opened and managed offices in New York and London, and served as company President from 1999 to 2003.
In 2006, David co-founded One Million Degrees, which to date has raised $10 million to help low-income, community college students graduate and successfully enter the workforce. He currently serves as the organization’s Board Chair. He also serves on the Board of the Harvard Club of Chicago and the Advisory Board of Invest For Kids.
David received his undergraduate degree from Harvard University and MBA from University of Chicago’s Booth School of Business. He is married, has two children, is a youth flag football coach and has an interest in languages.
Michael Episcope cofounded Origin Investments to create access to real estate investments and management expertise that were previously only available to institutions. His investment philosophy is rooted in risk management and value creation, and he’s been an active real estate investor for more than 15 years.
As Principal, Michael co-chairs the Investment Committee and oversees marketing and sales efforts for the company. He has purchased and executed more than $650 million of commercial real estate and debt collateralized by commercial real estate.
Prior to forming Origin, Michael founded SCP Capital, where he developed and implemented proprietary risk management and trading strategies. He was named one of the top 100 traders in the world by Trader Monthly Magazine in 2003, and again in 2005.
Michael is the former President of the DePaul Real Estate Alumni Alliance, an official mentor to DePaul graduate students and a sustaining sponsor of the DePaul Real Estate Center. He received his undergraduate degree in finance and his Master of Science in Real Estate from DePaul University.
Michael is married with three children and lives on the north side of Chicago. He’s been coaching youth baseball since 2011, and is an avid runner, snowboarder and traveler.
David Scherer Principal
Michael EpiscopePrincipal
30Team BiosAppendix
Michael McVickar serves as Origin Investments’s in-house general counsel.
Prior to joining Origin Investments, Michael was the Vice President and Senior Associate General Counsel at General Growth Properties, a $3 billion publicly-traded REIT. Earlier in his career, he worked the Associate General Counsel and Assistant Secretary at APAC Customer Services. Michael also worked at Corporate Express as their Assistant General Counsel.
He received his Bachelor degree in Chemistry from Hope College and his JD from Valparaiso University School of Law. Michael is admitted to the Illinois Bar and the Northern District of Illinois. He is an accomplished French horn player, contemporary art collector and competitive recreational cyclist. Michael and his husband have been residents of the city of Chicago for over twenty-five years.
Michael McVickarGeneral Counsel
Marc Turner is a senior commercial real estate investment professional with 20 years of experience in asset management, acquisition, disposition, underwriting and valuation, leasing, and due diligence. As Director of Asset Management at Origin Investments, Marc is responsible for overseeing the company’s real estate portfolio and executing Fund and property-level business plans.
Before Origin Investments, Marc served as Vice President of Asset Management at Lightstone, a New York investment firm with $2 billion of assets under management. Prior to Lightstone, he was involved in the HSBC Amanah Global Properties Income Fund ("GPIF"). As Head of Asset Management for the U.S. portfolio, he held responsibility for the investment performance of a 36 building national office, R&D, and an industrial portfolio containing 7 million square feet. Earlier in his career, Marc performed in various asset management and acquisition roles at Equity Office Properties Trust, previously the nation's largest publicly traded office building owner and REIT. During his decade long tenure at Equity Office, Marc was involved in the underwriting and valuation analysis on corporate acquisitions with a total value in excess of $15 billion and conceived investment strategy for assets with an aggregate value over $2 billion.
He holds a Bachelor of Science in Business from the Kelley School of Business at Indiana University. Marc lives with his wife and two daughters in a north suburb of Chicago. He is a faithful Cubs fan who also enjoys travel, the beach, and history.
Marc TurnerDirector of Asset
Management
31Team BiosAppendix
Dave Welk, Managing Director of Acquisitions, is responsible for acquisitions in Atlanta, Charlotte and Raliegh. Dave has worked with the Origin team for over four years and was instrumental in the development of both Fund I and Fund II.
Prior to joining Origin Investments, Dave spent six years at RREEF as a member of the Acquisitions and Portfolio Management Groups. Dave received a BBA in Finance from the University of Iowa and a Master of Science in Real Estate (MSRE) from DePaul University’s Kellstadt Graduate School of Business.
Dave is married and has a one-year old son and lives in the Cotswold neighborhood of Charlotte. He enjoys poor attempts to play the game of golf, an occasional bird hunt, cooking, traveling, searching for the elusive "95 point" bottle of red wine under $20 and, above all else, spending time with family and friends.
Tom Briney, Vice President of Acquisitions-Southeast, joined Origin Investments in early 2011 and is responsible for sourcing office investments across the southeast region. Before his current role, he served as Vice President of Asset Management for Origin Investments, overseeing the firm's portfolio assets. Tom has worked with the Origin team for over four years and has nine years experience in the commercial real estate sector.
Prior to joining Origin Investments, he performed underwriting commercial real estate investments at Equity Office Properties. Before Equity Office Properties, Tom worked as a commercial credit analyst at JP Morgan Chase.
He received his Bachelor degree in Finance from The University of Connecticut. Recently, Tom relocated to Charlotte with his wife and child. He is a competitive cyclist and loves to travel.
Matt Ozee, Vice President of Acquisitions-Texas, is responsible for acquisitions across Austin, Dallas and Houston. He has over six years of experience sourcing, evaluating and executing investments on behalf of Dallas-area real estate firms.
Prior to joining Origin, Matt served as the Vice President of Acquisitions at Behringer Harvard. Earlier in his career, he was an Analyst for Goldman Sachs & Co. Matt holds a Bachelor of Science in Business Administration in Finance from the University of Arkansas. In 2014, he was selected as one of "Tomorrow’s Leaders: Texas’" on behalf of Real Estate Forum Magazine.
He holds an active Real Estate License in the State of Texas and is an active member of the Real Estate Council. Matt is married and he and his wife live in Dallas. He enjoys all things outdoors and the Arkansas Razorbacks.
Dave WelkManaging Director of
Acquisitions
Tom BrineyVP of Acquisitions
– Southeast
Matt OzeeVP of Acquisitions
– Texas
32Team BiosAppendix
Melissa Harris joined Origin Investments Partners in 2015 after more than six years as a business columnist at the Chicago Tribune. Prior to that, she was a reporter at the Baltimore Sun, where she covered criminal justice, and the Orlando Sentinel, where she covered local politics.
She has a bachelor's degree in journalism from Northwestern University and a master's degree in government from Johns Hopkins University and will graduate with her MBA from the University of Chicago's Booth School of Business in March 2016.
She serves on the board of Chicago Dramatists, a theater company for playwrights, and loves making travel recommendations. At the top of her list are the Faroe Islands and Verana, a Mexican hilltop resort only accessible by boat.
Melissa Harris VP of Marketing
Priya Venkataraman
Controller
Priya Venkataraman, CPA, is the controller at Origin Investments. She manages the accounting and financial operations of the company. She has worked with the Origin team for over 6 years, and during this period has managed the consolidations and reporting for the company.
Prior to joining Origin, Priya was responsible for the financial operations of a national real estate development company with a portfolio of assets totaling to over $200mm. Priya is a licensed CPA and a Certified Internal Auditor. She is also a Chartered Accountant, affiliated with the Institute of Chartered Accountants of India.
Priya is married and lives with her husband and son in Hinsdale. Travel, music, spending time with her family & friends, and tirelessly competing with her 6 year old in geography are some of the things she enjoys the most.
Nick Tann joined Origin late 2015 after spending two years as presentation editor for the Chicago Tribune's business innovation section, Blue Sky. Covering startup culture, entrepreneurship and tech-focused companies in the Chicagoland area quickly introduced him to the diverse technological landscape surrounding Origin's Chicago headquarters.
An Iowa native, Nick's design foundations were laid at Iowa State University, where he majored in graphic design. While in Iowa, he produced and co-hosted a podcast and led the web design team for an anime company for six years.
Nick's love for journalism evolved after joining the Baltimore Sun's interactive media team as the design and technology manager for the in 2012. In addition to data visualization, Nick's love of photography led him to design, build and report on The Sun's most successful blog to date, The Darkroom.
Nick Tann Creative Lead
33Team BiosAppendix
Kyle Verhasselt Associate
Benjamin Harris is a Capital Markets Associate who is responsible for raising investment capital and servicing the firm’s investor base. Mr. Harris joined Origin Investments in early 2015 as an Acquisitions Associate and underwrote $1.25 billion of office and multi-family assets.
Before joining Origin, he served as a Financial Analyst for Starwood Retail Partners, a division of Starwood Capital Group. Earlier in his career, Ben was a summer analyst at two of Chicago’s leading commercial real estate firms, MB Financial and Baum Realty Group.
He received a Bachelor of Business Administration with a major in Real Estate and Urban Land Economics from the University of Wisconsin-Madison. Ben lives in the River North neighborhood of Chicago. He regularly participates in local recreational sports leagues, is an avid traveler, and loves to see live music.
Benjamin HarrisCapital Markets Associate
Kyle Verhasselt is an Associate responsible for underwriting commercial real estate investments and conducting quarterly valuations for portfolio assets at Origin Investments.
Prior to Origin Investments, he completed the Risk Management Leadership Program at GE Capital. In this role, he was a part of GE Antares Capital where he managed a $460mm portfolio of distressed senior secured loans. Kyle began his career as an intern at GE Capital Real Estate where he completed valuation models for all assets.
He received a Bachelor of Business Administration with a major in Real Estate and Urban Land Economics from the University of Wisconsin, Madison. Kyle lives in the West Loop neighborhood of Chicago. Originally from the Wisconsin, he is an avid Green Bay Packers and Wisconsin Badgers fan.
Prior to joining Origin, Ashley was a Personal Assistant/Office Manager for Jessica Abernathy, who owns Professional Pet Sitters, Chicagoland Cat Sitters, and Chicago Canine Concierge. There she managed all client care, employee performance, and social media marketing. Before working as an office manager, Ashley worked as a manager at Nordstrom, where she specialized in employee sales development, client relationships, and merchandising.
Ashley received her degree in Apparel and Textile Merchandising from Eastern Michigan University. There she was active as a member of Delta Zeta Sorority and the Fashion Forum club. Originally from Ohio, Ashley currently lives in the Lincoln Park area of Chicago where she enjoys running, yoga, and rooting for the Ohio State Buckeyes.
Ashley FoghtAdministrative Assistant

34Contact Origin InvestmentsAppendix
CHICAGO350 N LaSalle, Suite 1000
Chicago, IL 60654 (312) 961-9800 | (800) 628-8008
Fax: (312) 337-7380
CHARLOTTE201 South Tryon St, Suite 950B
Charlotte, NC 28202 (800) 628-8008
DALLAS4514 Cole Avenue, Suite 600
Dallas, TX 75205 (800) 628-8008
o r i g i n i n v e s t m e n t s . c o m


![Origin and concept of relativity iii[1]](https://img.pdfslide.us/doc/110x75/568bdd601a28ab2034b59513/origin-and-concept-of-relativity-iii1.jpg)