Embed Size (px)
Citation preview

Table of
Contents
Key Statistics for March
Sales 2015 Residential Sales Stats Year-to-Year Total Sales by Map Area Median 2015 Median Sales Stats Year-to-Year Median Sales by Map Area Listings 2015 Active Listings by Map Area 2015 Total Active Listings vs. Total Sales Year-to-Year Active Listings by Map Area Inventory 2015 Months of Inventory by Map Area Year-to-Year Months of Inventory
Outlook for April
About Hady Chahine Contact Information

Key Statistics for March
Back to Table of Contents
= trending positive = trending positive
= trending negative = trending negative
Month-to-Month Comparison Feb 2015 Mar 2015 Delta (qty) Delta (%) Increase Decrease
Total Sales 41 81 40 97.6%
Median Sales Price 810,000 875,000 65,000 8.0%
Median Days to Sell 34 29 -5 -14.7%
Listings 112 119 7 6.3%
Sales/Listing Ratio 36.6% 68.1% 31.5% 86.1%
Months of Inventory 2.7 1.5 -1.2 -44.4%
Monthly Comparison Year-to-Year Mar 2014 Mar 2015 Delta Delta Increase Decrease
Total Sales 79 81 2 2.5%
Median Sales Price 760,000 875,000 115,000 15.1%
Median Days to Sell 37 29 -8 -21.6%
Listings 171 119 -52 -30.4%
Months of Inventory 1.9 1.5 -0.4 -21.1%

Back to Table of Contents
Total Sales Month-to-Month by Map Area Jan Feb Mar
N Redondo Beach/Villas North 13 5 18
S Redondo Beach W of PCH 6 4 10
N Redondo Beach/Villas South 6 16 24
S Redondo Beach S of Torrance Blvd 8 7 9
S Redondo Beach N of Torrance Blvd 6 5 9
N Redondo Beach/Golden Hills 6 3 6
N Redondo Beach/El Nido 1 1 5
Total Sales 46 41 81
0
10
20
30
40
50
60
70
80
90
Jan Feb Mar
2015 Total Sales Month-to-Month by Map Area
N Redondo Beach/Villas North
S Redondo Beach W of PCH
N Redondo Beach/Villas South
S Redondo Beach S of Torrance Blvd
S Redondo Beach N of Torrance Blvd
N Redondo Beach/Golden Hills
N Redondo Beach/El Nido
Total Sales

Back to Table of Contents
Total Sales Year-to-Year by Map Area 2013 2014 2015
N Redondo Beach/Villas North 11 19 18
S Redondo Beach W of PCH 8 7 10
N Redondo Beach/Villas South 14 20 24
S Redondo Beach S of Torrance Blvd 18 5 9
S Redondo Beach N of Torrance Blvd 10 12 9
N Redondo Beach/Golden Hills 4 12 6
N Redondo Beach/El Nido 5 4 5
Total Sales 70 79 81
0
10
20
30
40
50
60
70
80
90
2013 2014 2015
Total Sales Year-to-Year by Map Area: March
N Redondo Beach/Villas North
S Redondo Beach W of PCH
N Redondo Beach/Villas South
S Redondo Beach S of Torrance Blvd
S Redondo Beach N of Torrance Blvd
N Redondo Beach/Golden Hills
N Redondo Beach/El Nido
Total Sales

Back to Table of Contents
Median Sales Price Month-to-Month by Map Area Jan Feb Mar
N Redondo Beach/Villas North 799,900 825,000 863,150
S Redondo Beach W of PCH 698,750 505,750 870,000
N Redondo Beach/Villas South 680,000 755,000 755,750
S Redondo Beach S of Torrance Blvd 781,950 875,000 910,000
S Redondo Beach N of Torrance Blvd 942,500 779,000 1,008,200
N Redondo Beach/Golden Hills 981,500 926,500 952,500
N Redondo Beach/El Nido 575,000 599,000 899,900
Market Median Sales Price 815,000 810,000 875,000
-
200,000
400,000
600,000
800,000
1,000,000
1,200,000
Jan Feb Mar
2015 Median Sales Price Month-to-Month by Map Area
N Redondo Beach/Villas North
S Redondo Beach W of PCH
N Redondo Beach/Villas South
S Redondo Beach S of Torrance Blvd
S Redondo Beach N of Torrance Blvd
N Redondo Beach/Golden Hills
N Redondo Beach/El Nido
Market Median Sales Price

Back to Table of Contents
Median Sales Price Year-to-Year by Map Area 2013 2014 2015
N Redondo Beach/Villas North 648,299 710,000 863,150
S Redondo Beach W of PCH 787,500 1,009,000 870,000
N Redondo Beach/Villas South 549,250 735,400 755,750
S Redondo Beach S of Torrance Blvd 717,000 830,000 910,000
S Redondo Beach N of Torrance Blvd 719,500 830,000 1,008,200
N Redondo Beach/Golden Hills 872,000 862,000 952,500
N Redondo Beach/El Nido 580,000 742,500 899,900
Market Median Sales Price 648,150 760,000 875,000
-
200,000
400,000
600,000
800,000
1,000,000
1,200,000
2013 2014 2015
Median Sales Price Year-to-Year by Map Area: March
N Redondo Beach/Villas North
S Redondo Beach W of PCH
N Redondo Beach/Villas South
S Redondo Beach S of Torrance Blvd
S Redondo Beach N of Torrance Blvd
N Redondo Beach/Golden Hills
N Redondo Beach/El Nido
Market Median Sales Price

Back to Table of Contents
Active Listings vs. Total Sales by Map Area Jan Feb Mar Apr May Jun Jul Aug Sep Oct Nov Dec
N Redondo Beach/Villas North 18 24 25
S Redondo Beach W of PCH 13 16 17
N Redondo Beach/Villas South 31 28 26
S Redondo Beach S of Torrance Blvd 15 14 21
S Redondo Beach N of Torrance Blvd 12 14 13
N Redondo Beach/Golden Hills 2 5 7
N Redondo Beach/El Nido 6 11 10
Total Active Listings 97 112 119
-
5
10
15
20
25
30
35
Jan Feb Mar Apr May Jun Jul Aug Sep Oct Nov Dec
2015 Active Listings by Map Area
N Redondo Beach/Villas North
S Redondo Beach W of PCH
N Redondo Beach/Villas South
S Redondo Beach S of Torrance Blvd
S Redondo Beach N of Torrance Blvd
N Redondo Beach/Golden Hills
N Redondo Beach/El Nido

Back to Table of Contents
Active Listings vs. Total Sales by Map Area Jan Feb Mar Apr May Jun Jul Aug Sep Oct Nov Dec
N Redondo Beach/Villas North 18 24 25
S Redondo Beach W of PCH 13 16 17
N Redondo Beach/Villas South 31 28 26
S Redondo Beach S of Torrance Blvd 15 14 21
S Redondo Beach N of Torrance Blvd 12 14 13
N Redondo Beach/Golden Hills 2 5 7
N Redondo Beach/El Nido 6 11 10
Total Active Listings 97 112 119
Total Sales 46 41 81
Sales/Listings Ratio 47.4% 36.6% 68.1%
-
20
40
60
80
100
120
Jan Feb Mar Apr May Jun Jul Aug Sep Oct Nov Dec
2015 Total Active Listings vs. Total Sales
Total Active Listings
Total Sales

Back to Table of Contents
Active Listings Year-to-Year by Map Area 2013 2014 2015
N Redondo Beach/Villas North 20 36 25
S Redondo Beach W of PCH 26 41 17
N Redondo Beach/Villas South 21 29 26
S Redondo Beach S of Torrance Blvd 26 23 21
S Redondo Beach N of Torrance Blvd 20 17 13
N Redondo Beach/Golden Hills 13 10 7
N Redondo Beach/El Nido 10 15 10
Total Active Listings 136 171 119
0
20
40
60
80
100
120
140
160
180
2013 2014 2015
Active Listings Year-to-Year by Map Area: March
N Redondo Beach/Villas North
S Redondo Beach W of PCH
N Redondo Beach/Villas South
S Redondo Beach S of Torrance Blvd
S Redondo Beach N of Torrance Blvd
N Redondo Beach/Golden Hills
N Redondo Beach/El Nido
Total Active Listings

Back to Table of Contents
Months of Inventory by Map Area Jan Feb Mar Apr May Jun Jul Aug Sep Oct Nov Dec
N Redondo Beach/Villas North 1.4 4.8 1.4
S Redondo Beach W of PCH 2.2 4.0 1.7
N Redondo Beach/Villas South 5.2 1.8 1.1
S Redondo Beach S of Torrance Blvd 1.9 2.0 2.3
S Redondo Beach N of Torrance Blvd 2.0 2.8 1.4
N Redondo Beach/Golden Hills 0.3 1.7 1.2
N Redondo Beach/El Nido 6.0 11.0 2.0
-
2.0
4.0
6.0
8.0
10.0
12.0
Jan Feb Mar Apr May Jun Jul Aug Sep Oct Nov Dec
2015 Months of Inventory by Map Area
N Redondo Beach/Villas North
S Redondo Beach W of PCH
N Redondo Beach/Villas South
S Redondo Beach S of Torrance Blvd
S Redondo Beach N of Torrance Blvd
N Redondo Beach/Golden Hills
N Redondo Beach/El Nido

Back to Table of Contents
Months of Inventory Year-to-Year Jan Feb Mar Apr May Jun Jul Aug Sep Oct Nov Dec
2013 2.6 3.0 1.9 2.3 2.0 1.8 1.9 2.0 2.0 2.2 2.8 1.6
2014 2.6 3.2 1.9 2.0 2.5 2.1 2.0 2.3 2.2 1.8 2.1 1.2
2015 2.1 2.7 1.5
-
0.5
1.0
1.5
2.0
2.5
3.0
3.5
Jan Feb Mar Apr May Jun Jul Aug Sep Oct Nov Dec
2015 Months of Inventory Year-to-Year
2013
2014
2015
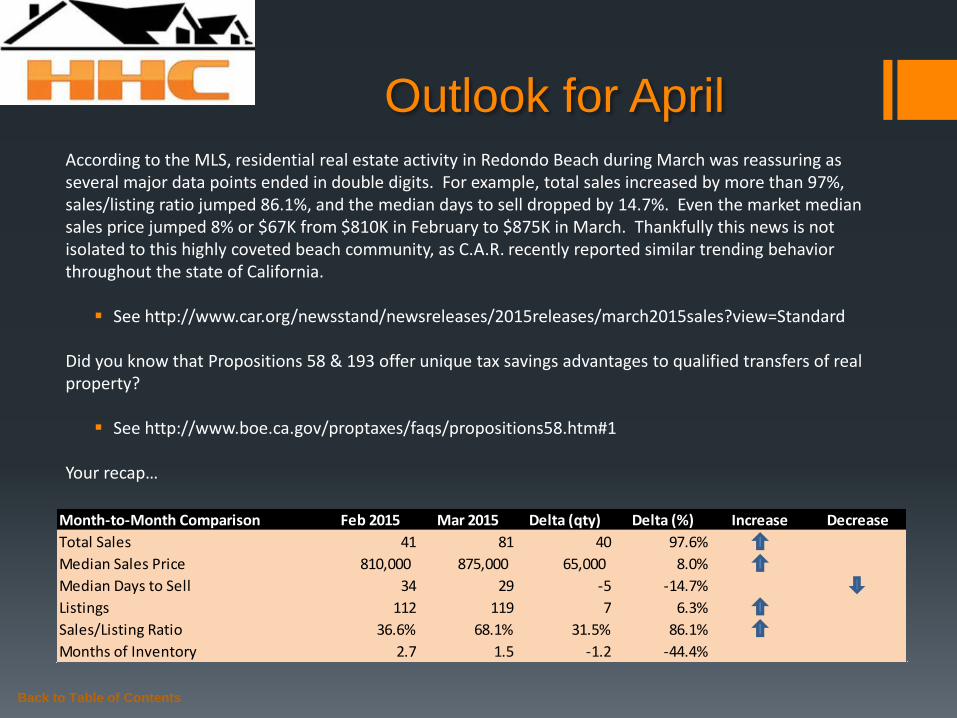
Outlook for April According to the MLS, residential real estate activity in Redondo Beach during March was reassuring as several major data points ended in double digits. For example, total sales increased by more than 97%, sales/listing ratio jumped 86.1%, and the median days to sell dropped by 14.7%. Even the market median sales price jumped 8% or $67K from $810K in February to $875K in March. Thankfully this news is not isolated to this highly coveted beach community, as C.A.R. recently reported similar trending behavior throughout the state of California.
See http://www.car.org/newsstand/newsreleases/2015releases/march2015sales?view=Standard
Did you know that Propositions 58 & 193 offer unique tax savings advantages to qualified transfers of real property?
See http://www.boe.ca.gov/proptaxes/faqs/propositions58.htm#1
Your recap…
Back to Table of Contents
Month-to-Month Comparison Feb 2015 Mar 2015 Delta (qty) Delta (%) Increase Decrease
Total Sales 41 81 40 97.6%
Median Sales Price 810,000 875,000 65,000 8.0%
Median Days to Sell 34 29 -5 -14.7%
Listings 112 119 7 6.3%
Sales/Listing Ratio 36.6% 68.1% 31.5% 86.1%
Months of Inventory 2.7 1.5 -1.2 -44.4%

Serving South Bay Home Buyers and Sellers Since 2001
RE/MAX Top 4 Team in California – 2012
RE/MAX 100% Club - 2011
Shorewood Realtors Top 5% in Overall Sales 2001-2006, 2008-2010
Back to Table of Contents
About
Hady Chahine…

The information being provided by CARETS (CLAW, CRISNet MLS, DAMLS, CRMLS, i-Tech MLS, and/or VCRDS) is for the visitor’s personal, non-commercial use and may not be used for
any purpose other than to identify prospective properties visitor may be interested in purchasing. Any information relating to a property referenced on this web site comes from the Internet
Data Exchange (IDX) program of CARETS. This web site may reference real estate listing(s) held by a brokerage firm other than the broker and/or agent who owns this web site. The accuracy
of all information, regardless of source, including but not limited to square footages and lot sizes, is deemed reliable but not guaranteed and should be personally verified through personal
inspection by and/or with the appropriate professionals.
Back to Table of Contents
Listings MLS BLOG Website