Embed Size (px)
Citation preview
Employment vs. unemployment rate: Grand Rapids
Industry employment stratification: Grand Rapids
Office employment trends (12-month change, 000s): Grand Rapids
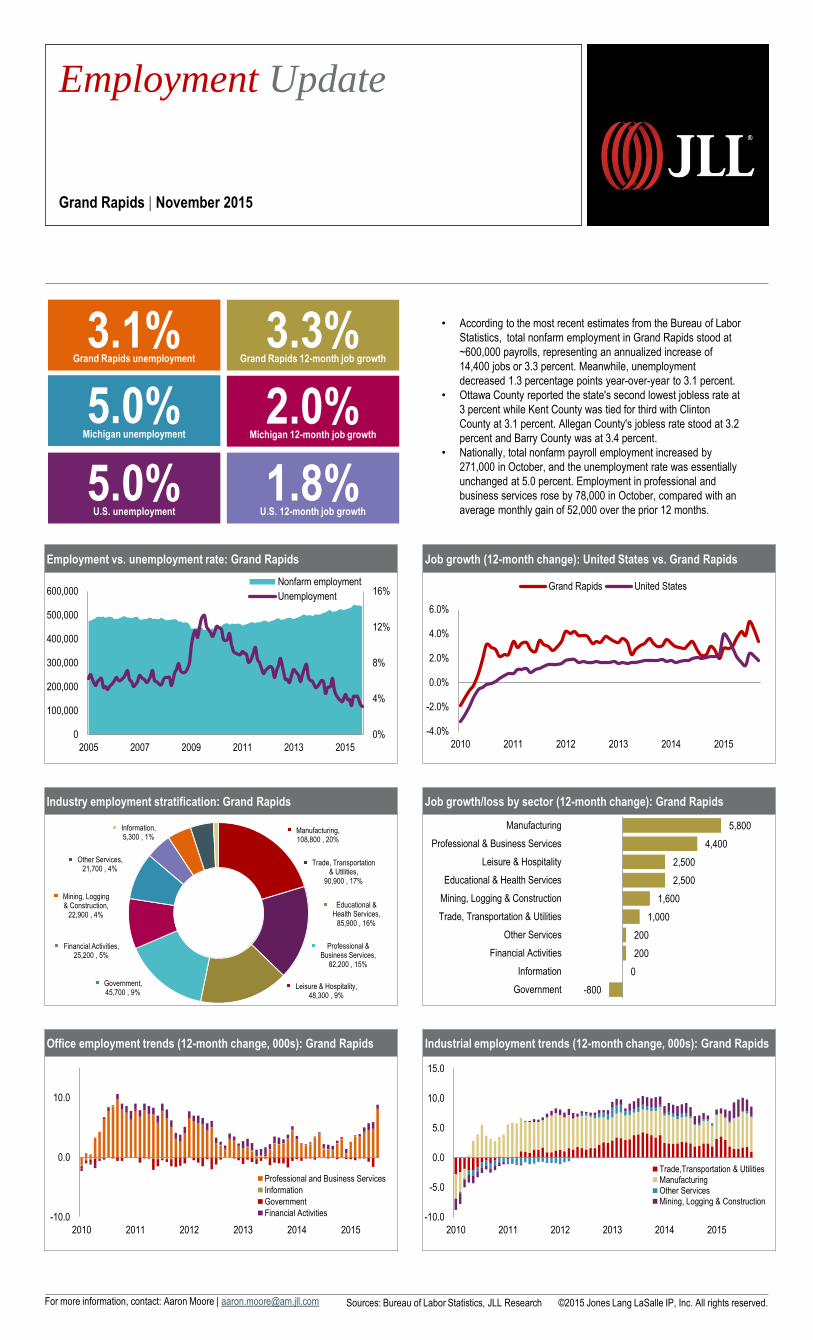
Manufacturing, 108,800 , 20%
Trade, Transportation & Utilities,
90,900 , 17%
Educational & Health Services,
85,900 , 16%
Professional & Business Services,
82,200 , 15%
Leisure & Hospitality, 48,300 , 9%
Government, 45,700 , 9%
Financial Activities, 25,200 , 5%
Mining, Logging & Construction,
22,900 , 4%
Other Services, 21,700 , 4%
Information, 5,300 , 1%
For more information, contact: Aaron Moore | [email protected] ©2015 Jones Lang LaSalle IP, Inc. All rights reserved. Sources: Bureau of Labor Statistics, JLL Research
Employment Update
Grand Rapids | November 2015
Job growth (12-month change): United States vs. Grand Rapids
Job growth/loss by sector (12-month change): Grand Rapids
Industrial employment trends (12-month change, 000s): Grand Rapids
5.0% U.S. unemployment
1.8% U.S. 12-month job growth
3.1% Grand Rapids unemployment
3.3% Grand Rapids 12-month job growth
5.0% Michigan unemployment
2.0% Michigan 12-month job growth
-800
0
200
200
1,000
1,600
2,500
2,500
4,400
5,800
-2,000 0 2,000 4,000 6,000
Government
Information
Financial Activities
Other Services
Trade, Transportation & Utilities
Mining, Logging & Construction
Educational & Health Services
Leisure & Hospitality
Professional & Business Services
Manufacturing
-10.0
-5.0
0.0
5.0
10.0
15.0
2010 2011 2012 2013 2014 2015
Trade,Transportation & UtilitiesManufacturingOther ServicesMining, Logging & Construction
-10.0
0.0
10.0
2010 2011 2012 2013 2014 2015
Professional and Business Services
Information
Government
Financial Activities
0%
4%
8%
12%
16%
0
100,000
200,000
300,000
400,000
500,000
600,000
2005 2007 2009 2011 2013 2015
Nonfarm employment
Unemployment
• According to the most recent estimates from the Bureau of Labor
Statistics, total nonfarm employment in Grand Rapids stood at
~600,000 payrolls, representing an annualized increase of
14,400 jobs or 3.3 percent. Meanwhile, unemployment
decreased 1.3 percentage points year-over-year to 3.1 percent.
• Ottawa County reported the state's second lowest jobless rate at
3 percent while Kent County was tied for third with Clinton
County at 3.1 percent. Allegan County's jobless rate stood at 3.2
percent and Barry County was at 3.4 percent.
• Nationally, total nonfarm payroll employment increased by
271,000 in October, and the unemployment rate was essentially
unchanged at 5.0 percent. Employment in professional and
business services rose by 78,000 in October, compared with an
average monthly gain of 52,000 over the prior 12 months.
-4.0%
-2.0%
0.0%
2.0%
4.0%
6.0%
2010 2011 2012 2013 2014 2015
Grand Rapids United States