Embed Size (px)
Citation preview

Table of
Contents
Key Statistics for January
Sales 2015 Residential Sales Stats Year-to-Year Total Sales by Map Area Median 2015 Median Sales Stats Year-to-Year Median Sales by Map Area Listings 2015 Active Listings by Map Area 2015 Total Active Listings vs. Total Sales Year-to-Year Active Listings by Map Area Inventory 2015 Months of Inventory by Map Area Year-to-Year Months of Inventory
Outlook for February
About Hady Chahine Contact Information

Key Statistics for January
Back to Table of Contents
= trending positive = trending positive
= trending negative = trending negative
Month-to-Month Comparison Jan 2015 Feb 2015 Delta (qty) Delta (%) Increase Decrease
Total Sales 21 TBD #VALUE! #VALUE!
Median Sales Price 1,635,000 TBD #VALUE! #VALUE!
Median Days to Sell 48 TBD #VALUE! #VALUE!
Listings 55 TBD #VALUE! #VALUE!
Sales/Listing Ratio 38.2% TBD #VALUE! #VALUE!
Months of Inventory 2.6 TBD #VALUE! #VALUE!
Monthly Comparison Year-to-Year Jan 2014 Jan 2015 Delta Delta Increase Decrease
Total Sales 15 21 6 40.0%
Median Sales Price 2,152,000 1,635,000 (517,000) -24.0%
Median Days to Sell 34 48 14 41.2%
Listings 57 55 -2 -3.5%
Months of Inventory 3.0 2.6 -0.4 -13.3%

Back to Table of Contents
Total Sales Month-to-Month by Map Area Jan Feb Mar
Manhattan Bch Sand 6
Manhattan Bch Tree 1
Manhattan Bch Hill 3
Manhattan Village 3
Manhattan Bch Heights/Lib Vlg 2
Manhattan Bch Mira Costa 6
Total Sales 21 0 0
0
5
10
15
20
25
Jan Feb Mar
2015 Total Sales Month-to-Month by Map Area
Manhattan Bch Sand
Manhattan Bch Tree
Manhattan Bch Hill
Manhattan Village
Manhattan Bch Heights/Lib Vlg
Manhattan Bch Mira Costa
Total Sales
Back to Table of Contents
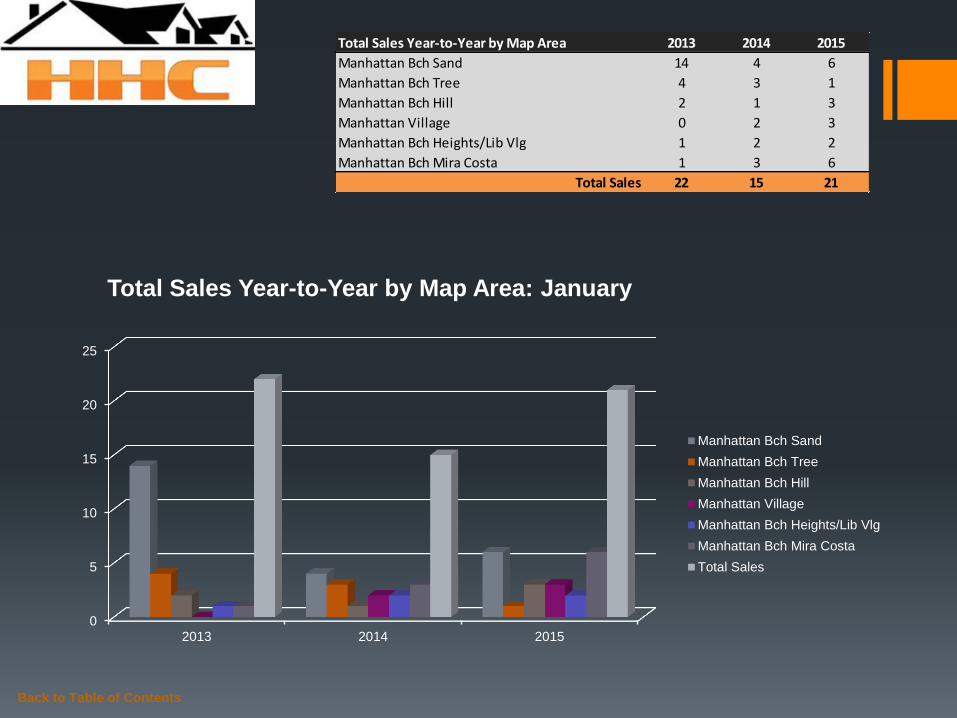
Total Sales Year-to-Year by Map Area 2013 2014 2015
Manhattan Bch Sand 14 4 6
Manhattan Bch Tree 4 3 1
Manhattan Bch Hill 2 1 3
Manhattan Village 0 2 3
Manhattan Bch Heights/Lib Vlg 1 2 2
Manhattan Bch Mira Costa 1 3 6
Total Sales 22 15 21
0
5
10
15
20
25
2013 2014 2015
Total Sales Year-to-Year by Map Area: January
Manhattan Bch Sand
Manhattan Bch Tree
Manhattan Bch Hill
Manhattan Village
Manhattan Bch Heights/Lib Vlg
Manhattan Bch Mira Costa
Total Sales
Back to Table of Contents
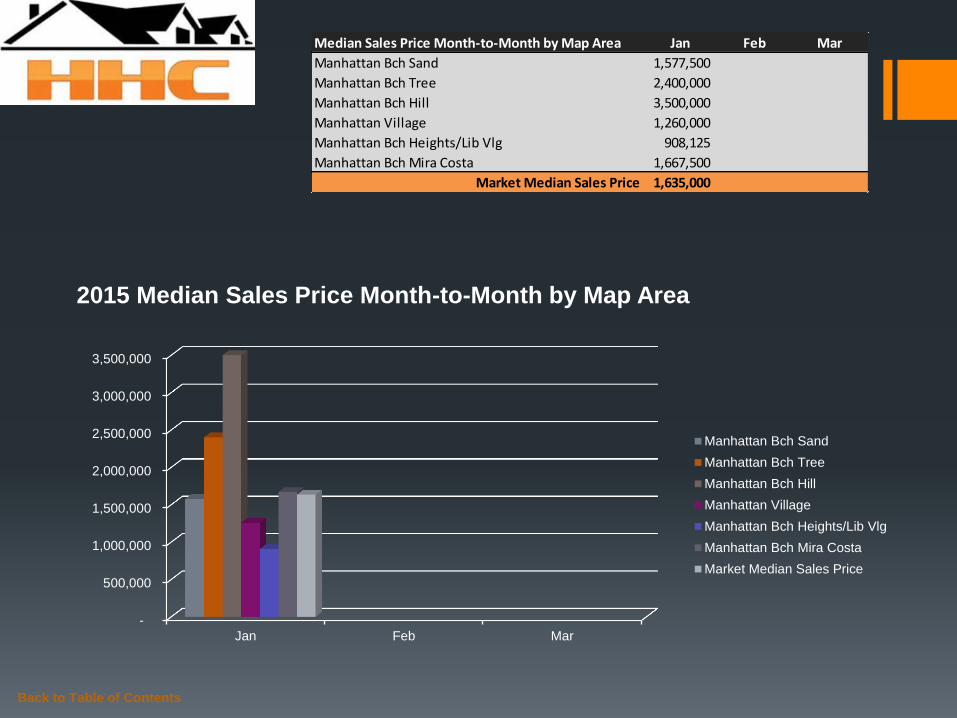
Median Sales Price Month-to-Month by Map Area Jan Feb Mar
Manhattan Bch Sand 1,577,500
Manhattan Bch Tree 2,400,000
Manhattan Bch Hill 3,500,000
Manhattan Village 1,260,000
Manhattan Bch Heights/Lib Vlg 908,125
Manhattan Bch Mira Costa 1,667,500
Market Median Sales Price 1,635,000
-
500,000
1,000,000
1,500,000
2,000,000
2,500,000
3,000,000
3,500,000
Jan Feb Mar
2015 Median Sales Price Month-to-Month by Map Area
Manhattan Bch Sand
Manhattan Bch Tree
Manhattan Bch Hill
Manhattan Village
Manhattan Bch Heights/Lib Vlg
Manhattan Bch Mira Costa
Market Median Sales Price

Back to Table of Contents
Median Sales Price Year-to-Year by Map Area 2013 2014 2015
Manhattan Bch Sand 1,800,000 3,075,000 1,577,500
Manhattan Bch Tree 1,199,750 2,135,000 2,400,000
Manhattan Bch Hill 1,029,750 2,300,000 3,500,000
Manhattan Village - 918,750 1,260,000
Manhattan Bch Heights/Lib Vlg 1,385,000 1,820,000 908,125
Manhattan Bch Mira Costa 1,852,222 1,900,000 1,667,500
Market Median Sales Price 1,456,500 2,152,000 1,635,000
-
500,000
1,000,000
1,500,000
2,000,000
2,500,000
3,000,000
3,500,000
2013 2014 2015
Median Sales Price Year-to-Year by Map Area: January
Manhattan Bch Sand
Manhattan Bch Tree
Manhattan Bch Hill
Manhattan Village
Manhattan Bch Heights/Lib Vlg
Manhattan Bch Mira Costa
Market Median Sales Price

Back to Table of Contents
Active Listings vs. Total Sales by Map Area Jan Feb Mar Apr May Jun Jul Aug Sep Oct Nov Dec
Manhattan Bch Sand 14
Manhattan Bch Tree 16
Manhattan Bch Hill 2
Manhattan Village 6
Manhattan Bch Heights/Lib Vlg 4
Manhattan Bch Mira Costa 13
Total Active Listings 55
-
2
4
6
8
10
12
14
16
Jan Feb Mar Apr May Jun Jul Aug Sep Oct Nov Dec
2015 Active Listings by Map Area
Manhattan Bch Sand
Manhattan Bch Tree
Manhattan Bch Hill
Manhattan Village
Manhattan Bch Heights/Lib Vlg
Manhattan Bch Mira Costa

Back to Table of Contents
Active Listings vs. Total Sales by Map Area Jan Feb Mar Apr May Jun Jul Aug Sep Oct Nov Dec
Manhattan Bch Sand 14
Manhattan Bch Tree 16
Manhattan Bch Hill 2
Manhattan Village 6
Manhattan Bch Heights/Lib Vlg 4
Manhattan Bch Mira Costa 13
Total Active Listings 55
Total Sales 21
Sales/Listings Ratio 38.2%
-
10
20
30
40
50
60
Jan Feb Mar Apr May Jun Jul Aug Sep Oct Nov Dec
2015 Total Active Listings vs. Total Sales
Total Active Listings
Total Sales

Back to Table of Contents
Active Listings Year-to-Year by Map Area 2013 2014 2015
Manhattan Bch Sand 28 20 14
Manhattan Bch Tree 9 12 16
Manhattan Bch Hill 4 6 2
Manhattan Village 3 1 6
Manhattan Bch Heights/Lib Vlg 3 7 4
Manhattan Bch Mira Costa 17 11 13
Total Active Listings 64 57 55
0
10
20
30
40
50
60
70
2013 2014 2015
Active Listings Year-to-Year by Map Area: January
Manhattan Bch Sand
Manhattan Bch Tree
Manhattan Bch Hill
Manhattan Village
Manhattan Bch Heights/Lib Vlg
Manhattan Bch Mira Costa
Total Active Listings

Back to Table of Contents
Months of Inventory by Map Area Jan Feb Mar Apr May Jun Jul Aug Sep Oct Nov Dec
Manhattan Bch Sand 2.3
Manhattan Bch Tree 16.0
Manhattan Bch Hill 0.7
Manhattan Village 2.0
Manhattan Bch Heights/Lib Vlg 2.0
Manhattan Bch Mira Costa 2.2
-
2.0
4.0
6.0
8.0
10.0
12.0
14.0
16.0
Jan Feb Mar Apr May Jun Jul Aug Sep Oct Nov Dec
2015 Months of Inventory by Map Area
Manhattan Bch Sand
Manhattan Bch Tree
Manhattan Bch Hill
Manhattan Village
Manhattan Bch Heights/Lib Vlg
Manhattan Bch Mira Costa

Back to Table of Contents
Months of Inventory Year-to-Year Jan Feb Mar Apr May Jun Jul Aug Sep Oct Nov Dec
2013 2.9 3.4 2.0 1.7 1.8 2.5 2.1 2.0 2.2 2.0 1.5 0.8
2014 3.0 2.2 2.2 2.0 2.0 2.0 2.2 2.0 2.8 1.9 1.5 1.1
2015 2.6
-
0.5
1.0
1.5
2.0
2.5
3.0
3.5
Jan Feb Mar Apr May Jun Jul Aug Sep Oct Nov Dec
Months of Inventory Year-to-Year
2013
2014
2015

Outlook for February
The Manhattan Beach real estate market celebrated the beginning of 2015 with 21 closed escrows, 55
new listings, a sales/listing ratio of 38.2%, and a median market sales price of $1.635 million. – Don’t
you just love MB, I know I do!
Looking ahead to February I expect market activity to increase as buyers scramble to lock in historically
low mortgage rates while they last. For those of you in need of representation, please call me today and
let’s get you pre-approved to begin making offers to purchase right away.
Potential sellers, are you listening? Now is the time to act and get your property prepared to sell. Need
help? Don’t know what your property is worth? Not sure what optimal marketing strategy to adopt? No
problem, I can definitely help. Please give me a call today to schedule a meeting ASAP!
Your recap…
Back to Table of Contents
Month-to-Month Comparison Jan 2015 Feb 2015 Delta (qty) Delta (%) Increase Decrease
Total Sales 21 TBD #VALUE! #VALUE!
Median Sales Price 1,635,000 TBD #VALUE! #VALUE!
Median Days to Sell 48 TBD #VALUE! #VALUE!
Listings 55 TBD #VALUE! #VALUE!
Sales/Listing Ratio 38.2% TBD #VALUE! #VALUE!
Months of Inventory 2.6 TBD #VALUE! #VALUE!

Serving South Bay Home Buyers and Sellers Since 2001
RE/MAX Top 4 Team in California – 2012
RE/MAX 100% Club - 2011
Shorewood Realtors Top 5% in Overall Sales 2001-2006, 2008-2010
Back to Table of Contents
About
Hady Chahine…

The information being provided by CARETS (CLAW, CRISNet MLS, DAMLS, CRMLS, i-Tech MLS, and/or VCRDS) is for the visitor’s personal, non-commercial use and may not be used for
any purpose other than to identify prospective properties visitor may be interested in purchasing. Any information relating to a property referenced on this web site comes from the Internet
Data Exchange (IDX) program of CARETS. This web site may reference real estate listing(s) held by a brokerage firm other than the broker and/or agent who owns this web site. The accuracy
of all information, regardless of source, including but not limited to square footages and lot sizes, is deemed reliable but not guaranteed and should be personally verified through personal
inspection by and/or with the appropriate professionals.
Back to Table of Contents
Listings MLS BLOG Website