Embed Size (px)
Citation preview

Accelerating successwww.colliers.com/vietnam
HO CHI MINH QUARTERLY KNOWLEDGE REPORTQ4 2016

TABLE OF CONTENTS
ECONOMIC OVERVIEW...............................................................................................................
VIETNAM ....................................................................................................................................
HO CHI MINH CITY ......................................................................................................................
HA NOI ........................................................................................................................................
HO CHI MINH CITY MARKET OVERVIEW ........................................................................ OFFICE ........................................................................................................................................
RETAIL ........................................................................................................................................
CONDOMINIUM ............................................................................................................................
VILLA & TOWNHOUSE .................................................................................................................
SERVICED APARTMENT ..............................................................................................................
INDUSTRIAL ................................................................................................................................
LIST OF ABBREVIATIONSARR: Average Rental Rate CBD: Central Business District
CPI: Consumer Price Index GDP: Gross Domestic Product
GFA: Gross Floor Area GRDP: Gross Regional Domestic Product
LUR: Land Use Right IP: Industrial Park
NLA: Net Lettable Area Q-o-Q: Quarter on Quarter
TPP: Trans-Pacific Partnership Y-o-Y: Year on Year
Cover Page: Saigon Skyline
4-5
4
5
5
6-18
6
9
11
13
15
17
Page

LIST OF FIGURES Figure 1: Vietnam Exports - Imports in 2016.......................................................................................
Figure 2: International Arrivals to Vietnam in 2016 ............................................................................
Figure 3: FDI Capital of HCMC and Hanoi ..........................................................................................
Figure 4: GDP Growth Rate of HCMC and Hanoi ................................................................................
HO CHI MINH CITY MARKET OVERVIEW Figure 5: Office, Average Asking Rent ................................................................................................
Figure 6: Office, Occupancy Rate .......................................................................................................
Figure 7: Retail, Market Performance by Year .....................................................................................
Figure 8: Retail, Total Supply by Year .................................................................................................
Figure 9: Condominium, Primary Asking Price ...................................................................................
Figure 10: Condominium, New Launches by Year ...............................................................................
Figure 11: Condominium, Sold Units by Segment and Year ..................................................................
Figure 12: Villa and Townhouse, Selling Prices by Quarter..................................................................
Figure 13: Villa and Townhouse, Supply by Year .................................................................................
Figure 14: Villa and Townhouse, Primary Stock by District .................................................................
Figure 15: Serviced Apartment, Occupancy Rate ...............................................................................
Figure 16: Serviced Apartment, Average Asking Rent by Grade ...........................................................
Figure 17: Industrial, Market Performance by District .........................................................................
Figure 18: Industrial, Supply by District ..............................................................................................
LIST OF TABLES Table 1: Macroeconomic Indicators of HCMC and Hanoi ......................................................................
Table 2: Office, Future Supply ............................................................................................................
Table 3: Significant Office Projects ....................................................................................................
Table 4: Retail, Significant Future Projects under Construction ..........................................................
Table 5: Significant Retail Projects ....................................................................................................
Table 6: Condominium, Significant new Projects launched in Q4 2016 ................................................
Table 7: Villa and Townhouse, Significant new Projects launched in Q4 2016 ......................................
Table 8: Serviced Apartment, Significant Future Projects under construction .....................................
Table 9: Significant Serviced Apartment Projects ...............................................................................
Table 10: Industrial, Future Supply .....................................................................................................
Table 11: Industrial, Market Overview ................................................................................................
4
4
5
5
6
6
9
9
11
11
11
13
13
14
15
15
17
17
5
6
7
9
10
12
14
15
16
17
18
Page

GDPVietnam’s GDP was estimated to grow by 6.2% in 2016, driven mostly by industrial expansion and growth in construction and services. This year recorded a decrease in the country’s economic growth rate compared to the growth of 6.68% in 2015. The service sector grew by 7.57% y-o-y while the industrial and construction increased by 6.98% y-o-y. The whole year witnessed a big slowdown in agriculture-forestry-fishing with a modest growth rate of 1.36% y-o-y mainly due to natural disasters. Although 2016’s GDP was below the 6.7% target set by the National Assembly, the country remained one of the strongest performers in the region. We expect next year’s GDP to remain on a positive trajectory with our full year forecast standing at 6.5% on the back of increasing global integration and local production recovery.
CPIThe last month of 2016 saw a slight increase of 0.73% m-o-m in CPI index, despite purchasing needs at the year end. For the whole year, average CPI rose by 2.7% y-o-y. Six out of eleven major goods and service groups saw price rises with the highest growth recorded in medicine and healthcare services, at 5.3%. Main reasons for the CPI hike in 2016 were determined to be the government’s upward price adjustment of healthcare services and natural disasters’ effects on crops.With the target CPI of 4% set by National Assembly, price adjustment methods should be implemented for key commodity groups such as healthcare services, electricity and water, as well as a close supervision process should be kept on the world oil price to prevent the domestic price from shooting up.
FDIAs of the end of 2016, the country attracted 2,556 new foreign investment projects with total investment of both newly registered and supplementary capital reaching USD24.37 billion, representing an increase of 7.1% y-o-y in capital. Of the total, there are 1,225 already-operating projects raising their capital by more than USD5.7 billion. Investment in real estate accounted for 10.1%, which is equivalent to USD1.52 billion. South Korea was the largest foreign investor with USD5.5 billion, accounting for 36.6% of total capital, followed by Singapore and China with USD1.59 billion and USD1.26 billion, respectively.
RETAIL SALES Vietnam’s retail sales of goods and services reached USD156 billion, up 10.2% y-o-y. If the price factor was excluded, the growth rate would be 7.8% y-o-y, lower than the increase of 8.5% y-o-y in 2015. By sector, retail sales of goods achieved USD118.4 billion, accounting for 75.9% of total sales, up 10.2% y-o-y. Retail sales of accommodation and catering services reached USD18.3 billion, accounting for 11.3% of total sales, representing an increase of 10.7% y-o-y. Retail sales of tourism services, comprising 1% of total sales, reached USD 1.5 billion, up 12% y-o-y. Retail sales of other services, accounting for 11.4% of total sales, were estimated at USD17.8 billion, equivalent to 9.3% increase y-o-y.
INTERNATIONAL ARRIVALS In 2016, Vietnam welcomed 10.01 million international visitors, equivalent to a significant increase of 26% y-o-y. Thanks to visa exemption policy for citizens from five European countries and various tourism marketing strategies, this is the first time the country attracted such a high number of international tourists, a twofold increase compared to the number of 2010. Asian visitors took the lead with more than 7.2 million arrivals, mainly from traditional markets such as China, South Korea and Japan, comprising 72.5% of total visitors, followed by European visitors with 1.6 million arrivals and American tourists with 0.7 million arrivals, respectively.
TRADE BALANCEIn 2016, Vietnam earned roughly USD175.9 billion from exports, reporting an increase of 8.6% y-o-y. Import turnovers reached USD173.3 billion, up 4.6% against the previous year. As a result, the whole country registered a USD2.6 billion trade surplus. Of the total, the domestic economic sector reported a trade deficit of USD21.02 billion with USD50 billion in exports and USD71.1 billion in imports. On the contrary, the FDI sector enjoyed a trade surplus of USD23.7 with export revenues of USD125.9 and import revenues of USD102.1. While the United States took the lead in export revenues with USD38.1 billion, China remained the country’s largest import market with USD49.8 billion. By product, phones and phone parts, electronic goods, textile and garments, computers, machinery and equipment are the major foreign currency earners.
Q4 2016 | ECONOMIC OVERVIEW
©2017 Colliers International Research
VIETNAM QUARTERLY KNOWLEDGE REPORT
Page 4
2017 forecast
Figure 1: Exports - Imports in Vietnam in 2016
Source: General Statistics Office | Colliers International Research
Figure 2: International arrivals to Vietnam in 2016
Source: General Statistics Office | Colliers International Research
VIETNAM
-50
0
50
100
150
200
20052006200720082009 2010 2011 2012 2013 2014 2015 2016
USD
billio
n
Exports Imports Trade Balance
2,000
3,000
4,000
5,000
6,000
7,000
8,000
9,000
10,000
11,000
200520062007200820092010 2011 2012 2013 2014 2015 2016
thou
sand
arr
ival
s
International tourist arrivals Average

Q4 2016 | ECONOMIC OVERVIEW
VIETNAM QUARTERLY KNOWLEDGE REPORT
2017 forecast
Q4 2016 | ECONOMIC OVERVIEW
©2017 Colliers International Research
VIETNAM QUARTERLY KNOWLEDGE REPORT
Page 5
Figure 4: GDP Growth Rate of HCMC and Hanoi
Source: General Statistics Office | Colliers International Research
Source: General Statistics Office | Colliers International Research
Table 1: Marcoeconomic Indicators of HCMC and Hanoi
HCMC Hanoi
2016 2017 2016 2017
GDP (billion) 45.3 21.2
FDI (million) 1443.8 2800
Retail sales (billion) 30.1 22.3
Export (billion) 31.8 24.8
Import (billion) 37.9 14.2
HO CHI MINH CITY
In 2016, GRDP of Ho Chi Minh City achieved USD45.29 billion with the growth rate of 8.05% y-o-y. In particular, the service sector was the dominant contributor with USD24.8 billion, comprising 54.8% of the city’s economy, followed by the industrial & construction sector and the agriculture-forestry-fishery sector, accounting for 0.84% and 28.76% respectively. Of the whole year, total newly registered and supplementary FDI achieved USD1.44 billion in which there were 177 supplementary projects, worth of USD529.2 million. Investment in real estate took the lead with 24 projects and USD357.4 million, accounting for 39.1% of total inflows. Cayman Islands was recorded as the biggest foreign investor in the city, with USD270.5 million in registered capital, accounting for 29.6%, followed by Japan (USD190.2 million) and Singapore (USD110.9 million).Retail sales achieved USD30.1 billion, up 9.1% y-o-y. Highest growth rates were seen in products which help to improve the quality of life and traveling demand such as motor vehicles, household appliances, building materials and gasoline.The city’s export values reached USD31.8 billion, up 5.2% y-o-y. Garments, agricultural products and computers & electronic devices contributed the most to export values. The United States was the largest export market with nearly USD5.4 billion, up 5% y-o-y. Import values increased by 12.4% y-o-y, worth of USD37.85 billion, resulting in the city’s trade deficit of USD6 billion. The top segments of import values were milk and dairy products, fuel, garment material, plastics and iron & steel.
HANOI
In 2016, Hanoi’s GRDP achieved USD21.18 billion with the growth rate of 8.2%. The industrial-construction sector and the service sector had the highest growth rates, up 9% and 8.3% y-o-y respectively, while the agriculture-forestry-fishery sector saw a modest growth rate of 2.21% y-o-y. Of the whole year, the capital city’s CPI increased 2.66% y-o-y. Out of 11 sectors in the CPI basket, food and transportation witnessed a slight fall in price. As of the end of 2016, FDI inflows of both newly registered and supplementary capital reached USD2.8 billion, up 46.4% in number of projects and 164% in capital compared to the same period last year. Disbursed capital was USD1.2 billion.Retail sales of the capital city were up 8.8% compared to last year, reaching USD22.3 billion.In 2016, the city achieved USD10.61 billion in export revenues and USD24.83 billion in import revenues, causing a trade deficit of USD14.22 billion in the whole year. The capital city welcomed 2.8 million international visitors in 2016, equivalent to an increment of 19.9% y-o-y.
Figure 3: FDI Capital of HCMC and Hanoi
Source: General Statistics Office | Colliers International Research
6%
8%
10%
12%
14%
2005 2006 2007 2008 2009 2010 2011 2012 2013 2014 2015 2016
HCMC Hanoi
0
500
1,000
1,500
2,000
2,500
3,000
3,500
4,000
2012 2013 2014 2015 2016
US
D m
illio
nHCMC Hanoi

Figure 6: Office, Occupancy Rate
PERFORMANCEQ4 2016 witnessed an increase of 3.1% q-o-q in the average asking rent across all grades, recording at USD32.5/sqm/month. The market remained tight with average occupancy rate of 95.9%, marginally down 0.45ppts q-o-q but up slightly 0.4 ppts y-o-y. By segment, average rent for Grade A space was up 1.7% q-o-q, staying at USD41.1/sqm/month whilst Grade B’s rental rates were up 5.7% q-o-q, at USD23.8/sqm/month. On a yearly basis, both Grade A and Grade B experienced significant rent growth of 14.2% and 13.6% respectively due to high demand and limited prime office space in 2016. While Grade A’s occupancy rate was slightly down 1ppt q-o-q but up 1ppt y-o-y to 95%, Grade B’s occupancy stayed unchanged at 97% compared to both the previous quarter and the same period last year.
SUPPLYThe last quarter of 2016 welcomed 33,840sqm NLA from the opening of Mapletree Business Centre and Ha Do Building, recording an increase of 12.8% in the newly launched stock compared to the same quarter last year. Currently, the city has a total of 11 Grade A buildings and 63 Grade B buildings, covering approximately 212,651sqm and 896,624sqm of net leasable space to the market respectively. By location, all Grade A and nearly 50% of Grade B are concentrated in the Central Business District (CBD). Clusters of Grade B buildings are also located in District 3, Tan Binh District and Phu My Hung New Urban Area in District 7.
DEMANDTertiary industry is one of the key drivers of demand for office space as service sector businesses tend to be more labor intensive and less capital intensive. Indeed, by looking more closely at components of the city GDP over the past 6 years (2011- 2016), we find that there is a strong relationship between the service industry’s contribution to the city’s economy and the average occupancy rate with relative high correlation coefficient of 0.7. With HCMC government’s plans to develop a service-led economy, targeting to increase the service sector by 10.17%-11% in the period of 2016-2020, the relationship between the service sector’s expansion and the demand for office space is more likely to continue in the coming years.
OUTLOOKGiven the current construction status, it is expected that there will be 62,300sqm of new Grade A and 124,392sqm of new Grade B office space coming on line in 2017. Up to 71,122sqm of such space will be located outside the CBD while 115,570sqm will be located within the CBD. Mature buildings in prime locations are forecasted to maintain good performance as the amount of new office space in the pipeline is limited and demand for high-quality office space in good locations continues. In contrast, office buildings in decentralized districts will face more pressure as the ample supply, raising concerns of falling rents and increased incentives. Furthermore, Novaland’s purchase of Continental Tower and the transfer of ownership for Metropolitan building are expected to put further pressure on the city’s market in the coming years.
Q4 2016 | HO CHI MINH CITY | OFFICE
©2017 Colliers International Research
VIETNAM QUARTERLY KNOWLEDGE REPORT
Page 6
Table 2: Office, Future Supply
Source: Colliers International Research
Source: Colliers International Research
Source: Colliers International Research
Figure 5: Office, Average Asking Rent
Project name Grade NLA (sqm) Expected Completion
Viettel Complex B 26,320 Q1 2017
Waterfront Saigon B 8,822 Q1 2017
Deutsches Haus A 22,300 Q3 2017
Saigon Center phase 2 A 40,000 Q3 2017
Thaco-Sala Residence B 78,000 Q3 2017
The Khai B 11,250 Q4 2017
0
10
20
30
40
50
60
70
Q1 Q2 Q3 Q4 Q1 Q2 Q3 Q4 Q1 Q2 Q3 Q4 Q1 Q2 Q3 Q4 Q1 Q2 Q3 Q4 Q1 Q2 Q3 Q4
2011 2012 2013 2014 2015 2016
US
$/sq
m/m
onth
Grade A Grade B
50
60
70
80
90
100
Q1 Q2 Q3 Q4 Q1 Q2 Q3 Q4 Q1 Q2 Q3 Q4 Q1 Q2 Q3 Q4 Q1 Q2 Q3 Q4 Q1 Q2 Q3 Q4
2011 2012 2013 2014 2015 2016
Grade A Grade B
%

Q4 2016 | HO CHI MINH CITY | OFFICE Q4 2016 | HO CHI MINH CITY | OFFICE
©2017 Colliers International Research
VIETNAM QUARTERLY KNOWLEDGE REPORT
Page 7
(*) US$/sqm/month (NLA)
Table 3: Significant Office Projects
No Name Address Completion Year
NLA (sqm)
Service Charges (*)
Occupancy rate
Average asking rent
(**)1 Saigon Centre 65 Le Loi 1996 11,650 7.5 99% 42.0
2 Saigon Tower 29 Le Duan 1997 13,950 7.5 99% 44.03 Sunwah Tower 115 Nguyen Hue 1997 20,800 6.0 99% 40.04 The Metropolitan 235 Dong Khoi 1997 15,200 6.0 82% 45.05 Diamond Plaza 34 Le Duan 1999 15,936 8.0 94% 41.06 Kumho Asiana Plaza 39 Le Duan 2009 26,000 8.0 84% 42.5
7 Bitexco Financial Tower 45 Ngo Duc Ke 2010 37,710 8.0 96% 44.58 President Place 93 Nguyen Du 2012 8,330 7.0 95% 39.0
9 Times Square 22-36 Nguyen Hue 2012 12,704 7.0 97% 40.010 Le Meridien 3C Ton Duc Thang 2013 9,125 6.0 95% 35.011 Vietcombank Tower 5 Me Linh Square 2015 41,250 7.0 99% 37.0
Grade A 212,655 7.2 95% 41.1
1 VTP-OSIC 8 Nguyen Hue 1993 6,500 6.0 100% 25.02 Yo Co Building 41 Nguyen Thi Minh Khai 1995 5,000 3.0 98% 23.03 Somerset Chancellor Court 21-23 NguyenThi Minh Khai 1996 3,200 5.0 100% 22.0
4 Central Plaza 17 Le Duan 1997 7,405 6.0 100% 27.0
5 Harbour View Tower 35 Nguyen Hue 1997 8,000 6.7 91% 20.06 Saigon Riverside Office 2A-4A Ton Duc Thang 1997 10,000 5.0 99% 28.07 Saigon Trade Center 37 Ton Duc Thang 1997 31,416 6.5 99% 27.6
8 MeLinh Point Tower 2 Ngo Duc Ke 1999 17,600 6.0 97% 36.09 Zen Plaza 54-56 Nguyen Trai 2001 11,037 5.0 95% 24.810 The Landmark 5B Ton Duc Thang 2005 8,000 7.9 98% 28.911 Opera View 161-167 Dong Khoi 2006 3,100 7.0 100% 27.012 City Light 45 Vo Thi Sau 2007 10,000 5.0 100% 19.013 Petro Tower 1-5 Le Duan 2007 13,304 6.5 95% 50.014 The Lancaster 22 – 22 Bis Le Thanh Ton 2007 7,000 6.7 90% 25.015 CJ Building 5 Le Thanh Ton 2008 14,000 8.7 99% 25.016 Continential Tower 81-85 Ham Nghi 2008 15,000 6.0 99% 22.017 Havana Tower 132 Ham Nghi 2008 7,326 8.0 79% 29.3
18 Royal Center 235 Nguyen Van Cu 2008 14,320 6.0 100% 23.019 Sailing Tower 51 Nguyen Thi Minh Khai 2008 16,910 6.0 96% 27.0
20 TMS 172 Hai Ba Trung 2009 4,000 4.0 100% 24.021 A&B Tower 76 Le Lai 2010 17,120 6.0 97% 32.022 Bao Viet Tower 233 Dong Khoi 2010 10,650 5.0 98% 28.023 Green Power Tower 35 Ton Duc Thang 2010 15,600 6.0 97% 27.024 Maritime Bank Tower 192 Nguyen Cong Tru 2010 19,596 5.0 95% 21.025 Saigon Royal 91 Pasteur 2010 5,340 6.0 100% 23.026 Vincom Center 68 -70 -72 Le Thanh Ton 2010 56,600 5.0 95% 32.027 Empress Tower 138 Hai Ba Trung 2012 19,538 6.0 100% 27.028 Lim Tower 9-11 Ton Duc Thang 2013 22,000 6.0 99% 28.029 MB Sunny Tower 259 Tran Hung Dao, Co Giang 2013 13,200 5.5 100% 22.030 Lim Tower 2 Vo Van Tan 2015 8,400 5.5 100% 24.0
Grade B 401,162 5.9 97% 27.8
Q4 2016 | HO CHI MINH CITY | OFFICE
©2017 Colliers International Research
VIETNAM QUARTERLY KNOWLEDGE REPORT
Page 8
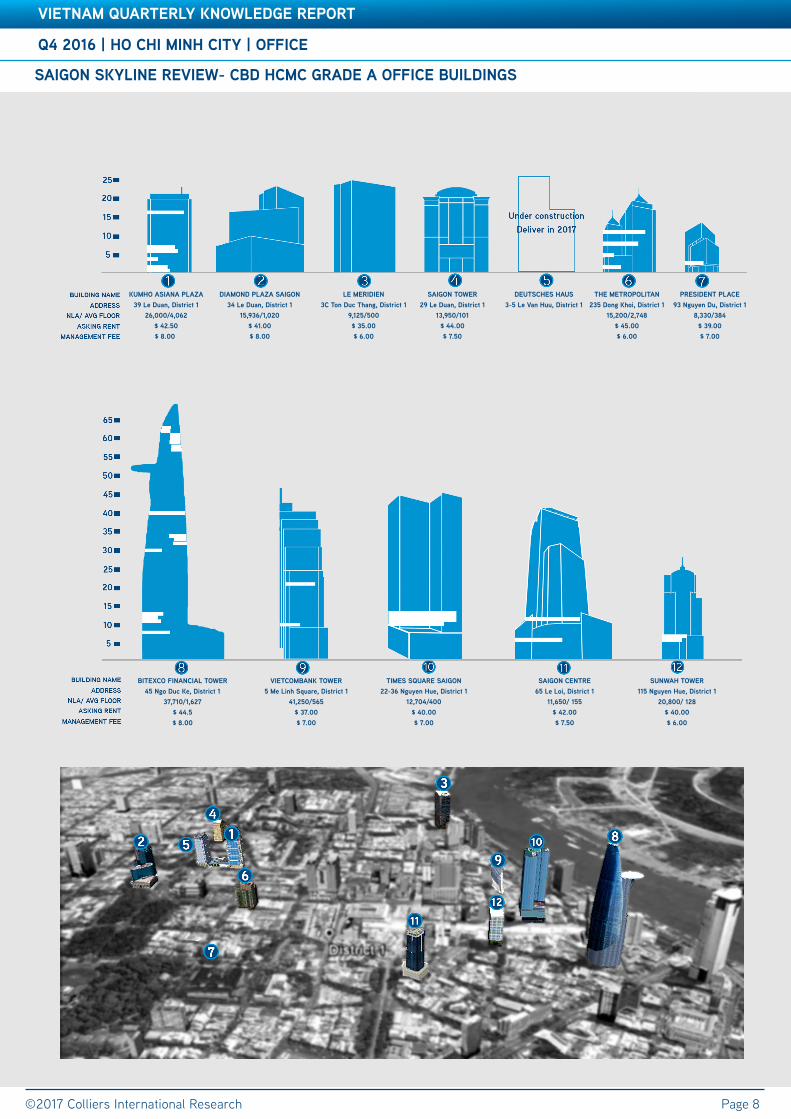
SAIGON SKYLINE REVIEW- CBD HCMC GRADE A OFFICE BUILDINGS
KUMHO ASIANA PLAZA39 Le Duan, District 1
26,000/4,062$ 42.50
$ 8.00
DIAMOND PLAZA SAIGON34 Le Duan, District 1
15,936/1,020$ 41.00$ 8.00
LE MERIDIEN 3C Ton Duc Thang, District 1
9,125/500$ 35.00$ 6.00
SAIGON TOWER29 Le Duan, District 1
13,950/101$ 44.00$ 7.50
DEUTSCHES HAUS3-5 Le Van Huu, District 1
THE METROPOLITAN235 Dong Khoi, District 1
15,200/2,748$ 45.00$ 6.00
PRESIDENT PLACE93 Nguyen Du, District 1
8,330/384$ 39.00$ 7.00
BITEXCO FINANCIAL TOWER45 Ngo Duc Ke, District 1
37,710/1,627$ 44.5$ 8.00
VIETCOMBANK TOWER5 Me Linh Square, District 1
41,250/565$ 37.00$ 7.00
TIMES SQUARE SAIGON22-36 Nguyen Hue, District 1
12,704/400$ 40.00$ 7.00
SAIGON CENTRE65 Le Loi, District 1
11,650/ 155$ 42.00$ 7.50
SUNWAH TOWER115 Nguyen Hue, District 1
20,800/ 128$ 40.00$ 6.00

Q4 2016 | HO CHI MINH CITY | OFFICE Q4 2016 | HO CHI MINH CITY | RETAIL
©2017 Colliers International Research
VIETNAM QUARTERLY KNOWLEDGE REPORT
Page 9
Table 4: Retail, Significant Future Projects Under Construction
PERFORMANCEThe year 2016 recorded a significant rental growth of 12% y-o-y across the market. Being a hot spot for new international brands, the CBD remained its high average asking rents thanks to limited supply. New supply during the year stabilized rental rates of suburban districts. Improvement was seen in occupancy rate, up 2% y-o-y thanks to effective leasing strategies and stronger demand for retail space in the city.
SUPPLYThe last quarter of 2016 welcomed the opening of Golden Plaza, adding approximately 15,000sqm to the existing retail stock. Located in a strategic location of District 5 with four street frontages, the mall offers more than 600 kiosks with special considerations to fengshui design. This is the first center that combines both traditional and online sale for wholesale and retail. The total retail stock increased 13% y-o-y, reaching nearly 900,000sqm. The majority of new supply in 2016 was decentralized to suburban districts, where having large land bank and improving infrastructure.
DEMANDWith a population of more than 8 million people, an urbanisation rate of 82.5% and an average income per capita of approximately 3,650 USD, HCMC is the leading city in terms of total retail sales. In 2016, the total value was USD30.1 billion, increasing by 9.1% compared to the same period last year, indicating a significant improvement in local buying power. The continued strong retail sales growth implies expanding demand for retail space in the city in the coming years.
OUTLOOKVietnam has become one of the most attractive destinations for retailers in South East Asia on the back of strong inflow of foreign direct investment, rising household spending, a young population and improving economic conditions. Likewise, Ho Chi Minh City’s economic importance and status as retail hub continues to attract a strong development pipeline. There is currently approximately 300,000sqm GFA of retail space under construction that will open for business in 2017. Stronger competition from new openings is forecasted to push down rents and occupancy rates by 2% in the next two years.
Figure 8: Retail, Total Supply by Year
Source: Colliers International Research
Source: Colliers International Research
Figure 7: Retail, Market Performance by Year
Source: Colliers International Research
Project name District NLA (sqm) Expected Completion
Viettel Complex 10 6,400 Q1 2017
Union Square 1 39,454 Q2 2017
Leman CT Plaza 3 12,000 Q2 2017
Thaco-Sala Residence 2 24,000 Q3 2017
The Garden Mall 5 24,000 Q3 2017
Xi Grand Court 10 60,000 Q4 2017
Su Van Hanh Mall 10 96,152 Q4 2017
Vinhomes Central Park Binh Thanh 44,250 Q4 2017
0.0%
10.0%
20.0%
30.0%
40.0%
50.0%
60.0%
70.0%
80.0%
90.0%
100.0%
0.0
10.0
20.0
30.0
40.0
50.0
60.0
70.0
80.0
2010 2011 2012 2013 2014 2015 2016 2017F2018F2019F
USD
/sqm
/mon
th
Average asking rent Occupancy rate
0
200,000
400,000
600,000
800,000
1,000,000
1,200,000
1,400,000
1,600,000
2010 2011 2012 2013 2014 2015 2016 2017F2018F2019F
NLA
(sq
m)

Q4 2016 | HO CHI MINH CITY | RETAIL
VIETNAM QUARTERLY KNOWLEDGE REPORT
©2017 Colliers International Research Page 10
Table 3: Significant Office Projects
(*) ARR (Average Rental Rate): All rents are stated in net rents per sqm, inclusive service charge but exculding VAT
Table 5: Significant Retail Projects
No Name of Project/Building Address Location Completion Year
NLA (sq m) ARR (*) Occupancy
Rate1 Sheraton Saigon 88 Dong Khoi District 1 2003 750 130 100%2 The Manor 1 91 Nguyen Huu Canh Binh Thanh 2006 2,000 20 100%3 Opera View Lam Son Square District 1 2006 1,260 54 100%4 Caravelle Hotel 19 Lam Son Square District 1 2007 150 100 100%5 New World Hotel 76 Le Lai Street District 1 2009 1,000 90 100%6 Hotel Continental Sai Gon 132-134 Dong Khoi District 1 2009 200 90 100%7 Centre Point 106 Nguyen Van Troi Phu Nhuan 2009 2,000 22 93%8 Saigon Pearl 92 Nguyen Huu Canh Binh Thanh 2011 5,000 25 88%
9 The Manor 2 91 Nguyen Huu Canh Binh Thanh 2011 2,500 20 100%
10 The Oxygen Mall An Phu Ward District 2 2011 5,000 30 65%11 Rex Arcade 141 Nguyen Hue District 1 2011 2,000 125 100%
12 ICON 68 @ BFT 45 Ngo Duc Ke District 1 2011 8,000 90 99%
13 Kumho Asiana 35 Le Duan District 1 2009 6,830 50 100%
14 Saigon Airport Plaza 1 Bach Dang, Ward 2 Tan Binh 2013 7,623 23 75%15 Imperia An Phu An Phu Ward District 2 2013 2,940 15 100%16 President Place 93 Nguyen Du District 1 2013 800 42 98%17 Times Square 22-36 Nguyen Hue District 1 2013 9,000 300 100%18 Thao Dien Pearl 12 Quoc Huong District 2 2015 12,855 32 81%
Retail Podium 69,908 76.9 90%
1 Diamond Plaza 34 Le Duan District 1 1999 9,000 166 100%2 Parkson Saigontourist Plaza 35 Le Thanh Ton Street District 1 2002 17,000 100 99%3 Parkson Hung Vuong Plaza 126 Hung Vuong Street District 5 2007 24,000 60 97%4 Parkson C.T. Plaza Tan Son Nhat, Truong Son Tan Binh 2008 12,235 41 98%5 Parkson Flemington Le Dai Hanh District 11 2010 26,000 40 95%6 Parkson Cantavil Premier Cantavil Premier District 2 2013 17,815 35 96%
Department Store 106,050 64.0 97%
1 Saigon Center 35 Nam Ky Khoi Nghia District 1 1996 47,000 100 100%2 Vincom Center B 72 Le Thanh Ton District 1 2010 45,000 100 92%3 Vincom Plaza 3/2 3C Ba Thang Hai District 10 2010 25,000 40 95%4 Crescent Mall 101 Ton Dat Tien District 7 2011 45,000 43 85%5 Lotte Mart Saigon South 469 Nguyen Huu Tho District 7 2008 24,000 40 99%6 Lotte Mart Phu Tho 968 Ba Thang Hai District 11 2010 24,500 38 98%7 Saigon Square 1 77-89 Nam Ky Khoi Nghia District 1 2006 1,300 - 100%8 Union Square 171 Dong Khoi District 1 2012 38,000 Under renovation9 Zen Plaza 54-56 Nguyen Trai District 1 2001 6,817 60 100%10 Taka Plaza 102 Nam Ky Khoi Nghia District 1 2011 1,000 70 100%11 Superbowl Vietnam TSN A43 Truong Son Tan Binh 2002 5,500 30 80%12 Satra Pham Hung C6/27 Pham Hung District 8 2011 11,528 14 100%13 An Dong Plaza 18 An Duong Vuong District 5 2004 18,000 - 92%
Shopping Centre 292,645 63.2 94%

Q4 2016 | HO CHI MINH CITY | RETAIL
VIETNAM QUARTERLY KNOWLEDGE REPORT
Accelerating success
Q4 2016 | HO CHI MINH CITY | CONDOMINIUM
VIETNAM QUARTERLY KNOWLEDGE REPORT
©2017 Colliers International Research Page 11
Table 3: Significant Office ProjectsPERFORMANCEMarket sentiment was improved in the last quarter of the year with nearly 12,000 successful transactions, up 55% compared to the previous quarter. The whole year witnessed a drop of 4% y-o-y in the number of sold units as competition was more intense by new entrants. Long-term market fundamentals remained positive with increasing genuine home buyers who can afford their own property thanks to rising income and supporting finance conditions. On the primary market, price appreciation was modest at 4% y-o-y as developers were more cautious in their pricing strategies in the midst of increasing new launches. Looking forward to 2017, sale price is forecasted to move upward, ranging from 3%-7%, depending on each market segment.
SUPPLYThe year 2016 witnessed a decline of 11% y-o-y in total new launches, prompting the market was cooling down from 2015 boom. While mid-end segment still dominated new launches, high-end segment reduced their market shares by 13% y-o-y as developers began to shift their attention to lower-end market. Robust infrastructure development and large land bank in the east and south of the city are supporting market momentum in these two areas. It is expected that the trend will be ongoing on the back of the city’s master plan toward 2020.
DEMANDConsidered as potential target customers, the employed population, especially those with stable income, will support housing purchases. It was estimated that the labour force in Ho Chi Minh City reached 4.1 million people in 2015, making up more than 50% of the total population. The percentage of trained labour increased from 40% in 2005 to 72.3% in 2015, and was forecasted to reach 80% by the end of 2016.
OUTLOOKWhile the majority of high-end condo buyers tend to be investors looking to rent out their units or speculators, real massive housing demand are in the mid-end and affordable condo segments. It is observed that condo projects with prices below USD900 (VND20 million) per sqm have received positive feedbacks from the market, and apartments’ size ranging from 60 – 90 square meters, with prices ranging from USD35.6 thousand to USD62.2 thousand (VND800 million to VND1.4 billion) per unit have captured attention. Therefore, it is expected that many developers will shift their condo development towards mid-end segment to meet the market demand.
Figure 9: Condominium, Primary Asking Price
Source: Colliers International Research
Figure 11: Condominium, Sold Units by Segment and Year
Source: Colliers International Research
Figure 10: Condominium, New Launches by Year
Source: Colliers International Research
0
500
1000
1500
2000
2500
3000
3500
4000
4500
5000
Q1Q2Q3Q4Q1Q2Q3Q4Q1Q2Q3Q4Q1Q2Q3Q4Q1Q2Q3Q4Q1Q2Q3Q4Q1Q2Q3Q4
2010 2011 2012 2013 2014 2015 2016
USD
/sqm
Luxury High-end Mid-end Affordable
0
5,000
10,000
15,000
20,000
25,000
30,000
35,000
40,000
45,000
50,000
2010 2011 2012 2013 2014 2015 2016 2017F 2018F 2019F
units
0
5000
10000
15000
20000
25000
30000
35000
40000
45000
50000
2010 2011 2012 2013 2014 2015 2016 2017F 2018F 2019F
units
Luxury High-end Mid-end Affordable

Accelerating success
Q4 2016 | HO CHI MINH CITY | CONDOMINIUM
VIETNAM QUARTERLY KNOWLEDGE REPORT
©2017 Colliers International Research Page 12
Table 6: Condominium, Significant new projects launched in Q4 2016
No Name of Project/Building Developer Location Completion Year
Number of units
Asking Price (US$/sqm)
1 Summer Square GotecLand Vietnam District 6 2017 256 8002 Dream Home Palace The Global Group District 8 2018 978 6403 Republic Plaza Thuy Duong - Duc Binh Tan Binh 2019 266 1,7004 Thu Thiem Garden Thu Thiem Corp. District 2 2017 375 7205 Sun Tower N.H.O Khang Viet. District 9 2018 379 6506 4S Linh Đông - block D Thanh Truong Loc Cu Chi 2018 220 8507 Him Lam Phu An Him Lam Land District 9 2017 1092 9008 Grand Riverside - phase 2 Hong Ha Corp District 4 2017 240 1,550
9 Park Vista Đông Mekong Nha Be 2018 1300 800
10 Citi Soho Kien A Group District 2 2019 781 870
New launches in Q4 2016 5,887
* Excluding all kinds of tax, promotions and management feeThe information is updated as at the end of Q4 2016

Q4 2016 | HO CHI MINH CITY | CONDOMINIUM
Accelerating success
Q4 2016 | HO CHI MINH CITY | VILLA & TOWNHOUSE
VIETNAM QUARTERLY KNOWLEDGE REPORT
©2017 Colliers International Research Page 13
PERFORMANCEThe villa and townhouse segment performed well in 2016 with a number of successful projects such as Palm Residence, Ha Do Centrosa, Lakeview City or Melosa Garden. The transaction volume reached 2,200 dwellings, with a growth rate of 2% y-o-y.
On the back of ongoing demand and improving market sentiment, new launched projects increased their primary average asking price to 13% y-o-y. Similarly, price on the secondary market was up 10% y-o-y.
SUPPLYLaunches were limited in the last quarter of 2016 with only two new projects coming online, adding 307 dwellings to the primary market, down 45% q-o-q. However, 2016 is the year for landed properties when new launches reached 3,000 dwellings, up 40% y-o-y.
The eastern part of the city including District 2 and District 9 has been capturing attention of developers thanks to its large available land bank, upgraded infrastructure and a long-term vision of urban planning.
DEMANDIn recent years, the acceleration of city infrastructure development such as Metro lines, Thu Thiem bridges, new ring roads has enhanced connectivity of suburban districts with the CBD. Shorter commuting times, better transportation system and green living environment are key factors that encourage buyers of landed properties in the city outskirt. Ongoing infrastructure projects will continue to support growing demand for villas and townhouses in the future.
OUTLOOKLooking forward to 2017, selling price is forecasted to grow but on a slower pace at approximately 4-5% y-o-y as new projects will target at lower-end market segments in less developed locations of the city.
Sale transactions will be stable thanks to solid demand from both end-users and investors while future supply pipeline is expected to decline after the market reached its climax in 2016.
Figure 12: Villa and Townhouse, Selling Prices by Quarter
Source: Colliers International Research
Figure 14: Villa and Townhouse, Primary Stock by District
Source: Colliers International Research
Figure 13: Villa&Townhouse, Supply by Year
Source: Colliers International Research
0
1000
2000
3000
4000
5000
Q12013
Q2 Q3 Q4 Q12014
Q2 Q3 Q4 Q12015
Q2 Q3 Q4 Q12016
Q2 Q3 Q4
USD
/sq
m
District 7 District 9 District 2 Others
0
2,000
4,000
6,000
8,000
10,000
12,000
2002 2003 2004 2005 2006 2007 2008 2009 2010 2011 2012 2013 2014 2015 2016
units
Existing supply New supply
District 237%
District 9 25%
Nha Be18%
District 125%
District 76%
District 104%
Binh Chanh4%
Thu Duc 4%
Others 5%

Accelerating success
Q4 2016 | HO CHI MINH CITY | VILLA & TOWNHOUSE
VIETNAM QUARTERLY KNOWLEDGE REPORT
©2017 Colliers International Research Page 14
Table 7: Villa and Townhouse, Significant new projects launched in Q4 2016
No Name of Project/Building Developer Location Completion Year
Number of units
Asking Price (US$/sqm)
1 Serenity Sky Villas SonkimLand District 3 2017 45 5,000-6,000 2 VX home center Van Xuan District 12 2018 70 1,300 3 Dragon Parc Phu Long Nha Be 2018 58 2,000 4 PhoDong Village SCC District 2 2018 44 1,500 5 Lucasta Khang Dien District 9 2019 140 800
New launches in Q4 2016 357

Q4 2016 | HO CHI MINH CITY | VILLA & TOWNHOUSE
Accelerating success
Q4 2016 | HO CHI MINH CITY | SERVICED APARTMENT
VIETNAM QUARTERLY KNOWLEDGE REPORT
©2017 Colliers International Research Page 15
PERFORMANCEIn the last quarter of 2016, the average net asking rent across both Grades recorded at USD33.9/sqm/month, up 2.6% q-o-q and 9.8% y-o-y. While Grade A saw a slight drop of 2% q-o-q in asking rent, staying at USD37.9/sqm/month, Grade B’s rent experienced a remarkable growth of 9% compared to the previous quarter, achieving USD29.9/sqm/month mainly due to the opening of a serviced apartment in District 3. By location, the CBD continued to record the highest average rent due to good location in conjunction with sufficient amenities and facilities. The city’s serviced apartment market remained healthy with relatively high occupancy rate, at 91%, marginally down 1ppt both on a quarterly and yearly basis.
SUPPLYCurrently, there are 37 serviced apartments of all grades providing about 3,335 units in HCMC, mainly in District 1, District 3 and District 7. The market’s only new supply last quarter was the Oakwood Apartments HCMC located in District 3, expanding the total stock by 2% q-o-q. Developed by Sonkim Land, the property provides 68 units with the interior inspired from Saigonese architecture in the period of 1950s-1970s. In terms of location, the CBD continued to be the most favored destination, contributing 44% of total supply. Serviced apartment developments are also clustered in District 3 and District 7 thanks to their convenient locations and availability of services targeting foreigners.
DEMANDSeveral years ago, serviced apartment used to be seen as a narrowed market segment targeting only expatriates. However, the segment has been expanded due to rising demand from Vietnamese tenants who want to enjoy the flexibility, privacy and independence offered by serviced apartments. Demand for serviced apartments is also being pushed upward as an increasingly mobile workforce drives business travel and relocation activity. It is expected that the positive economic outlook, coupled with an increasing number of expatriates coming to Vietnam promise higher demand for serviced apartments in the coming periods.
OUTLOOKBy the end of 2017, there will be some 987 units from four projects coming online. One project is located in the CBD while the other three are in decentralized districts. As the fierce competition between serviced apartments and buy-to-let apartments in the city, rental prices across two grades of the market are forecasted to soften. Limited future supply will allow the sector to continue to enjoy high occupancy in the coming years.
Project name District Total units
Expected Completion
Ascott Waterfront 1 222 Q1 2017
Saigon Center (phase 2) 7 200 Q3 2017
Oakwood Residence Saigon & Richmond Residence 7 480 Q4 2017
Berkley Serviced Residence 2 85 Q4 2017
Table 8: Serviced apartment, Significant Future Projects under construction
Source: Colliers International Research
Figure 15: Serviced Apartment, Occupancy Rate
Source: Colliers International Research
Figure 16: Serviced Apartment, Average Asking Rent by Grade
Source: Colliers International Research
70
75
80
85
90
95
Q3 Q4 Q1 Q2 Q3 Q4 Q1 Q2 Q3 Q4 Q1 Q2 Q3 Q4
2013 2014 2015 2016
%
Grade A Grade B
0
5
10
15
20
25
30
35
40
45
Q3 Q4 Q1 Q2 Q3 Q4 Q1 Q2 Q3 Q4 Q1 Q2 Q3 Q4
2013 2014 2015 2016
USD/
sqm
/mon
thGrade A Grade B

Accelerating success
Q4 2016 | HO CHI MINH CITY | SERVICED APARTMENT
VIETNAM QUARTERLY KNOWLEDGE REPORT
©2017 Colliers International Research Page 16
Table 9: Significant Serviced Apartment Projects
No. Project Name Address Location Completion Year
Total Room
Average Occupancy
ARR(*) (**)
1 The Landmark 5B Ton Duc Thang District 1 1995 66 95.0% 26.02 Sedona Suites 65 Le Loi District 1 1996 89 98.0% 34.0
3 Somerset Chancellor Court 21-23 Nguyen Thi Minh Khai District 1 1996 172 90.0% 32.0
4 Nguyen Du Park Villas 111 Nguyen Du District 1 2004 41 95.0% 22.05 The Lancaster 22-22 Bis Le Thanh Ton District 1 2007 55 73.0% 37.06 Intercontinental Asian Saigon 39 Le Duan District 1 2009 260 90.0% 36.0
Grade A 683 90.5% 34.1
1 Norfork Mansion 17-21 Ly Tu Trong District 1 1998 126 100.0% 33.02 Saigon Sky Garden 20 Le Thanh Ton District 1 1998 154 85.0% 18.03 Somerset HCM 8A Nguyen Binh Khiem District 1 1998 165 100.0% 26.04 Diamond Plaza 34 Le Duan District 1 1999 42 95.0% 25.05 Garden View Court 101 Nguyen Du District 1 2000 76 99.0% 29.06 Ben Thanh Luxury 172-174 Ky Con District 1 2010 88 91.0% 20.0
7 Lafayette De SaiGon 8 Phung Khac Khoan District 1 2010 18 100.0% 36.0
8 Vincom Center 45A Ly Tu Trong District 1 2010 60 34.0% 20.0
9 Nikko Saigon 235 Nguyen Van Cu District 1 2011 54 100.0% 34.0
10 Saigon City Residence 8A/3D2 Thai Van Lung District 1 2011 17 84.0% 37.0
11 Spring Court 1Bis Phung Khac Khoan District 1 2011 14 87.0% 21.0
Grade B 814 90.4% 25.6
(*) US/sqm/month(**) ARR (Average Rental Rate): All rents are stated in gross rents per sqm, not including VAT and serviced charge

Q4 2016 | HO CHI MINH CITY | SERVICED APARTMENT
VIETNAM QUARTERLY KNOWLEDGE REPORT
Accelerating success
Q4 2016 | HO CHI MINH CITY | INDUSTRIAL
VIETNAM QUARTERLY KNOWLEDGE REPORT
©2017 Colliers International Research Page 17
PERFORMANCERents remained relatively stable on quarterly basis but fluctuated on yearly basis. More specifically, the average asking rent stayed at USD138.3/sqm/term, recording a nominal increase of 0.2% compared to the previous quarter but a significant growth of 15% compared to the same period last year. The increase was mainly due to higher asking rent of some IPs. Since no new IP entered the market in the last quarter of 2016, the average Land Use Right term was 35.8 years, unchanged q-o-q. The average occupancy rate was 67.5%, down 2.5 ppts q-o-q but up 0.5 ppts y-o-y. There are eight fully occupied IPs out of 19 existing IPs. Cu Chi district remained its lowest average occupancy rate of 42.3%, whilst 5 districts were reported to have occupancy rates of 100%, namely District 9, 12, 2, Tan Phu and Thu Duc districts. For a minimum leasable area from 1,000-5,000sqm, ready-built factories charge USD2.5 USD4.0/sqm/month (excluding VAT and service charge).
SUPPLYThe existing stock was unchanged compared to the previous quarter with 19 operating IPs, covering a total area of nearly 3,940 hectares. The leasable area is estimated to be 71% of total land area with nearly 2,800 hectares. Binh Chanh district remained the largest supplier with 770 hectares, accounting for more than 26% of the market share, followed by Cu Chi and Thu Duc districts. Le Minh Xuan (phase 2 and 3), Vinh Loc I (phase 2 and 3), Vinh Loc III, Phong Phu in Binh Chanh, Tay Bac Cu Chi (phase 2) in Cu Chi, Hiep Phuoc (phase 2) in Nha Be are some IPs that are under construction and expected to coming on stream in the coming years.
DEMANDThe fact that TPP ratification was deferred after the US presidential election won by Republican Donald Trump has raised concerns about foreign investment into Vietnam. Obviously, the lack of TPP will negatively affect some future investment, particularly in export and manufacturing industries. However, it is believed that foreign inflows will continue to be strong. Firstly, the country’s macro-economics are stable with average annual growth rate 6%. Secondly, the government offers favorable policies that would help to attract more investments from foreign investors. Thirdly, labor costs are expected to be low, about half of China’s and not likely to fluctuate in the short or medium term. As a result, demand for industrial space is expected to rise in the near future.
OUTLOOKThe future pipeline will expand with approximately 2,800 hectares from 8 new IPs entering the market in the coming years, up approximately 60% from the current stock.There is a fact that development of previous industrial zones in Ho Chi Minh City did not take into consideration high speed of urbanization, and thus contributing to bad traffic situation of the City. Demand for transportation facilities between factories/enterprises in IPs and ports/airports are forecasted to increase in conjunction with rising demand for industrial properties. Therefore, the City government is now planning a number of new transportation projects to improve the city’s infrastructure, making Ho Chi Minh City’s industrial market more attractive to international firms.
VIETNAM QUARTERLY KNOWLEDGE REPORT
Figure 17: Industrial, Market Performance by District
Source: Colliers International Research
Figure 18: Industrial, Supply by District
Source: Colliers International Research
Source: Colliers International Research
Table 10: Industrial, Future Supply
Industrial Park Name District GFA (ha)
Le Minh Xuan Industrial Park - phase 2 Binh Chanh 338
Le Minh Xuan Industrial Park - phase 3 Binh Chanh 242
Vinh Loc I - phase 2 Binh Chanh 56
Vinh Loc I - phase 3 Binh Chanh 200
Vinh Loc Industrial Park III Binh Chanh 210.3
Tay Bac Cu Chi Industrial Park - phase 3 Cu Chi 1,000
Hiep Phuoc Industrial Park - phase 2 Nha Be 597
Phong Phu Industrial Park Binh Chanh 148.4
0%
10%
20%
30%
40%
50%
60%
70%
80%
90%
100%
0
50
100
150
200
250
300
District 9 District 12 Cu Chi Binh Chanh Nha Be District 7 Tan Phu District 2 Thu Duc
US
D/s
qm/t
erm
Average asking rent Occupancy rate
Binh Chanh19%
District 911%
Nha Be20%
Cu Chi31%
Others19%

Q4 2016 | HO CHI MINH CITY | INDUSTRIAL
VIETNAM QUARTERLY KNOWLEDGE REPORT
©2017 Colliers International Research Page 18
Table 3: Significant Office ProjectsTable 11: HCMC Industrial Market Overview
No Name of Industrial Park Location Distance to CBD (km)
Total Area(ha)
Total leasable area (ha)
Asking Rent (US$/sqm/
term)Occupancy LUR Term
1 Tan Thuan Export Processing Zone District 7 6.4 300 204 260 81% 20412 Tan Binh Industrial Park(P1+2) Tan Phu 11 129 100 235 100% 20473 Saigon Hi-tech Park P1 District 9 15 300 300 180 100% 20524 Vinh Loc Industrial Park Binh Chanh 15 203 131 250 95% 20475 Binh Chieu Industrial Park Thu Duc 16 27 27 150 100% 20466 Tan Thoi Hiep District 12 16 28 20 144 100% 20497 Linh Trung 2 Export Processing Zone Thu Duc 17 62 44 60 100% 20508 Tan Tao Industrial Park 1 Binh Chanh 17 161 97 240 97% 20479 Tan Tao Industrial Park 2 Binh Chanh 17 183 116 240 78% 205010 Linh Trung 1 Export Processing Zone Thu Duc 18 62 46 60 100% 204211 Le Minh Xuan Industrial Park Binh Chanh 20 100 66 120 100% 204712 Hiep Phuoc Industrial Park 1 Nha Be 21 311 224 125 100% 204813 Cat Lai Industrial Park (Cluster II) District 2 21 137 87 90 100% 206114 Hiep Phuoc Industrial Park 2 Nha Be 22 597 345 125 31% 205815 An Ha Industrial Park Binh Chanh 23 124 124 69 23% 205816 Dong Nam Industrial Park Cu Chi 30 343 287 63 69% 205817 Tay Bac Cu Chi Industrial Park Cu Chi 36.5 208 150 80 3% 204818 Tan Phu Trung Industrial Park Cu Chi 37 543 359 80 30% 2054
19 Automotive-Mechanical (Hoa Phu) Industrial park Cu Chi 40 99 67 80 83% 2057
Total 3,916 2,794 138.3 68%

Q4 2016 | HO CHI MINH CITY | INDUSTRIAL
VIETNAM QUARTERLY KNOWLEDGE REPORT
COLLIERS INTERNATIONAL | VIETNAM
HO CHI MINH CITY18HBT Building, 4th floor16-18 Hai Ba Trung Street,Ben Nghe Ward, District 1HCMC, VietnamTel: + 84 8 3827 5665
HANOIRoom A52, 5th Floor68 Nguyen Du Street, Hai Ba Trung District, Hanoi, VietnamTel: +84 4 3942 2769
502 offices in67 countries on6 continents
Accelerating success
DAVID JACKSONGeneral Director
+84 8 3827 5665
About Colliers InternationalColliers International is a leader in global real estate services, defined by our spirit of enterprise.
Through a culture of service excellence and a shared sense of initiative, we integrate the resources of real estate specialists worldwide to accelerate the success of our partners.We connect through a shared set of values that shape a collaborative environment throughout our organization that is unsurpassed in the industry.
With more than 100 professionals in 2 offices in Vietnam, the team is market driven and has proven and successful track record with both international and local experience.
From Hanoi to Ho Chi Minh City, we provide a full range of real estate services
The foundation of our services is the strength and depth of our experience.
Publication Coverage Frequency Content Availability
Knowledge Report/Market Insights
Vietnam Cities Quarterly All market sectors Publicly available
Asia Pacific Office Report
Asia Pacificincluding Vietnam
Quarterly Office market Publicly available
Vietnam Property Market Report
Vietnam cities Quarterly All market sectors On subscription
Development Recommendation
Vietnam cities At request All market sectors On subscription
$2.30billion in annual revenue
158million square meter under management
16,300professionalsand staff
This document has been prepared by Colliers International for advertising and general information only. Colliers International makes no guarantees, representations or warranties of any kind, expressed or implied, regarding the information including, but not limited to, warranties of content, accuracy and reliability. Any interested party should undertake their own inquiries as to the accuracy of the information. Colliers International excludes unequivocally all inferred or implied terms, conditions and warranties arising out of this document and excludes all liability for loss and damages arising there from. This publication is the copyrighted property of Colliers International and/or its licensor(s). ©2017. All rights reserved.
For further information, please contact us:
VIETNAM | RESEARCH & FORECAST REPORT
©2017 Colliers International Research www.colliers.com/vietnam
HA VOResearch Manager
+84 8 3827 5665