Embed Size (px)
Citation preview
Bulman Real Estate 2600 South Shore Blvd #300 League City, TX. 77573 281.450.8689 [email protected]
Market Report – Single Family Homes
Galveston*County,*Texas*1*November 2014
JEFF BULMAN, BROKER / OWNER $200,000,000 in real estate sales
Degree in Real Estate Certified Residential Specialist
Corporate Relocation Specialist Member of the Institute for Luxury Home Marketing
Member of the National Association of Realtors Member of the Texas Association of Realtors
Member of the Houston Association of Realtors
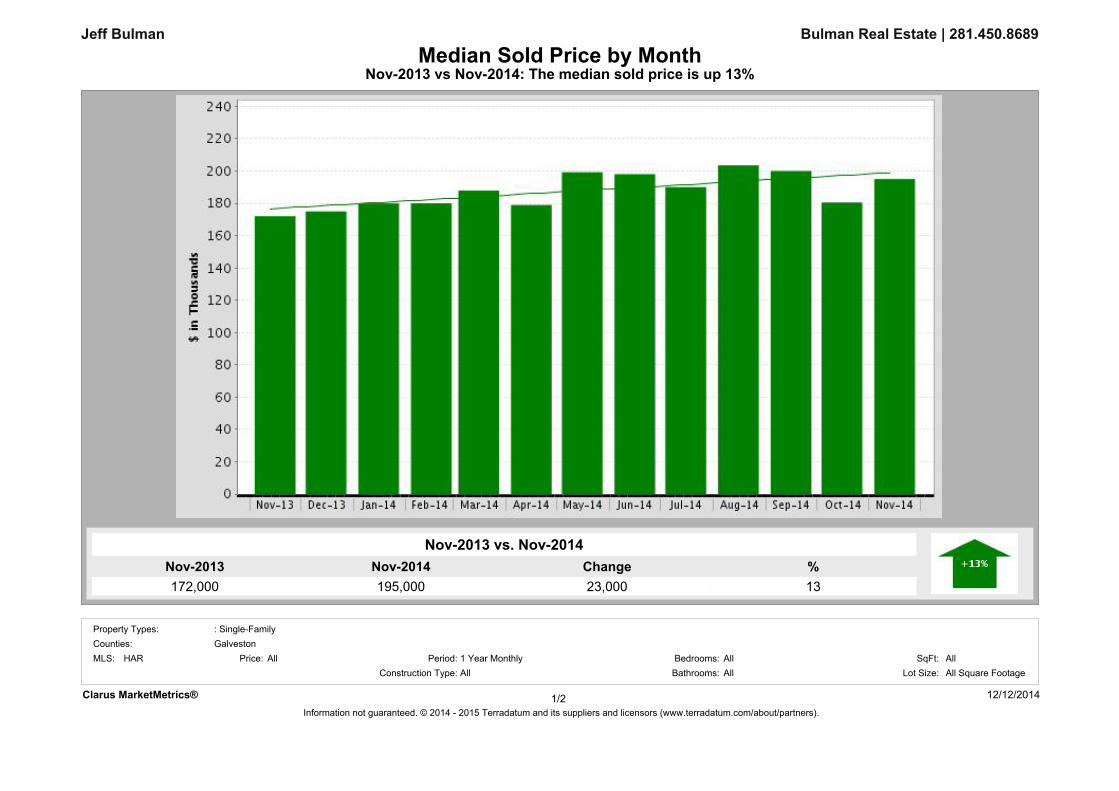
1RY�����195,000
1RY�����172,000
�13
&KDQJH23,000
Nov-2013 vs Nov-2014: The median sold price is up 13%Median Sold Price by Month
Bulman Real Estate | 281.450.8689
Nov-2013 vs. Nov-2014
Jeff Bulman
&ODUXV�0DUNHW0HWULFV� 12/12/2014Information not guaranteed. © 2014 - 2015 Terradatum and its suppliers and licensors (www.terradatum.com/about/partners).
1/2
MLS: HAR Bedrooms:AllAll
Construction Type:All1 Year Monthly SqFt:
Bathrooms: Lot Size:All All Square FootagePeriod:All
Counties:Property Types: : Single-Family
GalvestonPrice:
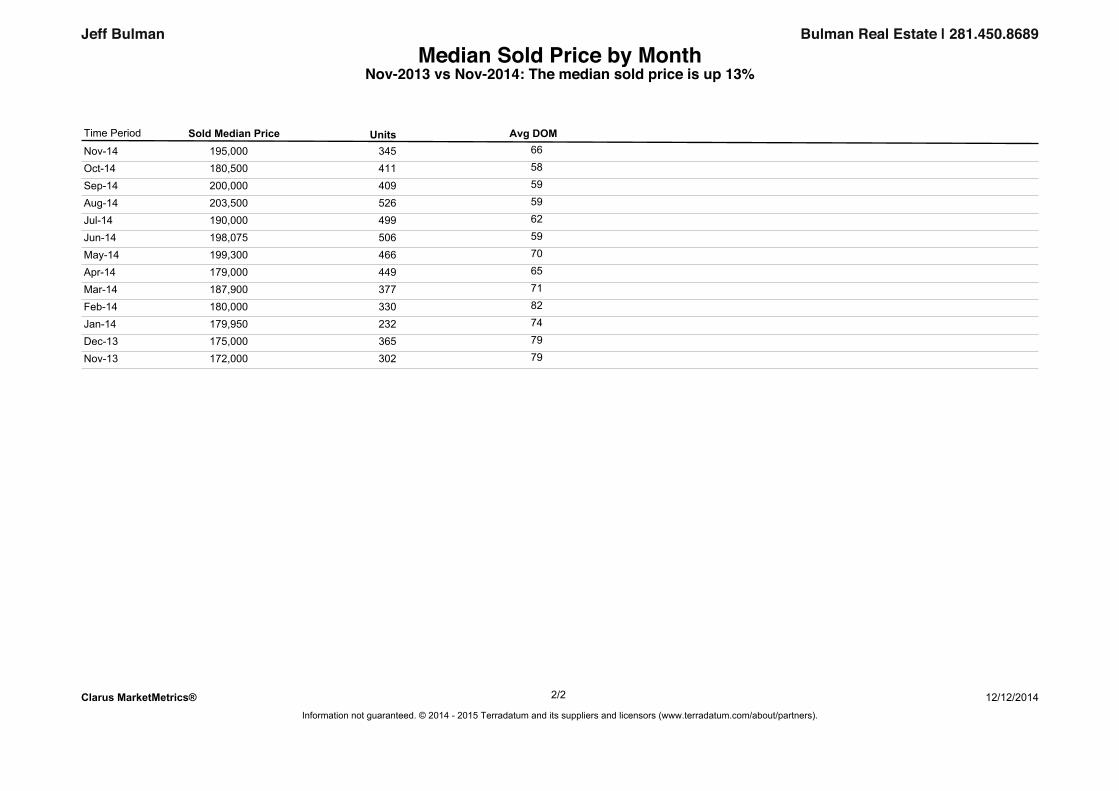
Median Sold Price by MonthNov-2013 vs Nov-2014: The median sold price is up 13%
Bulman Real Estate | 281.450.8689Jeff Bulman
Sold Median Price Units Avg DOMTime Period
Nov-14 195,000 345 66
Oct-14 180,500 411 58
Sep-14 200,000 409 59
Aug-14 203,500 526 59
Jul-14 190,000 499 62
Jun-14 198,075 506 59
May-14 199,300 466 70
Apr-14 179,000 449 65
Mar-14 187,900 377 71
Feb-14 180,000 330 82
Jan-14 179,950 232 74
Dec-13 175,000 365 79
Nov-13 172,000 302 79
&ODUXV�0DUNHW0HWULFV� 12/12/2014Information not guaranteed. © 2014 - 2015 Terradatum and its suppliers and licensors (www.terradatum.com/about/partners).
22/
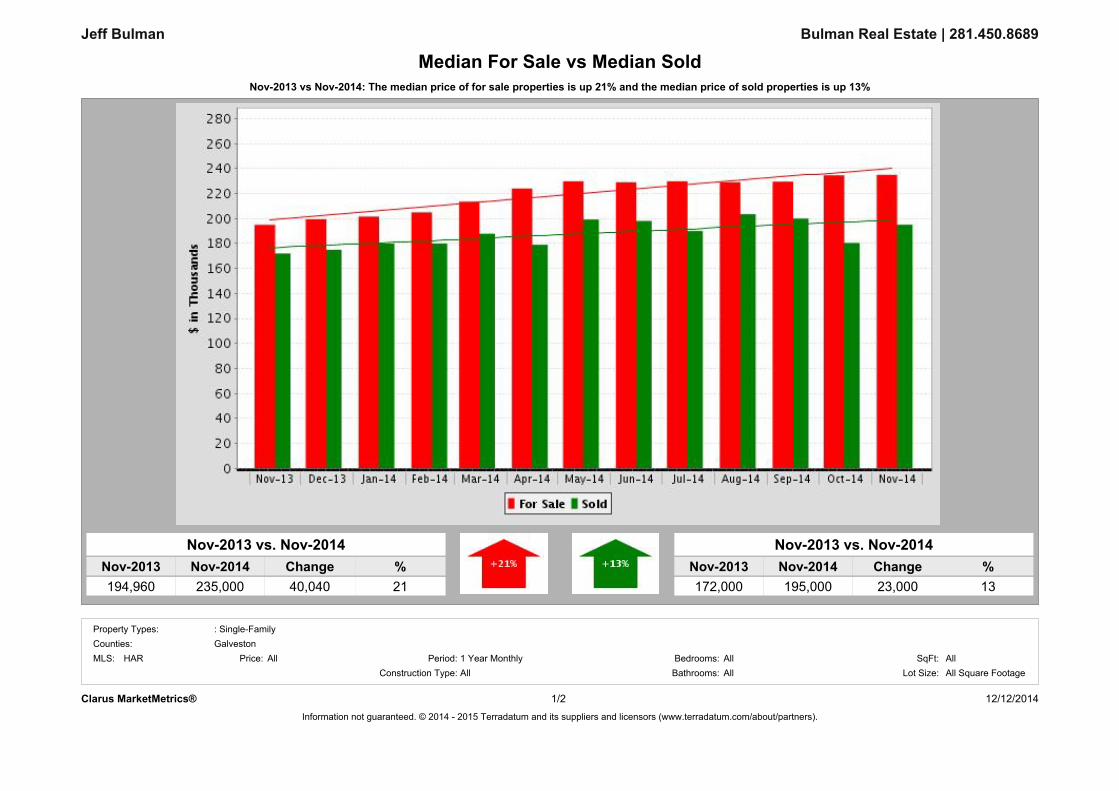
Nov-2013 vs Nov-2014: The median price of for sale properties is up 21% and the median price of sold properties is up 13%
Bulman Real Estate | 281.450.8689
Nov-2013 vs. Nov-2014
194,960 21
Jeff Bulman
235,0001RY�����
Median For Sale vs Median Sold
&KDQJH1RY����� �40,040
1RY����� 1RY����� �172,000 13
Nov-2013 vs. Nov-2014
195,000&KDQJH23,000
&ODUXV�0DUNHW0HWULFV� 12/12/2014Information not guaranteed. © 2014 - 2015 Terradatum and its suppliers and licensors (www.terradatum.com/about/partners).
1/2
MLS: HAR Bedrooms:AllAll
Construction Type:All1 Year Monthly SqFt:
Bathrooms: Lot Size:All All Square FootagePeriod:All
Counties:Property Types: : Single-Family
GalvestonPrice:
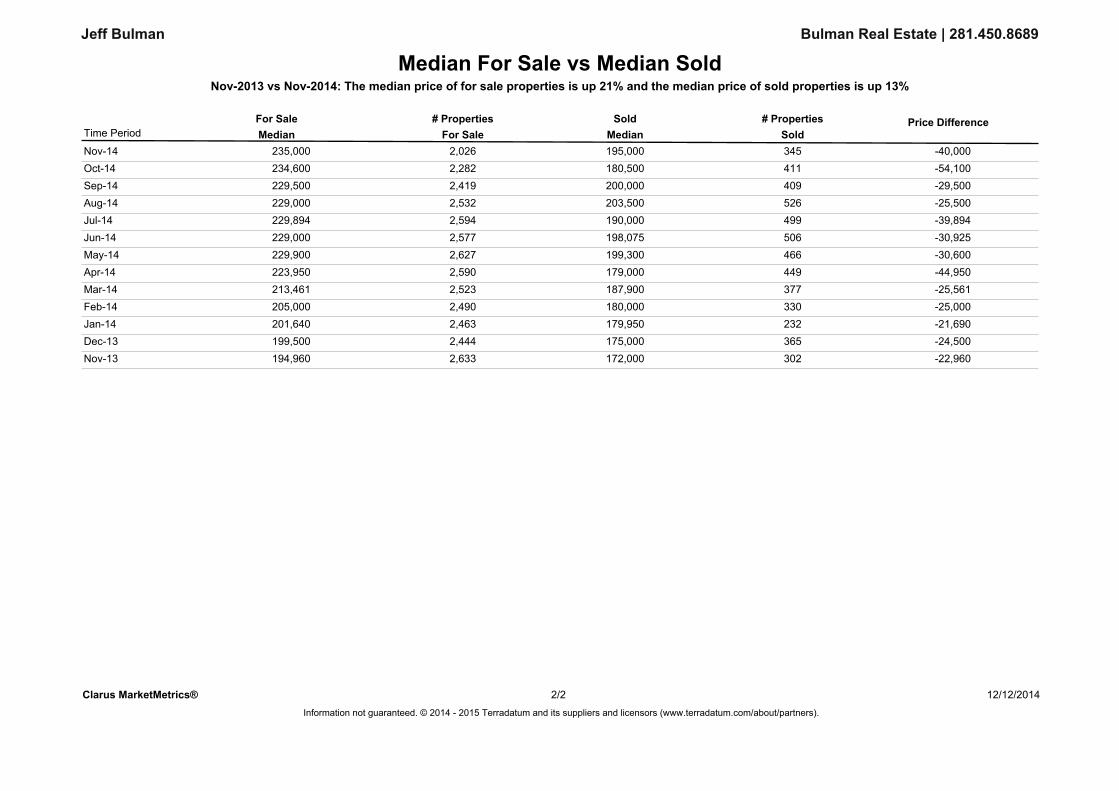
Median For Sale vs Median SoldNov-2013 vs Nov-2014: The median price of for sale properties is up 21% and the median price of sold properties is up 13%
Bulman Real Estate | 281.450.8689Jeff Bulman
For SaleMedian SoldMedianFor Sale # Properties # PropertiesSold Price Difference
Time Period
Nov-14 2,026 345235,000 195,000 -40,000Oct-14 2,282 411234,600 180,500 -54,100Sep-14 2,419 409229,500 200,000 -29,500Aug-14 2,532 526229,000 203,500 -25,500Jul-14 2,594 499229,894 190,000 -39,894Jun-14 2,577 506229,000 198,075 -30,925May-14 2,627 466229,900 199,300 -30,600Apr-14 2,590 449223,950 179,000 -44,950Mar-14 2,523 377213,461 187,900 -25,561Feb-14 2,490 330205,000 180,000 -25,000Jan-14 2,463 232201,640 179,950 -21,690Dec-13 2,444 365199,500 175,000 -24,500Nov-13 2,633 302194,960 172,000 -22,960
&ODUXV�0DUNHW0HWULFV�Information not guaranteed. © 2014 - 2015 Terradatum and its suppliers and licensors (www.terradatum.com/about/partners).
12/12/201422/

1RY�����345
1RY�����302
�14
&KDQJH43
Nov-2013 vs Nov-2014: The number of Sold properties is up 14%Sold Properties by Month
Bulman Real Estate | 281.450.8689
Nov-2013 vs. Nov-2014
Jeff Bulman
&ODUXV�0DUNHW0HWULFV� 12/12/2014Information not guaranteed. © 2014 - 2015 Terradatum and its suppliers and licensors (www.terradatum.com/about/partners).
1/2
MLS: HAR Bedrooms:AllAll
Construction Type:All1 Year Monthly SqFt:
Bathrooms: Lot Size:All All Square FootagePeriod:All
Counties:Property Types: : Single-Family
GalvestonPrice:
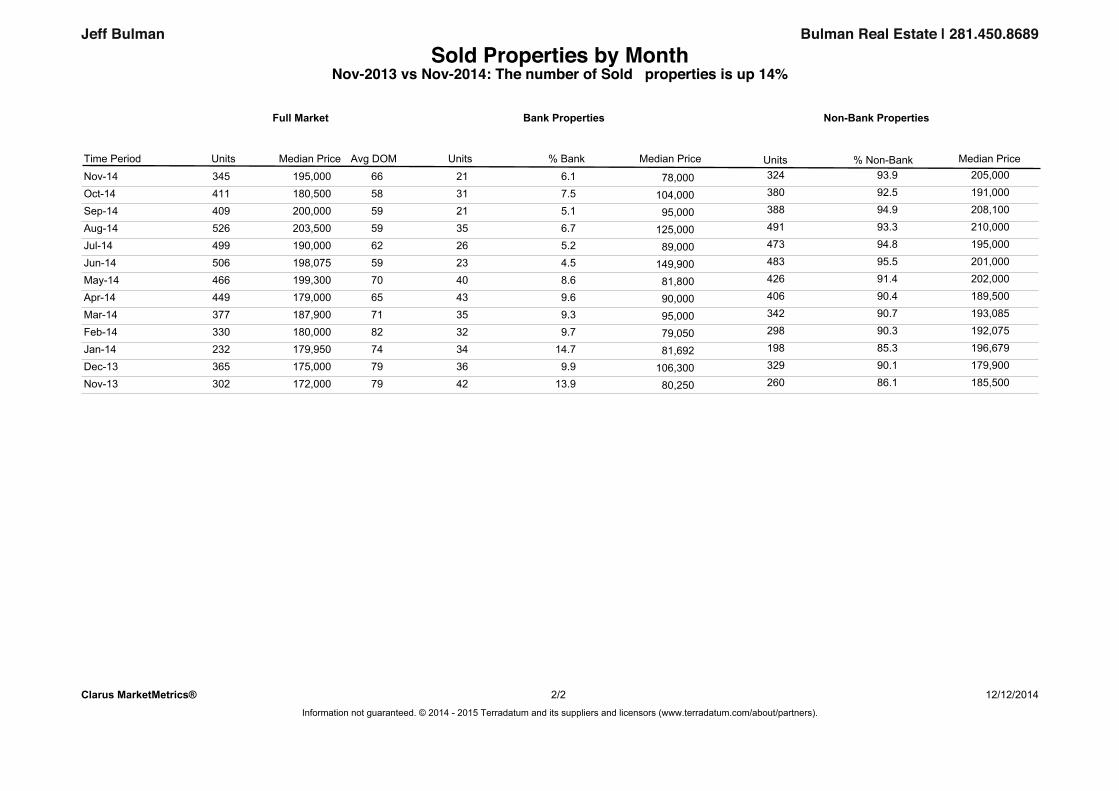
Sold Properties by MonthNov-2013 vs Nov-2014: The number of Sold properties is up 14%
Bulman Real Estate | 281.450.8689Jeff Bulman
Time Period
Full Market
Units Median Price Avg DOM
Bank Properties
Units % Bank Median Price
Non-Bank Properties
Units % Non-Bank Median PriceNov-14 195,000345 66 21 6.1 78,000 324 93.9 205,000
Oct-14 180,500411 58 31 7.5 104,000 380 92.5 191,000
Sep-14 200,000409 59 21 5.1 95,000 388 94.9 208,100
Aug-14 203,500526 59 35 6.7 125,000 491 93.3 210,000
Jul-14 190,000499 62 26 5.2 89,000 473 94.8 195,000
Jun-14 198,075506 59 23 4.5 149,900 483 95.5 201,000
May-14 199,300466 70 40 8.6 81,800 426 91.4 202,000
Apr-14 179,000449 65 43 9.6 90,000 406 90.4 189,500
Mar-14 187,900377 71 35 9.3 95,000 342 90.7 193,085
Feb-14 180,000330 82 32 9.7 79,050 298 90.3 192,075
Jan-14 179,950232 74 34 14.7 81,692 198 85.3 196,679
Dec-13 175,000365 79 36 9.9 106,300 329 90.1 179,900
Nov-13 172,000302 79 42 13.9 80,250 260 86.1 185,500
&ODUXV�0DUNHW0HWULFV� 12/12/2014Information not guaranteed. © 2014 - 2015 Terradatum and its suppliers and licensors (www.terradatum.com/about/partners).
22/
1RY�����336
1RY�����329
�2
&KDQJH7
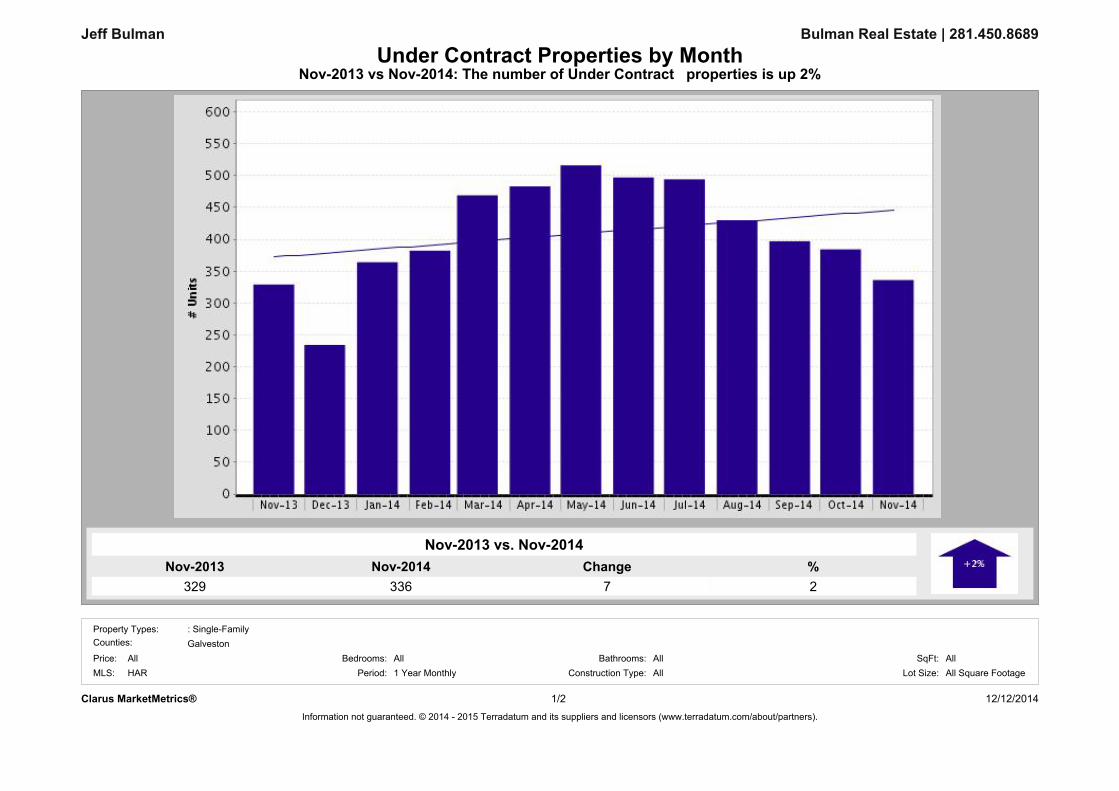
Nov-2013 vs Nov-2014: The number of Under Contract properties is up 2%Under Contract Properties by Month
Bulman Real Estate | 281.450.8689
Nov-2013 vs. Nov-2014
Jeff Bulman
&ODUXV�0DUNHW0HWULFV� 12/12/2014Information not guaranteed. © 2014 - 2015 Terradatum and its suppliers and licensors (www.terradatum.com/about/partners).
1/2
AllBathrooms: SqFt:All
: Single-Family
All Square FootageConstruction Type: Lot Size:HAR
Galveston
Period: 1 Year MonthlyPrice:MLS:
All AllAll
Property Types:
Bedrooms:
Counties:
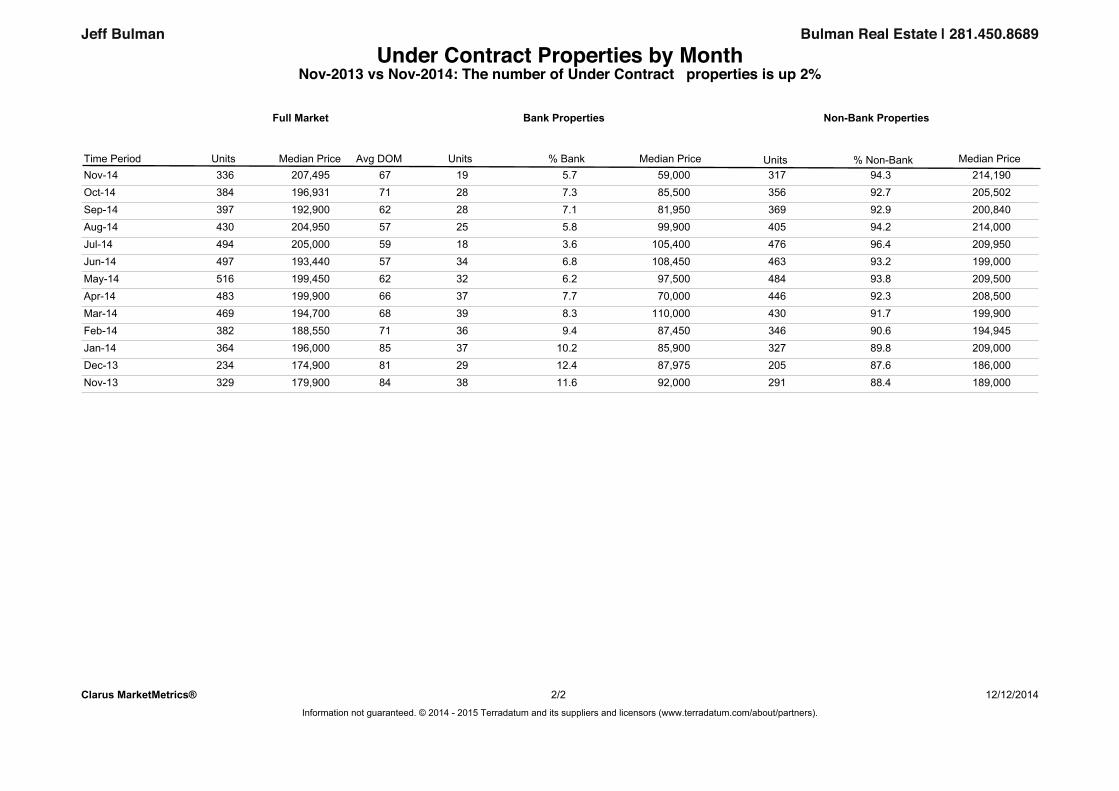
Under Contract Properties by MonthNov-2013 vs Nov-2014: The number of Under Contract properties is up 2%
Bulman Real Estate | 281.450.8689Jeff Bulman
Median Price UnitsUnits Median Price% Non-Bank
Full Market
% BankAvg DOMMedian Price
Bank Properties
Units
Non-Bank Properties
Time PeriodNov-14 207,495336 67 214,19094.331759,0005.719Oct-14 196,931384 71 205,50292.735685,5007.328Sep-14 192,900397 62 200,84092.936981,9507.128Aug-14 204,950430 57 214,00094.240599,9005.825Jul-14 205,000494 59 209,95096.4476105,4003.618Jun-14 193,440497 57 199,00093.2463108,4506.834May-14 199,450516 62 209,50093.848497,5006.232Apr-14 199,900483 66 208,50092.344670,0007.737Mar-14 194,700469 68 199,90091.7430110,0008.339Feb-14 188,550382 71 194,94590.634687,4509.436Jan-14 196,000364 85 209,00089.832785,90010.237Dec-13 174,900234 81 186,00087.620587,97512.429Nov-13 179,900329 84 189,00088.429192,00011.638
&ODUXV�0DUNHW0HWULFV� 12/12/2014Information not guaranteed. © 2014 - 2015 Terradatum and its suppliers and licensors (www.terradatum.com/about/partners).
22/
1RY�����388
1RY�����443
�-12
&KDQJH-55
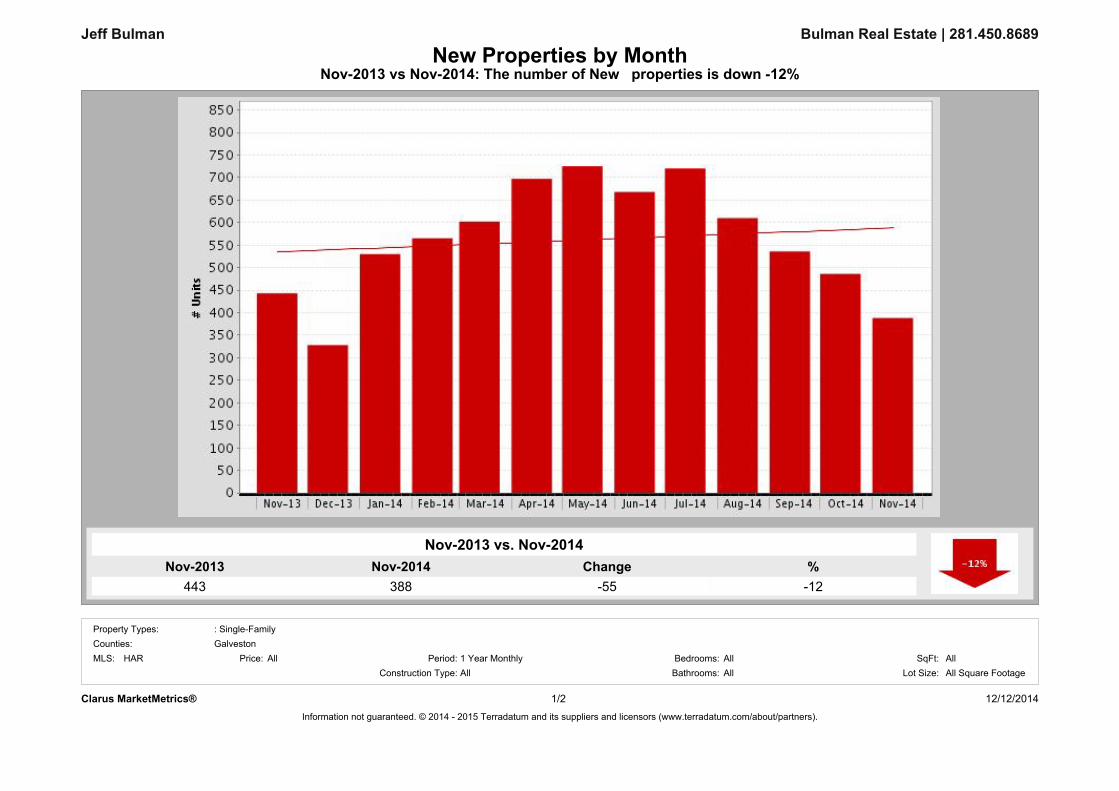
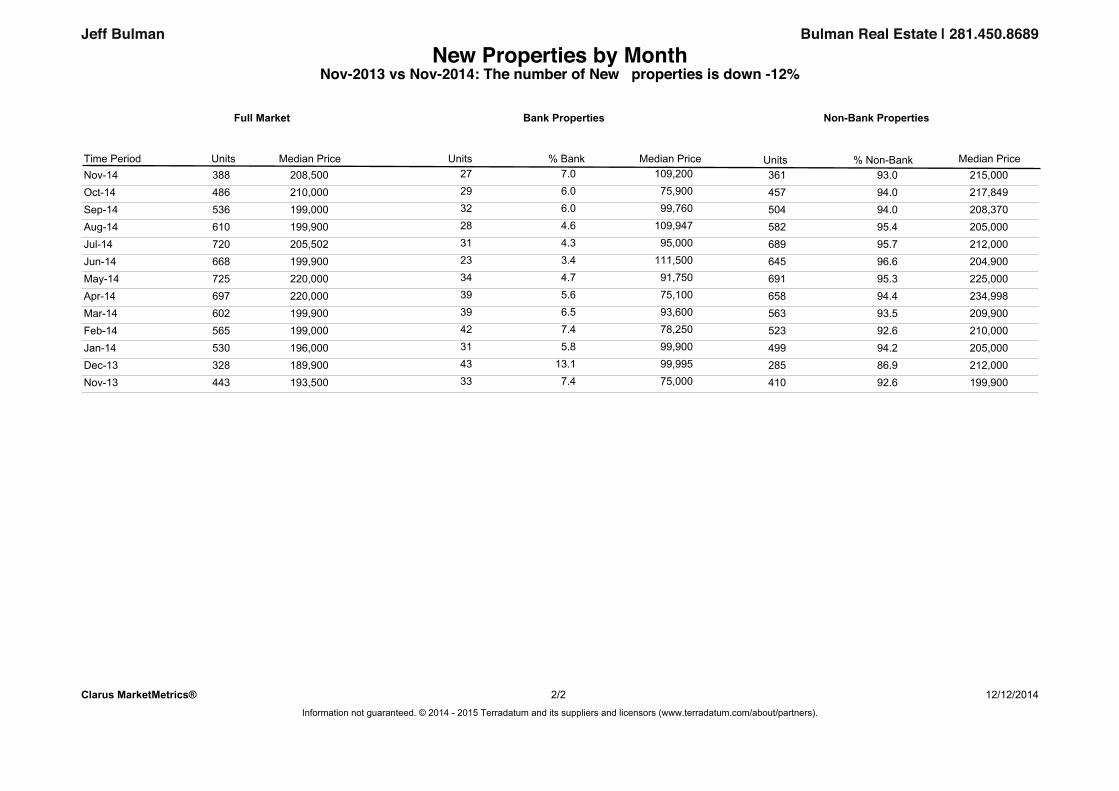
Nov-2013 vs Nov-2014: The number of New properties is down -12%New Properties by Month
Bulman Real Estate | 281.450.8689
Nov-2013 vs. Nov-2014
Jeff Bulman
&ODUXV�0DUNHW0HWULFV� 12/12/2014Information not guaranteed. © 2014 - 2015 Terradatum and its suppliers and licensors (www.terradatum.com/about/partners).
1/2
MLS: HAR Bedrooms:AllAll
Construction Type:All1 Year Monthly SqFt:
Bathrooms: Lot Size:All All Square FootagePeriod:All
Counties:Property Types: : Single-Family
GalvestonPrice:
New Properties by MonthNov-2013 vs Nov-2014: The number of New properties is down -12%
Bulman Real Estate | 281.450.8689Jeff Bulman
Median Price UnitsUnits Median Price% Non-Bank
Full Market
% BankMedian Price
Bank Properties
Units
Non-Bank Properties
Time PeriodNov-14 208,500388 27 7.0 109,200 361 93.0 215,000Oct-14 210,000486 29 6.0 75,900 457 94.0 217,849Sep-14 199,000536 32 6.0 99,760 504 94.0 208,370Aug-14 199,900610 28 4.6 109,947 582 95.4 205,000Jul-14 205,502720 31 4.3 95,000 689 95.7 212,000Jun-14 199,900668 23 3.4 111,500 645 96.6 204,900May-14 220,000725 34 4.7 91,750 691 95.3 225,000Apr-14 220,000697 39 5.6 75,100 658 94.4 234,998Mar-14 199,900602 39 6.5 93,600 563 93.5 209,900Feb-14 199,000565 42 7.4 78,250 523 92.6 210,000Jan-14 196,000530 31 5.8 99,900 499 94.2 205,000Dec-13 189,900328 43 13.1 99,995 285 86.9 212,000Nov-13 193,500443 33 7.4 75,000 410 92.6 199,900
&ODUXV�0DUNHW0HWULFV� 12/12/2014Information not guaranteed. © 2014 - 2015 Terradatum and its suppliers and licensors (www.terradatum.com/about/partners).
22/
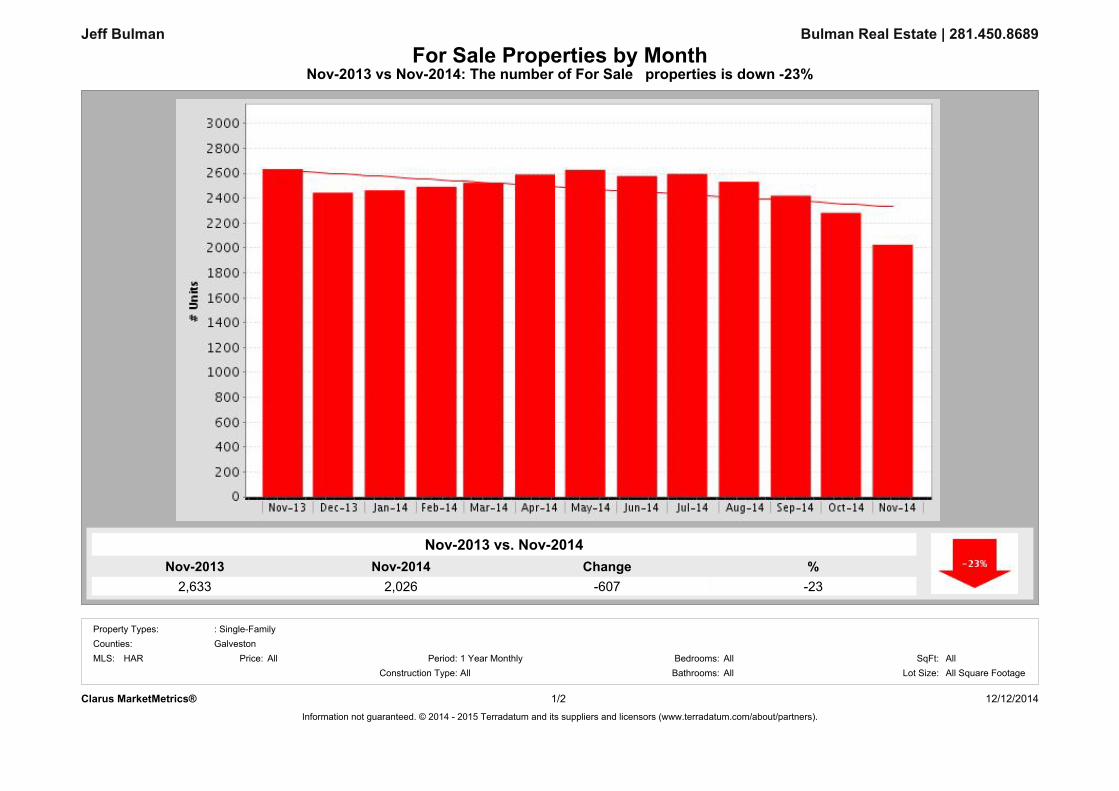
1RY�����2,026
1RY�����2,633
�-23
&KDQJH-607
Nov-2013 vs Nov-2014: The number of For Sale properties is down -23%For Sale Properties by Month
Bulman Real Estate | 281.450.8689
Nov-2013 vs. Nov-2014
Jeff Bulman
&ODUXV�0DUNHW0HWULFV� 12/12/2014Information not guaranteed. © 2014 - 2015 Terradatum and its suppliers and licensors (www.terradatum.com/about/partners).
1/2
MLS: HAR Bedrooms:AllAll
Construction Type:All1 Year Monthly SqFt:
Bathrooms: Lot Size:All All Square FootagePeriod:All
Counties:Property Types: : Single-Family
GalvestonPrice:

For Sale Properties by MonthNov-2013 vs Nov-2014: The number of For Sale properties is down -23%
Bulman Real Estate | 281.450.8689Jeff Bulman
Median Price UnitsUnits Median Price% Non-Bank
Full Market
% BankAvg DOMMedian Price
Bank Properties
Units
Non-Bank Properties
Time PeriodNov-14 235,0002,026 121 96 4.7 107,600 1,930 95.3 239,775Oct-14 234,6002,282 118 102 4.5 101,000 2,180 95.5 239,000Sep-14 229,5002,419 115 105 4.3 102,000 2,314 95.7 235,000Aug-14 229,0002,532 112 108 4.3 99,950 2,424 95.7 234,990Jul-14 229,8942,594 108 103 4.0 104,000 2,491 96.0 235,000Jun-14 229,0002,577 112 114 4.4 106,450 2,463 95.6 235,000May-14 229,9002,627 115 130 4.9 105,900 2,497 95.1 237,000Apr-14 223,9502,590 119 140 5.4 94,950 2,450 94.6 233,950Mar-14 213,4612,523 126 151 6.0 105,000 2,372 94.0 220,000Feb-14 205,0002,490 130 154 6.2 102,500 2,336 93.8 216,832Jan-14 201,6402,463 136 163 6.6 105,500 2,300 93.4 215,000Dec-13 199,5002,444 145 171 7.0 105,000 2,273 93.0 212,000Nov-13 194,9602,633 132 176 6.7 99,999 2,457 93.3 204,382
&ODUXV�0DUNHW0HWULFV� 12/12/2014Information not guaranteed. © 2014 - 2015 Terradatum and its suppliers and licensors (www.terradatum.com/about/partners).
22/
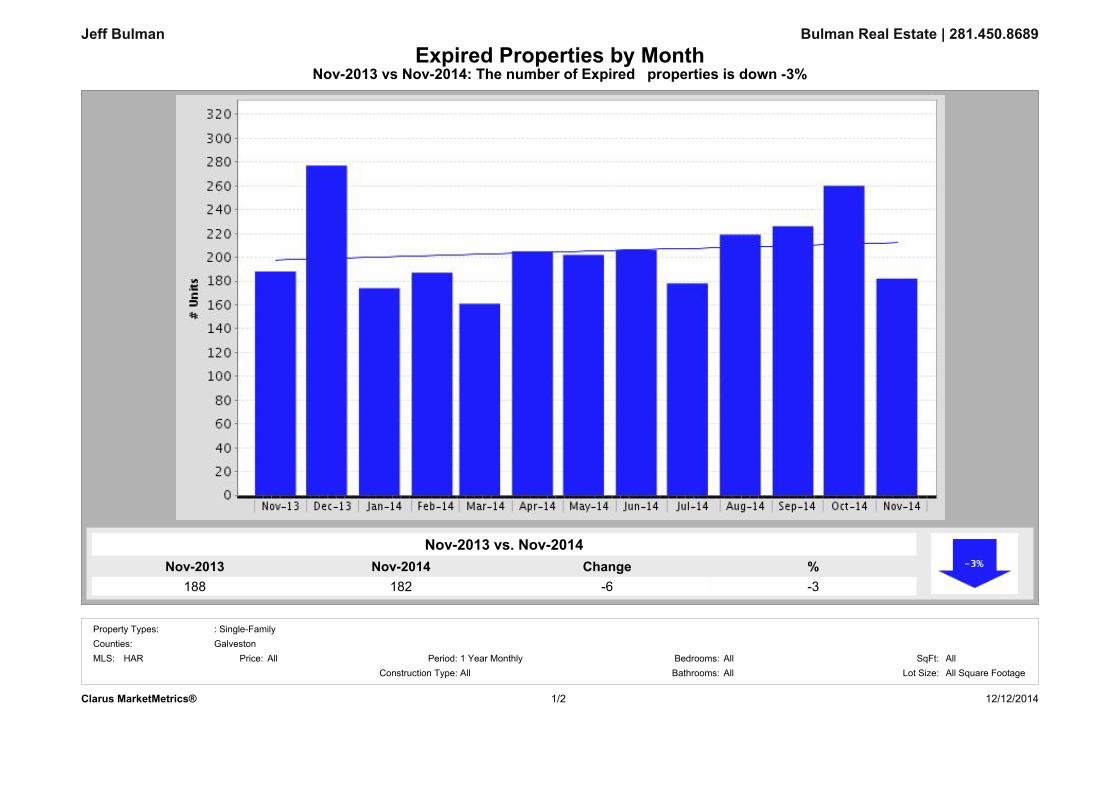
1RY�����182
1RY�����188
�-3
&KDQJH-6
Nov-2013 vs Nov-2014: The number of Expired properties is down -3%Expired Properties by Month
Bulman Real Estate | 281.450.8689
Nov-2013 vs. Nov-2014
Jeff Bulman
12/12/2014&ODUXV�0DUNHW0HWULFV� 1/2
MLS: HAR Bedrooms:AllAll
Construction Type:All1 Year Monthly SqFt:
Bathrooms: Lot Size:All All Square FootagePeriod:All
Counties:Property Types: : Single-Family
GalvestonPrice:
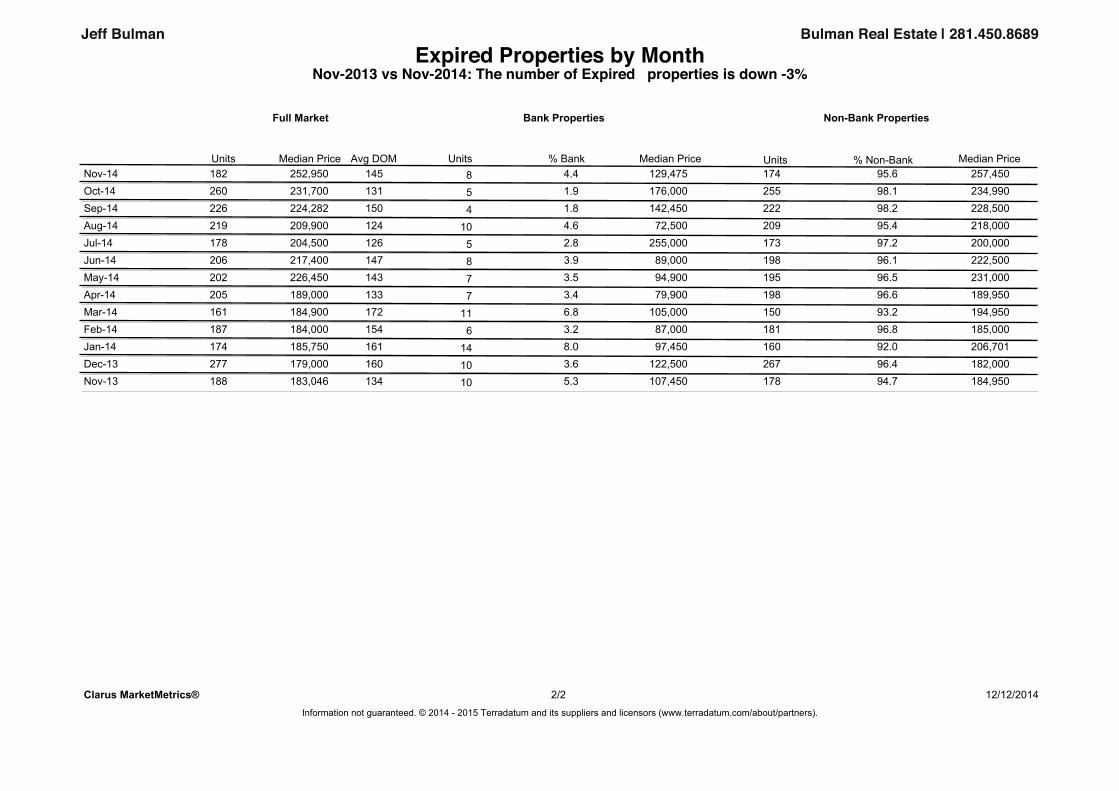
Expired Properties by MonthNov-2013 vs Nov-2014: The number of Expired properties is down -3%
Bulman Real Estate | 281.450.8689Jeff Bulman
Median Price Units% BankAvg DOMUnits Median Price
Bank Properties
Units
Non-Bank Properties
% Non-Bank Median Price
Full Market
Nov-14 252,950182 145 8 4.4 129,475 174 95.6 257,450Oct-14 231,700260 131 5 1.9 176,000 255 98.1 234,990Sep-14 224,282226 150 4 1.8 142,450 222 98.2 228,500Aug-14 209,900219 124 10 4.6 72,500 209 95.4 218,000Jul-14 204,500178 126 5 2.8 255,000 173 97.2 200,000Jun-14 217,400206 147 8 3.9 89,000 198 96.1 222,500May-14 226,450202 143 7 3.5 94,900 195 96.5 231,000Apr-14 189,000205 133 7 3.4 79,900 198 96.6 189,950Mar-14 184,900161 172 11 6.8 105,000 150 93.2 194,950Feb-14 184,000187 154 6 3.2 87,000 181 96.8 185,000Jan-14 185,750174 161 14 8.0 97,450 160 92.0 206,701Dec-13 179,000277 160 10 3.6 122,500 267 96.4 182,000Nov-13 183,046188 134 10 5.3 107,450 178 94.7 184,950
&ODUXV�0DUNHW0HWULFV� 12/12/2014Information not guaranteed. © 2014 - 2015 Terradatum and its suppliers and licensors (www.terradatum.com/about/partners).
22/

Nov-2013 vs Nov-2014: The number of for sale properties is down -23% and the number of sold properties is up 14%
Bulman Real Estate | 281.450.8689
Nov-2013 vs. Nov-2014
2,633 -23
Jeff Bulman
2,0261RY�����
Supply & Demand by Month
&KDQJH1RY����� �-607
1RY����� 1RY����� �302 14
Nov-2013 vs. Nov-2014
345&KDQJH
43
&ODUXV�0DUNHW0HWULFV� 12/12/2014Information not guaranteed. © 2014 - 2015 Terradatum and its suppliers and licensors (www.terradatum.com/about/partners).
1/2
MLS: HAR Bedrooms:AllAll
Construction Type:All1 Year Monthly SqFt:
Bathrooms: Lot Size:All All Square FootagePeriod:All
Counties:Property Types: : Single-Family
GalvestonPrice:
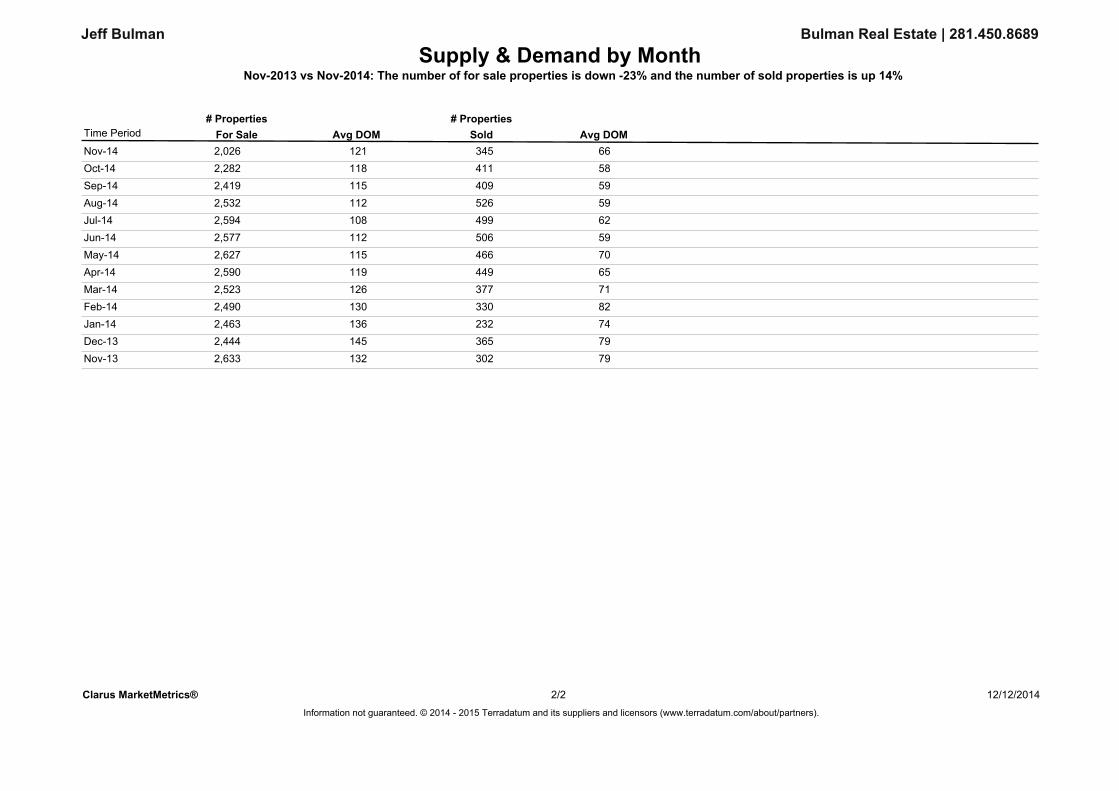
Supply & Demand by MonthNov-2013 vs Nov-2014: The number of for sale properties is down -23% and the number of sold properties is up 14%
Jeff Bulman Bulman Real Estate | 281.450.8689
For Sale Sold# Properties
Avg DOM Avg DOM# Properties
Time Period
Nov-14 121 662,026 345Oct-14 118 582,282 411Sep-14 115 592,419 409Aug-14 112 592,532 526Jul-14 108 622,594 499Jun-14 112 592,577 506May-14 115 702,627 466Apr-14 119 652,590 449Mar-14 126 712,523 377Feb-14 130 822,490 330Jan-14 136 742,463 232Dec-13 145 792,444 365Nov-13 132 792,633 302
&ODUXV�0DUNHW0HWULFV� 12/12/2014Information not guaranteed. © 2014 - 2015 Terradatum and its suppliers and licensors (www.terradatum.com/about/partners).
22/
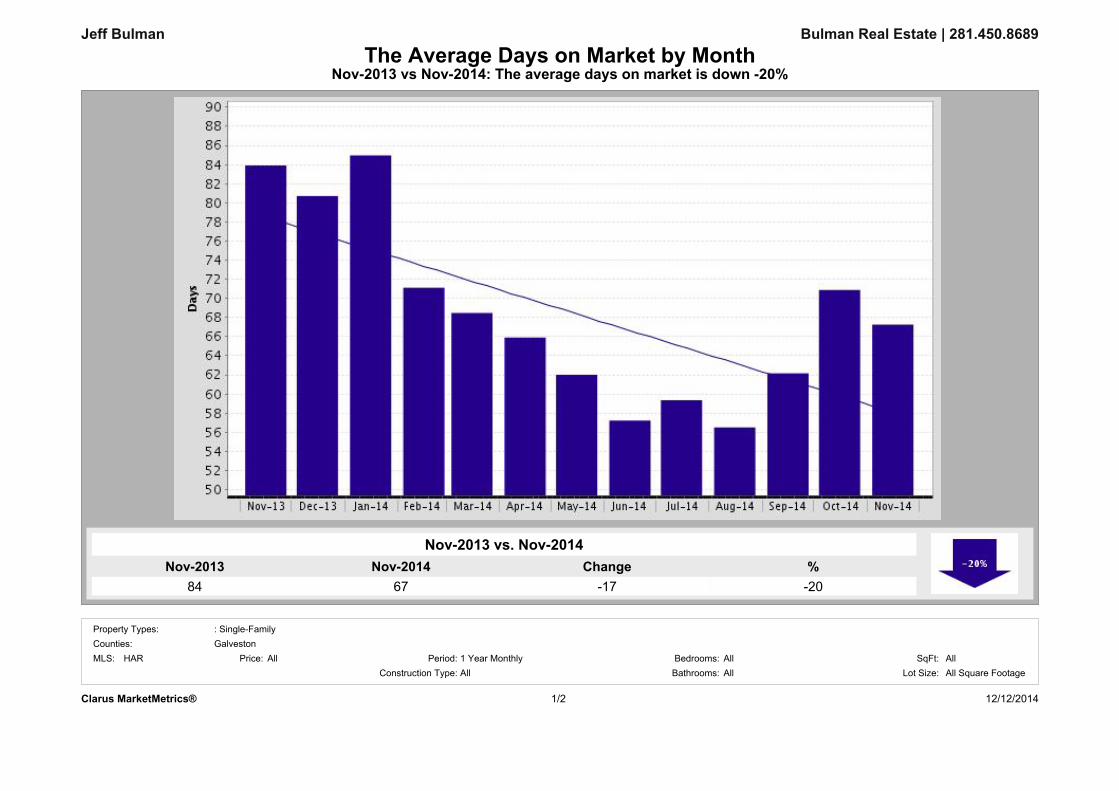
1RY�����67
1RY�����84
�-20
&KDQJH-17
Nov-2013 vs Nov-2014: The average days on market is down -20%The Average Days on Market by Month
Bulman Real Estate | 281.450.8689
Nov-2013 vs. Nov-2014
Jeff Bulman
GalvestonAll 1 Year Monthly
Counties:Period:Price:
Property Types: : Single-Family
12/12/20141/2&ODUXV�0DUNHW0HWULFV�
All Square FootageBedrooms: All AllSqFt:
All Lot Size:Bathrooms:AllConstruction Type:MLS: HAR
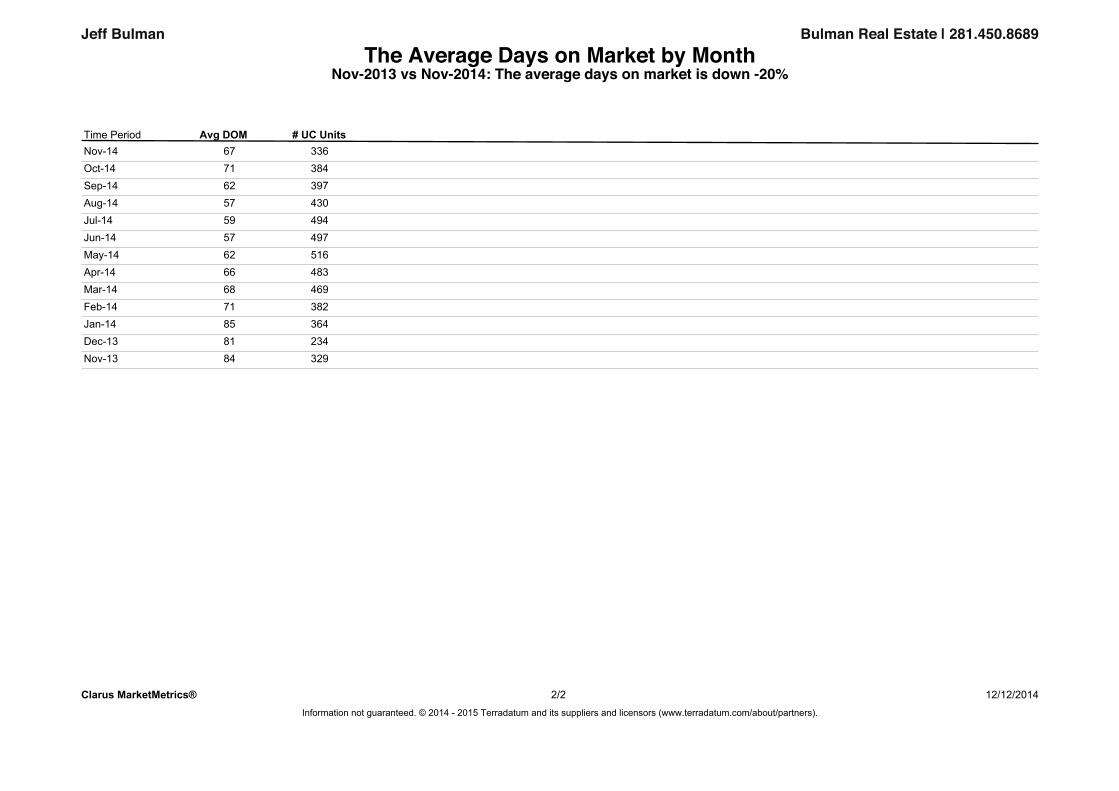
The Average Days on Market by MonthNov-2013 vs Nov-2014: The average days on market is down -20%
Bulman Real Estate | 281.450.8689Jeff Bulman
# UC UnitsAvg DOMTime PeriodNov-14 33667Oct-14 38471Sep-14 39762Aug-14 43057Jul-14 49459Jun-14 49757May-14 51662Apr-14 48366Mar-14 46968Feb-14 38271Jan-14 36485Dec-13 23481Nov-13 32984
&ODUXV�0DUNHW0HWULFV� 2/2 12/12/2014Information not guaranteed. © 2014 - 2015 Terradatum and its suppliers and licensors (www.terradatum.com/about/partners).
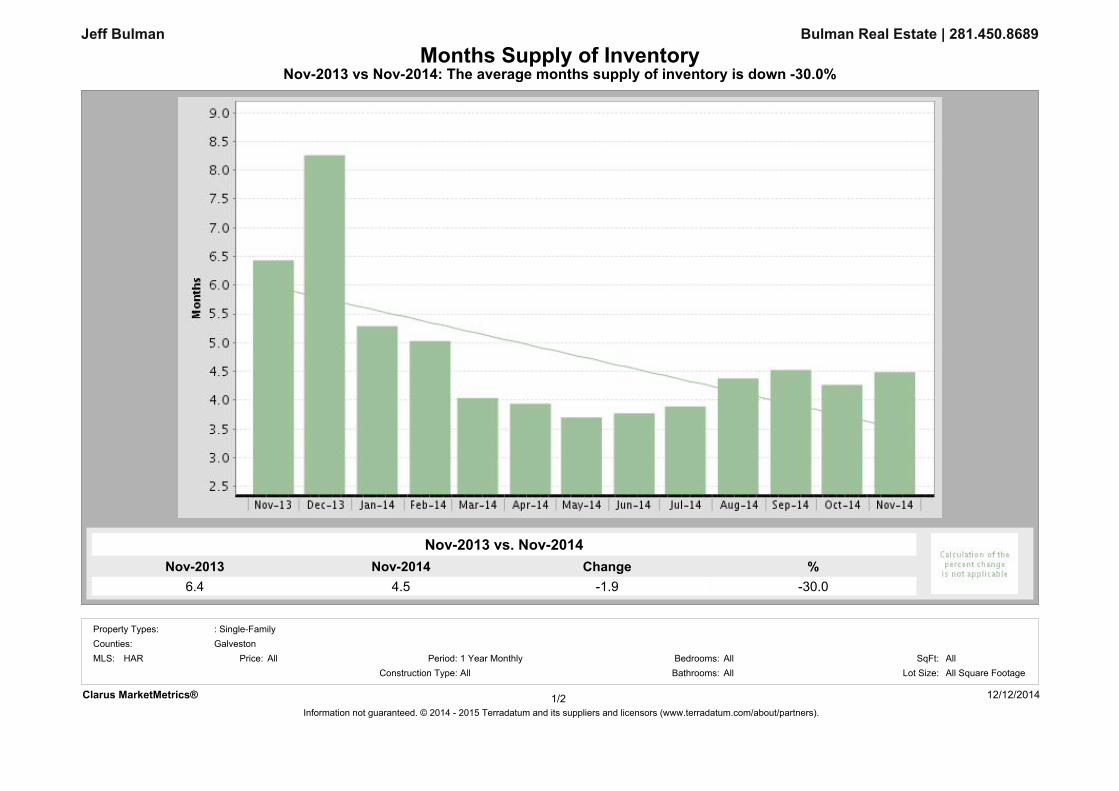
Nov-2013 vs Nov-2014: The average months supply of inventory is down -30.0%
Bulman Real Estate | 281.450.8689
Nov-2013 vs. Nov-2014
6.4 -30.0
Jeff Bulman
4.51RY�����
Months Supply of Inventory
&KDQJH1RY����� �-1.9
&ODUXV�0DUNHW0HWULFV� 12/12/2014Information not guaranteed. © 2014 - 2015 Terradatum and its suppliers and licensors (www.terradatum.com/about/partners).
1/2
MLS: HAR Bedrooms:AllAll
Construction Type:All1 Year Monthly SqFt:
Bathrooms: Lot Size:All All Square FootagePeriod:All
Counties:Property Types: : Single-Family
GalvestonPrice:
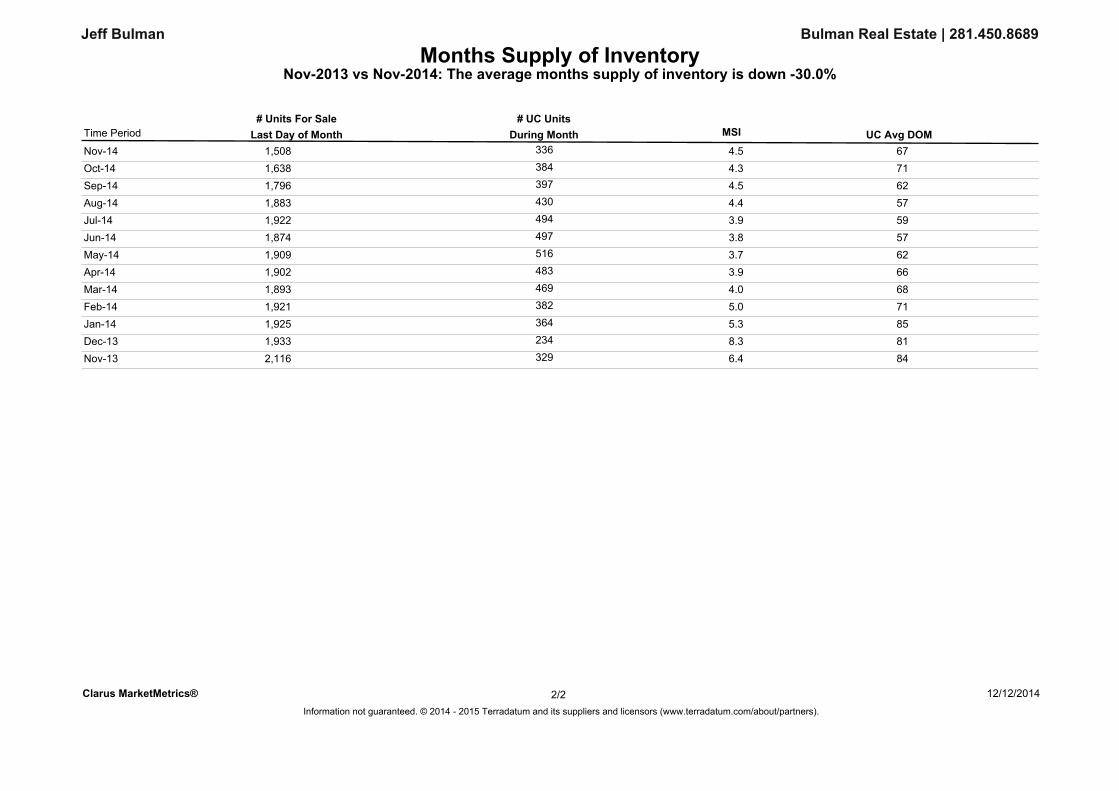
Months Supply of InventoryNov-2013 vs Nov-2014: The average months supply of inventory is down -30.0%
Jeff Bulman Bulman Real Estate | 281.450.8689
During MonthLast Day of Month MSI# Units For Sale # UC Units
UC Avg DOMTime Period
Nov-14 336 671,508 4.5Oct-14 384 711,638 4.3Sep-14 397 621,796 4.5Aug-14 430 571,883 4.4Jul-14 494 591,922 3.9Jun-14 497 571,874 3.8May-14 516 621,909 3.7Apr-14 483 661,902 3.9Mar-14 469 681,893 4.0Feb-14 382 711,921 5.0Jan-14 364 851,925 5.3Dec-13 234 811,933 8.3Nov-13 329 842,116 6.4
&ODUXV�0DUNHW0HWULFV� 12/12/2014Information not guaranteed. © 2014 - 2015 Terradatum and its suppliers and licensors (www.terradatum.com/about/partners).
22/