Embed Size (px)
Citation preview

Kevin J. Thorpe, Chief Economist
March 2016
The U.S. Economy, CRE Outlook and 2016 Investment Ideas

The U.S. Economy & CRE Outlook

© Copyright 2016 Cushman & Wakefield. All rights reserved.
Tumultuous Start to 2016 DJIA and CBOE Indicators
The DOW has plunged 10% to start the year and the CBOE volatility index, a solid measure of investor angst, had essentially doubled.
10
14
18
22
26
30CBOE VIX
15,50016,00016,50017,00017,50018,00018,500
DJIA
Source: CBOE, SIX Financial Information
Dow Jones Plunge
CBOE Volatility Jumps

© Copyright 2016 Cushman & Wakefield. All rights reserved.
Stock Market Corrections – Don’t Tell Us Much S&P 500 Movements vs. Recessions (1990-present)
0
500
1,000
1,500
2,000
2,500
1990
1993
1996
1999
2002
2005
2008
2011
2014
-20%* -9%
-20%* -9% -10%
-19%
-49% -57%
-16%
-19%
-10%
-10%
-8%
-6%
-6%
-7% -12%
-9%
Source: S&P Dow Jones Indices, National Bureau of Economic Research, Cushman & Wakefield Research
Lots of corrections, few recessions
Only 5 of 39 stock market corrections since 1950 have signaled a U.S. recession. In the current cycle, demand for CRE has remained strong through 10 corrections. However, a continued downturn could drag down consumer spending, labor markets, and eventually demand for CRE.

© Copyright 2016 Cushman & Wakefield. All rights reserved.
Tumultuous Start to 2016
Source: Commercial Mortgage Alert
CMBS Spreads Widen
CMBS Issuance Slows
80
100
120
140
16010-Year AAA Swap
02468
101214
D J 2015 F M A M J J A S O N D J 2016 F
CMBS Issuance, $bil.
As Wall Street anxiety seeps into CRE, should investors monetize core assets? Shift real estate portfolios away from risky assets and refocus on core? Or just wait to see if it blows over?

© Copyright 2016 Cushman & Wakefield. All rights reserved.
What Caused the Volatility? China
Source: Yahoo Finance, Cushman & Wakefield Research
2500
3000
3500
4000
4500
5000
5500
Shanghai Composite Index
Aug 11th - surprise devaluation of the yuan Economic links between China
and U.S. highly overstated
China’s GDP is still growing at 6-7%
China’s service sector is strong
China has tremendous fiscal resources
BUT
China’s Equity Plunge
Jan 2 – stock selling ban uncertainty
China’s equity plunge caused anxiety despite its strong fiscal resources and weak correlation with the U.S. economy.

© Copyright 2016 Cushman & Wakefield. All rights reserved.
What Caused the Volatility? The U.S. Dollar
Source: Federal Reserve, Cushman & Wakefield Research
It’s a function of a strengthening economy
Puts downward pressure on oil and commodity prices
A stronger U.S. dollar has never caused a recession
Makes foreign goods cheaper for U.S. consumers
BUT
Strengthening U.S. Dollar
90
95
100
105
110
115
120
125
130
U.S. Dollar Broad Index
A strengthening U.S. dollar has never caused a recession but puts downward pressure on commodity prices and hurts U.S. manufacturing.

© Copyright 2016 Cushman & Wakefield. All rights reserved.
What Caused the Volatility? Oil
Source: Moody’s Analytics, Cushman & Wakefield Research
Cheap gas is a tax break for consumers
Lowers business costs
Low oil is consistent with strong periods of U.S. GDP growth
Most CRE markets will benefit via multiplier effect
BUT
Plunge in Oil
35
45
55
65
75
85
95
105
115
2012
Q2
2012
Q3
2012
Q4
2013
Q1
2013
Q2
2013
Q3
2013
Q4
2014
Q1
2014
Q2
2014
Q3
2014
Q4
2015
Q1
2015
Q2
2015
Q3
2015
Q4
2016
Q1
2016
Q2
2016
Q3
2016
Q4
2017
Q1
2017
Q2
2017
Q3
2017
Q4
BaselineStronger Growth ScenarioLow Oil Price Scenario
Brent Crude
The plunge in oil prices is causing discomfort, yet is favorable for lower costs for consumers and businesses.

© Copyright 2016 Cushman & Wakefield. All rights reserved.
Deflation is Still a Threat Consumer Price Index, % Change
Source: Oxford Economics, Cushman & Wakefield Research
-1
-0.5
0
0.5
1
1.5
2
2.5
3
3.5
2013 2014 2015
Germany Asia SpainDenmark Italy EurozoneSweden
Why should U.S. investors be concerned about deflation outside of the U.S.? If prices fall, that will in turn shrink business profits, which leads to job losses, which leads to further price cuts, then even more job losses.
Prices Fall
Profits Shrink
Job Loss
Prices Fall Further
Profits Shrink
Job Loss
Deflation by Country Potential Downward Spiral

© Copyright 2016 Cushman & Wakefield. All rights reserved.
Combatting the Threat with Negative Interest Rates Goal: Boost Economic Growth and Inflation
Source: Oxford Economics, Cushman & Wakefield Research
Central Bank Rates
Negative of the Negative
-1-0.5
00.5
11.5
22.5
2011
Q1
2011
Q3
2012
Q1
2012
Q3
2013
Q1
2013
Q3
2014
Q1
2014
Q3
2015
Q1
2015
Q3
2016
Q1
Eurozone
Japan
Denmark
Switzerland
Sweden
Looks panicky
Eats away at bank profits
Could create currency wars
Consumers will hoard cash
Negative interest rates combat deflation, but will the strategy work? It’s a wait-and-see, as it’s never been done before.

© Copyright 2016 Cushman & Wakefield. All rights reserved.
Driving Even More Foreign Capital to the U.S.
Source: Federal Reserve, Cushman & Wakefield Research
M2 Money Supply
U.S. 10-Year Treasury Yield
11000
11500
12000
12500
Jan
2014
Feb
2014
Mar
201
4
Apr 2
014
May
201
4
Jun
2014
Jul 2
014
Aug
2014
Sep
2014
Oct
201
4
Nov
201
4
Dec
201
4
Jan
2015
Feb
2015
Mar
201
5
Apr 2
015
May
201
5
Jun
2015
Jul 2
015
Aug
2015
Sep
2015
Oct
201
5
Nov
201
5
Dec
201
5
Jan
2016
M2 Money Supply, $bil.
1.7
1.9
2.1
2.3
10/2
3/15
11/6
/15
11/2
0/15
12/4
/15
12/1
8/15
1/1/
16
1/15
/16
1/29
/16
2/12
/16
2/26
/16
10-Yr Treasury Yield Adopts Negative Rate Policy
Europe
Japan
It is clear that the negative interest rate policy is driving even more capital to the United States.

© Copyright 2016 Cushman & Wakefield. All rights reserved.
Global Private Capital Fundraising for CRE
Source: Preqin, Cushman & Wakefield Research Forecast
706
600
$0
$100
$200
$300
$400
$500
$600
$700
$80019
95
1996
1997
1998
1999
2000
2001
2002
2003
2004
2005
2006
2007
2008
2009
2010
2011
2012
2013
2014
2015
2016
F
Aggregate Capital Raised, $Bill.
Recent strong fundraising for CRE is due, in part, to volatility in other asset classes such as oil, commodities, and stocks causing capital to be rechanneled to real estate.

© Copyright 2016 Cushman & Wakefield. All rights reserved.
U.S. Job Growth Is Booming Strongest Job Growth Years Since 1990
Source: U.S. Bureau of Labor Statistics
0
0.5
1
1.5
2
2.5
3
3.5
4
1994 1998 1997 1999 1995 2014 2000 1989 2015 1996
Job Growth, Mill.
1st
6th 9th
Full potential of job growth has not been felt because productivity is weaker than normal; underemployment is still elevated; labor force participation has been weak; wage growth has been weak. From a CRE perspective, no single factor is more important than job creation – and that remains very healthy.

© Copyright 2016 Cushman & Wakefield. All rights reserved.
127
129
131
133
135
137
139
141
143
145
Nov
200
0
Jul 2
002
Mar
200
4
Nov
200
5
Jul 2
007
Mar
200
9
Nov
201
0
Jul 2
012
Mar
201
4
Nov
201
5
Total Nonfarm, mils
U.S. Employment Growth
Source: U.S. Bureau of Labor Statistics
Monthly Change (000’s): Job losses peak to trough: 8,716,000
Job gains in recovery: 13,251,000 Total Nonfarm
Office -Using
Dec 2014 292 77
Jan 2015 221 31
Feb 2015 265 52
Mar 2015 84 36
Apr 2015 251 86
May 2015 273 91
Jun 2015 228 99
Jul 2015 277 71
Aug 2015 150 45
Sep 2015 149 56
Oct 2015 295 107
Nov 2015 280 48
Dec 2015 271 78
Jan 2016 172 35
Feb 2016 242 41
Job growth surged in February and job openings remain at record levels indicating businesses still want to hire aggressively.

© Copyright 2016 Cushman & Wakefield. All rights reserved.
Investors are Drawn to the Jobs Major Markets: Top 25 Job-Producing Cities in 2015
Source: BLS, Oxford Economics, RCA, Cushman & Wakefield Research
Job losses peak to trough: 8,716,000
Job gains in recovery: 13,251,000
Rank in Job Growth
Rank in Sale Volume Market Job Growth 000's
1 240 New Delhi 204.4 2 1 New York 144.7 3 3 Los Angeles 139.4 4 2 London 122.6 5 11 Dallas 113.2 6 324 Tianjin 106.2 7 47 Beijing 106.1 8 45 Singapore 82 9 13 Atlanta 84.4 10 5 San Francisco 71.4 11 10 Miami 67.8 12 4 Hong Kong 65.1 13 23 Melbourne 60.5 14 15 Seattle 62.6 15 6 DC Metro 60.6 16 19 Houston 57.6 17 8 Chicago 55.4 18 28 Madrid 53.8 19 14 San Jose 53.4 20 20 Phoenix 51.3 21 9 Boston 51.3 22 17 Sydney 48.4 23 N/A Riverside 48.2 24 30 Orlando 44.2 25 21 San Diego 40.6
These 16 U.S. cities accounted for $286 billion in transactions last year, representing 1/3 of global sales activity.

© Copyright 2016 Cushman & Wakefield. All rights reserved.
Corporate Profits Signaling a Recession? Yr/Yr % Change
Source: Bureau of Economic Analysis, National Bureau of Economic Research
Job gains in recovery: 13,251,000
33% of Global Sales Activity
Occurs in these U.S. Cities
-50%
-25%
0%
25%
50%
75%
1949
Q1
1953
Q4
1958
Q3
1963
Q2
1968
Q1
1972
Q4
1977
Q3
1982
Q2
1987
Q1
1991
Q4
1996
Q3
2001
Q2
2006
Q1
2010
Q4
2015
Q3
Recession Corporate Profits
Corporate profits were down 5% in Q3, which is a serious concern.
?

© Copyright 2016 Cushman & Wakefield. All rights reserved.
Probably Not Corporate Profits by Sector (Yr/Yr % Change, Q3 2015 vs Q3 2014)
Source: Bureau of Economic Analysis, National Bureau of Economic Research
Job gains in recovery: 13,251,000
33% of Global Sales Activity
Occurs in these U.S. Cities
-43.0%
-15.0%
-12.8%
-3.2%
-1.1%
2.0%
2.5%
9.5%
12.6%
14.5%
16.3%
17.4%
17.8%
18.5%
19.1%
19.9%
23.9%
34.8%
42.5%
86.7%
-60% -40% -20% 0% 20% 40% 60% 80% 100%
Utilities
Machinery
Petroleum & Coal
Other Nonfinancial
Wholesale Trade
Other Durable Goods
Financial
Fabricated Metal
Non-Durable
Retail
Manufacturing
Electrical Equip & Components
Other Non-Durable Goods
Food & Beverage
Information
Durable Goods
Chemical Products
Transport & Warehousing
Computer & Electronics
Motor Vehicles & Parts
Only 3.5% of total domestic profits
6.6% of total domestic
16% of total domestic profits
Outside of energy, most businesses and sectors in the U.S. economy are growing. It is projected that corporate profits in non-energy sectors grew by 3% in Q4 2015.

© Copyright 2016 Cushman & Wakefield. All rights reserved.
U.S. Macro Forecast Updated February 26, 2016
Source: Various, Cushman & Wakefield Research Forecasts
Job gains in recovery: 13,251,000
33% of Global Sales Activity
Occurs in these U.S. Cities
>> Click here for full analysis from our latest U.S. Macro Report
2015 2016 Annual Q2 Q3 Q4 Q1 Q2 Q3 Q4 2015 2016 2017
U.S. Economy Real GDP, % 3.9 2.0 1.0 1.1 2.9 3.0 3.2 2.5 2.4 2.8 Nonfarm Employment, 000 610 623 720 726 763 636 520 2,890 2,645 2,329 Office-using Employment, 000 219 192 210 198 195 136 184 827 713 666 Unemployment Rate, % 5.4 5.2 5.0 4.9 4.8 4.7 4.8 5.3 4.8 4.9 Retail Sales & Food Services, % 6.8 4.5 0.8 6.1 5.7 4.7 3.6 2.1 4.8 4.4 CPI Inflation, % 3.0 1.6 0.8 0.8 1.4 2.2 2.1 0.2 1.6 2.1 CCI 96 98 96 99 104 102 103 98 102 104 Fed Funds Rate, % 0.1 0.1 0.2 0.3 0.5 0.8 0.8 0.1 0.6 1.6 10-year Gov't Bond, % 2.0 2.2 2.2 2.0 2.1 2.5 2.7 2.3 2.4 2.9 ISM Manufacturing Index 52.6 51.3 49.7 47.6 48.1 50.0 51.0 51.6 49.2 54.3 West Texas Intermediate, $/bbl 58 47 42 36 38 42 49 49 41 57 Office Sector Net Absorption, msf 22.7 20.8 21.3 20.7 23.2 21.7 20.9 81.8 86.5 77.4 Vacancy 14.4% 14.2% 13.9% 13.7% 13.5% 13.1% 13.1% 14.2% 13.4% 13.0% Asking Rents $27.45 $27.91 $28.28 $28.46 $28.60 $29.00 $29.26 $27.72 $28.83 $30.13 Industrial Sector Net Absorption, msf 61.7 55.9 62.8 52.1 61.8 59.3 47.1 234.7 220.3 154.0 Vacancy 7.7% 7.5% 7.2% 7.0% 6.9% 7.0% 7.0% 7.5% 7.0% 7.1% Asking Rents $5.35 $5.37 $5.45 $5.50 $5.59 $5.64 $5.74 $5.36 $5.62 $5.99 Retail Sector* Net Absorption, msf 9.5 13.9 11.2 10.4 12.1 14.8 9.0 40.0 46.3 37.5 Vacancy 7.8% 7.6% 7.5% 7.3% 7.2% 7.0% 6.9% 7.7% 7.1% 7.3% Asking Rents $23.14 $23.10 $23.24 $23.40 $23.34 $23.75 $23.85 $22.92 $23.59 $24.06

Top CRE Investment Ideas

Buy Government Towns
#9

© Copyright 2016 Cushman & Wakefield. All rights reserved.
Buy Government Towns Worst of Fiscal Drag is Over
With history as a guide, when tax revenues are coming in, the government finds a way to spend them.
Source: Congressional Budget Office, OMB
Federal Deficit Has Stabilized Deficit spending as % of GDP
Federal Spending Will Grow
-10%-8%-6%-4%-2%0%
2006
2007
2008
2009
2010
2011
2012
2013
2014
2015
2016
2017
2018
2019
2020
CBO - Forecast OMB - Forecast Moody's - Forecast
-4%
1%
6%
11%
16%
21%
1990
1991
1992
1993
1994
1995
1996
1997
1998
1999
2000
2001
2002
2003
2004
2005
2006
2007
2008
2009
2010
2011
2012
2013
2014
2015
e
2016
e
2017
e
2018
e
2019
e
2020
e
Federal Outlays YOY Growth
Average

© Copyright 2016 Cushman & Wakefield. All rights reserved.
2014 2015 Trend
DC Metro 19.3 60.6
NoVa 1.0 25.3
Baltimore 12.4 28.0
Buy Government Towns
Source: Consolidated Report on Federal Funds, BLS, Cushman & Wakefield Research
Highest Fed Spend Major Markets
0% 10% 20% 30% 40%
U.S.
Baltimore
Northern VA
DC Metro
Fed Spending as % GDP
Job Growth Momentum, 000’s
Cap Rate Spread vs. Peers
DC 5.8%
New York 4.4%
Spread 140 bps
Baltimore 7.0%
Oakland 6.3%
Spread 70 bps
When federal spending increased last year, job growth in the DC, Northern Virginia and Baltimore markets began to soar.

Buy Sunbelt Markets
#8
© Copyright 2016 Cushman & Wakefield. All rights reserved.
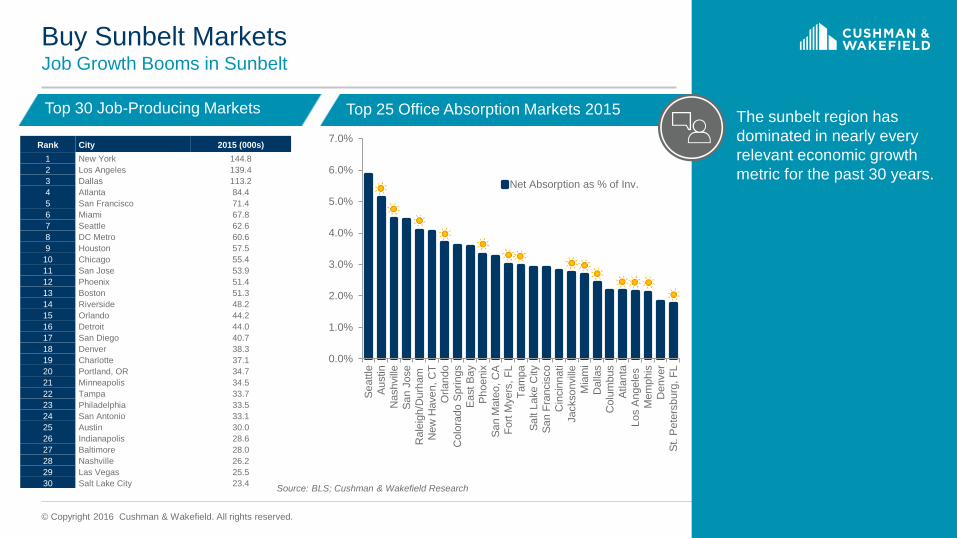
Buy Sunbelt Markets Job Growth Booms in Sunbelt
Top 30 Job-Producing Markets Top 25 Office Absorption Markets 2015
Rank City 2015 (000s) 1 New York 144.8 2 Los Angeles 139.4 3 Dallas 113.2 4 Atlanta 84.4 5 San Francisco 71.4 6 Miami 67.8 7 Seattle 62.6 8 DC Metro 60.6 9 Houston 57.5 10 Chicago 55.4 11 San Jose 53.9 12 Phoenix 51.4 13 Boston 51.3 14 Riverside 48.2 15 Orlando 44.2 16 Detroit 44.0 17 San Diego 40.7 18 Denver 38.3 19 Charlotte 37.1 20 Portland, OR 34.7 21 Minneapolis 34.5 22 Tampa 33.7 23 Philadelphia 33.5 24 San Antonio 33.1 25 Austin 30.0 26 Indianapolis 28.6 27 Baltimore 28.0 28 Nashville 26.2 29 Las Vegas 25.5 30 Salt Lake City 23.4
0.0%
1.0%
2.0%
3.0%
4.0%
5.0%
6.0%
7.0%
Seat
tleAu
stin
Nas
hville
San
Jose
Ral
eigh
/Dur
ham
New
Hav
en, C
TO
rland
oC
olor
ado
Spr
ings
East
Bay
Phoe
nix
San
Mat
eo, C
AFo
rt M
yers
, FL
Tam
paSa
lt La
ke C
itySa
n Fr
anci
sco
Cin
cinn
ati
Jack
sonv
illeM
iam
iD
alla
sC
olum
bus
Atla
nta
Los
Ang
eles
Mem
phis
Den
ver
St. P
eter
sbur
g, F
L
Net Absorption as % of Inv.
The sunbelt region has dominated in nearly every relevant economic growth metric for the past 30 years.
Source: BLS; Cushman & Wakefield Research

Sell Core to Aggressive Foreign Capital
#7

© Copyright 2016 Cushman & Wakefield. All rights reserved.
Sell Core to Aggressive Foreign Capital
Source AFIRE, Cushman & Wakefield Research
Job gains in recovery: 13,251,000
% of Foreign Capital in 2015
10%
12%
17%
18%
22%
23%
28%
31%
39%
53%
0% 10% 20% 30% 40% 50% 60%
Chicago
Los Angeles
DC VA burbs
Atlanta
Houston
Seattle
Boston
San Francisco
Manhattan
DC
Foreign investors are attracted to trophy office space in gateway cities and have been paying a premium for it.
AFIRE’s Top U.S. Targets
1. New York
2. Los Angeles
3. San Francisco
4. Washington, DC
5. Boston and Seattle

Buy Secondary Tech Markets
#6

© Copyright 2016 Cushman & Wakefield. All rights reserved.
Waves of Innovation
Source:The Kondratiev Cycles
33% of Global Sales Activity
Occurs in these U.S. Cities
The Kondratiev Cycles | Long-term Technology & Growth Cycles
1785 1845 2020 1990 1950 1900
Inno
vatio
n
Iron Water power
Mechanization Textiles
Commerce
Steam power Railroad
Steel Cotton
Electricity Chemicals
Combustion engine
Petrochemicals Electronics
Aviation Space
Digital networks Biotechnology
Software IT 1st
2nd 3rd
4th
5th
6th
Hydraulic fracking 3D printing Mobile tech
Social media Data mining
Cloud computing Bioscience
Green chemistry
The tech boom is not just a hot trend; although the trajectory will bend at times, the current wave of innovation will drive economic growth for many years.

© Copyright 2016 Cushman & Wakefield. All rights reserved.
Tech Hubs and Office Rent Growth Percent of Jobs in Technology Industries & Change in Rent Since 2010
Source: Cushman & Wakefield Research
U.S. 6.5%
Seattle 10.7%
Portland 11.9%
San Francisco 110.8%
San Jose 36.2%
Denver/Boulder 19.0%
Austin 30.6%
Washington, DC 6.1%
New York 53.0%
Boston 18.2%
9.9% 8.2%
9.6%
8.8%
12%
26.5%
10.6%
8.7%
7.6%
4.7% Technology sectors share of workforce
Change in rent since 2010
Core tech markets are hot and engines remain strong, but are bumping up against labor shortages and housing affordability issues.

© Copyright 2016 Cushman & Wakefield. All rights reserved.
Buy Secondary Tech Markets
Salt Lake City, UT High tech employment has risen by 25% since 2010. Housing very affordable.
Oakland, CA 12 miles from tech hub SF/San Jose; office vacancy of 12% vs. 5.7% in SF. Rents 64% cheaper.
Los Angeles - Downtown West LA vacancy is 11.6%; rest of LA 15-20% vacant, $20 rent delta suggests demand will spread.
Northern VA Proximity to DC, highly educated, elevated office vacancy of 20% due to gov’t spending cuts; lots of trained gov’t contractors looking for work.
Atlanta, GA Midtown drawing tech firms from suburban locations. 66% of residents are Gen Y or Gen Z. 90% success rate for tech firms.
Chicago, IL Tech-related hiring exploding downtown/River North. Huge talent pool and concentration of service sectors. Expanding footprint while finance/law are downsizing. Known for tech incubators.
Minneapolis, MN Hottest in periphery of Minneapolis core — central locations, but not typical class A office space. Warehouse District (the main tech center) and near-downtown locations are drawing demand.
Phoenix, AZ Low cost of living, doing business (rents, home prices). Some major firms already are shifting back-end office here due to cost advantage. South Scottsdale and Tempe North markets attracting tenants despite high rents due to “Live/Work/Play” atmosphere.
Raleigh-Durham, NC Downtown Durham is being revitalized as old tobacco warehouses are turning mixed-use. Despite highest rents, continues to draw demand from tech tenants. Similar story for Raleigh’s Downtown.
Midtown Manhattan Tech firms (TAMI), not Wall Street, are gobbling up space in Midtown South where vacancy is now 6.6%. Tech will roll into Downtown/Financial District where vacancy 2x higher & rents $15 cheaper.

Buy Europe
#5

© Copyright 2016 Cushman & Wakefield. All rights reserved.
Monetary Policy Divergence The Fed vs. ECB
Source: Federal Reserve Bank, Moody’s Analytics, Federal Reserve Bank of St. Louis (FRED; ECB)
$0
$1
$2
$3
$4
$520
05Q
1
2006
Q1
2007
Q1
2008
Q1
2009
Q1
2010
Q1
2011
Q1
2012
Q1
2013
Q1
2014
Q1
2015
Q1
2016
Q1
2017
Q1
Trill
ions
While the Fed tightens policy in the U.S., the ECB launches a massive monetary stimulus program in Europe. If it worked in the U.S. might it also work in Europe?

© Copyright 2016 Cushman & Wakefield. All rights reserved.
Office Rent Growth: Who’s Hot, Who’s Not Prime Rents: % Change Q3 2015/Q3 2014
Source: Cushman & Wakefield Research
-10%
-5%
0%
5%
10%
15%
20%
HOT
NOT
Leasing fundamentals in Dublin and London are hot, but as quantitative easing trickles into the broader economy, expect to see significant run-up in values throughout Europe.

Buy Industrial Infill
#4

© Copyright 2016 Cushman & Wakefield. All rights reserved.
Follow the Supply Chain
Source: Cushman & Wakefield Research
The “sweet spots” are areas between population centers, railroads and the interstate highways which have a geographical advantage to get products to large population centers.
KEY Sweet Spots Intermodal, Inland Ports, and Inland Population Centers

© Copyright 2016 Cushman & Wakefield. All rights reserved.
Follow the Supply Chain
Source: Cushman & Wakefield Research
70% of all U.S. industrial absorption occurred in these markets in 2015.

© Copyright 2016 Cushman & Wakefield. All rights reserved.
Buy Infill Warehouse 2015 Change in Rents by Type (Yr/Yr, % Change)
4.3% 3.6%
8.8%
0%
2%
4%
6%
8%
10%
All Industrial Distribution/E-commerce Infill Warehouse
Source: CoStar, Cushman & Wakefield Research
Infill warehouse rent increases in 2015 were double those of other industrial categories.

Buy Class A Neighborhood Shopping Centers
#3

© Copyright 2016 Cushman & Wakefield. All rights reserved.
Buy Class A Neighborhood Shopping Centers
Source: Real Capital Analytics, Cushman & Wakefield Research
Retail Cap Rates By Product Type More Upside in Secondary Markets
Boston Chicago LA Miami New York Philadelphia San
Francisco DC
Regional Mall
(All Classes) 6.1% 7.3% 6.3% 6.0% 6.0% 6.4% 6.1% 6.3%
Regional Mall
(Class A) 4.7% 5.1% 4.3% 4.6% 4.0% 4.6% 4.0% 4.4%
Shopping Centers
(Class A) 6.9% 7.5% 6.6% 7.0% 6.0% 7.0% 5.9% 6.7%
Urban Retail (All Classes) 5.4% 6.5% 5.6% 5.6% 5.2% 5.8% 5.1% 5.3%
Urban Retail (Class A) 4.4% 5.1% 4.9% 4.5% 4.0% 4.5% 4.0% 4.6%
Market Cap Rate (2015)
Nashville 7.5%
Minneapolis 7.4%
Charlotte 7.4%
Atlanta 6.9%
Dallas 6.8%
Baltimore 6.4%
Philadelphia 6.3%
There is room for cap rate compression in class A neighborhood shopping centers.

Build/Buy Multifamily in Non-Gateways
#2

© Copyright 2016 Cushman & Wakefield. All rights reserved.
Multifamily Markets with Lower Vacancy than U.S. Average As of Q4 2015
67% of the U.S. has vacancy
below 5%
The apartment sector is booming across the country. You don’t have to play in the major metros to do well in multifamily.
Source: REIS
Rank Vacancy < 3%
1 New Haven 2 Central New Jersey 3 Sacramento 4 Rochester 5 Syracuse 6 Detroit 7 Oakland-East Bay 8 Buffalo 9 San Bernardino/Riverside
10 San Diego 11 Tacoma
Vacancy < 5% 33 Omaha 34 San Francisco 35 Suburban Maryland 36 Wichita 37 Knoxville 38 Miami 39 St. Louis 40 Fort Worth 41 Northern New Jersey 42 Salt Lake City 43 Tampa-St. Petersburg 44 Richmond 45 U.S. Average = 4.4% 46 Fort Lauderdale 47 Charlotte 48 Greenville 49 Kansas City 50 Suburban Virginia 51 Phoenix 52 Tucson 53 Las Vegas
Vacancy < 4% 12 Orange County 13 Providence 14 Ventura County 15 New York 16 Cincinnati 17 Westchester 18 Cleveland 19 Long Island 20 Los Angeles 21 Philadelphia 22 Hartford 23 Albuquerque 24 Baltimore 25 Dayton 26 Chicago 27 Colorado Springs 28 Milwaukee 29 Pittsburgh 30 Lexington 31 Minneapolis 32 San Jose

Don’t Bet Against the Cycle Quite Yet
#1

© Copyright 2016 Cushman & Wakefield. All rights reserved.
Don’t Bet Against the Cycle
This may be the longest expansion in the history of United States.
Probability Expansion Continues A Few Points to Keep in Mind:
84%
78%
80%
82%
84%
86%
88%
90%
92%
94% Leading indicators still okay
U.S. financial system is sound
Tailwinds still exist: M2 money
supply surge, low interest rates and low oil
Central banks are still stimulating
Source: Moody’s

Kevin J. Thorpe, Chief Economist
March 2016
The U.S. Economy, CRE Outlook and 2016 Investment Ideas