Embed Size (px)
Citation preview
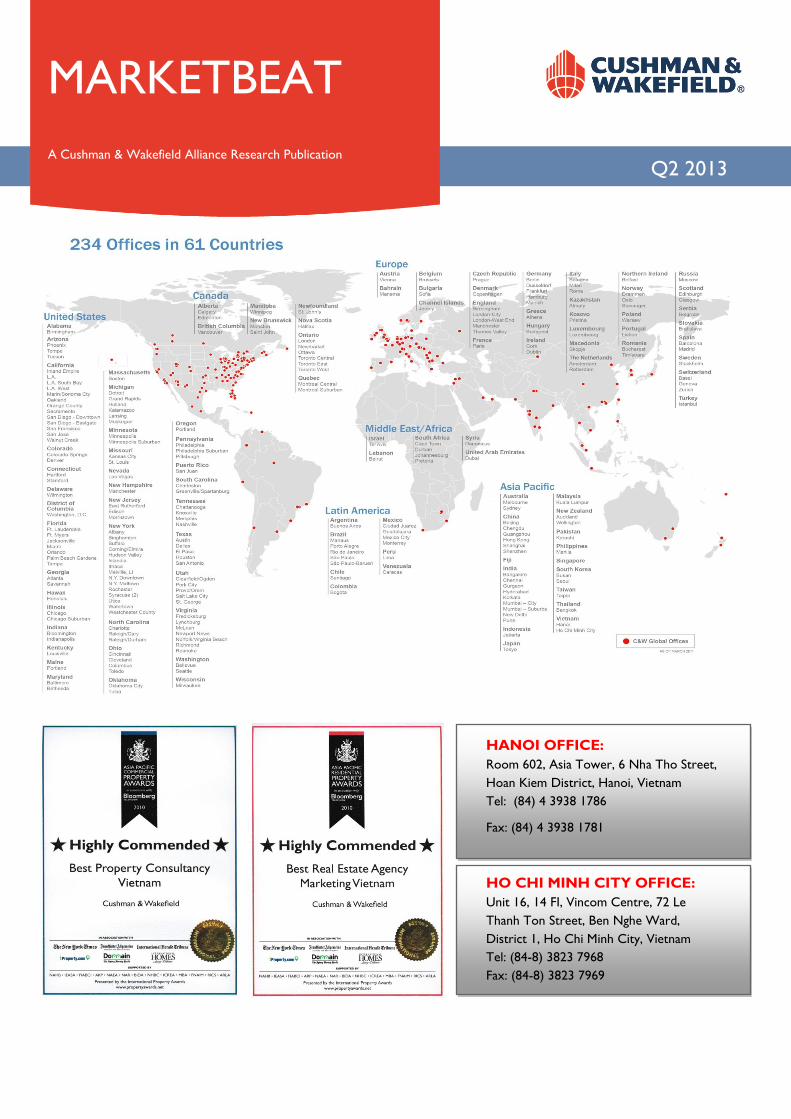
Cushman & Wakefield Vietnam Unit 602, Asia Tower 6 Nha Tho Str., Hoan Kiem Dist Hanoi www.cushmanwakefield.com/knowledge
For more information, contact: Jonathan Tizzard, Associate Director +(84) 93 986 4192 [email protected]
The market terms and definitions in this report are based on NAIOP standards. No warranty or representation, express or implied, is made to the accuracy or completeness of the information contained herein, and same is submitted subject to errors, omissions, change of price, rental or other conditions, withdrawal without notice, and to any special listing conditions imposed by our principals. © 2012 Cushman & Wakefield, Inc. All rights reserved.
ECONOMIC OVERVIEW During the first half of the year, CPI rose by 6.73% compared to the same period of 2012. It is forecasted that CPI for the whole of 2013 will total circa 6.2%. With regard to GDP, Q2 witnessed an increase of 5% in
comparison with the same period of 2012.
Total new registered and additional FDI during the first six month of the year reached approximately US$10.5 billion, increasing by 15.9% when compared to the same period last year. The property sector still ranks second in total FDI, after manufacturing, with circa US$419.7 million, accounting for approximately 4% of total investment. A total of 41 countries have newly registered FDI into Vietnam in the first half of this year, Singapore continues to be the leading investor, accounting for 40% of total new investment into Vietnam, followed by Russia (17.5%) and Japan (16.5%). GRADE B STOCK CONTINUES TO INCREASE In Q2 2013, total stock for Grade A remains unchanged from the previous quarter at approximately 330,000 square meters (sq m). However, Grade B supply continues to increase. Two Grade B office projects completed in Q2 2013, namely VCCI Tower totaling 28,000 sq m (Dong Da District) and TD Building totaling 4,200 sq m (Hoan Kiem District), which raised the total stock of Grade B to approximately 589,000 sq m - an increase of 6% quarter-on-quarter.
GRADE B ASKING RENTS SLIGHTLY DECREASE Asking rents for Grade A this quarter were stable when compared with Q1 2013 ranging from VND651,000 to VND1,060,000 per sq m per month (from US$25 to US$50 per sq m per month). The average asking rent for Grade A is around VND665,000 ( US$31.7 per sq m per month) (*).
Average asking rent for Grade B declined 2% q-o-q and 6% y-o-y, at around VND405,000 (US$19.3) per sq m per month (*).
Grade A occupancy rate reached around 75%, up 2.5% q-o-q and 3% y-o-y . Due to an additional supply of 32,000 sq m from two new office buildings, Grade B occupancy stood at circa 76%, which declined 2% q-o-q but up by 1% y-o-y.
(*)SERVICE CHARGE INCLUDED, VAT EXCLUDED
OUTLOOK
Grade A average asking rents in the CBD remained stable during Q2 2013. Conversely average asking rent for Grade A in the non-CBD area is likely to follow a downward trend in the next two quarters due to high vacancy rates in existing office buildings. In addition, a new Grade A office building named EVN Twin Towers is due to come online at the end of this year which will create more pressure in rents in the non-CBD areas.
More than 800,000 sq m of space across all grades is forecast to come to the market during the next two years, of which only 3% of total supply will be located in the CBD area. The West area of the city is an attractive destination for office occupiers due to the competitive rentals and large incentives on offer from developers.
STATS ON THE GO
Q2 2013 Q-O-Q CHANGE
Y-O-Y CHANGE
12 MONTH FOREC
AST Grade A Overall Vacancy 25% -2.5% -3%
Grade A Overall Rents US$31.7 0% 0%
Grade A Absorption (sq m) 8,900 11% -58%
ECONOMIC INDICATORS
VIETNAM 2011 2012 2013F GDP Growth 5.89% 5.6% 5.9%
CPI Growth 18.58% 10% 6.2%
Unemployment 5% 5% 4.5% SOURCE: GSO, IMF
DIRECT RENTAL VS. VACANCY RATES
Q2 2013 HANOI, VIETNAM
OFFICE SNAPSHOT MARKETBEAT
A Cushman & Wakefield Research Publication
0%
5%
10%
15%
20%
25%
30%
35%
40%
30
32
34
36
38
40
42
2Q11 3Q11 4Q11 1Q12 2Q12 3Q12 4Q12 1Q13 2Q13
US
$/sq
m/m
th
Grade A overall rent Vacancy
Cushman & Wakefield Vietnam Unit 602, Asia Tower 6 Nha Tho Str., Hoan Kiem Dist Hanoi www.cushmanwakefield.com/knowledge
For more information, contact: Jonathan Tizzard, Associate Director +(84) 93 986 4192 [email protected]
The market terms and definitions in this report are based on NAIOP standards. No warranty or representation, express or implied, is made to the accuracy or completeness of the information contained herein, and same is submitted subject to errors, omissions, change of price, rental or other conditions, withdrawal without notice, and to any special listing conditions imposed by our principals. © 2012 Cushman & Wakefield, Inc. All rights reserved.
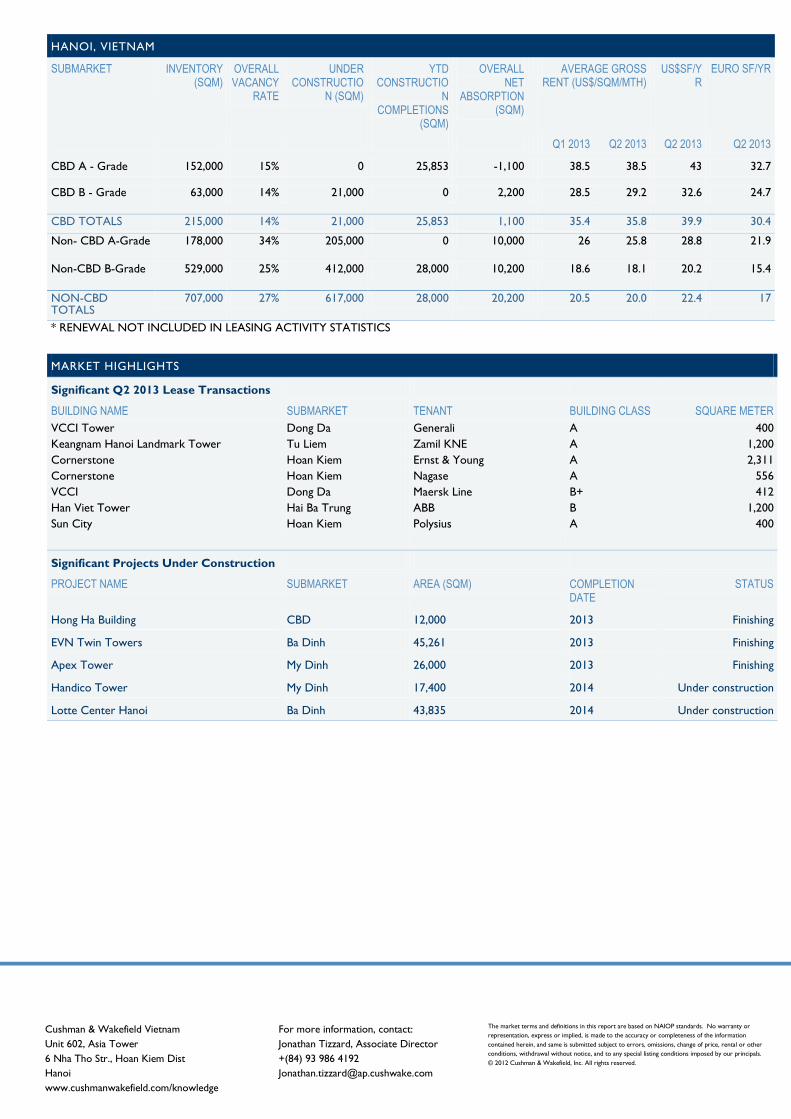
HANOI, VIETNAM
SUBMARKET INVENTORY (SQM)
OVERALL VACANCY
RATE
UNDER CONSTRUCTIO
N (SQM)
YTD CONSTRUCTIO
N COMPLETIONS
(SQM)
OVERALL NET
ABSORPTION (SQM)
AVERAGE GROSS RENT (US$/SQM/MTH)
US$SF/YR
EURO SF/YR
Q1 2013 Q2 2013 Q2 2013 Q2 2013
CBD A - Grade 152,000 15% 0 25,853 -1,100 38.5 38.5 43 32.7
CBD B - Grade 63,000 14% 21,000 0 2,200 28.5 29.2 32.6 24.7
CBD TOTALS 215,000 14% 21,000 25,853 1,100 35.4 35.8 39.9 30.4 Non- CBD A-Grade 178,000 34% 205,000 0 10,000 26 25.8 28.8 21.9
Non-CBD B-Grade 529,000 25% 412,000 28,000 10,200 18.6 18.1 20.2 15.4
NON-CBD TOTALS
707,000 27% 617,000 28,000 20,200 20.5 20.0 22.4 17
* RENEWAL NOT INCLUDED IN LEASING ACTIVITY STATISTICS
MARKET HIGHLIGHTS
Significant Q2 2013 Lease Transactions
BUILDING NAME SUBMARKET TENANT BUILDING CLASS SQUARE METER VCCI Tower Keangnam Hanoi Landmark Tower Cornerstone Cornerstone VCCI Han Viet Tower Sun City
Dong Da Tu Liem Hoan Kiem Hoan Kiem Dong Da Hai Ba Trung Hoan Kiem
Generali Zamil KNE Ernst & Young Nagase Maersk Line ABB Polysius
A A A A B+ B A
400 1,200 2,311
556 412
1,200 400
Significant Projects Under Construction
PROJECT NAME SUBMARKET AREA (SQM) COMPLETION DATE
STATUS
Hong Ha Building CBD 12,000 2013 Finishing
EVN Twin Towers Ba Dinh 45,261 2013 Finishing
Apex Tower My Dinh 26,000 2013 Finishing
Handico Tower My Dinh 17,400 2014 Under construction
Lotte Center Hanoi Ba Dinh 43,835 2014 Under construction
Cushman & Wakefield Vietnam Unit 602, Asia Tower 6 Nha Tho Str., Hoan Kiem Dist Hanoi www.cushmanwakefield.com/knowledge
This report contains information available to the public and has been relied upon by Cushman & Wakefield on the basis that it is accurate and complete. Cushman & Wakefield accepts no responsibility if this should prove not to be the case. No warranty or representation, express or implied, is made to the accuracy or completeness of the information contained herein, and same is submitted subject to errors, omissions, change of price, rental or other conditions, withdrawal without notice, and to any special listing conditions imposed by our principals. ©2012 Cushman & Wakefield, Inc. All rights reserved..
ECONOMY During the first half of the year, CPI rose by 6.73% compared to the same period in 2012. It is forecast that CPI for 2013 will total approximately 6.2%. With regard to GDP, Q2 witnessed an increase of 5% in
comparison with the same period of 2012. Total new registered and additional Foreign Direct Investment (FDI) during the first six months of the year reached US$10.5 billion, an increase of 15.9% when compared to the same period last year. The property sector still ranks second in total FDI after manufacturing, with circa US$419.7 million of investment accounting for approximately 4% of total FDI. A total of 41 countries have newly registered FDI in Vietnam in the first half of this year. Singapore continues to be the leading investor, accounting for 40% of total new investment into Vietnam, followed by Russia (17.5%) and Japan (16.5%). SUPPLY There was no new supply coming online in this quarter. Currently Hanoi has around 679, 000 sq m of retail space including shopping centres/department stores, retail podiums, supermarkets, electronic marts and wholesale markets. Shopping centers/department stores take the lead position in terms of market share, occupying over 50%. Some shopping centres have been closed for upgrading and restructuring such as Grand Plaza Hanoi and Hang Da Market. In addition, Mipec Tower is also planning to be renovated soon. MARKET PERFORMANCE In Q2 2013, the average asking rent (ground floor only) of the whole retail market stayed the same as the previous quarter, with VND1,050,000 per sq m per month (US$50) for shopping centres and VND1,470,000 per sq m per month (US$70) for retail podium (VAT excluded, service charge included). The CBD area has the highest asking rent, with a range of VND840,000 – VND4,200,000 per sq m per month (US$40 – US$200), depending on the area, location and tenants’ brand. Roughly 90% of retail space (shopping centres/department stores and retail podium only) was occupied in this quarter, representing a 6% increase y-o-y (mainly due to some weak performing shopping centres closing for restructuring).
The Old Quarters are always the preferred location for the street shops because this area has the highest foot traffic in the city. Some streets such as Hang Bong, Dinh Tien Hoang and Le Thai To are likely to be the most desirable places for both new and well-known brands. In this quarter, the inquiries have mainly come from tenants in the accessories and cosmetic sectors.
OUTLOOK Over the next two years, it is expected that 650,000 sq m of space will enter the retail market. Vincom Mega Mall - Royal City which is planning to open in August 2013 will add around 230,000 sq m of retail space. The turnover from retail sales is expected to increase by 8.5% per year in the 2013-15 period, with food and foodstuff being the most important products.
The retail industry in the country, which has a population of 88 million people, still holds huge potential despite local consumers tightening their spending in recent years.
ECONOMIC INDICATORS NATIONAL 2011 2012 Q2 2013 GDP Growth 5.89% 5.03% 5%
CPI Growth 18.6% 9.2% 6.73%
Retail Turnover 24.2% 16% 5.1%
PRIME RETAIL RENTS – Q2 2013 MAINSTREETS MIL VND
SQM/MTH EURO
SF/MTH US$
SF/MTH Q-O-Q CHANGE Y-O-Y CHANGE
Trang Tien 1.6 - 4.2 5.4 - 14.2 7.1 -18.6 0.0% 0.0%
Ba Trieu 1.05 - 1.6 3.5 - 14.2 4.6 -18.6 -10% -20%
Pho Hue 1.05 - 1.6 3.5 -14.2 4.6 -18.6 -10% -20%
Thai Ha 1.05 - 1.6 3.5 - 14.2 4.6 -18.6 -10% -20%
Lang Ha 0.8 - 1.2 2.67 - 4.04 3.5 - 5.3 -10% -30%
MALLS MIL VND SQM/MTH (*)
EURO SF/YR
US$ SF/YR
Q-O-Q CHANGE Y-O-Y CHANGE
Vincom City Towers Trang Tien Plaza
2.06
4.6
6.9
15.5
9.1
20.4
0%
0%
-18%
- Parkson Viet Tower Savico Megamall
2.16
0.68
7.3
2.28
9.6
3.0
0%
0%
0%
-23% Note: (*) average asking rents for ground floor
SIGNIFICANT PROJECTS UNDER CONSTRUCTION PROPERTY LOCATION SQUARE
METERS EXPECTED
COMPLETION DATE
Vincom Mega Mall Royal City
Thanh Xuan 230,000 Q3 2013
Cho Mo Plaza Lotte Center Hanoi Vicom Mega Mall – Times City
Hai Ba Trung Ba Dinh Hai Ba Trung
23,000
34,682
230,000
2014
2014
2014
HANOI/VIETNAM
MANCHESTER
MANCHESTER
RETAIL SNAPSHOT
RETAIL SNAPSHOT
MARKETBEAT
A Cushman & Wakefield Research Publication
Q2 2013
Cushman & Wakefield Vietnam Unit 602, Asia Tower 6 Nha Tho Str., Hoan Kiem Dist Hanoi www.cushmanwakefield.com/knowledge
For more information, contact: Jonathan Tizzard, Associate Director +(84) 93 986 4192 [email protected]
This report has been produced by Cushman & Wakefield LLP for use by those with an interest in commercial property solely for information purposes. It is not intended to be a complete description of the markets or developments to which it refers. The report uses information obtained from public sources which Cushman & Wakefield LLP believe to be reliable, but we have not verified such information and cannot guarantee that it is accurate and complete. No warranty or representation, express or implied, is made as to the accuracy or completeness of any of the information contained herein and Cushman & Wakefield LLP shall not be liable to any reader of this report or any third party in any way whatsoever. All expressions of opinion are subject to change. Our prior written consent is required before this report can be reproduced in whole or in part. Should you not wish to receive information from Cushman & Wakefield LLP or any related company, please email [email protected] with your details in the body of your email as they appear on this communication and head it “Unsubscribe”. ©2012 Cushman & Wakefield LLP All rights reserved.
1
Q2 2013 HANOI, VIETNAM
SERVICED APARTMENT
MARKETBEAT
A Cushman & Wakefield Research Publication
ECONOMIC OVERVIEW During the first half of the year, CPI rose by 6.73% compared to the same period of 2012. It is forecasted that CPI for the whole of 2013 will total circa 6.2%. With regard to GDP, Q2 witnessed an increase of 5% in
comparison with the same period of 2012. Total new registered and additional FDI during the first six month of the year reached approximately US$10.5 billion, increasing by 15.9% when compared to the same period last year. The property sector still ranks second in total FDI, after manufacturing, with circa US$419.7 million, accounting for approximately 4% of total investment. A total of 41 countries have newly registered FDI into Vietnam in the first half of this year, Singapore continues to be the leading investor, accounting for 40% of total new investment into Vietnam, followed by Russia (17.5%) and Japan (16.5%). NEW GRADE B SUPPLY COMING ONLINE Total stock in all grades this quarter is just over 3,000 units, an increase of 3% q-o-q and 23% y-o-y. Grade A represents the highest market share with 57% of total supply, followed by Grade B with 34%. Tay Ho and Ba Dinh districts occupy the biggest market share with 27% and 25% respectively.
Grade A serviced apartment supply has no change in comparison with the previous quarter but has witnessed an increase of 28% compared to the same period last year. The total number of Grade A serviced apartment is 1,750 units. Meanwhile, Grade B has witnessed an additional supply from one new project namely Candeo Hotels located in Ba Dinh District (69 units), therefore the total stock reached 1,054 units, up by 7% q-o-q and 20% y-o-y.
INCREASE IN ASKING RENTS The average asking rent in the Grade A segment in this quarter rose slightly compared to Q1 2013, at roughly VND700,000 per sq m per month, equating to over US$33.5 per sq m per month (VAT excluded but service charge included) representing an increase of 1% q-o-q and 3% y-o-y.
Due to the new projects in the Grade B segment offering higher prices than the average price of other projects, the quoting rents stood at VND470,000 per sq m per month, equating to just over US$22.5 per sq m per month, (VAT excluded but service charge included), an increase of 5% q-o-q and 7% y-o-y.
Grade A serviced apartments maintained an occupancy rate of 84%, an increase of 1% q-o-q but on par with the same period last year. Meanwhile, Grade B occupancy rate stood at around 80% which is the same as the previous quarter but down by 11% y-o-y.
OUTLOOK The serviced apartment market is still witnessing the trend of converting condominium apartments into serviced apartments. Therefore the supply is expected to increase in the short term.
It is forecast that an additional supply of approximately 600 serviced apartments will be released to the market by the end of 2014, of which 43% will be located in Ba Dinh District.
RENTAL VALUES AS OF Q2 2013
SUBMARKET AVERAGE RENT
VND/SQM/MTH
% CHANGE SHORT TERM OUTLOOK Q-O-Q Y-O-Y
GRADE A CBD 715,000 8% 2% Non – CBD 710,000 0% 3%
GRADE B CBD 366,000 3% -5% Non - CBD 488,000 7% 9%
Grade A & B Overall Rental Vs. Occupancy Rate Q2 2013
50%
55%
60%
65%
70%
75%
80%
85%
90%
95%
100%
0
100,000
200,000
300,000
400,000
500,000
600,000
700,000
800,000
VND
/sqm
/mon
th
Grade A - Rent Grade B - Rent
Grade A - Occupancy Grade B - Occupancy
Cushman & Wakefield Vietnam Unit 602, Asia Tower 6 Nha Tho Str., Hoan Kiem Dist Hanoi www.cushmanwakefield.com/knowledge
For more information, contact: Jonathan Tizzard, Associate Director +(84) 93 986 4192 [email protected]
This report has been produced by Cushman & Wakefield LLP for use by those with an interest in commercial property solely for information purposes. It is not intended to be a complete description of the markets or developments to which it refers. The report uses information obtained from public sources which Cushman & Wakefield LLP believe to be reliable, but we have not verified such information and cannot guarantee that it is accurate and complete. No warranty or representation, express or implied, is made as to the accuracy or completeness of any of the information contained herein and Cushman & Wakefield LLP shall not be liable to any reader of this report or any third party in any way whatsoever. All expressions of opinion are subject to change. Our prior written consent is required before this report can be reproduced in whole or in part. Should you not wish to receive information from Cushman & Wakefield LLP or any related company, please email [email protected] with your details in the body of your email as they appear on this communication and head it “Unsubscribe”. ©2012 Cushman & Wakefield LLP All rights reserved.
2
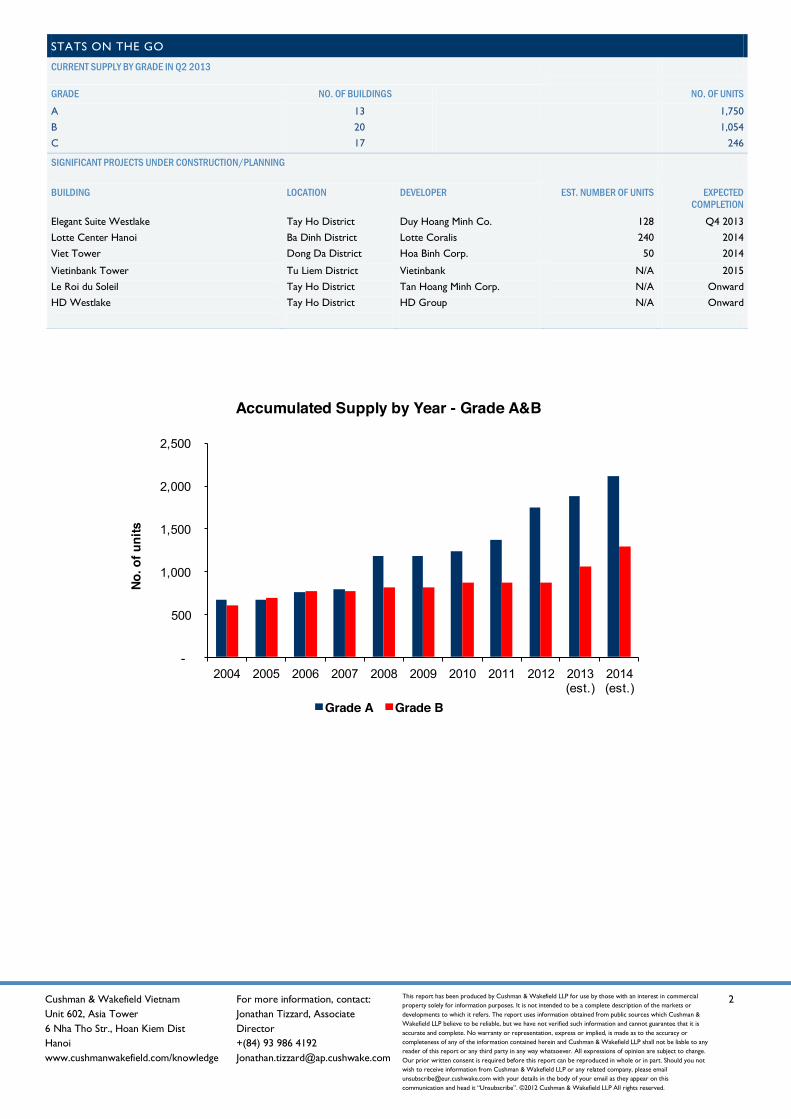
STATS ON THE GO CURRENT SUPPLY BY GRADE IN Q2 2013
GRADE NO. OF BUILDINGS NO. OF UNITS
A B C
13 20 17
1,750 1,054
246
SIGNIFICANT PROJECTS UNDER CONSTRUCTION/PLANNING
BUILDING LOCATION DEVELOPER EST. NUMBER OF UNITS EXPECTED COMPLETION
Elegant Suite Westlake Lotte Center Hanoi Viet Tower
Tay Ho District Ba Dinh District Dong Da District
Duy Hoang Minh Co. Lotte Coralis Hoa Binh Corp.
128 240 50
Q4 2013 2014 2014
Vietinbank Tower Le Roi du Soleil HD Westlake
Tu Liem District Tay Ho District Tay Ho District
Vietinbank Tan Hoang Minh Corp. HD Group
N/A N/A N/A
2015 Onward Onward
-
500
1,000
1,500
2,000
2,500
2004 2005 2006 2007 2008 2009 2010 2011 2012 2013 (est.)
2014 (est.)
No. o
f uni
ts
Accumulated Supply by Year - Grade A&B
Grade A Grade B
Unit 602, Asia Tower 6 Nha Tho Str., Hoan Kiem Dist Hanoi Tel: +(84-4) 3938 1786 www.cushmanwakefield.com
For more information, contact: Jonathan Tizzard, Associate Director +(84) 93 986 4192 [email protected]
This report has been produced by Cushman & Wakefield LLP for use by those with an interest in commercial property solely for information purposes. It is not intended to be a complete description of the markets or developments to which it refers. The report uses information obtained from public sources which Cushman & Wakefield LLP believe to be reliable, but we have not verified such information and cannot guarantee that it is accurate and complete. No warranty or representation, express or implied, is made as to the accuracy or completeness of any of the information contained herein and Cushman & Wakefield LLP shall not be liable to any reader of this report or any third party in any way whatsoever. All expressions of opinion are subject to change. Our prior written consent is required before this report can be reproduced in whole or in part. Should you not wish to receive information from Cushman & Wakefield LLP or any related company, please email [email protected] with your details in the body of your email as they appear on this communication and head it “Unsubscribe”. ©2012 Cushman & Wakefield LLP All rights reserved.
1
Q2 2013 HANOI, VIETNAM
RESIDENTIAL FOR SALE
MARKETBEAT
A Cushman & Wakefield Research Publication
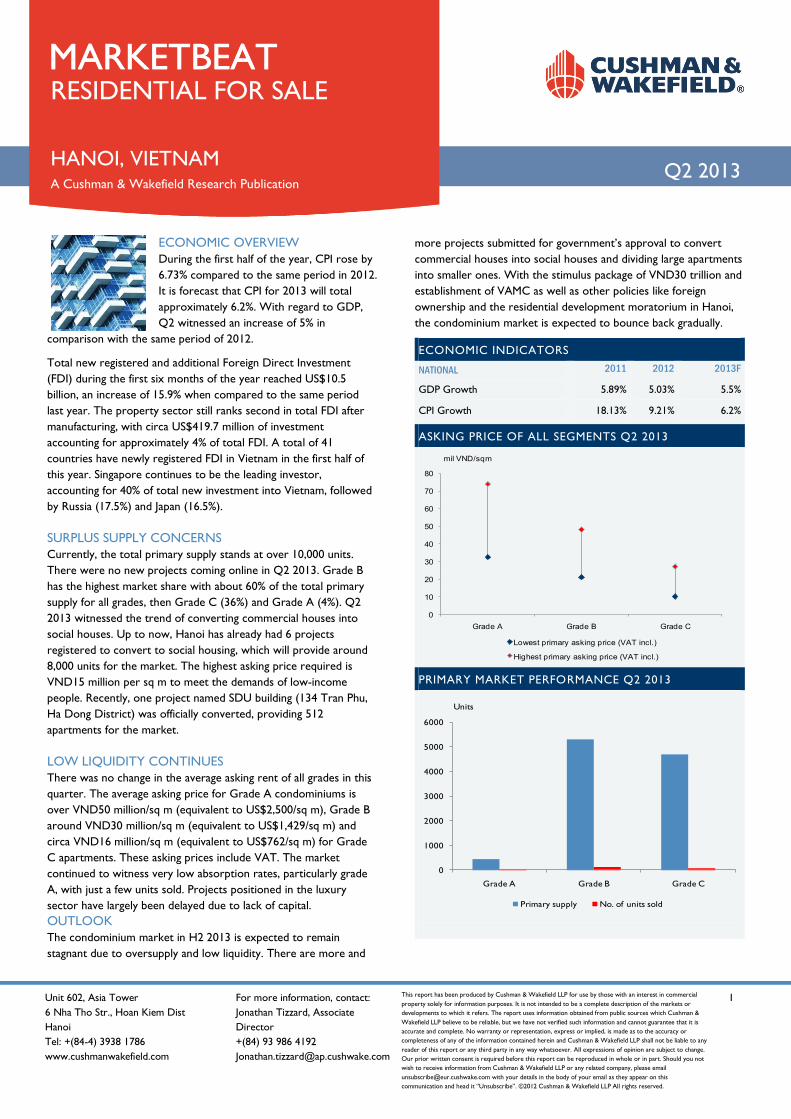
ECONOMIC OVERVIEW During the first half of the year, CPI rose by 6.73% compared to the same period in 2012. It is forecast that CPI for 2013 will total approximately 6.2%. With regard to GDP, Q2 witnessed an increase of 5% in
comparison with the same period of 2012.
Total new registered and additional Foreign Direct Investment (FDI) during the first six months of the year reached US$10.5 billion, an increase of 15.9% when compared to the same period last year. The property sector still ranks second in total FDI after manufacturing, with circa US$419.7 million of investment accounting for approximately 4% of total FDI. A total of 41 countries have newly registered FDI in Vietnam in the first half of this year. Singapore continues to be the leading investor, accounting for 40% of total new investment into Vietnam, followed by Russia (17.5%) and Japan (16.5%). SURPLUS SUPPLY CONCERNS Currently, the total primary supply stands at over 10,000 units. There were no new projects coming online in Q2 2013. Grade B has the highest market share with about 60% of the total primary supply for all grades, then Grade C (36%) and Grade A (4%). Q2 2013 witnessed the trend of converting commercial houses into social houses. Up to now, Hanoi has already had 6 projects registered to convert to social housing, which will provide around 8,000 units for the market. The highest asking price required is VND15 million per sq m to meet the demands of low-income people. Recently, one project named SDU building (134 Tran Phu, Ha Dong District) was officially converted, providing 512 apartments for the market. LOW LIQUIDITY CONTINUES There was no change in the average asking rent of all grades in this quarter. The average asking price for Grade A condominiums is over VND50 million/sq m (equivalent to US$2,500/sq m), Grade B around VND30 million/sq m (equivalent to US$1,429/sq m) and circa VND16 million/sq m (equivalent to US$762/sq m) for Grade C apartments. These asking prices include VAT. The market continued to witness very low absorption rates, particularly grade A, with just a few units sold. Projects positioned in the luxury sector have largely been delayed due to lack of capital. OUTLOOK The condominium market in H2 2013 is expected to remain stagnant due to oversupply and low liquidity. There are more and
more projects submitted for government’s approval to convert commercial houses into social houses and dividing large apartments into smaller ones. With the stimulus package of VND30 trillion and establishment of VAMC as well as other policies like foreign ownership and the residential development moratorium in Hanoi, the condominium market is expected to bounce back gradually.
ECONOMIC INDICATORS NATIONAL 2011 2012 2013F
GDP Growth 5.89% 5.03% 5.5%
CPI Growth 18.13% 9.21% 6.2%
ASKING PRICE OF ALL SEGMENTS Q2 2013
0
10
20
30
40
50
60
70
80
Grade A Grade B Grade C
mil VND/sqm
Lowest primary asking price (VAT incl.)
Highest primary asking price (VAT incl.)
PRIMARY MARKET PERFORMANCE Q2 2013
0
1000
2000
3000
4000
5000
6000
Grade A Grade B Grade C
Units
Primary supply No. of units sold
MARKETBEAT
Unit 602, Asia Tower 6 Nha Tho Str., Hoan Kiem Dist Hanoi Tel: +(84-4) 3938 1786 www.cushmanwakefield.com
For more information, contact: Jonathan Tizzard, Associate Director +(84) 93 986 4192 [email protected]
This report has been produced by Cushman & Wakefield LLP for use by those with an interest in commercial property solely for information purposes. It is not intended to be a complete description of the markets or developments to which it refers. The report uses information obtained from public sources which Cushman & Wakefield LLP believe to be reliable, but we have not verified such information and cannot guarantee that it is accurate and complete. No warranty or representation, express or implied, is made as to the accuracy or completeness of any of the information contained herein and Cushman & Wakefield LLP shall not be liable to any reader of this report or any third party in any way whatsoever. All expressions of opinion are subject to change. Our prior written consent is required before this report can be reproduced in whole or in part. Should you not wish to receive information from Cushman & Wakefield LLP or any related company, please email [email protected] with your details in the body of your email as they appear on this communication and head it “Unsubscribe”. ©2012 Cushman & Wakefield LLP All rights reserved.
2
STATS ON THE GO
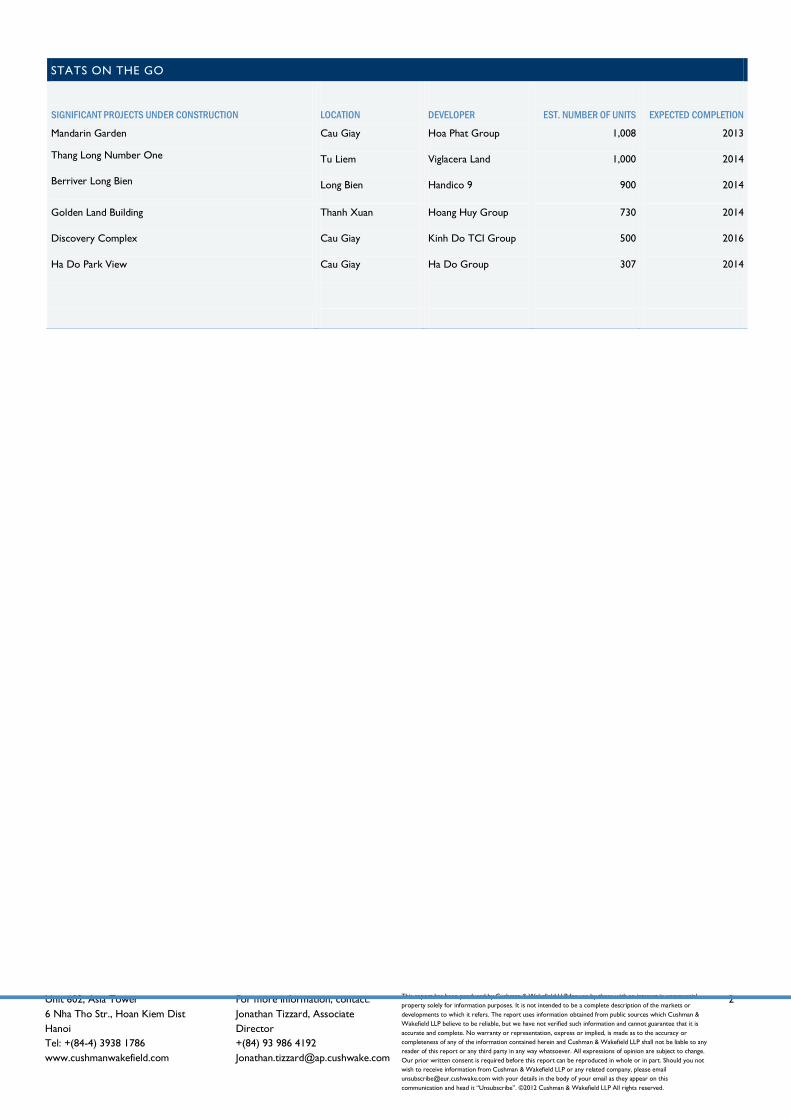
SIGNIFICANT PROJECTS UNDER CONSTRUCTION
LOCATION
DEVELOPER
EST. NUMBER OF UNITS
EXPECTED COMPLETION
Mandarin Garden
Thang Long Number One
Berriver Long Bien
Cau Giay
Tu Liem
Long Bien
Hoa Phat Group
Viglacera Land
Handico 9
1,008
1,000
900
2013
2014
2014
Golden Land Building
Discovery Complex
Ha Do Park View
Thanh Xuan
Cau Giay
Cau Giay
Hoang Huy Group
Kinh Do TCI Group
Ha Do Group
730
500
307
2014
2016
2014
Unit 602, Asia Tower 6 Nha Tho Str., Hoan Kiem Dist Hanoi Tel: +(84-4) 3938 1786 www.cushmanwakefield.com
For more information, contact: Jonathan Tizzard, Associate Director +(84) 93 986 4192 [email protected]
This report has been produced by Cushman & Wakefield LLP for use by those with an interest in commercial property solely for information purposes. It is not intended to be a complete description of the markets or developments to which it refers. The report uses information obtained from public sources which Cushman & Wakefield LLP believe to be reliable, but we have not verified such information and cannot guarantee that it is accurate and complete. No warranty or representation, express or implied, is made as to the accuracy or completeness of any of the information contained herein and Cushman & Wakefield LLP shall not be liable to any reader of this report or any third party in any way whatsoever. All expressions of opinion are subject to change. Our prior written consent is required before this report can be reproduced in whole or in part. Should you not wish to receive information from Cushman & Wakefield LLP or any related company, please email [email protected] with your details in the body of your email as they appear on this communication and head it “Unsubscribe”. ©2012 Cushman & Wakefield LLP All rights reserved.
Q2 2013 HANOI, VIETNAM
INDUSTRIAL SNAPSHOT
MARKETBEAT
A Cushman & Wakefield Research Publication
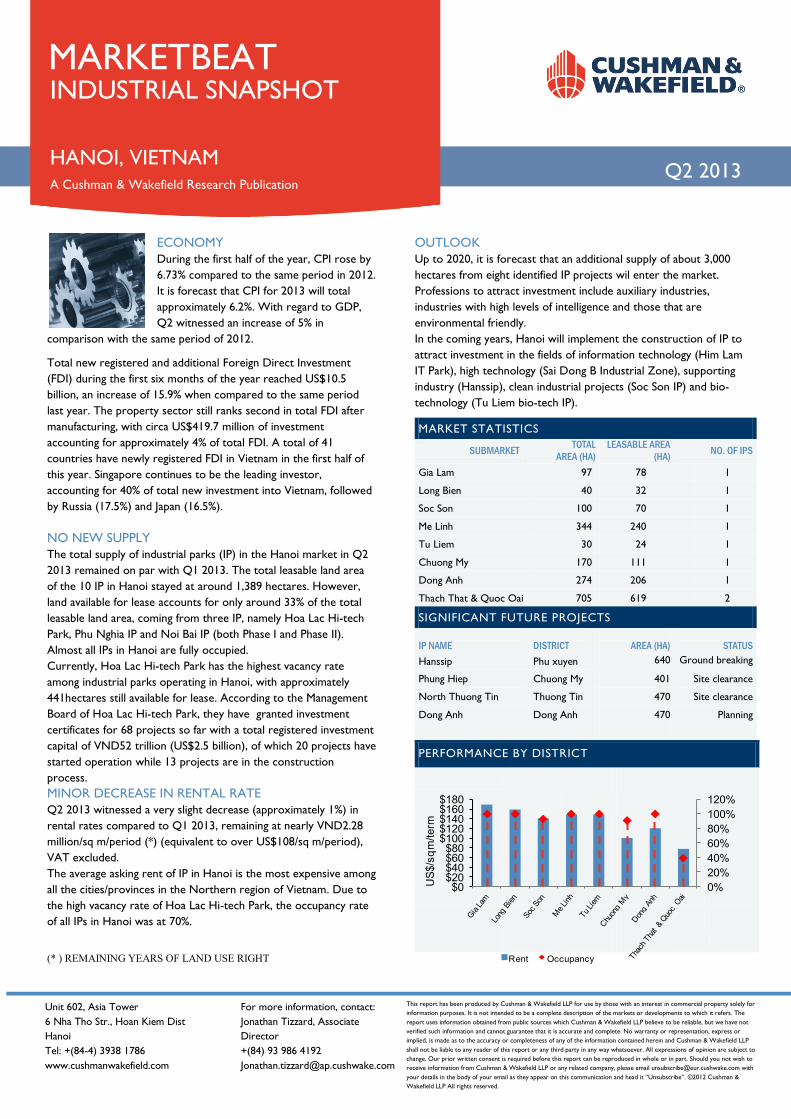
ECONOMY During the first half of the year, CPI rose by 6.73% compared to the same period in 2012. It is forecast that CPI for 2013 will total approximately 6.2%. With regard to GDP, Q2 witnessed an increase of 5% in
comparison with the same period of 2012.
Total new registered and additional Foreign Direct Investment (FDI) during the first six months of the year reached US$10.5 billion, an increase of 15.9% when compared to the same period last year. The property sector still ranks second in total FDI after manufacturing, with circa US$419.7 million of investment accounting for approximately 4% of total FDI. A total of 41 countries have newly registered FDI in Vietnam in the first half of this year. Singapore continues to be the leading investor, accounting for 40% of total new investment into Vietnam, followed by Russia (17.5%) and Japan (16.5%). NO NEW SUPPLY The total supply of industrial parks (IP) in the Hanoi market in Q2 2013 remained on par with Q1 2013. The total leasable land area of the 10 IP in Hanoi stayed at around 1,389 hectares. However, land available for lease accounts for only around 33% of the total leasable land area, coming from three IP, namely Hoa Lac Hi-tech Park, Phu Nghia IP and Noi Bai IP (both Phase I and Phase II). Almost all IPs in Hanoi are fully occupied. Currently, Hoa Lac Hi-tech Park has the highest vacancy rate among industrial parks operating in Hanoi, with approximately 441hectares still available for lease. According to the Management Board of Hoa Lac Hi-tech Park, they have granted investment certificates for 68 projects so far with a total registered investment capital of VND52 trillion (US$2.5 billion), of which 20 projects have started operation while 13 projects are in the construction process. MINOR DECREASE IN RENTAL RATE Q2 2013 witnessed a very slight decrease (approximately 1%) in rental rates compared to Q1 2013, remaining at nearly VND2.28 million/sq m/period (*) (equivalent to over US$108/sq m/period), VAT excluded. The average asking rent of IP in Hanoi is the most expensive among all the cities/provinces in the Northern region of Vietnam. Due to the high vacancy rate of Hoa Lac Hi-tech Park, the occupancy rate of all IPs in Hanoi was at 70%.
OUTLOOK Up to 2020, it is forecast that an additional supply of about 3,000 hectares from eight identified IP projects wil enter the market. Professions to attract investment include auxiliary industries, industries with high levels of intelligence and those that are environmental friendly. In the coming years, Hanoi will implement the construction of IP to attract investment in the fields of information technology (Him Lam IT Park), high technology (Sai Dong B Industrial Zone), supporting industry (Hanssip), clean industrial projects (Soc Son IP) and bio-technology (Tu Liem bio-tech IP).
MARKET STATISTICS
SUBMARKET TOTAL AREA (HA)
LEASABLE AREA (HA) NO. OF IPS
Gia Lam 97 78 1 Long Bien 40 32 1 Soc Son 100 70 1 Me Linh 344 240 1 Tu Liem 30 24 1 Chuong My 170 111 1 Dong Anh 274 206 1 Thach That & Quoc Oai 705 619 2
SIGNIFICANT FUTURE PROJECTS IP NAME Hanssip
DISTRICT Phu xuyen
AREA (HA)
640
STATUS
Ground breaking
Phung Hiep Chuong My 401 Site clearance North Thuong Tin Thuong Tin 470 Site clearance Dong Anh Dong Anh 470 Planning
PERFORMANCE BY DISTRICT
(* ) REMAINING YEARS OF LAND USE RIGHT
0%20%40%60%80%100%120%
$0$20$40$60$80$100$120$140$160$180
US$/sqm/term
Rent Occupancy
Cushman & Wakefield Viet Nam Level 14, Vincom Center Building 72 Le Thanh Ton, District 1, HCMC www.cushmanwakefield.com
For more information, contact: Jonathan Tizzard, Associate Director +(84) 93 986 4192 [email protected]
The market terms and definitions in this report are based on NAIOP standards. No warranty or representation, express or implied, is made to the accuracy or completeness of the information contained herein, and same is submitted subject to errors, omissions, change of price, rental or other conditions, withdrawal without notice, and to any special listing conditions imposed by our principals. © 2012 Cushman & Wakefield, Inc. All rights reserved.
ECONOMIC OVERVIEW
During the first half of the year, CPI rose by 6.73% compared to the same period of 2012. It is forecast that CPI for the whole of 2013 will total circa 6.2%. With regard to GDP, Q2 witnessed an increase of 5% in comparison
with the same period of 2012.
Total new registered and additional FDI during the first six month of the year reached approximately US$10.5 billion, increasing by 15.9% when compared to the same period last year. The property sector still ranks second in total FDI, after manufacturing, with circa US$419.7 million, and accounting for approximately 4% of total investment. A total of 41 countries have newly registered FDI into Vietnam in the first half of this year. Singapore continues to be the leading investor, accounting for 40% of total new investment into Vietnam, followed by Russia (17.5%) and Japan (16.5%).
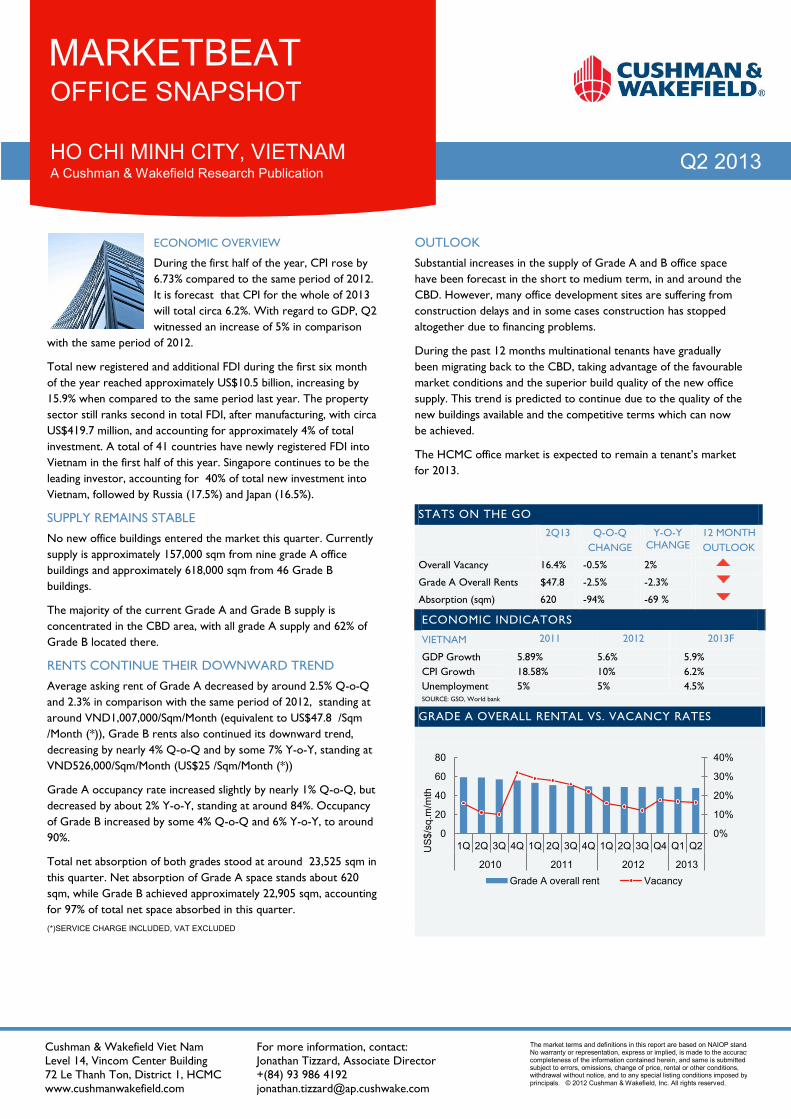
SUPPLY REMAINS STABLE
No new office buildings entered the market this quarter. Currently supply is approximately 157,000 sqm from nine grade A office buildings and approximately 618,000 sqm from 46 Grade B buildings.
The majority of the current Grade A and Grade B supply is concentrated in the CBD area, with all grade A supply and 62% of Grade B located there.
RENTS CONTINUE THEIR DOWNWARD TREND
Average asking rent of Grade A decreased by around 2.5% Q-o-Q and 2.3% in comparison with the same period of 2012, standing at around VND1,007,000/Sqm/Month (equivalent to US$47.8 /Sqm /Month (*)), Grade B rents also continued its downward trend, decreasing by nearly 4% Q-o-Q and by some 7% Y-o-Y, standing at VND526,000/Sqm/Month (US$25 /Sqm/Month (*))
Grade A occupancy rate increased slightly by nearly 1% Q-o-Q, but decreased by about 2% Y-o-Y, standing at around 84%. Occupancy of Grade B increased by some 4% Q-o-Q and 6% Y-o-Y, to around 90%.
Total net absorption of both grades stood at around 23,525 sqm in this quarter. Net absorption of Grade A space stands about 620 sqm, while Grade B achieved approximately 22,905 sqm, accounting for 97% of total net space absorbed in this quarter. (*)SERVICE CHARGE INCLUDED, VAT EXCLUDED
OUTLOOK
Substantial increases in the supply of Grade A and B office space have been forecast in the short to medium term, in and around the CBD. However, many office development sites are suffering from construction delays and in some cases construction has stopped altogether due to financing problems.
During the past 12 months multinational tenants have gradually been migrating back to the CBD, taking advantage of the favourable market conditions and the superior build quality of the new office supply. This trend is predicted to continue due to the quality of the new buildings available and the competitive terms which can now be achieved.
The HCMC office market is expected to remain a tenant’s market for 2013.
STATS ON THE GO 2Q13 Q-O-Q
CHANGE Y-O-Y
CHANGE 12 MONTH OUTLOOK
Overall Vacancy 16.4% -0.5% 2%
Grade A Overall Rents $47.8 -2.5% -2.3%
Absorption (sqm) 620 -94% -69 %
ECONOMIC INDICATORS
VIETNAM 2011 2012 2013F
GDP Growth 5.89% 5.6% 5.9% CPI Growth 18.58% 10% 6.2% Unemployment 5% 5% 4.5% SOURCE: GSO, World bank
GRADE A OVERALL RENTAL VS. VACANCY RATES
0%
10%
20%
30%
40%
0
20
40
60
80
1Q 2Q 3Q 4Q 1Q 2Q 3Q 4Q 1Q 2Q 3Q Q4 Q1 Q2
2010 2011 2012 2013
US
$/sq
.m/m
th
Grade A overall rent Vacancy
Q2 2013 HO CHI MINH CITY, VIETNAM
OFFICE SNAPSHOT MARKETBEAT
A Cushman & Wakefield Research Publication
Cushman & Wakefield Viet Nam Level 14, Vincom Center Building 72 Le Thanh Ton, District 1, HCMC www.cushmanwakefield.com
For more information, contact: Jonathan Tizzard, Associate Director +(84) 93 986 4192 [email protected]
The market terms and definitions in this report are based on NAIOP standards. No warranty or representation, express or implied, is made to the accuracy or completeness of the information contained herein, and same is submitted subject to errors, omissions, change of price, rental or other conditions, withdrawal without notice, and to any special listing conditions imposed by our principals. © 2012 Cushman & Wakefield, Inc. All rights reserved.
SUBMARKET INVENTORY OVERALL
VACANCY RATE
UNDER CONSTRUCT
ION
YTD
CONSTRUCTION COMPLETIONS
OVERALL DIRECT NET
ABSORPTION
GRADE A & B AVERAGE GROSS (SERVICE
CHARGED INCL., VAT EXCLUDED)
(US/SQM/MTH)
US$ SF/YR
EURO SF/YR
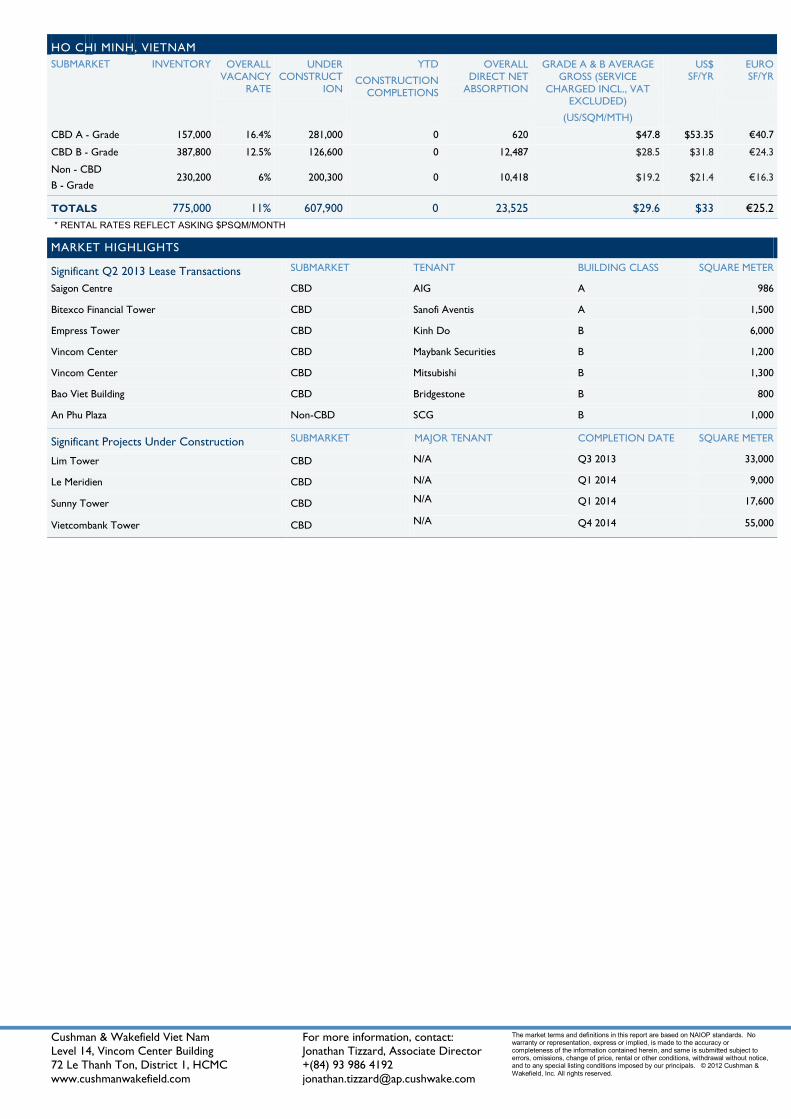
CBD A - Grade 157,000 16.4% 281,000 0 620 $47.8 $53.35 €40.7
CBD B - Grade 387,800 12.5% 126,600 0 12,487 $28.5 $31.8 €24.3
Non - CBD B - Grade
230,200 6% 200,300 0 10,418 $19.2 $21.4 €16.3
TOTALS 775,000 11% 607,900 0 23,525 $29.6 $33 €25.2
MARKET HIGHLIGHTS
Significant Q2 2013 Lease Transactions SUBMARKET TENANT BUILDING CLASS SQUARE METER
Saigon Centre CBD AIG A 986
Bitexco Financial Tower CBD Sanofi Aventis A 1,500
Empress Tower CBD Kinh Do B 6,000
Vincom Center CBD Maybank Securities B 1,200
Vincom Center CBD Mitsubishi B 1,300
Bao Viet Building CBD Bridgestone B 800
An Phu Plaza Non-CBD SCG B 1,000
Significant Projects Under Construction SUBMARKET MAJOR TENANT COMPLETION DATE SQUARE METER
Lim Tower CBD N/A Q3 2013 33,000
Le Meridien CBD N/A Q1 2014 9,000
Sunny Tower CBD N/A Q1 2014 17,600
Vietcombank Tower CBD N/A Q4 2014 55,000
HO CHI MINH, VIETNAM
* RENTAL RATES REFLECT ASKING $PSQM/MONTH
Cushman & Wakefield Viet Nam Level 14, Vincom Center Building 72 Le Thanh Ton, District 1, HCMC www.cushmanwakefield.com
For more information, contact: Jonathan Tizzard, Associate Director +(84) 93 986 4192 [email protected]
The market terms and definitions in this report are based on NAIOP standards. No warranty or representation, express or implied, is made to the accuracy or completeness of the information contained here in, and same is submitted subject to errors, omissions, change of price , renta l or other conditions, withdrawal without notice , and to any special listing conditions imposed by our principals. © 2012 Cushman & Wakefield, Inc. All rights reserved.
Q2 2013 HO CHI MINH, VIETNAM
INDUSTRIAL SNAPSHOT
MARKETBEAT
A Cushman & Wakefield Research Publication
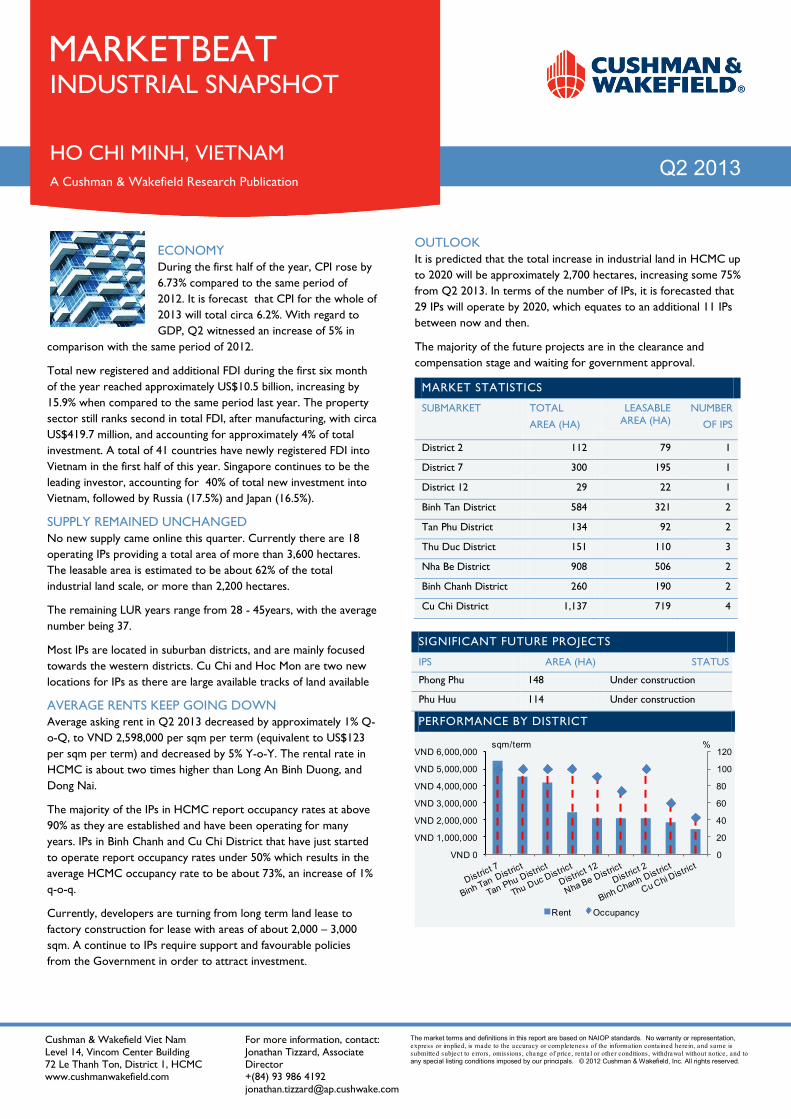
ECONOMY During the first half of the year, CPI rose by 6.73% compared to the same period of 2012. It is forecast that CPI for the whole of 2013 will total circa 6.2%. With regard to GDP, Q2 witnessed an increase of 5% in
comparison with the same period of 2012.
Total new registered and additional FDI during the first six month of the year reached approximately US$10.5 billion, increasing by 15.9% when compared to the same period last year. The property sector still ranks second in total FDI, after manufacturing, with circa US$419.7 million, and accounting for approximately 4% of total investment. A total of 41 countries have newly registered FDI into Vietnam in the first half of this year. Singapore continues to be the leading investor, accounting for 40% of total new investment into Vietnam, followed by Russia (17.5%) and Japan (16.5%).
SUPPLY REMAINED UNCHANGED No new supply came online this quarter. Currently there are 18 operating IPs providing a total area of more than 3,600 hectares. The leasable area is estimated to be about 62% of the total industrial land scale, or more than 2,200 hectares.
The remaining LUR years range from 28 - 45years, with the average number being 37.
Most IPs are located in suburban districts, and are mainly focused towards the western districts. Cu Chi and Hoc Mon are two new locations for IPs as there are large available tracks of land available
AVERAGE RENTS KEEP GOING DOWN Average asking rent in Q2 2013 decreased by approximately 1% Q-o-Q, to VND 2,598,000 per sqm per term (equivalent to US$123 per sqm per term) and decreased by 5% Y-o-Y. The rental rate in HCMC is about two times higher than Long An Binh Duong, and Dong Nai.
The majority of the IPs in HCMC report occupancy rates at above 90% as they are established and have been operating for many years. IPs in Binh Chanh and Cu Chi District that have just started to operate report occupancy rates under 50% which results in the average HCMC occupancy rate to be about 73%, an increase of 1% q-o-q.
Currently, developers are turning from long term land lease to factory construction for lease with areas of about 2,000 – 3,000 sqm. A continue to IPs require support and favourable policies from the Government in order to attract investment.
OUTLOOK It is predicted that the total increase in industrial land in HCMC up to 2020 will be approximately 2,700 hectares, increasing some 75% from Q2 2013. In terms of the number of IPs, it is forecasted that 29 IPs will operate by 2020, which equates to an additional 11 IPs between now and then.
The majority of the future projects are in the clearance and compensation stage and waiting for government approval.
MARKET STATISTICS
SUBMARKET TOTAL
AREA (HA)
LEASABLE AREA (HA)
NUMBER
OF IPS
District 2 112 79 1
District 7 300 195 1
District 12 29 22 1
Binh Tan District 584 321 2
Tan Phu District 134 92 2
Thu Duc District 151 110 3
Nha Be District 908 506 2
Binh Chanh District 260 190 2
Cu Chi District 1,137 719 4
SIGNIFICANT FUTURE PROJECTS
IPS AREA (HA) STATUS
Phong Phu 148 Under construction
Phu Huu 114 Under construction
PERFORMANCE BY DISTRICT
0
20
40
60
80
100
120
VND 0
VND 1,000,000
VND 2,000,000
VND 3,000,000
VND 4,000,000
VND 5,000,000
VND 6,000,000sqm/term %
Rent Occupancy
Cushman & Wakefield Viet Nam Level 14, Vincom Center Building 72 Le Thanh Ton, District 1, HCMC www.cushmanwakefield.com
For more information, contact: Jonathan Tizzard, Associate Director +(84) 93 986 4192 [email protected]
This report has been produced by Cushman & Wakefield LLP for use by those with an interest in commercial property sole ly for information purposes. It is not intended to be a complete description of the markets or developments to which it refers. The report uses information obta ined from public source s which Cushman & Wakefie ld LLP believe to be re liable, but we have not verified such information and cannot guarantee that it is accurate and complete. No warranty or representa tion, express or implied, is made as to the accuracy or completeness of any of the information conta ined here in and Cushman & Wakefield LLP shall not be liable to any reader of this report or any third party in any way whatsoever. All expressions of opinion are subject to change. Our prior written consent is required before this report can be reproduced in whole or in part. Should you not wish to receive information from Cushman & Wakefie ld LLP or any re lated company, please email [email protected] with your details in the body of your email as they appear on this communication and head it “Unsubscribe”. ©2012 Cushman & Wakefield LLP All rights reserved.
1
Q2 2013 HO CHI MINH, VIETNAM
RESIDENTIAL SNAPSHOT
MARKETBEAT
A Cushman & Wakefield Research Publication
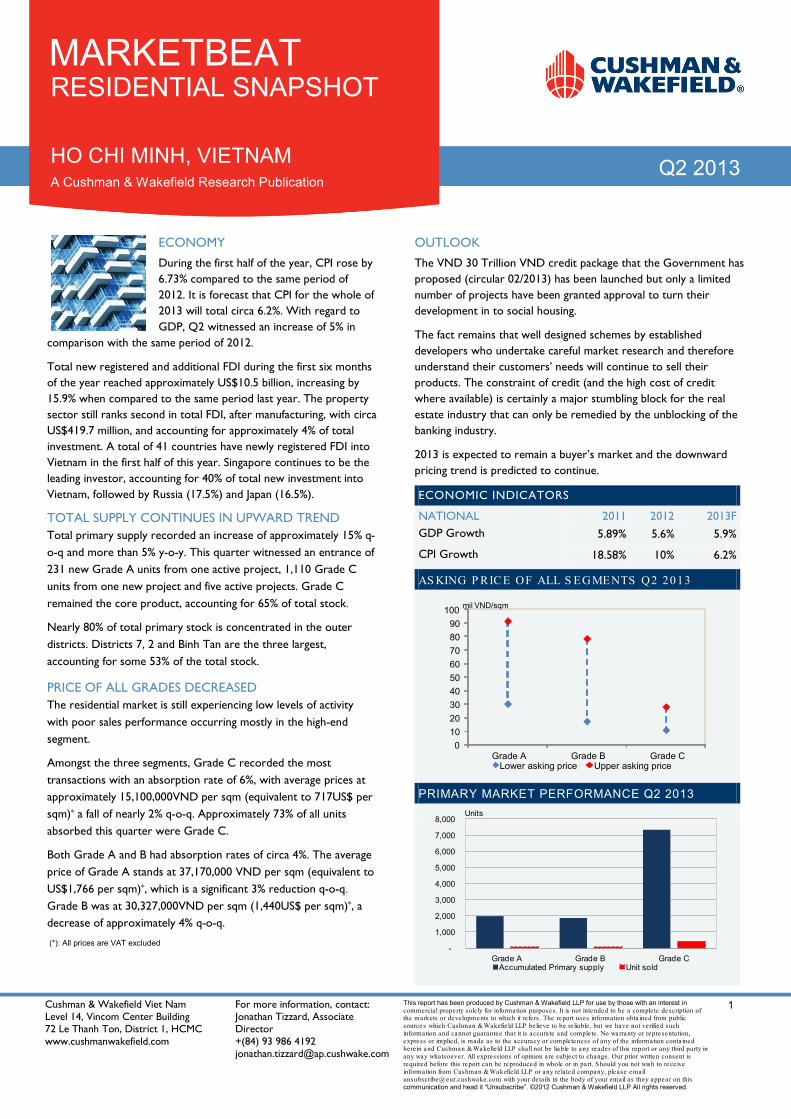
ECONOMY
During the first half of the year, CPI rose by 6.73% compared to the same period of 2012. It is forecast that CPI for the whole of 2013 will total circa 6.2%. With regard to GDP, Q2 witnessed an increase of 5% in
comparison with the same period of 2012.
Total new registered and additional FDI during the first six months of the year reached approximately US$10.5 billion, increasing by 15.9% when compared to the same period last year. The property sector still ranks second in total FDI, after manufacturing, with circa US$419.7 million, and accounting for approximately 4% of total investment. A total of 41 countries have newly registered FDI into Vietnam in the first half of this year. Singapore continues to be the leading investor, accounting for 40% of total new investment into Vietnam, followed by Russia (17.5%) and Japan (16.5%).
TOTAL SUPPLY CONTINUES IN UPWARD TREND Total primary supply recorded an increase of approximately 15% q-o-q and more than 5% y-o-y. This quarter witnessed an entrance of 231 new Grade A units from one active project, 1,110 Grade C units from one new project and five active projects. Grade C remained the core product, accounting for 65% of total stock.
Nearly 80% of total primary stock is concentrated in the outer districts. Districts 7, 2 and Binh Tan are the three largest, accounting for some 53% of the total stock.
PRICE OF ALL GRADES DECREASED The residential market is still experiencing low levels of activity with poor sales performance occurring mostly in the high-end segment.
Amongst the three segments, Grade C recorded the most transactions with an absorption rate of 6%, with average prices at approximately 15,100,000VND per sqm (equivalent to 717US$ per sqm)* a fall of nearly 2% q-o-q. Approximately 73% of all units absorbed this quarter were Grade C.
Both Grade A and B had absorption rates of circa 4%. The average price of Grade A stands at 37,170,000 VND per sqm (equivalent to US$1,766 per sqm)*, which is a significant 3% reduction q-o-q. Grade B was at 30,327,000VND per sqm (1,440US$ per sqm)*, a decrease of approximately 4% q-o-q.
(*): All prices are VAT excluded
OUTLOOK
The VND 30 Trillion VND credit package that the Government has proposed (circular 02/2013) has been launched but only a limited number of projects have been granted approval to turn their development in to social housing.
The fact remains that well designed schemes by established developers who undertake careful market research and therefore understand their customers’ needs will continue to sell their products. The constraint of credit (and the high cost of credit where available) is certainly a major stumbling block for the real estate industry that can only be remedied by the unblocking of the banking industry.
2013 is expected to remain a buyer’s market and the downward pricing trend is predicted to continue.
ECONOMIC INDICATORS
NATIONAL 2011 2012 2013F GDP Growth 5.89% 5.6% 5.9%
CPI Growth 18.58% 10% 6.2%
AS KING P RICE OF ALL S EGMENTS Q2 2013
PRIMARY MARKET PERFORMANCE Q2 2013
0 10 20 30 40 50 60 70 80 90
100
Grade A Grade B Grade C
mil VND/sqm
Lower asking price Upper asking price
-
1,000
2,000
3,000
4,000
5,000
6,000
7,000
8,000
Grade A Grade B Grade CAccumulated Primary supply Unit sold
Units
Cushman & Wakefield Viet Nam Level 14, Vincom Center Building 72 Le Thanh Ton, Dis trict 1, HCMC www.cushmanwakefie ld.com
For more information, contact: Jonathan Tizzard, Associate Director +(84) 93 986 4192 [email protected]
This report has been produced by Cushman & Wakefield LLP for use by those with an interest in commercial property sole ly for information purposes. It is not intended to be a complete description of the markets or developments to which it refers. The report use s information obtained from public source s which Cushman & Wakefie ld LLP believe to be re liable, but we have not verified such information and cannot guarantee that it is accurate and complete. No warranty or representa tion, express or implied, is made as to the accuracy or completeness of any of the information conta ined here in and Cushman & Wakefie ld LLP shall not be liable to any reader of this report or any third party in any way whatsoever. All expressions of opinion are subject to change. Our prior written consent is required before this report can be reproduced in whole or in part. Should you not wish to receive information from Cushman & Wakefie ld LLP or any rela ted company, please email [email protected] with your details in the body of your email as they appear on this communication and head it “Unsubscribe”. ©2012 Cushman & Wakefield LLP All rights reserved.
2
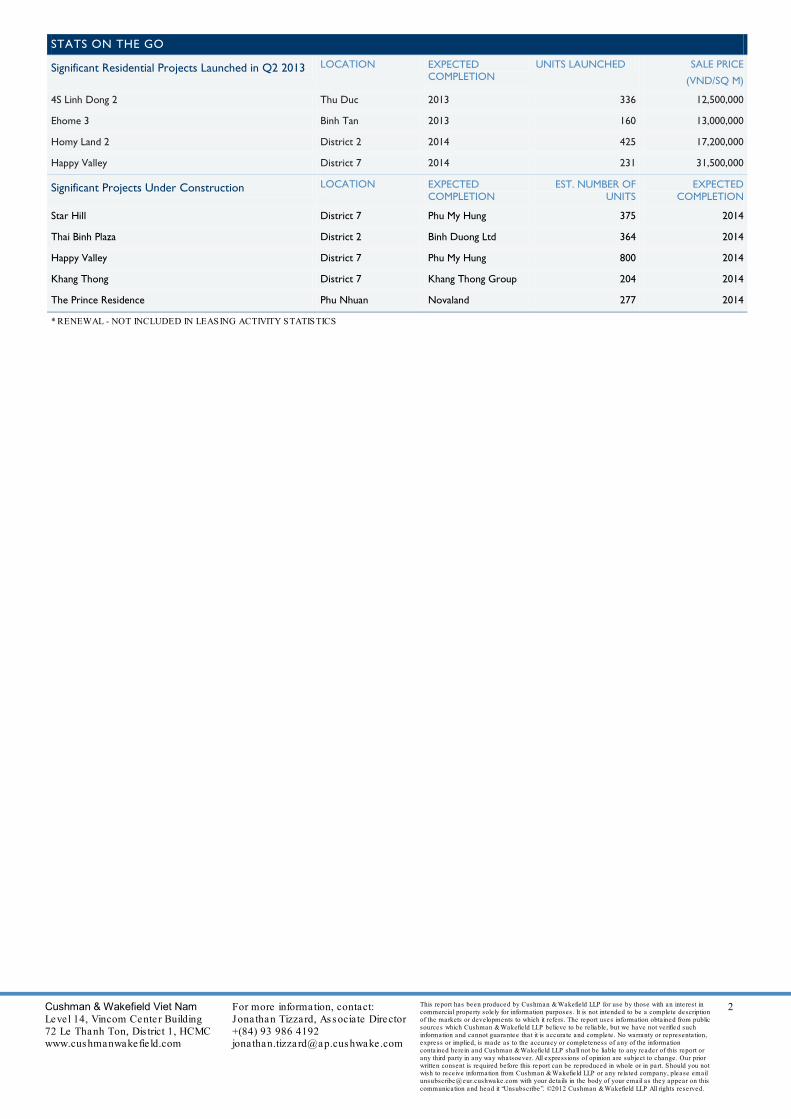
STATS ON THE GO
Significant Residential Projects Launched in Q2 2013 LOCATION EXPECTED COMPLETION
UNITS LAUNCHED SALE PRICE
(VND/SQ M)
4S Linh Dong 2 Thu Duc 2013 336 12,500,000
Ehome 3 Binh Tan 2013 160 13,000,000
Homy Land 2 District 2 2014 425 17,200,000
Happy Valley District 7 2014 231 31,500,000
Significant Projects Under Construction LOCATION EXPECTED COMPLETION
EST. NUMBER OF UNITS
EXPECTED COMPLETION
Star Hill District 7 Phu My Hung 375 2014
Thai Binh Plaza District 2 Binh Duong Ltd 364 2014
Happy Valley District 7 Phu My Hung 800 2014
Khang Thong District 7 Khang Thong Group 204 2014
The Prince Residence Phu Nhuan Novaland 277 2014
* RENEWAL - NOT INCLUDED IN LEASING ACTIVITY STATISTICS
Cushman & Wakefield Viet Nam Level 14, Vincom Center Building 72 Le Thanh Ton, District 1, HCMC www.cushmanwakefield.com
For more information, contact: Jonathan Tizzard, Associate Director +(84) 93 986 4192 [email protected]
The market terms and definitions in this report are based on NAIOP standards. warranty or representation, express or implied, is made to the accuracy or completeness of the information contained herein, and same is submitted subject errors, omissions, change of price, rental or other conditions, withdrawal withou notice, and to any special listing conditions imposed by our principals. © 2012 Cushman & Wakefield, Inc. All rights reserved.
ECONOMY OVERVIEW
During the first half of the year, CPI rose by 6.73% compared to the same period of 2012. It is forecast that CPI for the whole of 2013 will total circa 6.2%. With regard to GDP, Q2 witnessed an increase of 5% in
comparison with the same period of 2012.
Total new registered and additional FDI during the first six month of the year reached approximately US$10.5 billion, increasing by 15.9% when compared to the same period last year. The property sector still ranks second in total FDI, after manufacturing, with circa US$419.7 million, and accounting for approximately 4% of total investment. A total of 41 countries have newly registered FDI into Vietnam in the first half of this year. Singapore continues to be the leading investor, accounting for 40% of total new investment into Vietnam, followed by Russia (17.5%) and Japan (16.5%).
SUPPLY
Currently, there are 8 Retail podiums, 7 Department stores, 21 shopping centres, 63 supermarkets and 3 wholesale centres in the city with a total area of approximately 783,400 sq m.
Two supermarkets joined the market this quarter, supplying an additional 21,000 sq m of retail space to the market. Both are located in the suburban area.
District 1 has the most crowded retail market in the city and currently accounts for more than 24% of the total supply.
MARKET PERFORMANCE
The CBD area continues to performs well with the highest occupancy rate at 92%, an increase of 2% Q-o-Q, despite it having the highest rent at VND2,226,000 per sqm per month (equivalent to US$106 per sqm per month)(*). This rent is considered 1.6 times higher than in the secondary area, at VND1,425,000 per sqm per month (equivalent to US$68 per sqm per month) (*) and 3 times higher than in the suburban area, at VND744,000 per sqm per month (equivalent to US$35 per sqm per month)(*). Rents of all areas are recorded to have decreased slightly by more than 1% Q-o-Q.
Except for the CBD area, the two remaining areas suffered a slightly decrease in average occupancy rates at approximately 1% Q-o-Q for the secondary area and 3% Q-o-Q for suburban area, reached 91% and 83%, respectively.
In terms of retail type, department stores achieved the highest average asking rent at VND1,400,000 per sqm per month (equivalent to US$67 per sqm per month), followed by shopping centres at VND1,398,000 per sqm per month (equivalent to
US$66 per sqm per month) and finally retail podiums at VND1,023,000 per sqm per month (equivalent to US$49 per sqm per month). Rents of all types remained stable, except for department stores which suffered a slight decrease of more than 1% Q-o-Q. Occupancy rates are 89%, 86%, and 97%, respectively.
OUTLOOK
In 2012, Vietnam went off the list of 30 most attractive retail markets in the world (A.T Kearney). However, the Vietnam retail market is still considered to be appealing to foreign retailers with a population of about 90 million people, more than 60% of whom are in the high-consuming age category from 20 to 59.
In HCMC, demand for retail space in the CBD is expected to remain high in at least the short to medium term. However, due to the land limitation and high land price, the majority of future stock will be concentrated in the suburban area.
Over the next 5-7 years, approximately 1.5 million sq m of new supply will enter the market. This represents a 200% increase in retail supply between now and then.
ECONOMIC INDICATORS
NATIONAL 2011 2012 2013F
GDP Growth 5.89% 5.03% 5.9%
CPI Growth 18.6% 9.2% 6.2%
Retail Turnover 24.2% 16% 18%
SOURCE: GSO, World bank
PRIME RETAIL RENTS – Q2 2013
MAINSTREETS MIL VND SQM/MTH
EURO SF/MTH
US$ SF/MTH
Q-O-Q CHANGE Y-O-Y CHANGE
Dong Khoi 1.9 6.8 8.8 0.0% -
Nguyen Hue 2 6.9 8.9 0.0% -
Le Loi 1.9 6.8 8.8 0.0% -
MALLS MIL VND SQM/MTH
EURO SF/YR
US$ SF/YR
Q-O-Q CHANGE Y-O-Y CHANGE
Vincom Center A Parkson Saigon Tourist
3.4
2.2
136
89
178
117
-1.6%
0.0%
-
-
Diamond Plaza Rex Arcade Tax Plaza
3.1 2.1 1.8
127 85 72
167 111 94
3.0% -1.0% 0.0%
- - -
SIGNIFICANT PROJECTS UNDER CONSTRUCTION PROPERTY LOCATION SQUARE
METERS COMPLETION
DATE Time Square CBD 9,000 2013
Leman CT Plaza Secondary Area 12,000 2014
Aeon Celadon City Suburban 82,000 2014
HO CHI MINH CITY/VIETNAM
RETAIL SNAPSHOT
MARKETBEAT
A Cushman & Wakefield Research Publication
Q2 2013
Cushman & Wakefield Viet Nam Level 14, Vincom Center Building 72 Le Thanh Ton, District 1, HCMC www.cushmanwakefield.com
For more information, contact: Jonathan Tizzard, Associate Director +(84) 93 986 4192 [email protected]
This report has been produced by Cushman & Wakefield LLP for use by those with an interest in commercial property sole ly for information purposes. It is not intended to be a complete description of the markets or developments to which it refers. The report uses information obta ined from public source s which Cushman & Wakefie ld LLP believe to be re liable, but we have not verified such information and cannot guarantee that it is accurate and complete. No warranty or representa tion, express or implied, is made as to the accuracy or completeness of any of the information conta ined here in and Cushman & Wakefield LLP shall not be liable to any reader of this report or any third party in any way whatsoever. All expressions of opinion are subject to change. Our prior written consent is required before this report can be reproduced in whole or in part. Should you not wish to receive information from Cushman & Wakefie ld LLP or any re lated company, please email [email protected] with your details in the body of your email as they appear on this communication and head it “Unsubscribe”. ©2012 Cushman & Wakefield LLP All rights reserved.
1
Q2 2013
HO CHI MINH, VIETNAM
SERVICED APARTMENT
MARKETBEAT
A Cushman & Wakefield Research Publication
ECONOMY
During the first half of the year, CPI rose by 6.73% compared to the same period of 2012. It is forecast that CPI for the whole of 2013 will total circa 6.2%. With regard to GDP, Q2 witnessed an increase of 5% in
comparison with the same period of 2012.
Total new registered and additional FDI during the first six month of the year reached approximately US$10.5 billion, increasing by 15.9% when compared to the same period last year. The property sector still ranks second in total FDI, after manufacturing, with circa US$419.7 million, and accounting for approximately 4% of total investment. A total of 41 countries have newly registered FDI into Vietnam in the first half of this year. Singapore continues to be the leading investor, accounting for 40% of total new investment into Vietnam, followed by Russia (17.5%) and Japan (16.5%).
GRADE B SUPPLY INCREASED
111 grade B units from one active project entered the market this quarter. Grade B supply increased by approximately 6% Q-o-Q and 11% Y-o-Y.
Total supply is recorded at approximately 2,740 apartments from 28 buildings. More than 700 are Grade A and 2,030 units Grade B, accounting for 26% and 74% of the market share respectively. District 1 makes up 45% of all total supply.
The serviced apartment market is facing competition from some projects that are transferring their use from apartments for sale to apartments for lease and this trend is forecast to continue for the short to mid-term.
GRADE B’S AVERAGE ASKING RENTS INCREASED Occupancy rates of grade A decreased by approximately 3% Q-o-Q and 5%Y-o-Y, achieving 86%. Average asking rents for Grade A remained unchanged Q-o-Q but decreased by approximately 3% Y-o-Y, standing at VND 628,000 per sqm per month (equivalent to US$30 per sqm per month) c.
Average asking rent of Grade B increased by approximately 2% Q-o-Q and 1%Y-o-Y due to high rents offer by new comer, standing at VND 483,000 per sqm per month (equivalent to US$23 per sqm per month) (*), while occupancy rate decreased significantly by around 6% Q-o-Q and 9% Y-o-Y.
Grade A and B serviced apartments in District 1 always perform well with a high occupancy rate at nearly 85% despite having the highest rents at VND 592,300 per sqm per month (equivalent to US$28.1 per sqm per month) (*). (*)SERVICE CHARGE INCLUDED, VAT EXCLUDED
OUTLOOK
The serviced apartment market is expected to see the entrance of more than 180 units from two projects this year. Along with, stagnation in the apartment for sale market causing many developers to transfer the use into apartment for lease - there is expected to be pressure on rents.
Due to poor economic performance, many multi-national companies have cut costs on staff accommodation. Hence, modestly sized apartments are expected to be popular in the short and medium term due to reasonable rents.
RENTAL VALUES AS OF 2Q 2013
LOCATION AVERAGE RENT
SQM/MTH
%CHANGE SHORT TERM OUTLOOK
MTH AGO
YEAR AGO
GRADE A
CBD 663,200 -0.2% -1.8%
Non - CBD 412,500 -0.2% -7.3%
GRADE B
CBD 523,300 -0.2% -5%
Non - CBD 525,660 11% 20%
GRADE A & B OVERALL RENTAL VS. OCCUPANCY RATE 2Q 2013
50%55%60%65%70%75%80%85%90%95%100%
0
100,000
200,000
300,000
400,000
500,000
600,000
700,000
1Q10 2Q10 3Q10 4Q10 1Q11 2Q11 3Q11 4Q11 1Q12 2Q12 3Q12 4Q12 1Q13 2Q13
VND/sqm/month
Grade A- Rent Grade B- Rent Grade A- Occupancy Grade B- Occupancy
Cushman & Wakefield Viet Nam Level 14, Vincom Center Building 72 Le Thanh Ton, District 1, HCMC www.cushmanwakefield.com
For more information, contact: Jonathan Tizzard, Associate Director +(84) 93 986 4192 [email protected]
This report has been produced by Cushman & Wakefield LLP for use by those with an interest in commercial property sole ly for information purposes. It is not intended to be a complete description of the markets or developments to which it refers. The report uses information obta ined from public source s which Cushman & Wakefie ld LLP believe to be re liable, but we have not verified such information and cannot guarantee that it is accurate and complete. No warranty or representa tion, express or implied, is made as to the accuracy or completeness of any of the information conta ined here in and Cushman & Wakefield LLP shall not be liable to any reader of this report or any third party in any way whatsoever. All expressions of opinion are subject to change. Our prior written consent is required before this report can be reproduced in whole or in part. Should you not wish to receive information from Cushman & Wakefie ld LLP or any re lated company, please email [email protected] with your details in the body of your email as they appear on this communication and head it “Unsubscribe”. ©2012 Cushman & Wakefield LLP All rights reserved.
2
Q2 2013
HO CHI MINH, VIETNAM
SERVICED APARTMENT
MARKETBEAT
A Cushman & Wakefield Research Publication
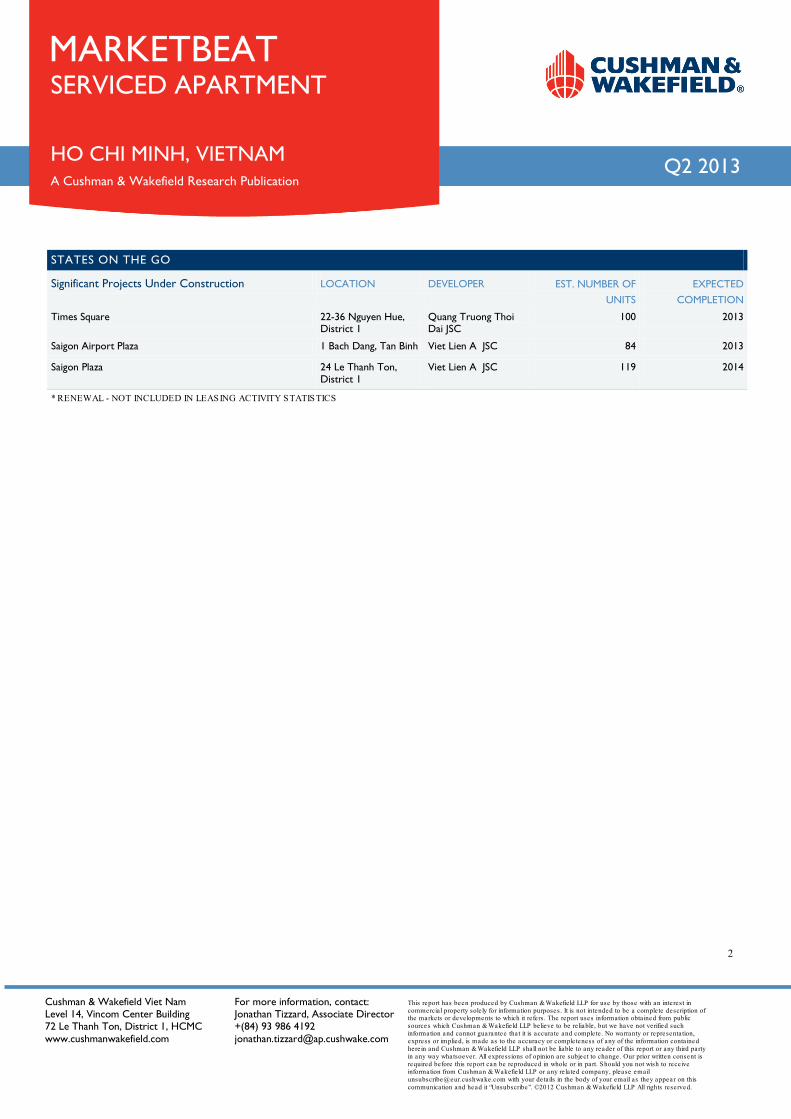
STATES ON THE GO
Significant Projects Under Construction LOCATION DEVELOPER EST. NUMBER OF UNITS
EXPECTED COMPLETION
Times Square 22-36 Nguyen Hue, District 1
Quang Truong Thoi Dai JSC
100 2013
Saigon Airport Plaza 1 Bach Dang, Tan Binh Viet Lien A JSC 84 2013
Saigon Plaza 24 Le Thanh Ton, District 1
Viet Lien A JSC 119 2014
* RENEWAL - NOT INCLUDED IN LEASING ACTIVITY STATISTICS
MARKETBEAT
A Cushman & Wakefield Alliance Research Publication
Publication
Q2 2013
HANOI OFFICE: Room 602, Asia Tower, 6 Nha Tho Street, Hoan Kiem District, Hanoi, Vietnam Tel: (84) 4 3938 1786
Fax: (84) 4 3938 1781
HO CHI MINH CITY OFFICE: Unit 16, 14 FI, Vincom Centre, 72 Le Thanh Ton Street, Ben Nghe Ward, District 1, Ho Chi Minh City, Vietnam Tel: (84-8) 3823 7968 Fax: (84-8) 3823 7969