Embed Size (px)
Citation preview
Despite Record Occupancy, Areas of Uncertainty Remain for Health CareOverall, 2016 was a year of expansion for health care real estate in the United States. The national vacancy rate for medical office buildings (MOB) hit an all-time low. Net absorption of MOB space was the highest since 2008 while average rents grew. Investment activity—while down slightly from 2015—remained strong and compressed capitalization rates slightly.
Yet as 2017 gets underway, health care providers and health system owners are facing a variety of considerations that could impact their businesses and real estate strategies. While every change in administration ushers in some level of uncertainty, the industry is facing many questions surrounding the repeal of the Affordable Care Act (ACA) and the details of coverage to replace it. As a result, decision-making in this dynamic sector is likely to be delayed for a time, especially if these policy changes evolve over a protracted and contentious process.
Health care providers are also grappling with the implementation of the final terms for the site-neutral payment rule—which limits the way off-campus facilities are reimbursed by Medicare. This will likely challenge the financial viability of future off-campus real estate projects and cause health care providers to reevaluate relocation or expansion opportunities.
The health care industry is also facing a continued wave of rising costs—from services to construction materials to labor. The U.S. population is aging, which heightens the demand for health care. Health care expenditures per capita exceeded $10,000 in 2016 and are forecast to grow at an average annual rate of 5.8% through 2025. However, providers are increasingly receiving less insurance income and are under constant pressure to protect operating margins while still innovating, improving and enhancing services.
In the face of these challenges, health care real estate fundamentals remain solid and the industry will likely remain buoyed by consumer demand. It will continue to be as important as ever for providers to base real estate decisions in a nuanced understanding of the consumer landscape, the real estate environment and investment opportunities.
Key Takeaways > Vacancy: Strong demand for MOBs pushed the national vacancy rate to an all-time low of 7.4% at year-end 2016.
> Absorption: MOB net absorption increased by 25% in 2016 from 18.1 million square feet to 22.7 million square feet—the highest annual total since 2008.
> Rents: Full service gross (FSG) MOB rents rose by 8% in 2016 to a national average of $24 per square foot.
> Construction: Following 14.6 million square feet of deliveries in 2015, the 2016 delivery total is set to exceed 22 million square feet—just below the 2008 peak of 24.9 million square feet. Nonetheless, this new supply is still modest in inventory terms, representing only 1.7% of the total MOB universe.
> Sales: Total investment in MOBs fell from $11.6 billion in 2015 to a still-respectable $9.3 billion in 2016. At 6.7%, average MOB cap rates are in line with the office sector average cap rate of 6.5%.
U.S. Research Report
2017 HEALTH CARE MARKETPLACE
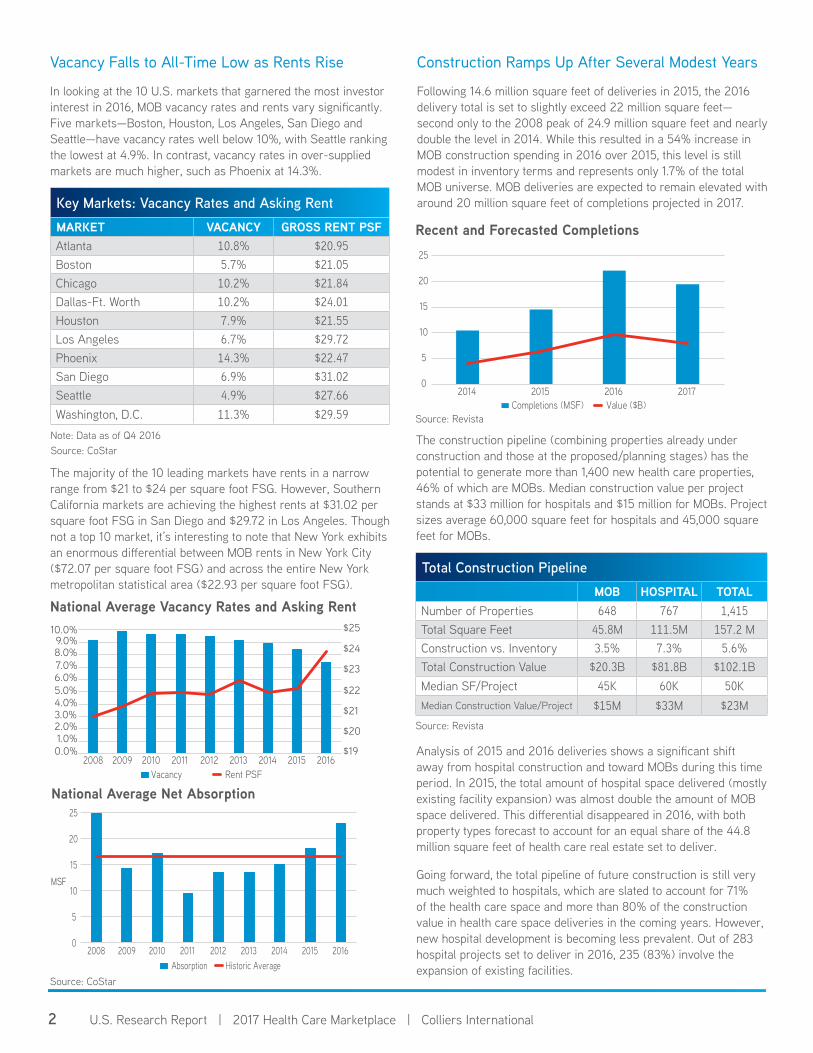
Vacancy Falls to All-Time Low as Rents Rise
In looking at the 10 U.S. markets that garnered the most investor interest in 2016, MOB vacancy rates and rents vary significantly. Five markets—Boston, Houston, Los Angeles, San Diego and Seattle—have vacancy rates well below 10%, with Seattle ranking the lowest at 4.9%. In contrast, vacancy rates in over-supplied markets are much higher, such as Phoenix at 14.3%.
The majority of the 10 leading markets have rents in a narrow range from $21 to $24 per square foot FSG. However, Southern California markets are achieving the highest rents at $31.02 per square foot FSG in San Diego and $29.72 in Los Angeles. Though not a top 10 market, it’s interesting to note that New York exhibits an enormous differential between MOB rents in New York City ($72.07 per square foot FSG) and across the entire New York metropolitan statistical area ($22.93 per square foot FSG).
The construction pipeline (combining properties already under construction and those at the proposed/planning stages) has the potential to generate more than 1,400 new health care properties, 46% of which are MOBs. Median construction value per project stands at $33 million for hospitals and $15 million for MOBs. Project sizes average 60,000 square feet for hospitals and 45,000 square feet for MOBs.
Recent and Forecasted Completions
Source: Revista
Total Construction PipelineMOB HOSPITAL TOTAL
Number of Properties 648 767 1,415Total Square Feet 45.8M 111.5M 157.2 MConstruction vs. Inventory 3.5% 7.3% 5.6%Total Construction Value $20.3B $81.8B $102.1BMedian SF/Project 45K 60K 50KMedian Construction Value/Project $15M $33M $23M
Source: Revista
U.S. Research Report | 2017 Health Care Marketplace | Colliers International2
Construction Ramps Up After Several Modest Years
Following 14.6 million square feet of deliveries in 2015, the 2016 delivery total is set to slightly exceed 22 million square feet—second only to the 2008 peak of 24.9 million square feet and nearly double the level in 2014. While this resulted in a 54% increase in MOB construction spending in 2016 over 2015, this level is still modest in inventory terms and represents only 1.7% of the total MOB universe. MOB deliveries are expected to remain elevated with around 20 million square feet of completions projected in 2017.
National Average Net Absorption
Source: CoStar
Medical O�ce: Vacancy Rates & Asking Rent
Sources: CoStar
Medical O�ce Sales Volume
Medical O�ce: Net Absorption
Medical O�ce: Sales Price ($ PSF) - by Region
Medical O�ce: Recent & Forecast Completions
Medical O�ce: Cap Rates - United States
Medical O�ce: Cap Rates by Region
0
5
10
15
20
25
2008 2009 2010 2011 2012 2013 2014 2015 2016Absorption Historic Average
MSF
Sources: CoStar
0
5
10
15
20
25
2014 2015 2016 2017Completions (MSF) Value ($B)
Sources: Revista 6.0%
6.5%
7.0%
7.5%
8.0%
8.5%
9.0%
2002 2003 2004 2005 2006 2007 2008 2009 2010 2011 2012 2013 2014 2015 2016
Cap Rate
Sources: Real Capital Analy�cs
0.0% 1.0% 2.0% 3.0% 4.0% 5.0% 6.0% 7.0%
Mid-Atlantic
Midwest
Northeast
Southeast
Southwest
West
8.0%
Sources: Real Capital Analy�cs (Data as of Q4 2016)
Sources: Real Capital Analy�cs
Sources: Real Capital Analy�cs
2008 2009 2010 2011 2012 2013 2014 2015 2016Vacancy Rent PSF
10.0%9.0%8.0%
0.0%1.0%2.0%3.0%4.0%5.0%6.0%7.0%
$25
$24
$23
$22
$21
$20
$19
0.0
2.0
4.0
6.0
8.0
10.0
12.0
2002 2003 2004 2005 2006 2007 2008 2009 2010 2011 2012 2013 2014 2015 2016Volume Historic Average
$B
100.00
150.00
200.00
250.00
300.00
350.00
2002 2003 2004 2005 2006 2007 2008 2009 2010 2011 2012 2013 2014 2015 2016
Mid-Atlantic Midwest Northeast Southeast Southwest West
$/SF
U.S. Average
Note: Data as of Q4 2016 Source: CoStar
Key Markets: Vacancy Rates and Asking RentMARKET VACANCY GROSS RENT PSFAtlanta 10.8% $20.95Boston 5.7% $21.05Chicago 10.2% $21.84Dallas-Ft. Worth 10.2% $24.01Houston 7.9% $21.55Los Angeles 6.7% $29.72Phoenix 14.3% $22.47San Diego 6.9% $31.02Seattle 4.9% $27.66Washington, D.C. 11.3% $29.59
Medical O�ce: Vacancy Rates & Asking Rent
Sources: CoStar
Medical O�ce Sales Volume
Medical O�ce: Net Absorption
Medical O�ce: Sales Price ($ PSF) - by Region
Medical O�ce: Recent & Forecast Completions
Medical O�ce: Cap Rates - United States
Medical O�ce: Cap Rates by Region
0
5
10
15
20
25
2008 2009 2010 2011 2012 2013 2014 2015 2016Absorption Historic Average
MSF
Sources: CoStar
0
5
10
15
20
25
2014 2015 2016 2017Completions (MSF) Value ($B)
Sources: Revista 6.0%
6.5%
7.0%
7.5%
8.0%
8.5%
9.0%
2002 2003 2004 2005 2006 2007 2008 2009 2010 2011 2012 2013 2014 2015 2016
Cap Rate
Sources: Real Capital Analy�cs
0.0% 1.0% 2.0% 3.0% 4.0% 5.0% 6.0% 7.0%
Mid-Atlantic
Midwest
Northeast
Southeast
Southwest
West
8.0%
Sources: Real Capital Analy�cs (Data as of Q4 2016)
Sources: Real Capital Analy�cs
Sources: Real Capital Analy�cs
2008 2009 2010 2011 2012 2013 2014 2015 2016Vacancy Rent PSF
10.0%9.0%8.0%
0.0%1.0%2.0%3.0%4.0%5.0%6.0%7.0%
$25
$24
$23
$22
$21
$20
$19
0.0
2.0
4.0
6.0
8.0
10.0
12.0
2002 2003 2004 2005 2006 2007 2008 2009 2010 2011 2012 2013 2014 2015 2016Volume Historic Average
$B
100.00
150.00
200.00
250.00
300.00
350.00
2002 2003 2004 2005 2006 2007 2008 2009 2010 2011 2012 2013 2014 2015 2016
Mid-Atlantic Midwest Northeast Southeast Southwest West
$/SF
U.S. Average
National Average Vacancy Rates and Asking RentMedical O�ce: Vacancy Rates & Asking Rent
Sources: CoStar
Medical O�ce Sales Volume
Medical O�ce: Net Absorption
Medical O�ce: Sales Price ($ PSF) - by Region
Medical O�ce: Recent & Forecast Completions
Medical O�ce: Cap Rates - United States
Medical O�ce: Cap Rates by Region
0
5
10
15
20
25
2008 2009 2010 2011 2012 2013 2014 2015 2016Absorption Historic Average
MSF
Sources: CoStar
0
5
10
15
20
25
2014 2015 2016 2017Completions (MSF) Value ($B)
Sources: Revista 6.0%
6.5%
7.0%
7.5%
8.0%
8.5%
9.0%
2002 2003 2004 2005 2006 2007 2008 2009 2010 2011 2012 2013 2014 2015 2016
Cap Rate
Sources: Real Capital Analy�cs
0.0% 1.0% 2.0% 3.0% 4.0% 5.0% 6.0% 7.0%
Mid-Atlantic
Midwest
Northeast
Southeast
Southwest
West
8.0%
Sources: Real Capital Analy�cs (Data as of Q4 2016)
Sources: Real Capital Analy�cs
Sources: Real Capital Analy�cs
2008 2009 2010 2011 2012 2013 2014 2015 2016Vacancy Rent PSF
10.0%9.0%8.0%
0.0%1.0%2.0%3.0%4.0%5.0%6.0%7.0%
$25
$24
$23
$22
$21
$20
$19
0.0
2.0
4.0
6.0
8.0
10.0
12.0
2002 2003 2004 2005 2006 2007 2008 2009 2010 2011 2012 2013 2014 2015 2016Volume Historic Average
$B
100.00
150.00
200.00
250.00
300.00
350.00
2002 2003 2004 2005 2006 2007 2008 2009 2010 2011 2012 2013 2014 2015 2016
Mid-Atlantic Midwest Northeast Southeast Southwest West
$/SF
U.S. Average
Analysis of 2015 and 2016 deliveries shows a significant shift away from hospital construction and toward MOBs during this time period. In 2015, the total amount of hospital space delivered (mostly existing facility expansion) was almost double the amount of MOB space delivered. This differential disappeared in 2016, with both property types forecast to account for an equal share of the 44.8 million square feet of health care real estate set to deliver.
Going forward, the total pipeline of future construction is still very much weighted to hospitals, which are slated to account for 71% of the health care space and more than 80% of the construction value in health care space deliveries in the coming years. However, new hospital development is becoming less prevalent. Out of 283 hospital projects set to deliver in 2016, 235 (83%) involve the expansion of existing facilities.
U.S. Research Report | 2017 Health Care Marketplace | Colliers International3
Source: Revista
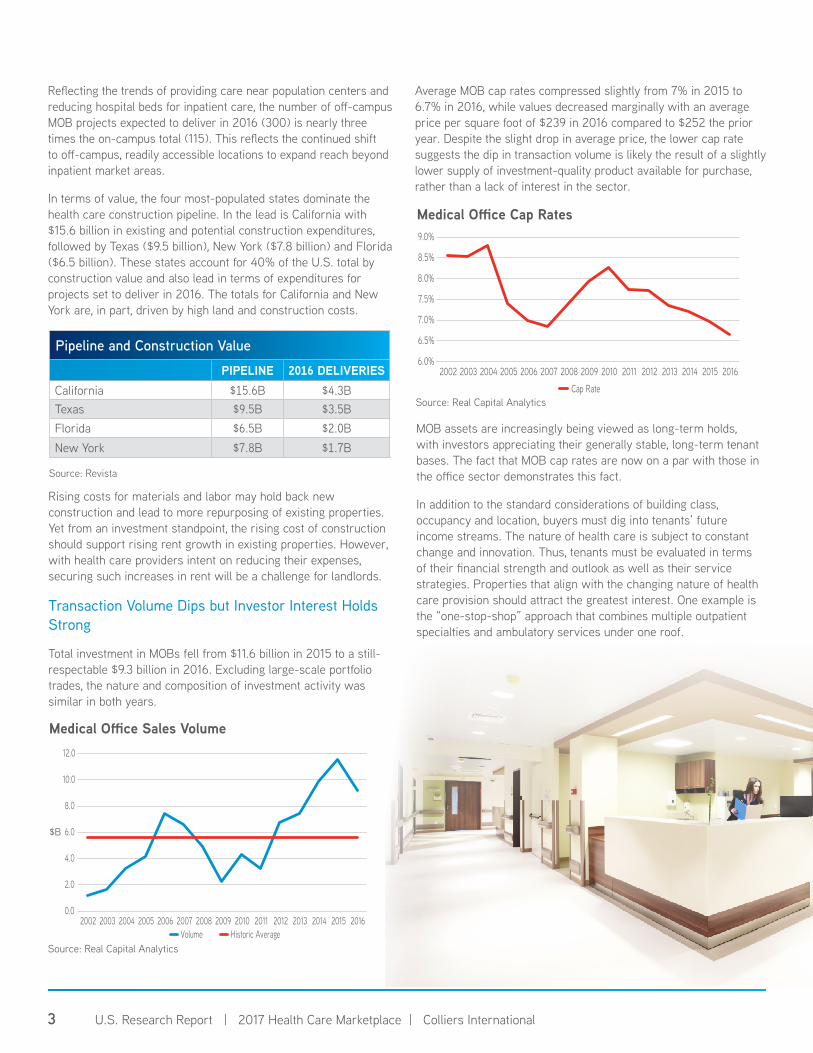
Pipeline and Construction ValuePIPELINE 2016 DELIVERIES
California $15.6B $4.3BTexas $9.5B $3.5BFlorida $6.5B $2.0BNew York $7.8B $1.7B
Reflecting the trends of providing care near population centers and reducing hospital beds for inpatient care, the number of off-campus MOB projects expected to deliver in 2016 (300) is nearly three times the on-campus total (115). This reflects the continued shift to off-campus, readily accessible locations to expand reach beyond inpatient market areas.
In terms of value, the four most-populated states dominate the health care construction pipeline. In the lead is California with $15.6 billion in existing and potential construction expenditures, followed by Texas ($9.5 billion), New York ($7.8 billion) and Florida ($6.5 billion). These states account for 40% of the U.S. total by construction value and also lead in terms of expenditures for projects set to deliver in 2016. The totals for California and New York are, in part, driven by high land and construction costs.
Rising costs for materials and labor may hold back new construction and lead to more repurposing of existing properties. Yet from an investment standpoint, the rising cost of construction should support rising rent growth in existing properties. However, with health care providers intent on reducing their expenses, securing such increases in rent will be a challenge for landlords.
Transaction Volume Dips but Investor Interest Holds Strong
Total investment in MOBs fell from $11.6 billion in 2015 to a still-respectable $9.3 billion in 2016. Excluding large-scale portfolio trades, the nature and composition of investment activity was similar in both years.
Medical Office Sales Volume
Source: Real Capital Analytics
Medical O�ce: Vacancy Rates & Asking Rent
Sources: CoStar
Medical O�ce Sales Volume
Medical O�ce: Net Absorption
Medical O�ce: Sales Price ($ PSF) - by Region
Medical O�ce: Recent & Forecast Completions
Medical O�ce: Cap Rates - United States
Medical O�ce: Cap Rates by Region
0
5
10
15
20
25
2008 2009 2010 2011 2012 2013 2014 2015 2016Absorption Historic Average
MSF
Sources: CoStar
0
5
10
15
20
25
2014 2015 2016 2017Completions (MSF) Value ($B)
Sources: Revista 6.0%
6.5%
7.0%
7.5%
8.0%
8.5%
9.0%
2002 2003 2004 2005 2006 2007 2008 2009 2010 2011 2012 2013 2014 2015 2016
Cap Rate
Sources: Real Capital Analy�cs
0.0% 1.0% 2.0% 3.0% 4.0% 5.0% 6.0% 7.0%
Mid-Atlantic
Midwest
Northeast
Southeast
Southwest
West
8.0%
Sources: Real Capital Analy�cs (Data as of Q4 2016)
Sources: Real Capital Analy�cs
Sources: Real Capital Analy�cs
2008 2009 2010 2011 2012 2013 2014 2015 2016Vacancy Rent PSF
10.0%9.0%8.0%
0.0%1.0%2.0%3.0%4.0%5.0%6.0%7.0%
$25
$24
$23
$22
$21
$20
$19
0.0
2.0
4.0
6.0
8.0
10.0
12.0
2002 2003 2004 2005 2006 2007 2008 2009 2010 2011 2012 2013 2014 2015 2016Volume Historic Average
$B
100.00
150.00
200.00
250.00
300.00
350.00
2002 2003 2004 2005 2006 2007 2008 2009 2010 2011 2012 2013 2014 2015 2016
Mid-Atlantic Midwest Northeast Southeast Southwest West
$/SF
U.S. Average
MOB assets are increasingly being viewed as long-term holds, with investors appreciating their generally stable, long-term tenant bases. The fact that MOB cap rates are now on a par with those in the office sector demonstrates this fact.
In addition to the standard considerations of building class, occupancy and location, buyers must dig into tenants’ future income streams. The nature of health care is subject to constant change and innovation. Thus, tenants must be evaluated in terms of their financial strength and outlook as well as their service strategies. Properties that align with the changing nature of health care provision should attract the greatest interest. One example is the “one-stop-shop” approach that combines multiple outpatient specialties and ambulatory services under one roof.
Medical Office Cap Rates
Source: Real Capital Analytics
Medical O�ce: Vacancy Rates & Asking Rent
Sources: CoStar
Medical O�ce Sales Volume
Medical O�ce: Net Absorption
Medical O�ce: Sales Price ($ PSF) - by Region
Medical O�ce: Recent & Forecast Completions
Medical O�ce: Cap Rates - United States
Medical O�ce: Cap Rates by Region
0
5
10
15
20
25
2008 2009 2010 2011 2012 2013 2014 2015 2016Absorption Historic Average
MSF
Sources: CoStar
0
5
10
15
20
25
2014 2015 2016 2017Completions (MSF) Value ($B)
Sources: Revista 6.0%
6.5%
7.0%
7.5%
8.0%
8.5%
9.0%
2002 2003 2004 2005 2006 2007 2008 2009 2010 2011 2012 2013 2014 2015 2016
Cap Rate
Sources: Real Capital Analy�cs
0.0% 1.0% 2.0% 3.0% 4.0% 5.0% 6.0% 7.0%
Mid-Atlantic
Midwest
Northeast
Southeast
Southwest
West
8.0%
Sources: Real Capital Analy�cs (Data as of Q4 2016)
Sources: Real Capital Analy�cs
Sources: Real Capital Analy�cs
2008 2009 2010 2011 2012 2013 2014 2015 2016Vacancy Rent PSF
10.0%9.0%8.0%
0.0%1.0%2.0%3.0%4.0%5.0%6.0%7.0%
$25
$24
$23
$22
$21
$20
$19
0.0
2.0
4.0
6.0
8.0
10.0
12.0
2002 2003 2004 2005 2006 2007 2008 2009 2010 2011 2012 2013 2014 2015 2016Volume Historic Average
$B
100.00
150.00
200.00
250.00
300.00
350.00
2002 2003 2004 2005 2006 2007 2008 2009 2010 2011 2012 2013 2014 2015 2016
Mid-Atlantic Midwest Northeast Southeast Southwest West
$/SF
U.S. Average
Average MOB cap rates compressed slightly from 7% in 2015 to 6.7% in 2016, while values decreased marginally with an average price per square foot of $239 in 2016 compared to $252 the prior year. Despite the slight drop in average price, the lower cap rate suggests the dip in transaction volume is likely the result of a slightly lower supply of investment-quality product available for purchase, rather than a lack of interest in the sector.
Source: Real Capital Analytics
U.S. Research Report | 2017 Health Care Marketplace | Colliers International4
Medical O�ce: Vacancy Rates & Asking Rent
Sources: CoStar
Medical O�ce Sales Volume
Medical O�ce: Net Absorption
Medical O�ce: Sales Price ($ PSF) - by Region
Medical O�ce: Recent & Forecast Completions
Medical O�ce: Cap Rates - United States
Medical O�ce: Cap Rates by Region
0
5
10
15
20
25
2008 2009 2010 2011 2012 2013 2014 2015 2016Absorption Historic Average
MSF
Sources: CoStar
0
5
10
15
20
25
2014 2015 2016 2017Completions (MSF) Value ($B)
Sources: Revista 6.0%
6.5%
7.0%
7.5%
8.0%
8.5%
9.0%
2002 2003 2004 2005 2006 2007 2008 2009 2010 2011 2012 2013 2014 2015 2016
Cap Rate
Sources: Real Capital Analy�cs
0.0% 1.0% 2.0% 3.0% 4.0% 5.0% 6.0% 7.0%
Mid-Atlantic
Midwest
Northeast
Southeast
Southwest
West
8.0%
Sources: Real Capital Analy�cs (Data as of Q4 2016)
Sources: Real Capital Analy�cs
Sources: Real Capital Analy�cs
2008 2009 2010 2011 2012 2013 2014 2015 2016Vacancy Rent PSF
10.0%9.0%8.0%
0.0%1.0%2.0%3.0%4.0%5.0%6.0%7.0%
$25
$24
$23
$22
$21
$20
$19
0.0
2.0
4.0
6.0
8.0
10.0
12.0
2002 2003 2004 2005 2006 2007 2008 2009 2010 2011 2012 2013 2014 2015 2016Volume Historic Average
$B
100.00
150.00
200.00
250.00
300.00
350.00
2002 2003 2004 2005 2006 2007 2008 2009 2010 2011 2012 2013 2014 2015 2016
Mid-Atlantic Midwest Northeast Southeast Southwest West
$/SF
U.S. Average
2017 Outlook: Initially Cloudy but Clearer Skies AheadThere can be no doubt that the repeal of the ACA and the uncertainty around what lies ahead will cast a shadow over the health care sector for some time. In spite of this, health care real estate fundamentals remain solid and the scale of consumer demand for health care services should continue to increase thanks to the country’s aging population. The stability this provides will continue to garner investor interest in health care real estate.
Setting aside speculation on the ACA, there are several other regulatory and market changes that we expect to affect health care real estate in 2017 and beyond.
> Health Care Systems Grapple with the Site-Neutral Payment Rule
As of January 1, 2017, the Centers for Medicare & Medicaid Services (CMS) stopped paying for services provided at hospitals’ off-campus sites at the same rate as hospital-based outpatient sites (if they started billing Medicare after November 2, 2015). For affected locations, payments from Medicare for services included under the new rules may be reduced by half. While this rule applies specifically to 2017, CMS has left the door open for subsequent years, listing various ways that it could expand site-neutral payments in the future.
The impact of this change on health care providers and their real estate decisions is potentially significant. For new and planned off-campus sites, providers will need to assess whether they can operate profitably with the lower payments from Medicare, likely delaying some new projects or cancelling some real estate deals altogether. For existing sites, health care providers need to evaluate any relocation or expansion opportunities because a move or even a change in suite number could revoke their excepted status.
> Consumers Take on More Financial Responsibility for Health Care
Beyond the government-sponsored changes to reduce costs, employers continue to drive down their costs by shifting more financial responsibility for health care benefits to employees. The continued expansion of high-deductible health plans is also causing individuals to take on more of the costs for their care.
This shift is making health care purchases a more consumer-driven decision based on cost, quality and convenience. A recent study by The Advisory Board Company showed that primary care customers prioritize convenience over the credentials of their provider or continuity in seeing the same provider. The same study showed that short travel distance was the most-cited consideration when choosing a specialist.
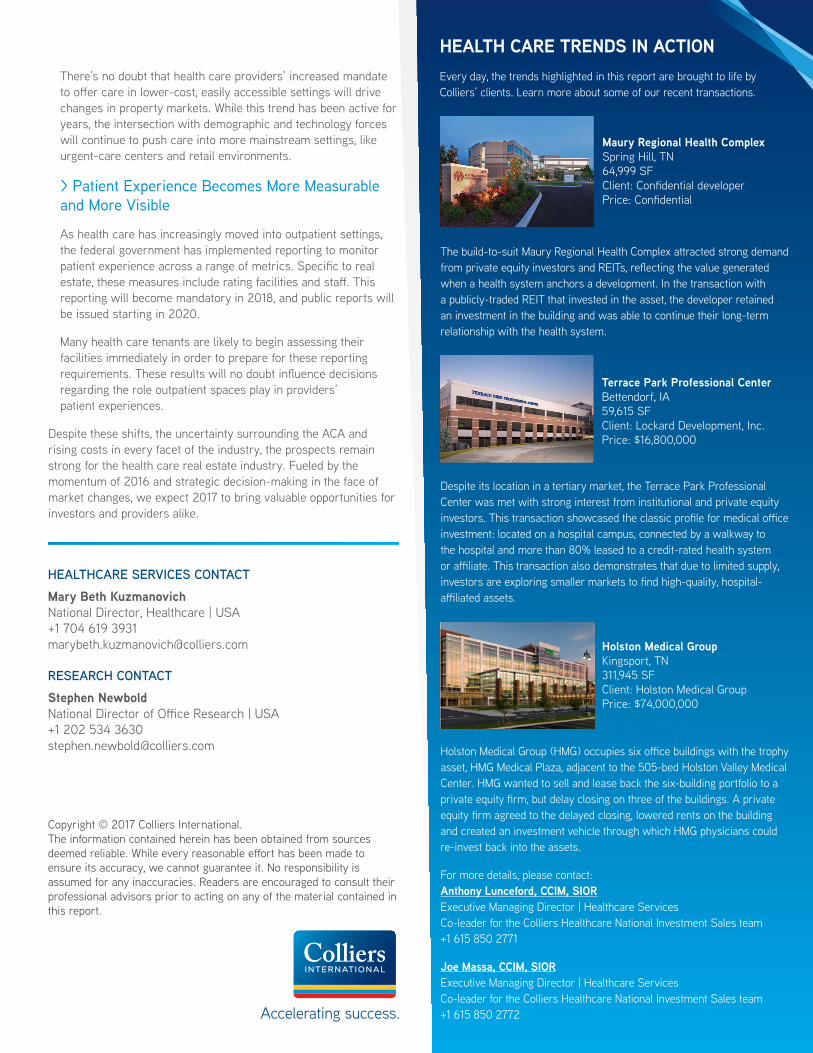
Medical Office Sales Price by Region
Investor composition only shifted at the margins in 2016. Private investors accounted for the largest share of transactions by value (41%) but this is down from 47% in 2015, making this group net dis-investors. REITS and listed real estate companies were the primary net investors, accounting for 29% of transactions by value in 2016 compared to 26% the prior year. Institutions held steady at around 15% while cross-border investment rose from 3% to 6%. Chinese investors dominated the latter group, accounting for more than 50% of cross-border acquisitions by value.
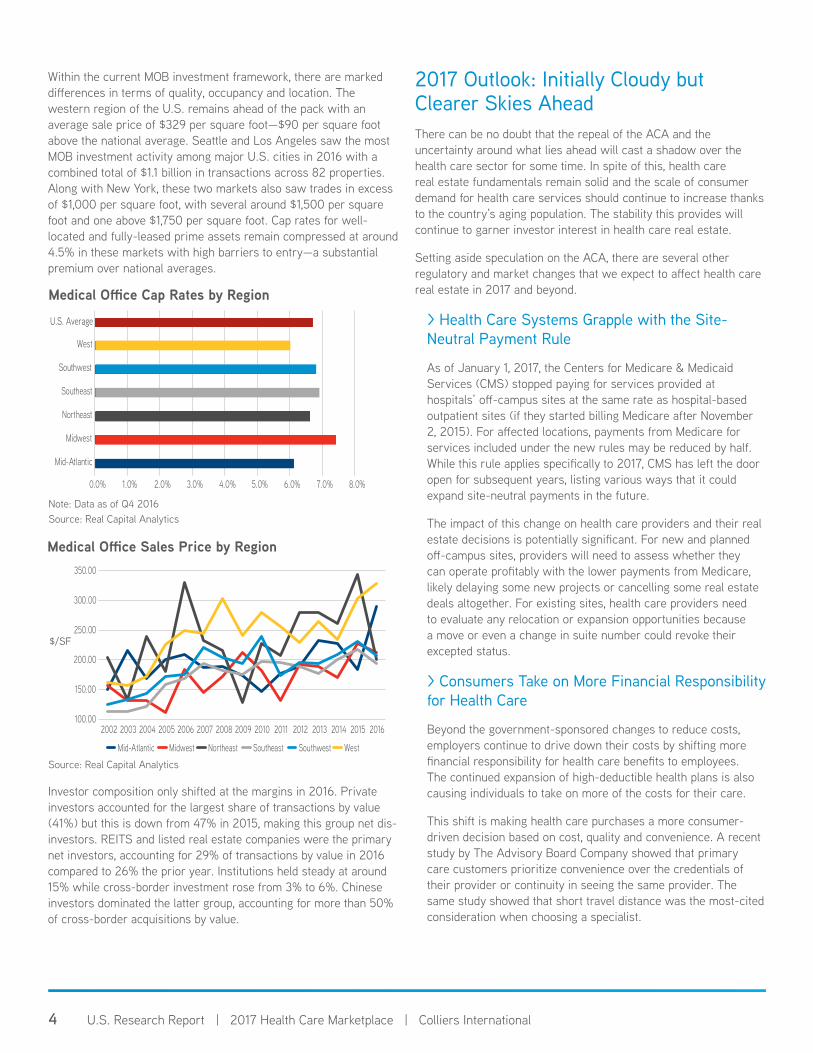
Within the current MOB investment framework, there are marked differences in terms of quality, occupancy and location. The western region of the U.S. remains ahead of the pack with an average sale price of $329 per square foot—$90 per square foot above the national average. Seattle and Los Angeles saw the most MOB investment activity among major U.S. cities in 2016 with a combined total of $1.1 billion in transactions across 82 properties. Along with New York, these two markets also saw trades in excess of $1,000 per square foot, with several around $1,500 per square foot and one above $1,750 per square foot. Cap rates for well-located and fully-leased prime assets remain compressed at around 4.5% in these markets with high barriers to entry—a substantial premium over national averages.
Medical Office Cap Rates by Region
Note: Data as of Q4 2016 Source: Real Capital Analytics
Medical O�ce: Vacancy Rates & Asking Rent
Sources: CoStar
Medical O�ce Sales Volume
Medical O�ce: Net Absorption
Medical O�ce: Sales Price ($ PSF) - by Region
Medical O�ce: Recent & Forecast Completions
Medical O�ce: Cap Rates - United States
Medical O�ce: Cap Rates by Region
0
5
10
15
20
25
2008 2009 2010 2011 2012 2013 2014 2015 2016Absorption Historic Average
MSF
Sources: CoStar
0
5
10
15
20
25
2014 2015 2016 2017Completions (MSF) Value ($B)
Sources: Revista 6.0%
6.5%
7.0%
7.5%
8.0%
8.5%
9.0%
2002 2003 2004 2005 2006 2007 2008 2009 2010 2011 2012 2013 2014 2015 2016
Cap Rate
Sources: Real Capital Analy�cs
0.0% 1.0% 2.0% 3.0% 4.0% 5.0% 6.0% 7.0%
Mid-Atlantic
Midwest
Northeast
Southeast
Southwest
West
8.0%
Sources: Real Capital Analy�cs (Data as of Q4 2016)
Sources: Real Capital Analy�cs
Sources: Real Capital Analy�cs
2008 2009 2010 2011 2012 2013 2014 2015 2016Vacancy Rent PSF
10.0%9.0%8.0%
0.0%1.0%2.0%3.0%4.0%5.0%6.0%7.0%
$25
$24
$23
$22
$21
$20
$19
0.0
2.0
4.0
6.0
8.0
10.0
12.0
2002 2003 2004 2005 2006 2007 2008 2009 2010 2011 2012 2013 2014 2015 2016Volume Historic Average
$B
100.00
150.00
200.00
250.00
300.00
350.00
2002 2003 2004 2005 2006 2007 2008 2009 2010 2011 2012 2013 2014 2015 2016
Mid-Atlantic Midwest Northeast Southeast Southwest West
$/SF
U.S. Average
RESEARCH CONTACTStephen NewboldNational Director of Office Research | USA+1 202 534 [email protected]
HEALTHCARE SERVICES CONTACTMary Beth KuzmanovichNational Director, Healthcare | USA+1 704 619 [email protected]
There’s no doubt that health care providers’ increased mandate to offer care in lower-cost, easily accessible settings will drive changes in property markets. While this trend has been active for years, the intersection with demographic and technology forces will continue to push care into more mainstream settings, like urgent-care centers and retail environments.
> Patient Experience Becomes More Measurable and More Visible
As health care has increasingly moved into outpatient settings, the federal government has implemented reporting to monitor patient experience across a range of metrics. Specific to real estate, these measures include rating facilities and staff. This reporting will become mandatory in 2018, and public reports will be issued starting in 2020.
Many health care tenants are likely to begin assessing their facilities immediately in order to prepare for these reporting requirements. These results will no doubt influence decisions regarding the role outpatient spaces play in providers’ patient experiences.
Despite these shifts, the uncertainty surrounding the ACA and rising costs in every facet of the industry, the prospects remain strong for the health care real estate industry. Fueled by the momentum of 2016 and strategic decision-making in the face of market changes, we expect 2017 to bring valuable opportunities for investors and providers alike.
Copyright © 2017 Colliers International.The information contained herein has been obtained from sources deemed reliable. While every reasonable effort has been made to ensure its accuracy, we cannot guarantee it. No responsibility is assumed for any inaccuracies. Readers are encouraged to consult their professional advisors prior to acting on any of the material contained in this report.
HEALTH CARE TRENDS IN ACTIONEvery day, the trends highlighted in this report are brought to life by Colliers’ clients. Learn more about some of our recent transactions.
Despite its location in a tertiary market, the Terrace Park Professional Center was met with strong interest from institutional and private equity investors. This transaction showcased the classic profile for medical office investment: located on a hospital campus, connected by a walkway to the hospital and more than 80% leased to a credit-rated health system or affiliate. This transaction also demonstrates that due to limited supply, investors are exploring smaller markets to find high-quality, hospital-affiliated assets.
The build-to-suit Maury Regional Health Complex attracted strong demand from private equity investors and REITs, reflecting the value generated when a health system anchors a development. In the transaction with a publicly-traded REIT that invested in the asset, the developer retained an investment in the building and was able to continue their long-term relationship with the health system.
Holston Medical Group (HMG) occupies six office buildings with the trophy asset, HMG Medical Plaza, adjacent to the 505-bed Holston Valley Medical Center. HMG wanted to sell and lease back the six-building portfolio to a private equity firm, but delay closing on three of the buildings. A private equity firm agreed to the delayed closing, lowered rents on the building and created an investment vehicle through which HMG physicians could re-invest back into the assets.
For more details, please contact: Anthony Lunceford, CCIM, SIOR Executive Managing Director | Healthcare Services Co-leader for the Colliers Healthcare National Investment Sales team +1 615 850 2771
Joe Massa, CCIM, SIOR Executive Managing Director | Healthcare Services Co-leader for the Colliers Healthcare National Investment Sales team +1 615 850 2772
Maury Regional Health ComplexSpring Hill, TN64,999 SFClient: Confidential developerPrice: Confidential
Terrace Park Professional CenterBettendorf, IA59,615 SFClient: Lockard Development, Inc. Price: $16,800,000
Holston Medical Group Kingsport, TN311,945 SF Client: Holston Medical GroupPrice: $74,000,000