Embed Size (px)
Citation preview

Calgary & Area
Real Estate
Statistics:
September 2015
1
Request Your Free Home
Evaluation Today!
TABLE OF CONTENTS
3
September Real Estate Summary
4 - 5
City of Calgary Detached Homes Sales Data
6 - 7
City of Calgary Attached Homes Sales Data
8 - 9
City of Calgary Apartment Homes Sales Data
10 - 11
Rural Rockyview Detached Sales Data
12
Message From The Calgary Real Estate Board
13 – 14
Rural Foothills Detached Sales Data
15 – 16
City of Airdrie Detached Sales Data
17 – 18
City of Airdrie Attached Sales Data
19 - 20
City of Airdrie Apartment Sales Data
2
Prices Ease as Expected
Inventories Rise as Sales Activity
Softens Further
“Following four months of relative stability, unadjusted benchmark prices eased as
expected in September to $456,100, a 0.26 per cent decline compared with last year.”
(Source: Calgary Real Estate Board)
Current market conditions have created excellent buying opportunities for investors.
There is more inventory to choose from and the rates are still extremely low!
If you are curious about the investment market or the current market value of your
home, please feel free to contact us.
Hope this helps!
Susanita de Diego
3

City of Calgary Detached Homes Sales Data
Yearly – September 2014 – September 2015
The following table shows the City of Calgary Detached Homes Sales Data for each month since
September of last year.
Month/Year Detached
Sales
Previous Month End
Inventory + Inventory Added
During the Month
% of Available
Inventory Sold
Days on
Market
Months of
Supply
September 2014 1,224 2,616 + 1,868 = 4,484 27.30% 35 2.10
October 2014 1,290 2,571 + 1,626 = 4,197 30.74% 36 1.71
November 2014 1,033 2,205 + 1,126 = 3,331 31.01% 38 1.95
December 2015 607 2,015 + 763 = 2,778 21.85% 41 2.78
January 2015 535 1,687 +1,843 = 3,530 15.16% 37 4.68
February 2015 739 2,506 + 1,674 = 4,180 17.68% 34 3.99
March 2015 1,082 2,950 + 1,776 = 4,726 22.89% 37 2.79
April 2015 1,149 3,016 + 1,774 = 4,790 23.99% 38 2.63
May 2015 1,368 3,024 + 1,877 = 4,903 27.91% 38 2.13
June 2015 1,335 2,913 + 1,832 = 4,745 28.13% 37 2.07
July 2015 1,222 2,760 + 1,733 = 4,493 27.20% 37 2.23
August 2015 995 2,728 + 1,644 = 4,372 22.76% 37 2.80
September 2015 906 2,801+ 1,771 = 4,572 19.82% 37 3.32
City of Calgary Detached Homes Sales Data
Monthly – September 2011 – September 2015
The following table shows the City of Calgary Detached Homes Sales Data for each month since
September of last year.
Month/Year Detached Sales Previous Month End
Inventory + Inventory
Added During the Month
% of Available
Inventory Sold
Days on
Market
Months of
Supply
September 2011 911 3,761 + 2,032 = 5,793 15.73% 48 4.30
September 2012 1,004 2,876 + 1,676 = 4,552 22.06% 42 2.82
September 2013 1,198 2,294 + 1,714 = 4,008 29.89% 37 1.89
September 2014 1,224 2,616 + 1,868 = 4,484 27.30% 35 2.10
September 2015 906 2,801 + 1,771 = 4,572 19.82% 37 3.32
4
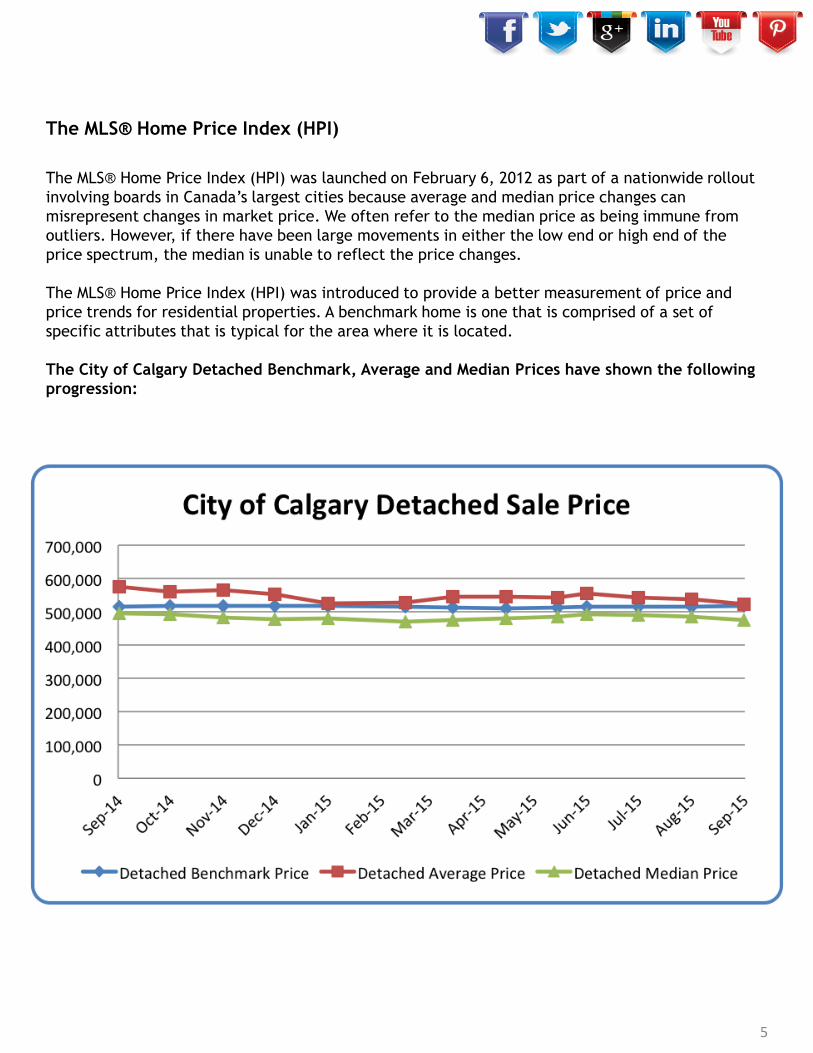
The MLS® Home Price Index (HPI)
The MLS® Home Price Index (HPI) was launched on February 6, 2012 as part of a nationwide rollout
involving boards in Canada’s largest cities because average and median price changes can
misrepresent changes in market price. We often refer to the median price as being immune from
outliers. However, if there have been large movements in either the low end or high end of the
price spectrum, the median is unable to reflect the price changes.
The MLS® Home Price Index (HPI) was introduced to provide a better measurement of price and
price trends for residential properties. A benchmark home is one that is comprised of a set of
specific attributes that is typical for the area where it is located.
The City of Calgary Detached Benchmark, Average and Median Prices have shown the following
progression:
5

City of Calgary Attached Homes Sales Data
Yearly – September 2014 – September 2015
The following table shows the City of Calgary Attached Homes Sales Data for each month since
September of last year.
Month/Year Attached
Sales
Previous Month End
Inventory + Inventory Added
During the Month
% of Available
Inventory Sold
Days on
Market
Months of
Supply
September 2014 487 905 + 699 = 1,604 30.36% 34 1.87
October 2014 466 910 + 671 = 1,581 29.48% 38 1.97
November 2014 419 918 + 489 = 1,407 29.78% 36 2.02
December 2015 252 845 + 315 = 1,160 21.72% 45 2.82
January 2015 190 711 + 700 = 1,411 13.47% 41 5.27
February 2015 261 1,001 + 681 = 1,682 15.52% 34 4.66
March 2015 397 1,231 + 680 = 1,911 20.68% 39 3.17
April 2015 458 1,258 + 680 = 1,938 23.63& 41 2.64
May 2015 465 1,207 + 676 = 1,883 24.69% 43 2.44
June 2015 450 1,136 + 680 = 1,816 24.78% 44 2.48
July 2015 447 1,144 + 668 = 1,782 25.08% 44 2.47
August 2015 367 1,104 + 577 = 1,681 21.83% 44 3.08
September 2015 283 1,130 + 654 = 1,784 15.86% 41 4.35
City of Calgary Attached Homes Sales Data
Monthly – September 2011 – September 2015
The following table shows the City of Calgary Attached Homes Sales Data for each month since
September of last year.
Month/Year Attached Sales Previous Month End
Inventory + Inventory
Added During the Month
% of Available
Inventory Sold
Days on
Market
Months of
Supply
September 2011 308 1,204 + 607 = 1,811 17.01% 52 3.92
September 2012 319 923 + 481 = 1,156 27.06% 47 2.71
September 2013 384 685 + 596 = 1,281 29.98% 32 1.90
September 2014 487 905 + 699 = 1,604 30.36% 34 1.87
September 2015 283 1,130 + 654 = 1,784 15.86% 41 4.35
6
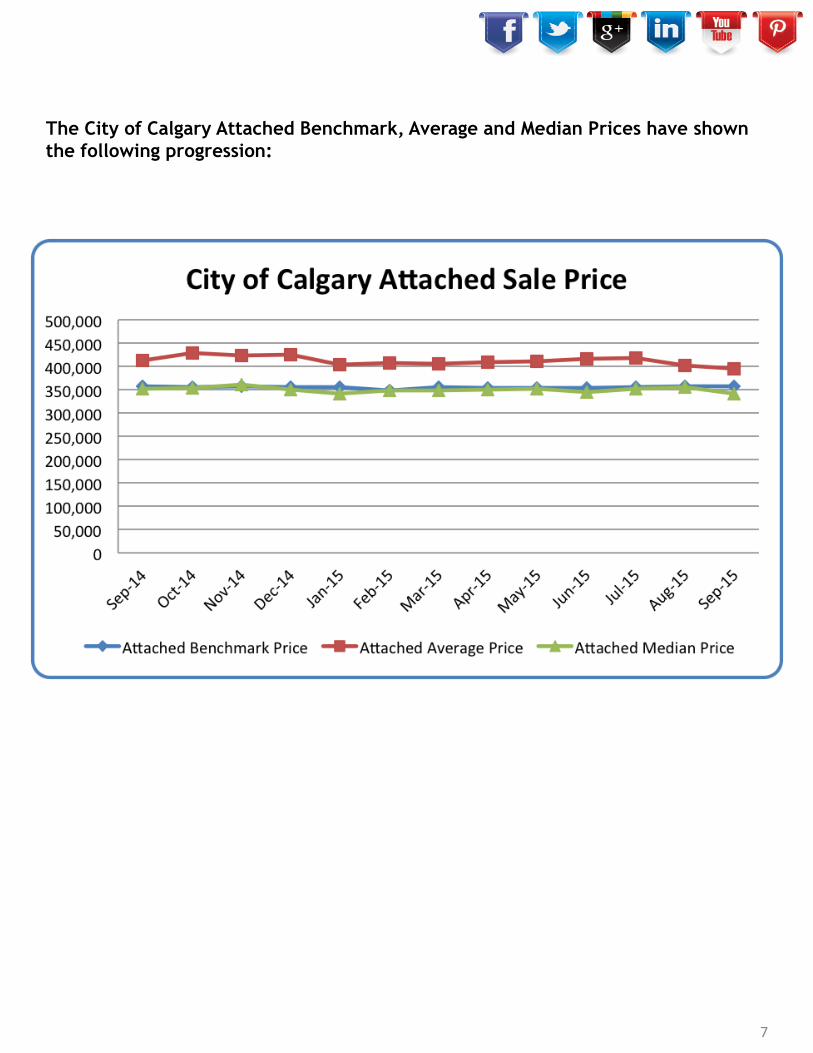
The City of Calgary Attached Benchmark, Average and Median Prices have shown
the following progression:
7

City of Calgary Apartment Homes Sales Data
Yearly – September 2014 – September 2015
The following table shows the City of Calgary Apartment Homes Sales Data for each month since
September of last year.
Month/Year Apartment
Sales
Previous Month End
Inventory + Inventory Added
During the Month
% of Available
Inventory Sold
Days on
Market
Months of
Supply
September 2014 435 1,070 + 692 = 1,762 24.69% 39 2.48
October 2014 389 1,078 + 622 = 1,700 22.88% 41 2.67
November 2014 327 1,039 + 478 = 1,517 21.56% 41 2.95
December 2015 223 966 + 303 = 1,269 17.57% 46 3.65
January 2015 155 815 + 745 = 1,560 9.94% 55 7.41
February 2015 217 1,148 + 595 = 1,743 12.45% 40 6.04
March 2015 303 1,134 + 672 = 2,006 15.10% 43 4.68
April 2015 350 1,419 + 610 = 2,029 17.25% 45 3.85
May 2015 359 1,348 + 612 = 1,960 18.32% 48 3.60
June 2015 399 1,293 + 611 = 1,904 20.96% 48 3.00
July 2015 324 1,196 + 583 = 1,779 18.21% 47 3.77
August 2015 280 1,223 + 513 = 1,736 16.13% 47 4.34
September 2015 259 1,215 + 656 = 1,871 13.84% 49 4.95
City of Calgary Apartment Homes Sales Data
Monthly –September 2011 – September 2015
The following table shows the City of Calgary Apartment Homes Sales Data for each month since
September of last year.
Month/Year Apartment
Sales
Previous Month End
Inventory + Inventory
Added During the Month
% of Available
Inventory Sold
Days on
Market
Months of
Supply
September 2011 237 1,186 + 550 = 1,736 13.65% 59 5.08
September 2012 277 1,023 + 503 = 1,526 18.15% 54 3.61
September 2013 325 688 + 466 = 1,154 28.16% 39 2.10
September 2014 435 1,070 + 692 = 1,762 24.69% 39 2.48
September 2015 259 1,215 + 656 = 1,871 13.84% 49 4.95
8
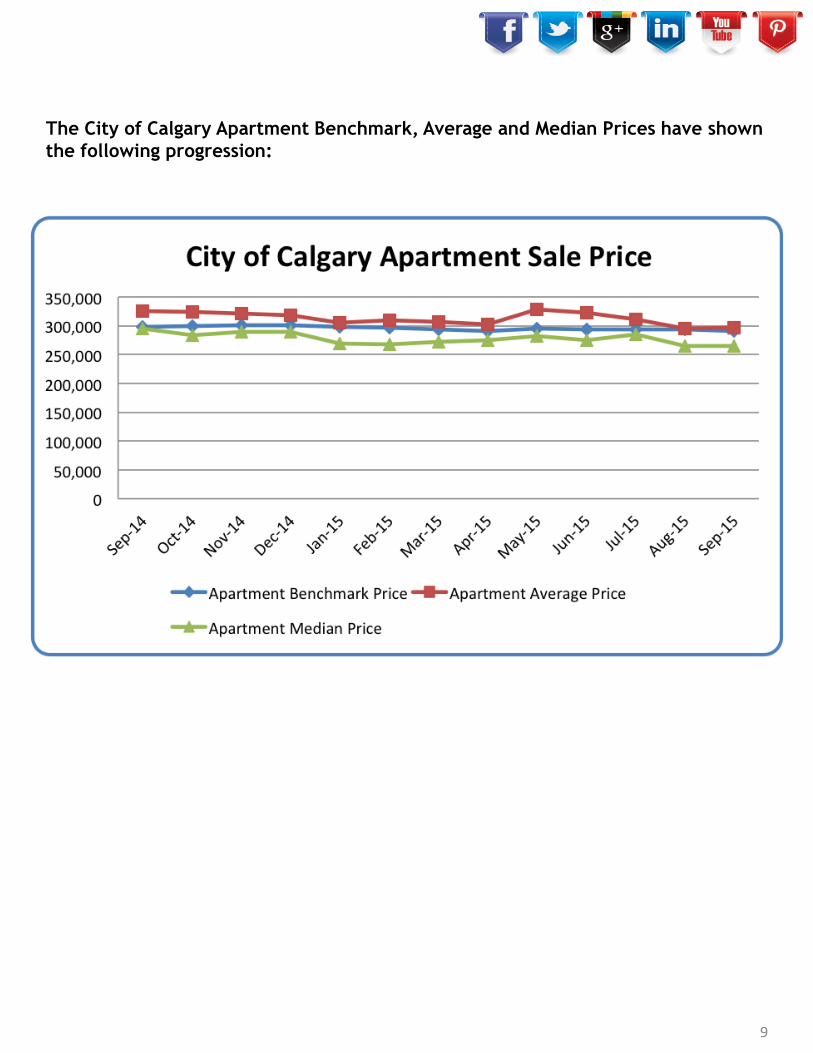
The City of Calgary Apartment Benchmark, Average and Median Prices have shown
the following progression:
9

Rural Rockyview Detached Sales Data
Yearly – September 2014 – September 2015
The following table shows the Rural Rockyview Detached Sales Data for each month since
September of last year.
Month/Year Detached
Sales
Previous Month End
Inventory + Inventory Added
During the Month
% of Available
Inventory Sold
Days on
Market
Months of
Supply
September 2014 46 360 + 86 = 446 10.31% 84 7.28
October 2014 37 335 + 69 = 404 9.16% 92 8.30
November 2014 10 307 + 49 = 356 2.81% 116 28.40
December 2015 15 284 + 31 = 315 4.76% 140 14.67
January 2015 19 220 + 88 = 308 6.17% 142 13.05
February 2015 20 248 + 76 = 324 6.17% 74 13.85
March 2015 23 277 + 82 = 345 6.67% 86 12.87
April 2015 28 296 + 68 = 364 7.69% 71 10.89
May 2015 35 305 + 87 = 392 8.93% 78 9.43
June 2015 41 330 + 84 = 414 9.90% 97 7.93
July 2015 29 325 + 62 = 387 7.49% 84 10.55
August 2015 14 306 + 68 = 374 3.74% 73 23.62
September 2015 15 307 + 65 = 372 4.03% 96 20.27
Rural Rockyview Detached Sales Data
Monthly – September 2011 – September 2015
The following table shows the Rural Rockyview Detached Sales Data for each month since
September of last year.
Month/Year Detached Sales Previous Month End
Inventory + Inventory
Added During the Month
% of Available
Inventory Sold
Days on
Market
Months of
Supply
September 2011 24 454 + 108 = 562 4.27% 109 18.54
September 2012 30 437 + 124 = 561 5.35% 88 15.03
September 2013 31 387 + 103 = 490 6.33% 97 12.48
September 2014 46 360 + 86 = 446 10.31% 84 7.28
September 2015 15 307 + 65 = 372 4.03% 96 20.27
10
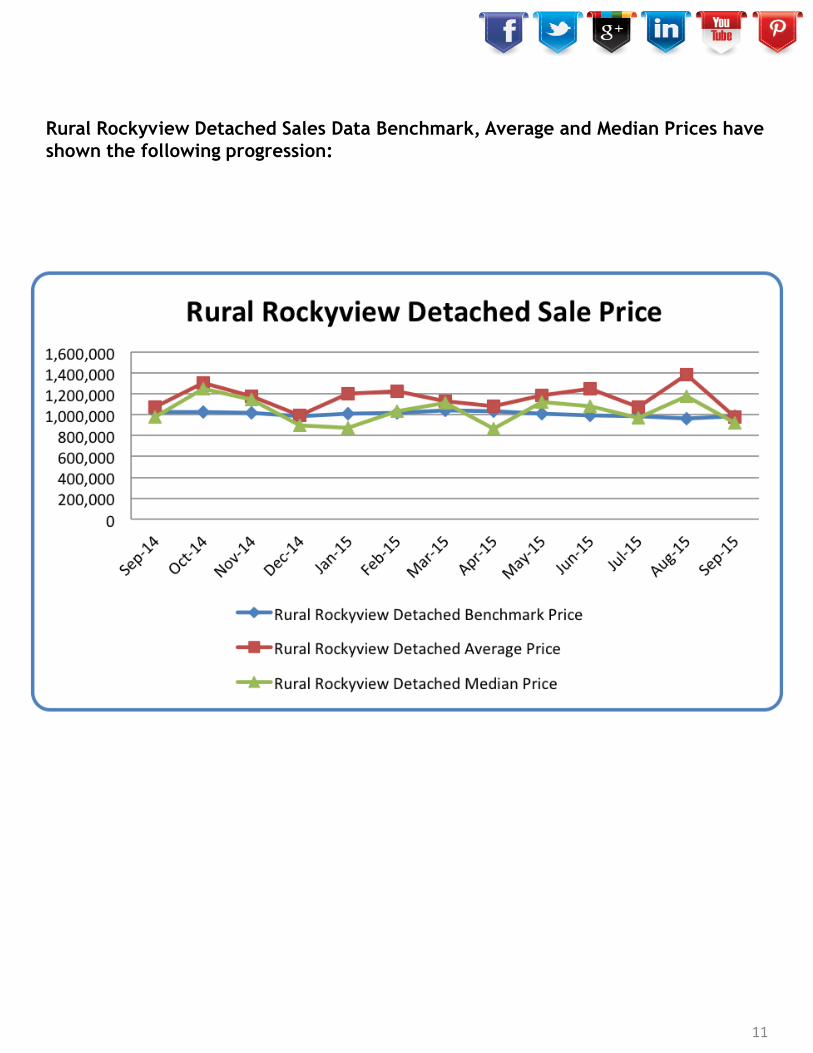
Rural Rockyview Detached Sales Data Benchmark, Average and Median Prices have
shown the following progression:
11
Residential sales in the city of Calgary totaled 1,448
units in September, well below typical activity levels
for this time of year. Year-to-date Calgary sales
remained below both the five- and 10-year year
averages by a respective 10 and 26 per cent.
“Overall sales activity relative to new listings caused
a softening in absorption rates, which resulted in
inventory gains and ultimately placed moderate
downward pressure on pricing.”
“Rising unemployment and persistent weakness in the
local economy is impacting housing demand,” said
CREB® chief economist Ann-Marie Lurie.
“
” 12

Rural Foothills Detached Sales Data
Yearly – September 2014 – September 2015
The following table shows the Rural Foothills Detached Sales Data for each month since September
of last year.
Month/Year Detached
Sales
Previous Month End
Inventory + Inventory Added
During the Month
% of Available
Inventory Sold
Days on
Market
Months of
Supply
September 2014 26 213 + 48 = 261 9.96% 96 7.77
October 2014 15 202 + 39 = 241 6.22% 79 12.13
November 2014 10 182 + 19 = 201 4.98% 103 16.30
December 2015 6 163 + 13 = 176 3.41% 167 19.83
January 2015 8 119 + 33 = 152 5.26% 151 15.13
February 2015 17 121 + 39 = 160 10.63% 139 7.94
March 2015 13 135 + 47 = 182 7.14% 139 11.69
April 2015 15 152 + 52 = 204 7.35% 96 11.93
May 2015 24 179 + 63 = 242 9.92% 102 8.21
June 2015 17 197 + 51 = 248 6.85% 52 12.41
July 2015 16 211 + 39 = 250 6.4% 86 13.00
August 2015 10 208 + 39 = 247 4.05% 56 20.10
September 2015 18 201 + 35 = 236 7.63% 130 9.72
Rural Foothills Detached Sales Data
Monthly – September 2011 – September 2015
The following table shows the Rural Foothills Detached Sales Data for each month since September
of last year.
Month/Year Detached Sales Previous Month End
Inventory + Inventory
Added During the Month
% of Available
Inventory Sold
Days on
Market
Months of
Supply
September 2011 22 279 + 48 = 327 6.73% 128 11.45
September 2012 18 267 + 52 = 319 5.64% 161 13.67
September 2013 20 217 + 37 = 254 7.87% 77 9.80
September 2014 26 213 + 48 = 261 9.96% 96 7.77
September 2015 18 201 + 35 = 236 7.63% 130 9.72
13
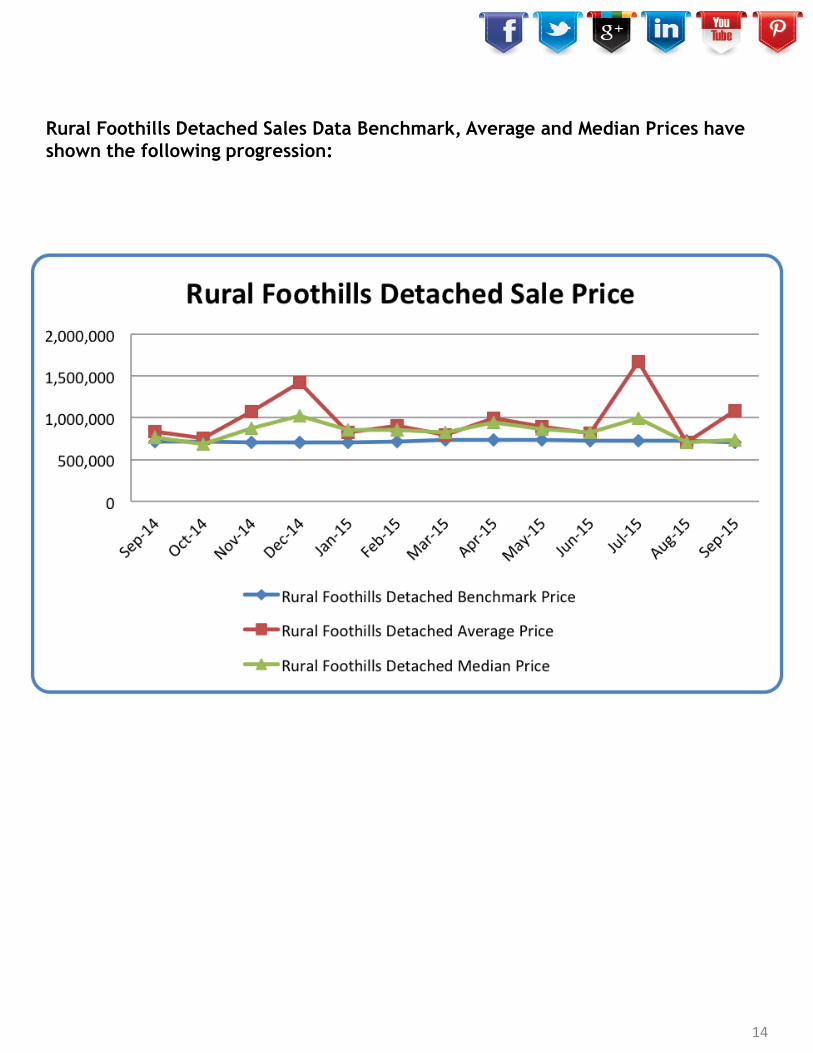
Rural Foothills Detached Sales Data Benchmark, Average and Median Prices have
shown the following progression:
14

City of Airdrie Detached Sales Data
Yearly – September 2014 – September 2015
The following table shows the City of Airdrie Detached Sales Data for each month since September
of last year.
Month/Year Detached
Sales
Previous Month End
Inventory + Inventory Added
During the Month
% of Available
Inventory Sold
Days on
Market
Months of
Supply
September 2014 84 202 + 123 = 325 25.85% 45 2.18
October 2014 106 183 + 120 = 303 34.98% 45 1.41
November 2014 76 149 + 81 = 230 33.04% 38 1.72
December 2015 44 131 + 56 = 187 23.53% 48 2.89
January 2015 41 127 + 154 = 281 14.59% 49 5.15
February 2015 70 211 + 149 = 360 19.44% 35 3.54
March 2015 93 248 + 133 = 381 24.41% 38 2.63
April 2015 92 245 + 140 = 385 23.90% 40 2.64
May 2015 112 243 + 159 = 404 27.72% 41 2.17
June 2015 117 243 + 157 = 400 29.25% 43 2.05
July 2015 106 240 + 128 = 368 28.80% 37 2.11
August 2015 87 224 + 127 = 351 24.79% 40 2.59
September 2015 86 225 + 115 = 340 25.29% 52 2.55
City of Airdrie Detached Sales Data
Monthly – September 2011 – September 2015
The following table shows the City of Airdrie Detached Sales Data for each month since September
of last year.
Month/Year Detached Sales Previous Month End
Inventory + Inventory
Added During the Month
% of Available
Inventory Sold
Days on
Market
Months of
Supply
September 2011 47 278 + 120 = 398 11.81% 49 6.11
September 2012 63 202 + 111 = 313 20.13% 50 3.21
September 2013 77 149 + 115 = 264 29.17% 42 1.99
September 2014 84 202 + 123 = 325 25.85% 45 2.18
September 2015 86 225 + 115 = 340 25.29% 52 2.55
15
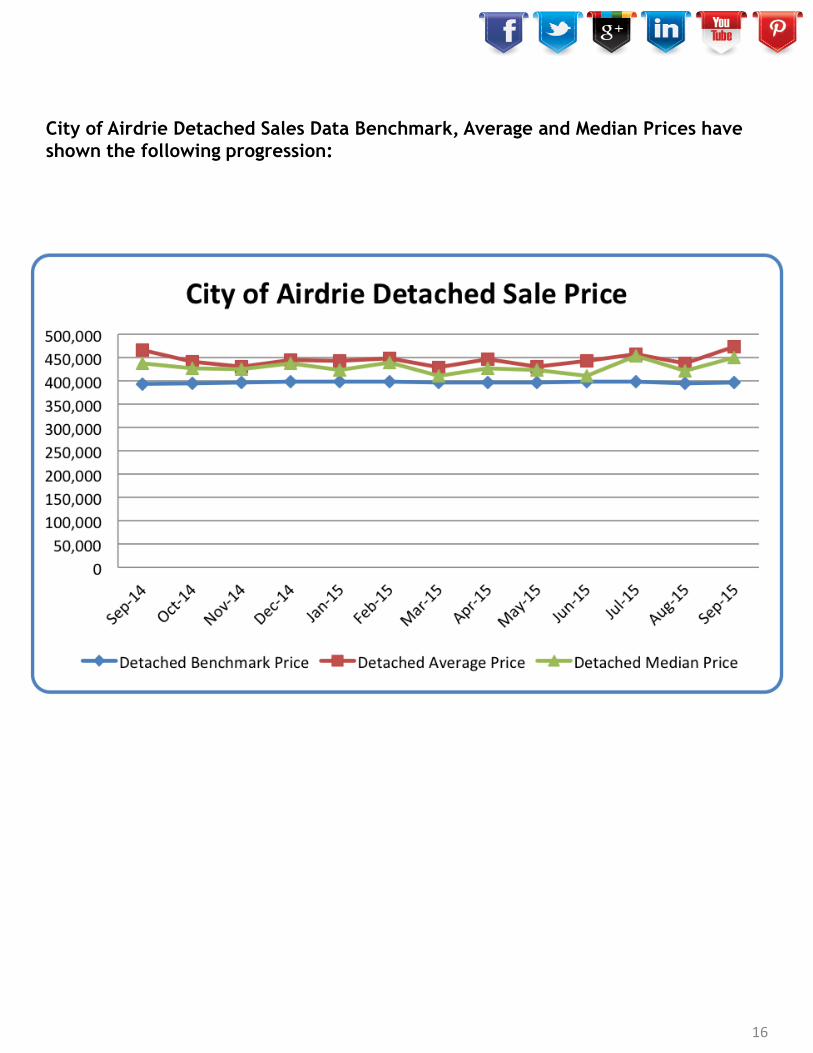
City of Airdrie Detached Sales Data Benchmark, Average and Median Prices have
shown the following progression:
16

City of Airdrie Attached Sales Data
Yearly –September 2014 – September 2015
The following table shows the City of Airdrie Attached Sales Data for each month since September
of last year.
Month/Year Attached
Sales
Previous Month End
Inventory + Inventory Added
During the Month
% of Available
Inventory Sold
Days on
Market
Months of
Supply
September 2014 49 51 + 41 = 92 53.26% 33 .87
October 2014 37 40 + 45 = 85 43.53% 34 .81
November 2014 33 30 + 21 = 52 63.46% 40 .73
December 2015 11 24 + 14 = 38 28.95% 28 2.09
January 2015 17 23 + 43 = 66 25.76% 36 2.53
February 2015 16 43 + 56 = 99 16.16% 40 4.63
March 2015 32 74 + 50 = 124 25.81% 38 2.47
April 2015 40 79 + 55 = 134 29.85% 37 2.13
May 2015 34 85 + 39 = 124 27.42% 31 2.24
June 2015 40 76 + 60 = 136 29.41% 43 2.23
July 2015 44 89 + 51 = 140 31.43% 43 1.91
August 2015 39 84 + 38 = 122 31.97% 43 1.87
September 2015 20 73 + 45 = 118 16.95% 41 4.15
City of Airdrie Attached Sales Data
Monthly – September 2011 – September 2015
The following table shows the City of Airdrie Attached Sales Data for each month since September
of last year.
Month/Year Attached Sales Previous Month End
Inventory + Inventory
Added During the Month
% of Available
Inventory Sold
Days on
Market
Months of
Supply
September 2011 3 37 + 17 = 54 5.56% 36 12.33
September 2012 12 25 + 20 = 45 26.67% 46 2.42
September 2013 23 15 + 21 = 36 63.89% 24 .39
September 2014 49 51 + 41 = 92 53.26% 33 .87
September 2015 20 73 + 45 = 118 16.95% 41 4.15
17
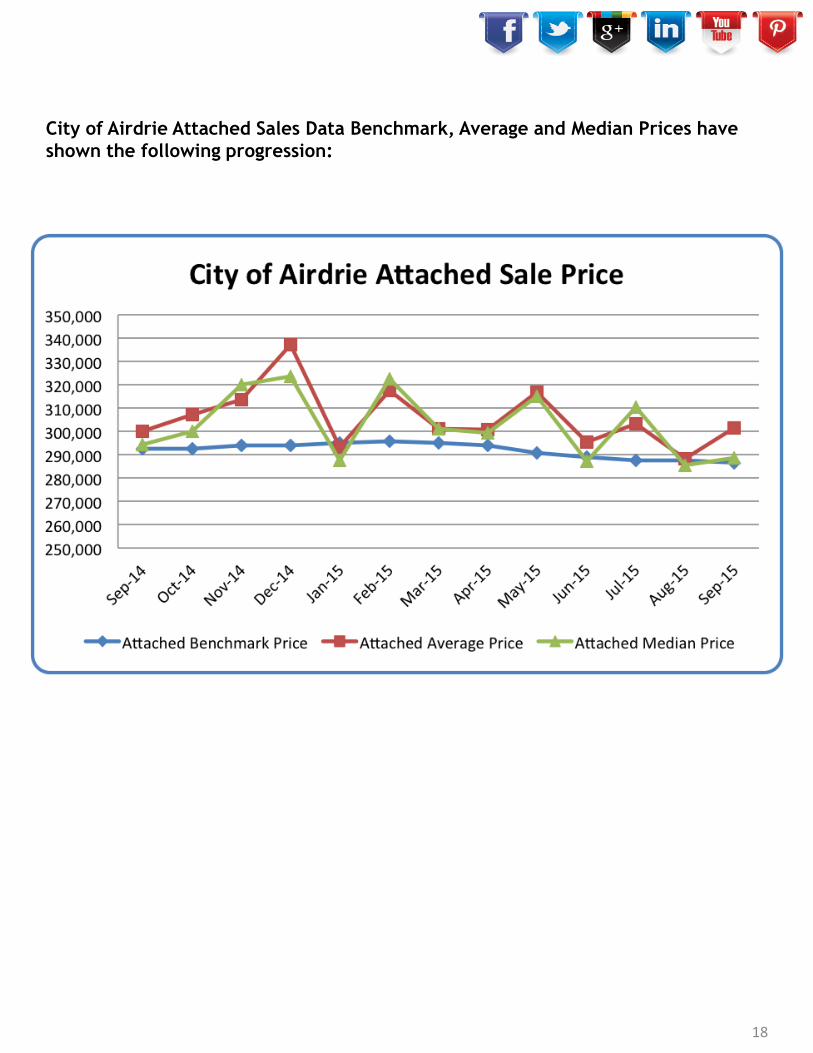
City of Airdrie Attached Sales Data Benchmark, Average and Median Prices have
shown the following progression:
18
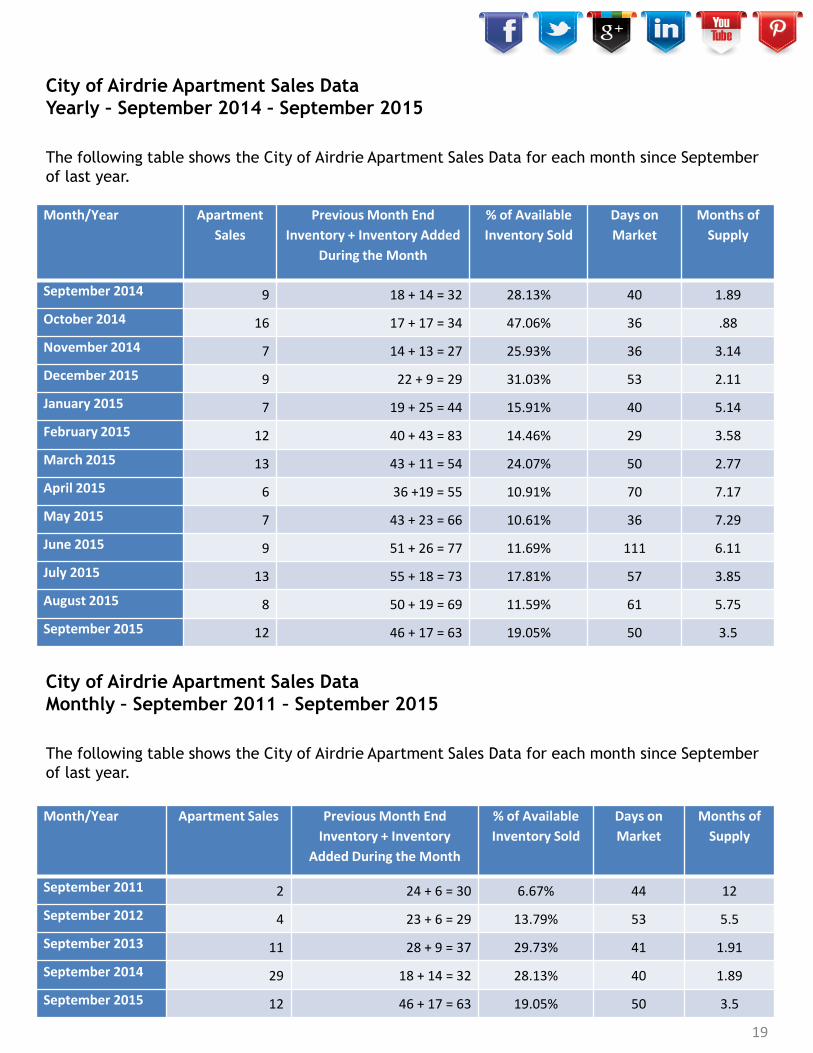
City of Airdrie Apartment Sales Data
Yearly – September 2014 – September 2015
The following table shows the City of Airdrie Apartment Sales Data for each month since September
of last year.
Month/Year Apartment
Sales
Previous Month End
Inventory + Inventory Added
During the Month
% of Available
Inventory Sold
Days on
Market
Months of
Supply
September 2014 9 18 + 14 = 32 28.13% 40 1.89
October 2014 16 17 + 17 = 34 47.06% 36 .88
November 2014 7 14 + 13 = 27 25.93% 36 3.14
December 2015 9 22 + 9 = 29 31.03% 53 2.11
January 2015 7 19 + 25 = 44 15.91% 40 5.14
February 2015 12 40 + 43 = 83 14.46% 29 3.58
March 2015 13 43 + 11 = 54 24.07% 50 2.77
April 2015 6 36 +19 = 55 10.91% 70 7.17
May 2015 7 43 + 23 = 66 10.61% 36 7.29
June 2015 9 51 + 26 = 77 11.69% 111 6.11
July 2015 13 55 + 18 = 73 17.81% 57 3.85
August 2015 8 50 + 19 = 69 11.59% 61 5.75
September 2015 12 46 + 17 = 63 19.05% 50 3.5
City of Airdrie Apartment Sales Data
Monthly – September 2011 – September 2015
The following table shows the City of Airdrie Apartment Sales Data for each month since September
of last year.
Month/Year Apartment Sales Previous Month End
Inventory + Inventory
Added During the Month
% of Available
Inventory Sold
Days on
Market
Months of
Supply
September 2011 2 24 + 6 = 30 6.67% 44 12
September 2012 4 23 + 6 = 29 13.79% 53 5.5
September 2013 11 28 + 9 = 37 29.73% 41 1.91
September 2014 29 18 + 14 = 32 28.13% 40 1.89
September 2015 12 46 + 17 = 63 19.05% 50 3.5
19
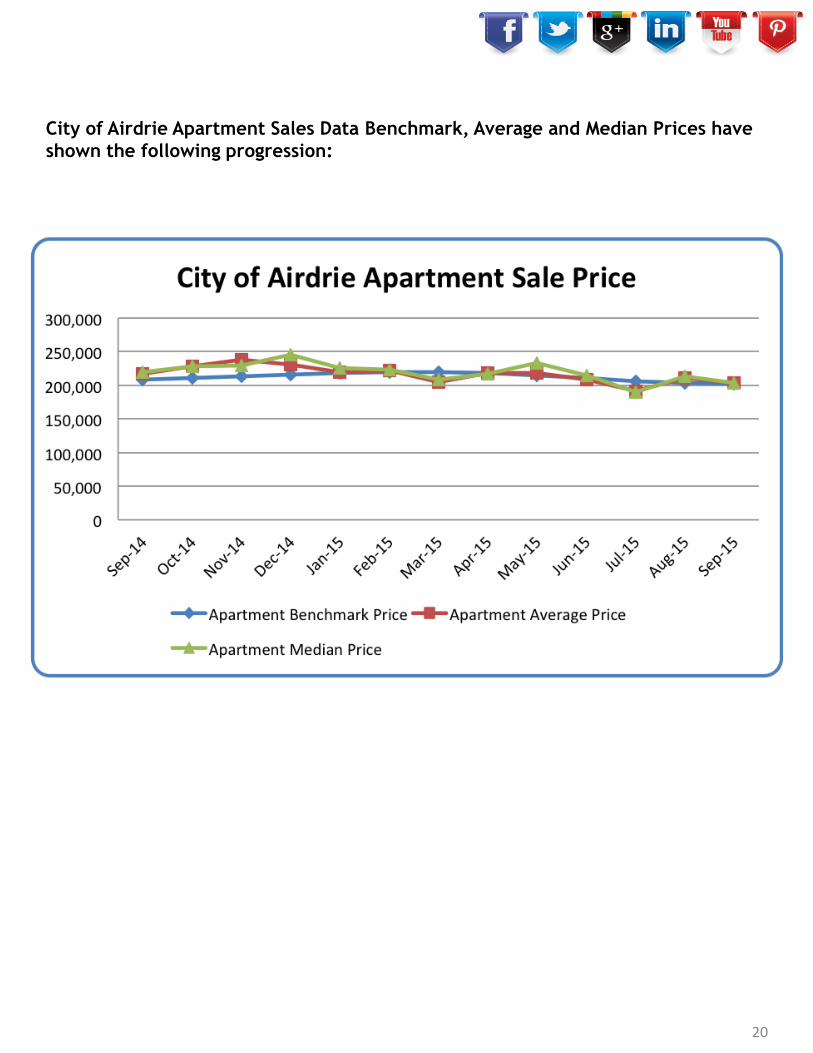
City of Airdrie Apartment Sales Data Benchmark, Average and Median Prices have
shown the following progression:
20

Curious About the
Value of Your Home?
As you can see, current market conditions play a critical role in determining the value of your home. Equally important however, is having an experienced and knowledgeable professional Realtor® on your side. Coldwell Banker Complete Real Estate would welcome the opportunity to discuss any of your Real Estate needs at your convenience.
#yesyoumatter
Request Your Free Home
Evaluation Today!
Coldwell Banker Complete Real Estate Phone: 403-686-1455
21