Embed Size (px)
Citation preview

Colliers Radar
Asia Pacific Property Research 14 November 2016
Asia Pacific: the dragons rise anew Prospects improving in China and Hong Kong; time to look again at Singapore
Andrew Haskins Executive Director | Research | Asia
The outcome of the US presidential
election raises challenges for Asia.
However, Chinese growth remains high
and a financial crisis is unlikely, while
growth in Hong Kong is improving. The
brighter outlook in these markets should
boost office property, as firm investment
demand suggests, although residential
property faces risks. Singapore's long-
run attractions outweigh near-term
pressure in the office market. Australia's
economy is buoyant, but the positive
story is well-known. Global investors
and occupiers should stay focused on
China and look again at Singapore.
Executive Summary The economic environment in Asia is improving. China's
growth has beaten forecasts recently, and should remain
firm. Given sound national finances and a reasonably
healthy banking system, we think a financial crisis is
unlikely, although a decline in the residential market is
possible. In Hong Kong growth has also surprised on the
upside, office rents are still rising, and Chinese interest is
high. This situation explains the territory's rise to the
second-ranked city investment market in Asia Pacific.
In Singapore growth has been slowing, and rising supply
has weighed on property markets. However, the country
enjoys good governance and high transparency, and we
think it will continue to attract institutional investors
looking for stable long-term returns. Australia's economy
remains buoyant, driving strong rent growth in Sydney
and Melbourne. However, this story is well-known and in
any case there is a growing shortage of property stock.
Donald Trump's US election victory raises challenges for
Asia, including a possible hit to confidence and growth
as well as tariffs on imports. Uncertainty has risen for
China in particular and this must temper our optimism
about improving near-term prospects. Mr Trump's
policies may prove either expansionary or contractionary
for the US economy; there are arguments both ways.
However, if US growth ultimately suffers under Mr
Trump, US interest rates may only rise very gradually
and the dollar may fall. This outcome would support
Hong Kong property assets, since it would mean that
negative real interest rates persist. However, dollar
weakness would hurt Asian exporting nations, notably
Japan where the dull economy and yen strength have
already depressed property investment volumes.
Real though the risks are, the US election outcome
should not blind global property investors and occupiers
to the fact that current economic developments in much
of Asia Pacific are positive. Besides, we expect the
combination of Mr Trump's victory and Brexit in the UK to
serve as a reminder of the potential for shocks in
developed as well as emerging markets, and so mitigate
political and economic concerns about the region.
From an investment perspective, Hong Kong looks good
in the near term. Shanghai and Beijing have appeal if
one looks past low near-term rent growth due to rising
supply. Singapore's 3.5% net yield and long-run
strengths outweigh falling near-term rents. India has high
long-run growth potential and deserves closer attention.
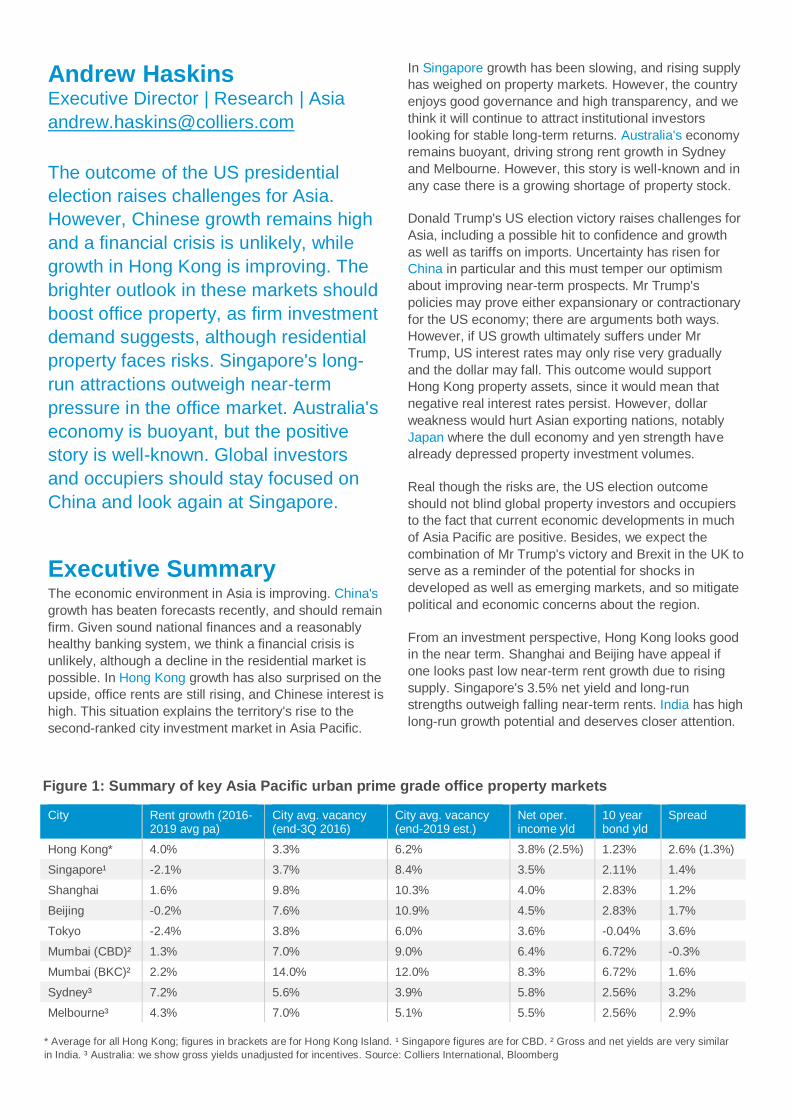
* Average for all Hong Kong; figures in brackets are for Hong Kong Island. ¹ Singapore figures are for CBD. ² Gross and net yields are very similar
in India. ³ Australia: we show gross yields unadjusted for incentives. Source: Colliers International, Bloomberg
Figure 1: Summary of key Asia Pacific urban prime grade office property markets
City Rent growth (2016-2019 avg pa)
City avg. vacancy (end-3Q 2016)
City avg. vacancy (end-2019 est.)
Net oper. income yld
10 year bond yld
Spread
Hong Kong* 4.0% 3.3% 6.2% 3.8% (2.5%) 1.23% 2.6% (1.3%)
Singapore¹ -2.1% 3.7% 8.4% 3.5% 2.11% 1.4%
Shanghai 1.6% 9.8% 10.3% 4.0% 2.83% 1.2%
Beijing -0.2% 7.6% 10.9% 4.5% 2.83% 1.7%
Tokyo -2.4% 3.8% 6.0% 3.6% -0.04% 3.6%
Mumbai (CBD)² 1.3% 7.0% 9.0% 6.4% 6.72% -0.3%
Mumbai (BKC)² 2.2% 14.0% 12.0% 8.3% 6.72% 1.6%
Sydney³ 7.2% 5.6% 3.9% 5.8% 2.56% 3.2%
Melbourne³ 4.3% 7.0% 5.1% 5.5% 2.56% 2.9%
3 Asia Pacific:
the dragons rise anew | 14 November 2016 | Property Research | Colliers International
Contents
Executive Summary ............................ 2
APAC economic situation .................. 5
Asia unpopular, not Asian property ............ 5
Economic prospects strong or improving across much of APAC ................................ 6
Trump's presidency threatens to hold down growth in Asia ............................................. 6
China ..................................................... 8
Real GDP growth remains high and steady 8
Debt is high, but a financial crisis is unlikely ................................................................... 8
Prospects for commercial property favourable ................................................ 10
China now the second-ranked country investment market in APAC ..................... 11
Residential market remains at risk, but recent cooling is encouraging ................... 12
Hong Kong ......................................... 14
Prospects turning brighter ........................ 14
Island office rents and investment market strong, Kowloon weaker ........................... 16
Hong Kong now the second-ranked city investment market in APAC ..................... 16
Risks: retail sector and long-run outlook for residential property ................................... 17
Singapore ........................................... 19
Economic growth has been slowing ......... 19
Office property market under pressure in the near term ............................................ 19
4 Asia Pacific:
the dragons rise anew | 14 November 2016 | Property Research | Colliers International
Long-run prospects brighter ..................... 20
Time to look at Singapore again .............. 21
Australia.............................................. 22
Good times keep rolling for the Lucky Country .................................................... 22
Office markets still very strong in Sydney and Melbourne ......................................... 24
Investment in Australia driven by Asia, especially China....................................... 25
Core markets still attractive, even if investment story is well-known ................ 25
Japan ................................................... 26
Economy only ticking away ...................... 26
Weakening outlook for Tokyo office property market ...................................................... 26
Investment volumes declining .................. 27
Japanese property: dull near-term outlook, brighter in the long term ........................... 27
India ..................................................... 28
Economic outlook remains positive, supported by new policy initiatives........... 28
Office leasing market firm: focus on Bangalore and Hyderabad ....................... 29
Medium-term investment opportunities substantial ............................................... 29
Time for investors to put India on their radar screens .................................................... 30
US election: impact on Asia ............. 31
Trump's victory surprises global markets, but less so than Brexit ............................. 31
Expansionary and contractionary: different views about Trump's economic policies ... 31
Slow US interest rate rises would support Hong Kong property ................................. 32
USD weakness would hurt Japan and other Asian exporting nations ............................ 32
Direct implications for Asian property markets are limited ................................... 32
Trump and Brexit surprises should lower concern about Asia over time ................... 32
5 Asia Pacific:
the dragons rise anew | 14 November 2016 | Property Research | Colliers International
APAC economic
situation
Asia unpopular, not Asian property As we have often observed in our research, Asian
property has a problem: it has been unpopular ever
since the Global Financial Crisis (GFC) of 2008-2009. As
shown in Figure 2 below, based on data from Real
Capital Analytics, outbound capital flows from Asia into
property markets in other regions of the world surged
12x over 2008-2015 to USD66.6 billion, while inbound
capital flows halved to USD12.1 billion. The pattern over
the first nine months of 2016 was similar; total outbound
capital flows from Asian real estate amounted to
USD44.7bn – more than 6x inflows of USD7.3bn.
We believe that this divergence reflects general
pessimism about emerging markets since the GFC,
rather than specific problems in Asian property markets.
Perhaps surprisingly (considering that the crisis started
there), the US has been the chief engine of world
economic growth since the GFC. In contrast, the
economic performance of emerging markets has
deteriorated sharply. This deterioration partly reflects the
end of the period of rapid expansion in China (roughly
2005-2007) which had fuelled a global boom in
commodities markets. However, it also reflects sharp
slowdowns in emerging markets outside Asia: Russia,
South Africa, Turkey and - most importantly - Brazil,
which now faces its second year of recession.
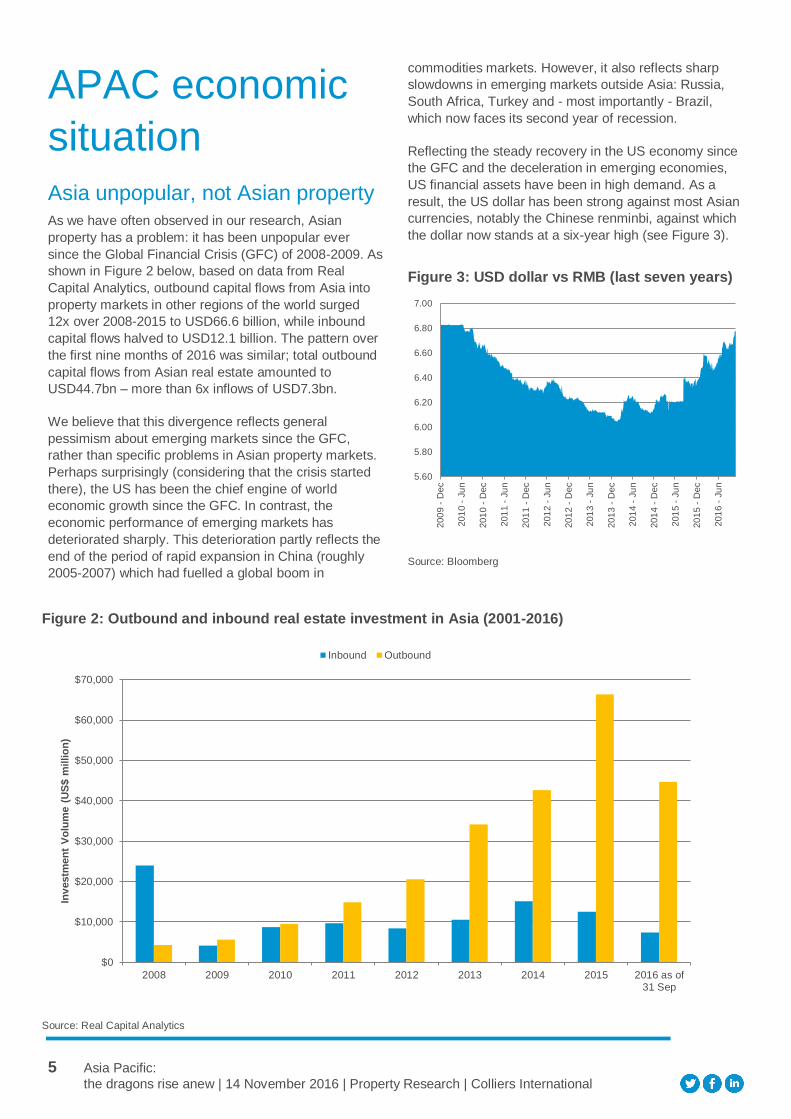
Reflecting the steady recovery in the US economy since
the GFC and the deceleration in emerging economies,
US financial assets have been in high demand. As a
result, the US dollar has been strong against most Asian
currencies, notably the Chinese renminbi, against which
the dollar now stands at a six-year high (see Figure 3).
Figure 3: USD dollar vs RMB (last seven years)
Source: Bloomberg
5.60
5.80
6.00
6.20
6.40
6.60
6.80
7.00
200
9 -
Dec
201
0 -
Ju
n
201
0 -
Dec
201
1 -
Ju
n
201
1 -
Dec
201
2 -
Ju
n
201
2 -
Dec
201
3 -
Ju
n
201
3 -
Dec
201
4 -
Ju
n
201
4 -
Dec
201
5 -
Ju
n
201
5 -
Dec
201
6 -
Ju
n
Figure 2: Outbound and inbound real estate investment in Asia (2001-2016)
Source: Real Capital Analytics
$0
$10,000
$20,000
$30,000
$40,000
$50,000
$60,000
$70,000
2008 2009 2010 2011 2012 2013 2014 2015 2016 as of31 Sep
Inv
estm
en
t V
olu
me (
US
$ m
illio
n)
Inbound Outbound
6 Asia Pacific:
the dragons rise anew | 14 November 2016 | Property Research | Colliers International
Economic prospects strong or improving across much of APAC
Is Asia's general unpopularity still justified? As we shall
argue in detail in this report, we believe that economic
prospects for many countries in the Asia Pacific region
have improved recently. The two large emerging Asian
economies, China and India, continue to grow at 6.5-
7.5% p.a.; and so far this year growth has accelerated
slightly in both markets. Strong secular growth is likely to
continue in both countries for some years.
Regarding China, concerns about financial stability
persist. These concerns are justifiable, considering that
the country's debt/GDP ratio stands at close to 250%,
and that growth in total social funding (essentially
aggregate credit growth) is running at 12% per year or
higher; it is 16% on some economists' definitions. Over
the long run, China faces a challenge in weaning itself
off a credit-driven growth model driven by high
investment. However, in the near term, given strong
national finances and a banking system which is still
reasonably healthy overall, we see the probability of a
financial crisis as small. The chance of a significant
correction in residential property prices appears higher,
although recent signs of cooling in the market are
encouraging.
Hong Kong has also recorded positive economic
surprises recently. Real GDP growth has picked up,
goods exports have increased, and business sentiment
has improved. Historical evidence suggests that
business confidence in Hong Kong has been closely
correlated with the performance of office rents in the
territory. The recent improvement in confidence should
drive further rent increases in Hong Kong Island,
although the Kowloon market is much weaker.
Singapore’s recent economic performance has been
disappointing. GDP growth slowed sharply in Q2 2016,
and may have been negative, while manufacturing
activity contracted. However, the recent weakness is
insufficient to dent Singapore's long-established
reputation as both a highly resilient economy and a
world-class metropolis which is attractive for business.
In Australia, the economy continues to roll, and the
country has recently recorded its 100th consecutive
quarter of GDP growth. Since the end of the mining
boom, the Australian economy has been driven
increasingly by expansion in professional and services
employment in the traditionally dominant south-eastern
states of New South Wales and Victoria. This expansion
has driven strong rent growth in Sydney and Melbourne,
and looks set to go on for the next couple of years.
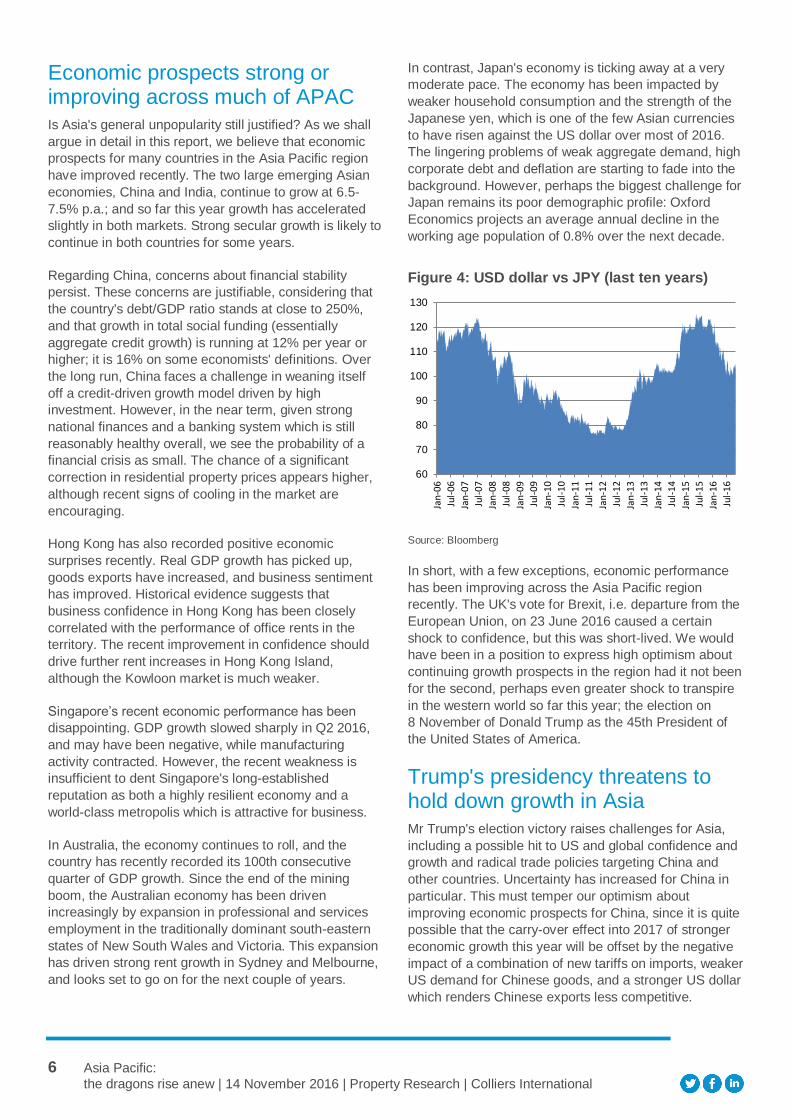
In contrast, Japan's economy is ticking away at a very
moderate pace. The economy has been impacted by
weaker household consumption and the strength of the
Japanese yen, which is one of the few Asian currencies
to have risen against the US dollar over most of 2016.
The lingering problems of weak aggregate demand, high
corporate debt and deflation are starting to fade into the
background. However, perhaps the biggest challenge for
Japan remains its poor demographic profile: Oxford
Economics projects an average annual decline in the
working age population of 0.8% over the next decade.
Figure 4: USD dollar vs JPY (last ten years)
Source: Bloomberg
In short, with a few exceptions, economic performance
has been improving across the Asia Pacific region
recently. The UK's vote for Brexit, i.e. departure from the
European Union, on 23 June 2016 caused a certain
shock to confidence, but this was short-lived. We would
have been in a position to express high optimism about
continuing growth prospects in the region had it not been
for the second, perhaps even greater shock to transpire
in the western world so far this year; the election on
8 November of Donald Trump as the 45th President of
the United States of America.
Trump's presidency threatens to hold down growth in Asia
Mr Trump's election victory raises challenges for Asia,
including a possible hit to US and global confidence and
growth and radical trade policies targeting China and
other countries. Uncertainty has increased for China in
particular. This must temper our optimism about
improving economic prospects for China, since it is quite
possible that the carry-over effect into 2017 of stronger
economic growth this year will be offset by the negative
impact of a combination of new tariffs on imports, weaker
US demand for Chinese goods, and a stronger US dollar
which renders Chinese exports less competitive.
60
70
80
90
100
110
120
130
Jan
-06
Jul-
06
Jan
-07
Jul-
07
Jan
-08
Jul-
08
Jan
-09
Jul-
09
Jan
-10
Jul-
10
Jan
-11
Jul-
11
Jan
-12
Jul-
12
Jan
-13
Jul-
13
Jan
-14
Jul-
14
Jan
-15
Jul-
15
Jan
-16
Jul-
16
7 Asia Pacific:
the dragons rise anew | 14 November 2016 | Property Research | Colliers International
In office, it is conceivable that Mr Trump will prove rather
less radical than his policy proposals suggest. Nor is it
yet clear whether his policies will serve to boost or
depress US economic growth in the near term; there are
arguments both ways which we shall discuss further in
the final section of this report. However, if US growth
does suffer under Mr Trump, then the Federal Reserve
may only raise US interest rates very gradually over the
next few years. This would be positive for Hong Kong
property assets, since Hong Kong interest rates are
effectively tied to US rates as a result of the territory's
currency peg.
If US interest rates only rise gradually, then the US dollar
may also start to weaken after many years of strength.
This would be negative for Asia exporting nations in
general because it would reduce their trading
competiveness; this would apply not only to China but
also to Japan, South Korea and Taiwan. As it happens,
Japan has already experienced declines in property
investment volumes so far in 2016 as the combined
result of a dull economy and the strength of the
Japanese yen.
Direct medium-term implications of Mr Trump's victory
for the property markets within developing Asian
economies are more limited. As noted, China and India
are experiencing strong secular growth which is unlikely
to slow sharply for some time, despite the risks posed by
Mr Trump's presidency to Chinese trade. Investors and
large multinational occupiers should continue to be
attracted to important commercial property markets like
Shanghai regardless of who is US president. Meanwhile,
demand and supply in the Chinese and Indian residential
markets are driven largely by domestic factors such as
urbanisation, wealth levels, interest rates, lending
policies and real estate regulation which have little to do
with the US.
8 Asia Pacific:
the dragons rise anew | 14 November 2016 | Property Research | Colliers International
China
Real GDP growth remains high and steady We believe that China's real GDP will continue to
expand, albeit at a moderating pace. Real GDP looks set
to grow by at least 6.6% y-o-y over 2016, and according
to the International Monetary Fund growth should
decelerate to the 6.0-6.2% range for 2017. There was a
positive surprise in Q3 2016, in which real GDP rose by
6.7% y-o-y; this was above many economists' forecasts.
Certain economic analysts believe that Chinese
economic growth is modestly lower than the official
figures suggest. Nevertheless, it is important to
understand that GDP growth in the region of 6-7%
means that China is adding more or less the equivalent
of Switzerland to the global economy each year.
Moreover, this robust growth is increasingly being driven
by services and light industry, which now account for
57% of total GDP.
Overall fixed asset investment has been rising in China
recently, growing by 9.0% y-o-y in September 2016 after
a pick-up to 8.2% in August according to figures from the
State Council Information Office. This improvement
partly reflects stronger property investment amid surging
housing sales. However, fixed asset investment in
manufacturing also increased in September, in part
because industrial profits are rising again. Profits in
manufacturing rose by 16% y-o-y in Q3 2016, i.e. at the
fastest growth rate in two years. This growth in profits
reflected not only increasing sales, but also margin
expansion driven by rising output prices. This recovery
was vividly reflected in the first y-o-y increase in the
producer price index (PPI) in 54 months in September
2016. October showed a further 1.2% y-o-y increase in
the PPI. The pick-up in producer prices is good news for
heavy industry in particular.
Other news for industry has not been so good. Exports
from China actually weakened in September 2016. This
was because mainly global demand remained patchy,
outweighing the boost to export performance from a
weaker currency; the Chinese renminbi continues to
hover at around a six-year low versus the US dollar.
Industrial production growth therefore softened
somewhat in September.
Then again, household consumption remained robust in
Q3 2016, rising by 6.6% y-o-y in real terms; sales of
passenger cars were especially firm. The increase in
consumption reflects both strong real wage growth (up
by 6.7% y-on-y over the first three quarters of 2016) and
high government spending in the economy. Rising
consumption is, of course, one of the key explanations
for the continuing growth in the services sector, which
has outpaced growth in industry since 2012.
In the light of the recent positive developments, Oxford
Economics recently nudged up GDP growth forecast for
China to 6.7% for 2016. However, the firm believes that
the positive carry-over effect of this higher number into
next year may now be offset by the impact of the more
challenging global growth environment following the US
election, and so has kept its growth forecast for 2017
unchanged at 6.3%. Moreover, Oxford Economics
foresees a significant slowdown over the next ten years
towards real GDP growth of 5.5% as China gradually
weans itself off a model of credit-fuelled expansion.
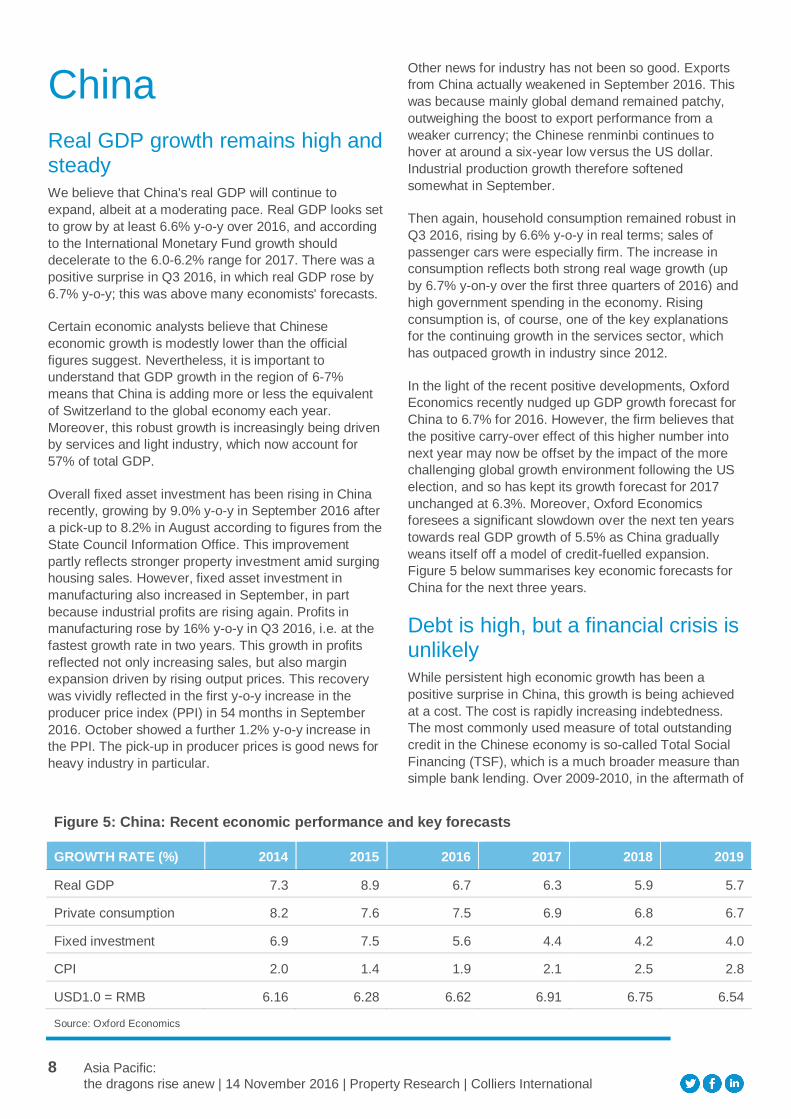
Figure 5 below summarises key economic forecasts for
China for the next three years.
Debt is high, but a financial crisis is unlikely While persistent high economic growth has been a
positive surprise in China, this growth is being achieved
at a cost. The cost is rapidly increasing indebtedness.
The most commonly used measure of total outstanding
credit in the Chinese economy is so-called Total Social
Financing (TSF), which is a much broader measure than
simple bank lending. Over 2009-2010, in the aftermath of
Figure 5: China: Recent economic performance and key forecasts
GROWTH RATE (%) 2014 2015 2016 2017 2018 2019
Real GDP 7.3 8.9 6.7 6.3 5.9 5.7
Private consumption 8.2 7.6 7.5 6.9 6.8 6.7
Fixed investment 6.9 7.5 5.6 4.4 4.2 4.0
CPI 2.0 1.4 1.9 2.1 2.5 2.8
USD1.0 = RMB 6.16 6.28 6.62 6.91 6.75 6.54
Source: Oxford Economics

9 Asia Pacific:
the dragons rise anew | 14 November 2016 | Property Research | Colliers International
the Global Financial Crisis (GFC), the authorities allowed
TSF to expand at y-o-y rates of up to 35% in order to
stimulate the Chinese economy. Growth in TSF
decelerated over 2011 before accelerating again in the
wake of global economic stagnation in 2012 and then
slowing again in 2014-2015. However, since the start of
2016 TSF has again been expanding quite rapidly:
according to official government statistics, TSF grew by
12.5% y-o-y in September¹. Certain economic
forecasting groups make adjustments to the data and so
estimate slightly different figures. Oxford Economics
calculates figures for TSF excluding equity, adjusted for
local government loans. On this definition, y-o-y growth
in September was about 16%.
¹ Please see http://www.gov.cn/xinwen/2016-
10/18/content_5120978.htm.
Figure 6: China - bank lending and total social
financing: y-o-y change (to September 2016)
Source: Oxford Economics, CEIC
The People's Bank of China published data for TSF for
October 2016 on 11 November, just before this report
was published. On the Bank's definition, these figures
show that the y-o-y change in TSF for that month was
steady at 12.7%.
As a consequence of the continuing expansion in credit
in the economy, China's total indebtedness has reached
levels which certain observers consider excessive. One
of the commonly used yardsticks of a country's ability to
support outstanding credit in its economy is the
debt/GDP ratio. This ratio is estimated in various
different ways, with the result that there is a range of
figures for China. According to Oxford Economics, the
debt/GDP ratio in China was 250% at the end of 2016.
By the standards of emerging markets, China's debt/
GDP ratio is high. For comparison, most observers quote
a debt/GDP ratio of 66-67% for the other large, high-
growth Asian economy, namely India. In contrast, many
developed countries have higher total debt/GDP ratios.
Although again calculations vary, Japan is usually
considered to top the list with a ratio approaching 400%,
with various smaller European countries such as
Portugal and Greece not far behind.
Despite high and rising indebtedness, we believe that a
financial crisis is unlikely in China, at least for the next
few years. There are various reasons for our view.
> China runs a large current account surplus
China runs a large current account surplus, meaning that
it is not reliant on foreign capital to finance its growth.
> China has a high savings rate
In 2015, China’s economy-wide (“gross national”)
savings ratio was 48.7% of GDP in 2015, compared to
an investment ratio (“gross capital formation”) of 45.7%.
Countries with high savings rates can support rising
levels of debt.
> China's banking system looks reasonably healthy
overall
While individual banks may have problems, in our view
the Chinese banking sector as a whole is reasonably
sound. According to Oxford Economics, the loan/deposit
ratio for the Chinese banking sector at the end of Q3
2016 was 72%, compared to the level of 80-90%
traditionally considered to be prudent by UK and US
banks. Moreover, deposit intake remains strong,
meaning that the loan/deposit ratio should not
deteriorate greatly if lending continues to rise. Since
y-on-y credit growth of 16% (to use Oxford Economics'
adjusted TSF figure) is double nominal GDP growth of
7.8% for Q3 2016, non-performing loans (NPLs) must
surely be rising, and there is widespread scepticism
about the NPL ratios of around 1.5% typically reported
by Chinese banks. However, many economists believe
that the NPL problem in the Chinese banking sector is
less severe than that in India, where many banks have
been extending very low-quality loans in recent years.
Our view that a financial crisis is unlikely in China in the
near term does not mean that the country can be
complacent. As already suggested, in coming years
China needs to reduce its dependence on a credit-
fuelled growth characterised by high levels of
investment. Making the long-awaited shift away from
an investment-led economic model will push down
China's growth rates, but is necessary to prevent severe
5
10
15
20
25
30
35
40
2006 2008 2010 2012 2014 2016
Bank lending
TSF ex equity, adjusted forlocal government loans
% yoy
Bank lending and total social
Source: Oxford Economics, CEIC Data
10 Asia Pacific:
the dragons rise anew | 14 November 2016 | Property Research | Colliers International
long-run imbalances and perhaps outright crisis in the
financial system.
Fortunately, there is scope for optimism that China can
make the shift, for a number of reasons. Firstly, the
government is now aiming to increase the domestic
consumption rate: recent policies include boosting rural
incomes and higher spending on health, including
projects to provide basic medical insurance for at least
90% of the population. Secondly, reform to the "hukou"
(housing registration) system is being pushed forward in
order to allow migrant workers to access social services
in the cities where they work. Thirdly, reforms in the
financial sector are spurring more efficient use of capital,
and providing a greater range of savings instruments for
to both households and companies.
Prospects for commercial property favourable
The improving economic picture provides a favourable
background for continued expansion in commercial
property markets in China. Below we summarise recent
developments in the office property segment in China's
two most important property investment markets,
Shanghai and Beijing. For Shanghai, we predict average
annual growth in Grade A office rents of 1.6% for the
period 2016-2019, despite a significant increase in new
supply and consequent upward move in the vacancy
rate. For Beijing, we expect Grade A rents to decline by
a very modest 0.2% per year over the period 2016-2019.
Shanghai (Q3 2016)
Demand
Shanghai’s economics remained
positive, with tertiary industry growing by
11.6% y-o-y in H1 2016, according to
the city’s statistics bureau. This solid
background continued to drive demand
for Shanghai’s Grade A office space,
with net absorption rebounding to
33,700 sq metres (362,750 sq ft). The
primary contributors to demand were the
finance and professional services
sectors, and retreats by peer-to-peer
lending companies moderated in the
period. Given the background of
continuing strong economic growth and
Shanghai's status as China's
commercial hub and gateway to the
whole Yangtze River Delta region, we
expect Shanghai to remain a very
popular location for multinational
companies.
Rent
Rent increased by 2.5% q-on-q or 6.2%
y-o-y to RMB10.5 per sq metre
(USD0.14 per sq ft) per day in Q3. This
rent includes a VAT tax, which is
deductible in most cases. Consequently,
most tenants actually saw real estate
costs fall in the period. Looking forward,
we predict average annual rent growth
of 1.6% for the period 2016-2019.
Supply
A total of nearly 640,000 sq metres (6.89
million sq ft) of new supply is scheduled
for 2016. More than one-half of this new
supply will be completed in the Pudong
district. We predict a further significant
increase in new supply in 2018 to just
over 900,000 sq metres (9.69 million sq
ft) before new supply falls back in 2018.
Consequently, we predict average
annual new supply of 670,000 sq metres
(7.21 million sq ft) over the period 2016-
2018. This will be almost exactly double
average new supply over the period
2010-2015 of 340,000 sq metres (3.66
million sq ft).
Vacancy rate
The vacancy rate spiked to 9.8% in Q3
as a result of the new supply and
retreats by tenants in the peer-to-peer
lending sector. With new supply likely to
rise further in 2017 but to fall back
thereafter, we predict a vacancy rate of
10.3% for end-2019.
Beijing (Q3 2016)
Demand
Beijing's economy is growing less rapidly
than Shanghai's, but nonetheless
remains high. According to the city's
statistics bureau, real GDP growth in Q3
2016 was unchanged from Q2 at 6.7%
y-on-y. Tertiary industry growth was
7.3% in the period, versus 10.3% in
Shanghai. Multinational companies
reduced space requirements over Q3
due to tighter leasing budgets, while new
business start-ups slowed. In contrast,
demand from domestic companies and
from the IT and media sectors remained
11 Asia Pacific:
the dragons rise anew | 14 November 2016 | Property Research | Colliers International
high. New leases by IT companies alone
included Sina's lease of 9,000 sq m at
Genesis Beijing in the Lufthansa
submarket; Nvidia’s new lease of 1,800
sq m at Fortune Financial Centre in the
CBD submarket; and Symantec’s new
lease of 1,300 sq m at Oriental Plaza in
the East Chang An Avenue submarket.
Rent
Average rent remained stable, falling by
0.1% q-on-q to RMB330.8 per sq metre
per month (USD4.55 per sq ft per
month) due to new supply. We expect
rental growth to be constrained for 2016
due to new supply, and to decline by a
modest 0.2% per year over the period
2016-2019.
Supply
Total grade A office stock in Beijing grew
by 2.2% q-on-q in Q3 2016 to 5.9 million
sq metres (63.5 million sq ft). We know
that 164,000 sq metres (1.77 million sq
ft) of new supply is scheduled for Q4
alone, and that several projects have
been postponed to 2017. Looking
ahead, we predict average annual new
supply of 465,000 sq metres (5.0 million
sq ft) over the period 2016-2019. This
will be slightly more than double the
average annual new supply over the
2010-2015 period of 250,000 sq metres
(2.7 million sq ft).
Vacancy rate
The vacancy rate in Beijing increased by
1.6 percentage points q-on-q to 7.6%.
The large volume of future supply over
the next couple of years will almost
certainly push up the vacancy rate
further. We predict a vacancy rate of at
least 11.0% for end-2019.
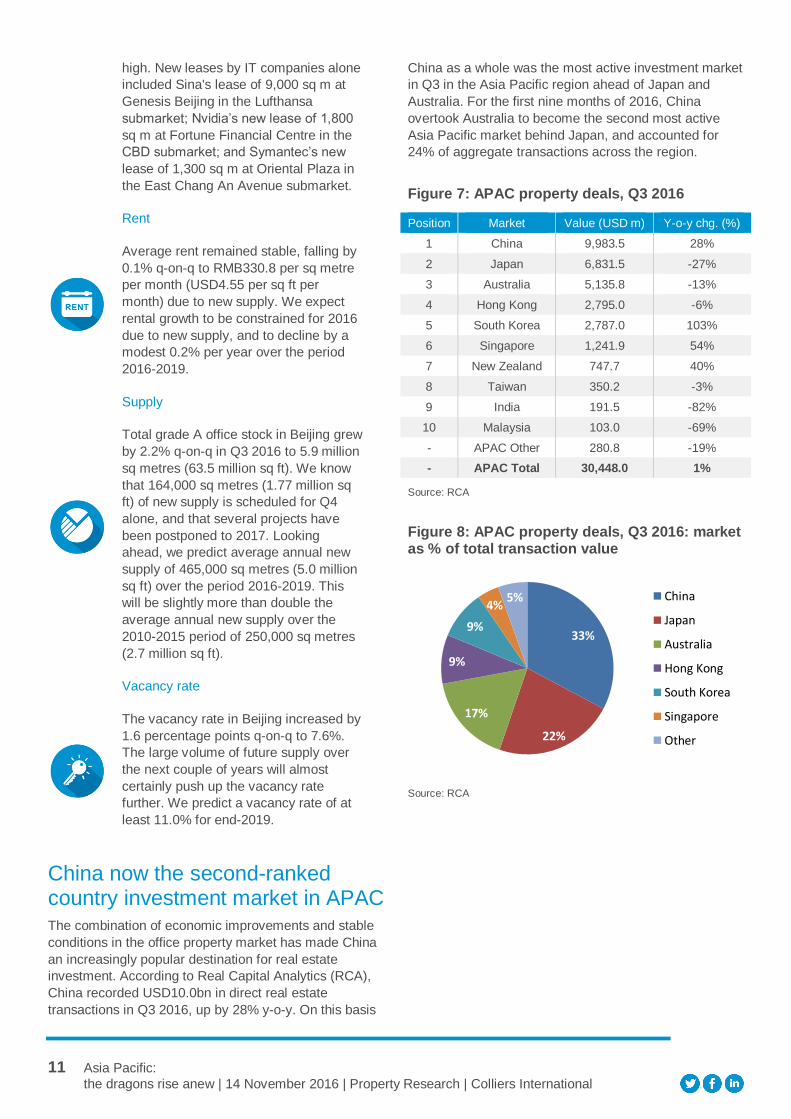
China now the second-ranked country investment market in APAC The combination of economic improvements and stable
conditions in the office property market has made China
an increasingly popular destination for real estate
investment. According to Real Capital Analytics (RCA),
China recorded USD10.0bn in direct real estate
transactions in Q3 2016, up by 28% y-o-y. On this basis
China as a whole was the most active investment market
in Q3 in the Asia Pacific region ahead of Japan and
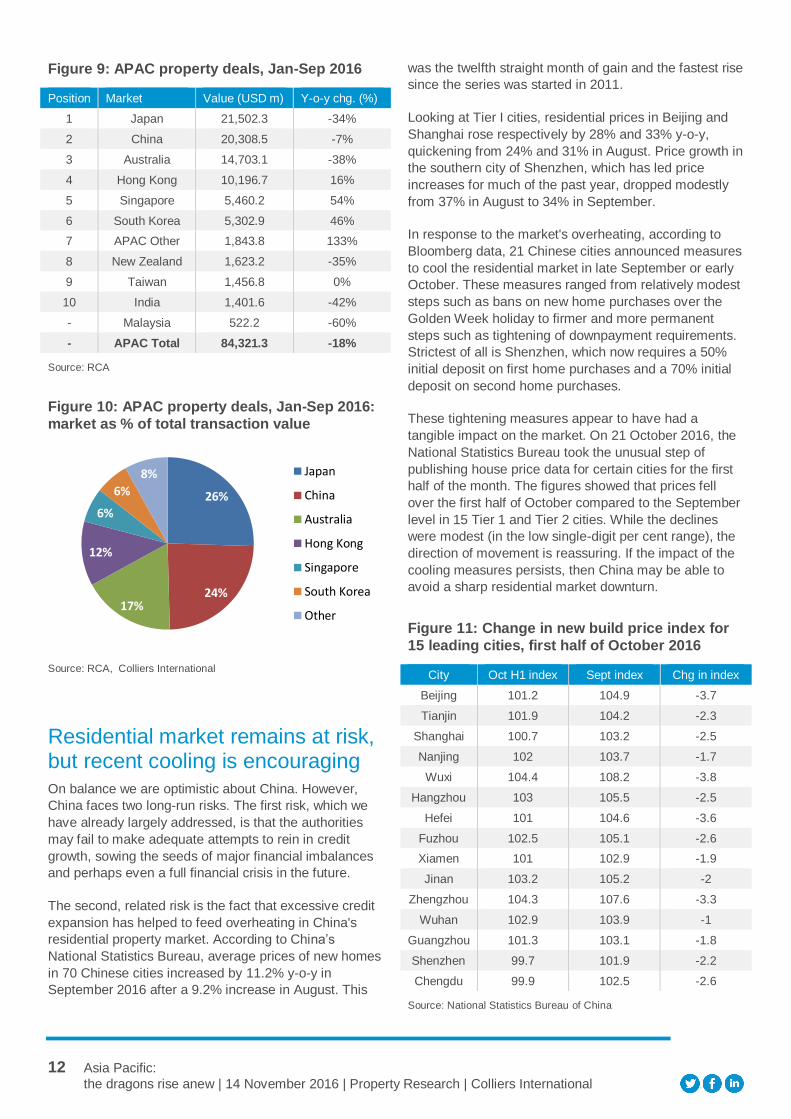
Australia. For the first nine months of 2016, China
overtook Australia to become the second most active
Asia Pacific market behind Japan, and accounted for
24% of aggregate transactions across the region.
Figure 7: APAC property deals, Q3 2016
Position Market Value (USD m) Y-o-y chg. (%)
1 China 9,983.5 28%
2 Japan 6,831.5 -27%
3 Australia 5,135.8 -13%
4 Hong Kong 2,795.0 -6%
5 South Korea 2,787.0 103%
6 Singapore 1,241.9 54%
7 New Zealand 747.7 40%
8 Taiwan 350.2 -3%
9 India 191.5 -82%
10 Malaysia 103.0 -69%
- APAC Other 280.8 -19%
- APAC Total 30,448.0 1%
Source: RCA
Figure 8: APAC property deals, Q3 2016: market as % of total transaction value
Source: RCA
33%
22%
17%
9%
9%
4% 5% China
Japan
Australia
Hong Kong
South Korea
Singapore
Other
12 Asia Pacific:
the dragons rise anew | 14 November 2016 | Property Research | Colliers International
Figure 9: APAC property deals, Jan-Sep 2016
Position Market Value (USD m) Y-o-y chg. (%)
1 Japan 21,502.3 -34%
2 China 20,308.5 -7%
3 Australia 14,703.1 -38%
4 Hong Kong 10,196.7 16%
5 Singapore 5,460.2 54%
6 South Korea 5,302.9 46%
7 APAC Other 1,843.8 133%
8 New Zealand 1,623.2 -35%
9 Taiwan 1,456.8 0%
10 India 1,401.6 -42%
- Malaysia 522.2 -60%
- APAC Total 84,321.3 -18%
Source: RCA
Figure 10: APAC property deals, Jan-Sep 2016:
market as % of total transaction value
Source: RCA, Colliers International
Residential market remains at risk, but recent cooling is encouraging
On balance we are optimistic about China. However,
China faces two long-run risks. The first risk, which we
have already largely addressed, is that the authorities
may fail to make adequate attempts to rein in credit
growth, sowing the seeds of major financial imbalances
and perhaps even a full financial crisis in the future.
The second, related risk is the fact that excessive credit
expansion has helped to feed overheating in China's
residential property market. According to China’s
National Statistics Bureau, average prices of new homes
in 70 Chinese cities increased by 11.2% y-o-y in
September 2016 after a 9.2% increase in August. This
was the twelfth straight month of gain and the fastest rise
since the series was started in 2011.
Looking at Tier I cities, residential prices in Beijing and
Shanghai rose respectively by 28% and 33% y-o-y,
quickening from 24% and 31% in August. Price growth in
the southern city of Shenzhen, which has led price
increases for much of the past year, dropped modestly
from 37% in August to 34% in September.
In response to the market's overheating, according to
Bloomberg data, 21 Chinese cities announced measures
to cool the residential market in late September or early
October. These measures ranged from relatively modest
steps such as bans on new home purchases over the
Golden Week holiday to firmer and more permanent
steps such as tightening of downpayment requirements.
Strictest of all is Shenzhen, which now requires a 50%
initial deposit on first home purchases and a 70% initial
deposit on second home purchases.
These tightening measures appear to have had a
tangible impact on the market. On 21 October 2016, the
National Statistics Bureau took the unusual step of
publishing house price data for certain cities for the first
half of the month. The figures showed that prices fell
over the first half of October compared to the September
level in 15 Tier 1 and Tier 2 cities. While the declines
were modest (in the low single-digit per cent range), the
direction of movement is reassuring. If the impact of the
cooling measures persists, then China may be able to
avoid a sharp residential market downturn.
Figure 11: Change in new build price index for
15 leading cities, first half of October 2016
City Oct H1 index Sept index Chg in index
Beijing 101.2 104.9 -3.7
Tianjin 101.9 104.2 -2.3
Shanghai 100.7 103.2 -2.5
Nanjing 102 103.7 -1.7
Wuxi 104.4 108.2 -3.8
Hangzhou 103 105.5 -2.5
Hefei 101 104.6 -3.6
Fuzhou 102.5 105.1 -2.6
Xiamen 101 102.9 -1.9
Jinan 103.2 105.2 -2
Zhengzhou 104.3 107.6 -3.3
Wuhan 102.9 103.9 -1
Guangzhou 101.3 103.1 -1.8
Shenzhen 99.7 101.9 -2.2
Chengdu 99.9 102.5 -2.6
Source: National Statistics Bureau of China
26%
24% 17%
12%
6%
6%
8% Japan
China
Australia
Hong Kong
Singapore
South Korea
Other

13 Asia Pacific:
the dragons rise anew | 14 November 2016 | Property Research | Colliers International
Another reason why it would be wrong to suggest that a
residential property crash in China is either certain or
imminent is that the recent strong recovery in the
housing market has been unevenly spread. Indeed,
many Tier 3 or Tier 4 cities are still struggling to digest
large inventories of unsold housing. Housing unit sales
are now recovering in smaller as well as large cities, and
this recovery is helping to reduce housing stock, even if
it remains high by historical levels. While developments
in Tier 1 cities receive the greatest attention, the
situation in smaller cities is more representative of the
residential property sector overall and, therefore, more
important for national policy-making.
Nevertheless, the Chinese authorities need to continue
to pay close attention to residential prices in Tier 1 and
Tier 2 cities. It is interesting to note that the national
government appears to have market cooling measures
largely to the discretion of individual city authorities. This
approach is understandable, because individual Chinese
cities vary widely by population and wealth levels.
However, it may be that a more nationally coordinated
approach to cooling the residential market is required to
preclude (or, at least, greatly reduce) the risk of a
housing price crash.
14 Asia Pacific:
the dragons rise anew | 14 November 2016 | Property Research | Colliers International
Hong Kong
Prospects turning brighter
Hong Kong’s economy is steadily improving. Whereas
real GDP growth for Q1 2016 was 0.8% y-o-y, GDP
growth for Q2 reached 1.7%. Other recent data have
also generally been positive. Notably, goods exports
grew for the first time in 16 months in August, rising by
0.8% y-o-y; this growth accelerated to 3.6% y-o-y in
September. The recovery in exports has been driven by
increasing shipments to mainland China, Hong Kong's
biggest export destination; exports to China grew by
5.1% y-o-y in September. Moreover, goods imports have
been outpacing exports, with growth of 2.8% y-o-y in
August followed by 4.1% in September. The strength of
imports points to a recovery in domestic demand.
The Hong Kong government released GDP data for Q3
on 11 November, just before publication of this report: y-
o-y growth in the period increased further to 1.9%. This
further improvement in growth was driven by continued
strength in domestic demand, with consumer spending,
investment and imports all picking up. Exports also
increased, although imports grew faster. Oxford
Economics has commented that the reassuring Q3 data
may lead the firm to revise up its current 2016 forecast of
real GDP growth of 1.4%.
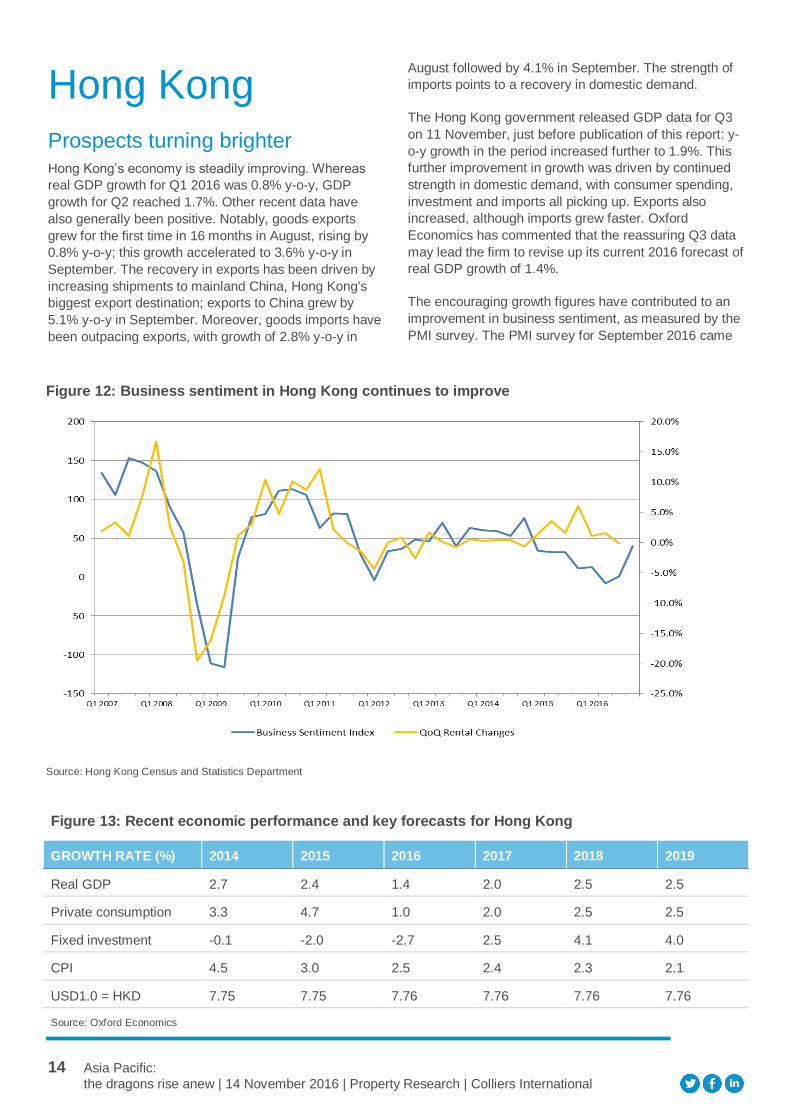
The encouraging growth figures have contributed to an
improvement in business sentiment, as measured by the
PMI survey. The PMI survey for September 2016 came
Figure 13: Recent economic performance and key forecasts for Hong Kong
GROWTH RATE (%) 2014 2015 2016 2017 2018 2019
Real GDP 2.7 2.4 1.4 2.0 2.5 2.5
Private consumption 3.3 4.7 1.0 2.0 2.5 2.5
Fixed investment -0.1 -2.0 -2.7 2.5 4.1 4.0
CPI 4.5 3.0 2.5 2.4 2.3 2.1
USD1.0 = HKD 7.75 7.75 7.76 7.76 7.76 7.76
Source: Oxford Economics
Figure 12: Business sentiment in Hong Kong continues to improve
Source: Hong Kong Census and Statistics Department
15 Asia Pacific:
the dragons rise anew | 14 November 2016 | Property Research | Colliers International
in at 49.3, the highest level since March 2015 and
edging closer to the 50 mark that indicates expansion
rather than contraction.
In addition to the PMI survey, we find the Quarterly
Business Tendency Survey Report produced by the
Hong Kong government's Census and Statistics
Department to be very useful. This survey collects the
views of business owners and senior managers about
their prospects for coming quarters, and so becomes a
de facto business sentiment index. The Business
Tendency Survey for Q4 2016 showed that the
proportion of respondents expecting business conditions
to deteriorate on a q-on-q basis had decreased to 10%,
from 17% in Q3 2016.
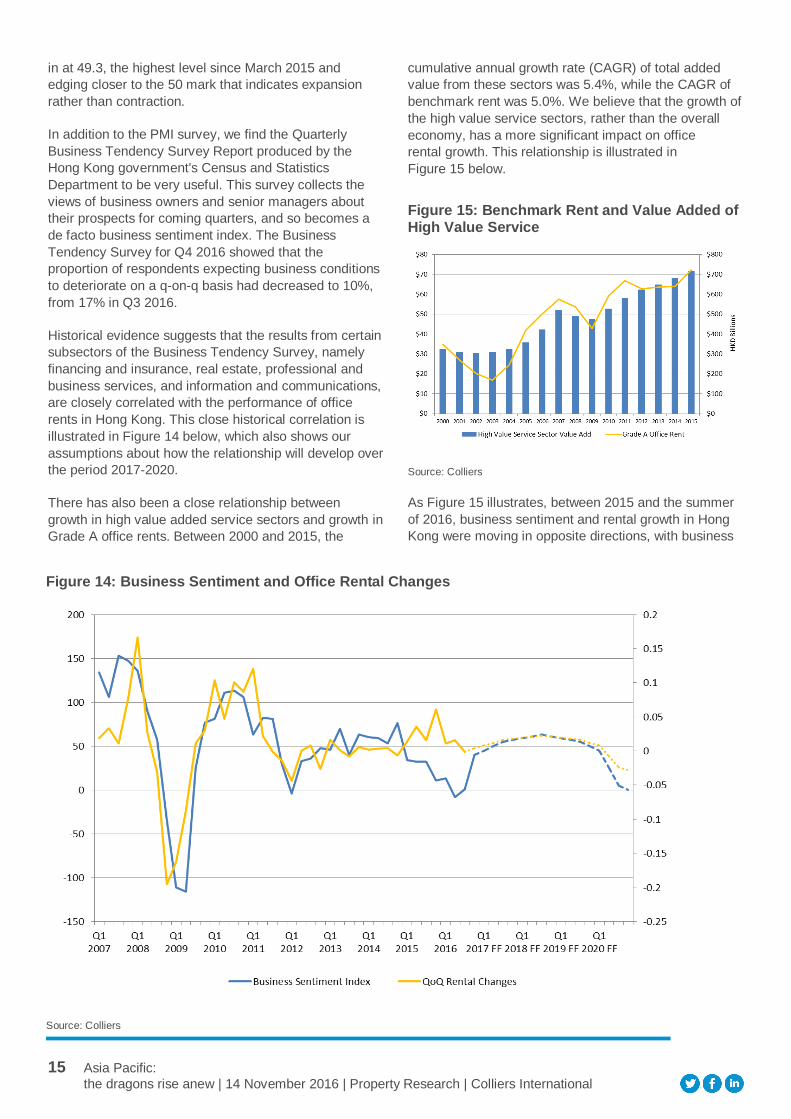
Historical evidence suggests that the results from certain
subsectors of the Business Tendency Survey, namely
financing and insurance, real estate, professional and
business services, and information and communications,
are closely correlated with the performance of office
rents in Hong Kong. This close historical correlation is
illustrated in Figure 14 below, which also shows our
assumptions about how the relationship will develop over
the period 2017-2020.
There has also been a close relationship between
growth in high value added service sectors and growth in
Grade A office rents. Between 2000 and 2015, the
cumulative annual growth rate (CAGR) of total added
value from these sectors was 5.4%, while the CAGR of
benchmark rent was 5.0%. We believe that the growth of
the high value service sectors, rather than the overall
economy, has a more significant impact on office
rental growth. This relationship is illustrated in
Figure 15 below.
Figure 15: Benchmark Rent and Value Added of High Value Service
Source: Colliers
As Figure 15 illustrates, between 2015 and the summer
of 2016, business sentiment and rental growth in Hong
Kong were moving in opposite directions, with business
Figure 14: Business Sentiment and Office Rental Changes
Source: Colliers
16 Asia Pacific:
the dragons rise anew | 14 November 2016 | Property Research | Colliers International
sentiment deteriorating but benchmark rent rising. In
other words, a decoupling took place. We believe that
this decoupling chiefly reflected an extremely low
vacancy rate and strong demand from the Chinese
companies in the core CBD area. We believe the
decoupling will not develop into a long-term
phenomenon and assume that the vacancy rate will
eventually move back towards the historical average.
Island office rents and investment market strong, Kowloon weaker
Past records have revealed that business sentiment
tends to move in three to four year cycles and it is very
rare for the survey result to stay in negative territory for a
long period. As noted, business sentiment in Hong Kong
was moving downwards until Q2 2016, which looks as
though it was probably the bottom of the most recent
cycle. Looking forward, we expect the present rebound
in business sentiment to continue over the rest of this
year and into 2017, driven by stabilisation in the Chinese
economy and modest US economic expansion. This in
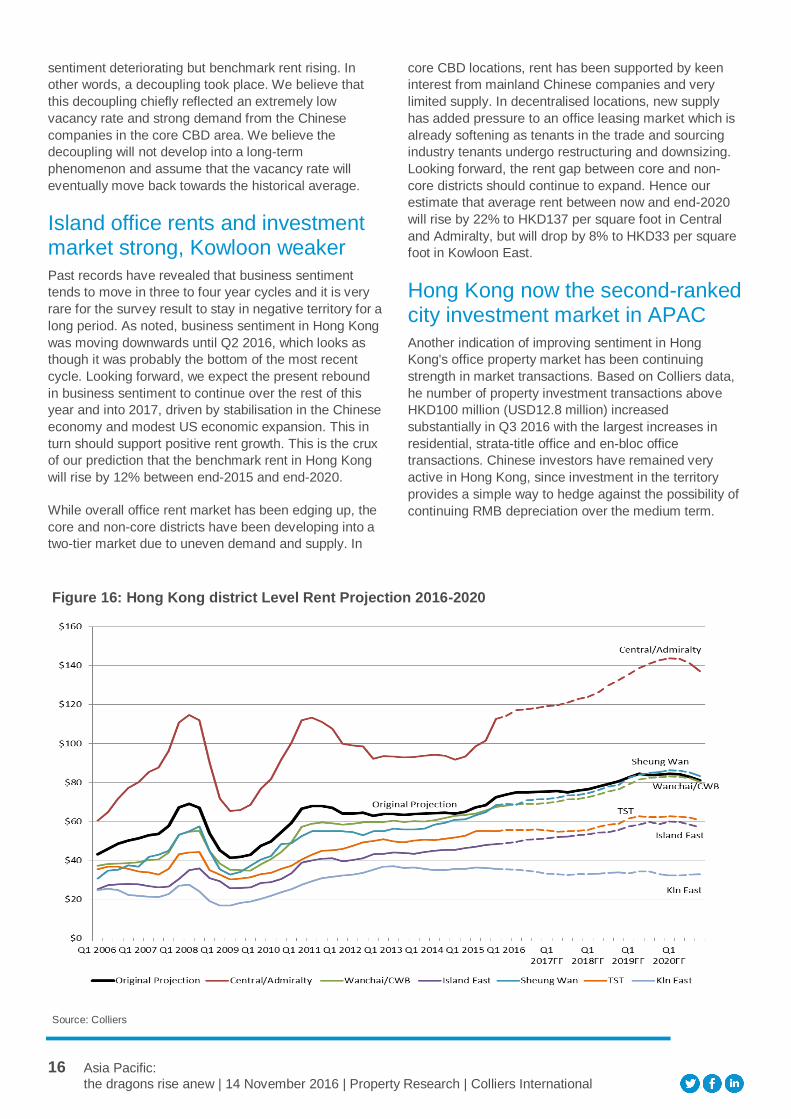
turn should support positive rent growth. This is the crux
of our prediction that the benchmark rent in Hong Kong
will rise by 12% between end-2015 and end-2020.
While overall office rent market has been edging up, the
core and non-core districts have been developing into a
two-tier market due to uneven demand and supply. In
core CBD locations, rent has been supported by keen
interest from mainland Chinese companies and very
limited supply. In decentralised locations, new supply
has added pressure to an office leasing market which is
already softening as tenants in the trade and sourcing
industry tenants undergo restructuring and downsizing.
Looking forward, the rent gap between core and non-
core districts should continue to expand. Hence our
estimate that average rent between now and end-2020
will rise by 22% to HKD137 per square foot in Central
and Admiralty, but will drop by 8% to HKD33 per square
foot in Kowloon East.
Hong Kong now the second-ranked city investment market in APAC
Another indication of improving sentiment in Hong
Kong's office property market has been continuing
strength in market transactions. Based on Colliers data,
he number of property investment transactions above
HKD100 million (USD12.8 million) increased
substantially in Q3 2016 with the largest increases in
residential, strata-title office and en-bloc office
transactions. Chinese investors have remained very
active in Hong Kong, since investment in the territory
provides a simple way to hedge against the possibility of
continuing RMB depreciation over the medium term.
Figure 16: Hong Kong district Level Rent Projection 2016-2020
Source: Colliers
17 Asia Pacific:
the dragons rise anew | 14 November 2016 | Property Research | Colliers International
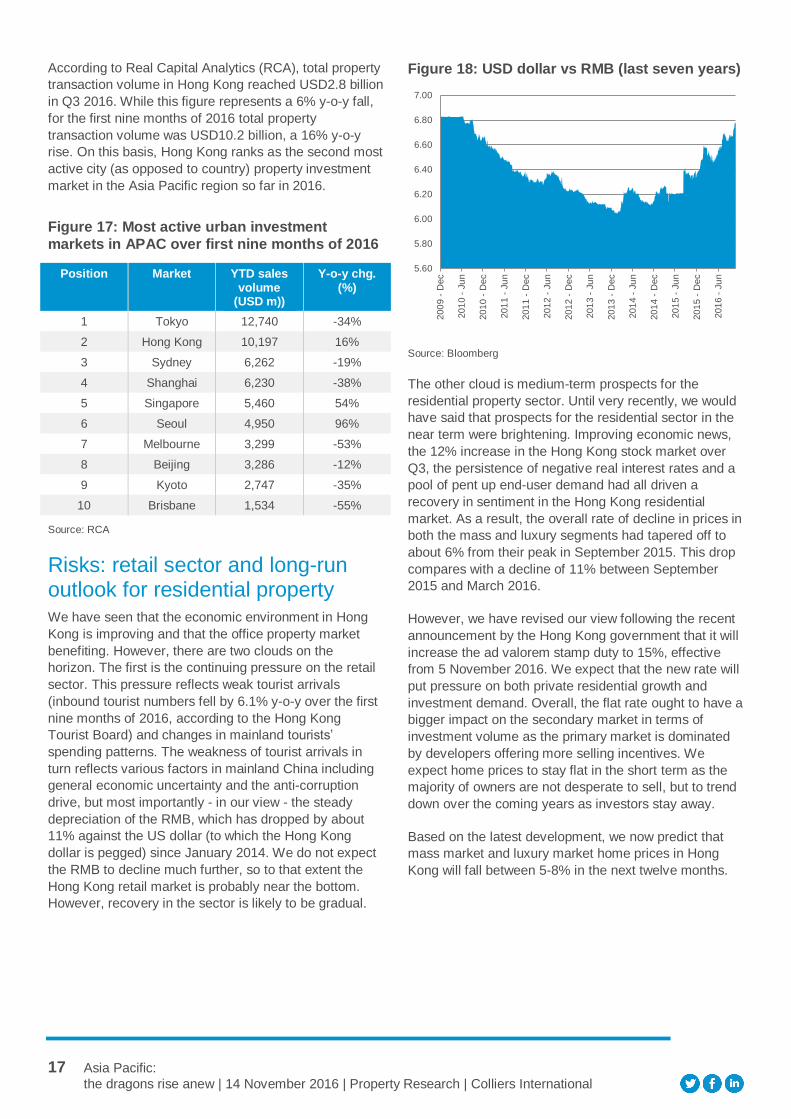
According to Real Capital Analytics (RCA), total property
transaction volume in Hong Kong reached USD2.8 billion
in Q3 2016. While this figure represents a 6% y-o-y fall,
for the first nine months of 2016 total property
transaction volume was USD10.2 billion, a 16% y-o-y
rise. On this basis, Hong Kong ranks as the second most
active city (as opposed to country) property investment
market in the Asia Pacific region so far in 2016.
Figure 17: Most active urban investment
markets in APAC over first nine months of 2016
Position Market YTD sales volume
(USD m))
Y-o-y chg. (%)
1 Tokyo 12,740 -34%
2 Hong Kong 10,197 16%
3 Sydney 6,262 -19%
4 Shanghai 6,230 -38%
5 Singapore 5,460 54%
6 Seoul 4,950 96%
7 Melbourne 3,299 -53%
8 Beijing 3,286 -12%
9 Kyoto 2,747 -35%
10 Brisbane 1,534 -55%
Source: RCA
Risks: retail sector and long-run outlook for residential property We have seen that the economic environment in Hong
Kong is improving and that the office property market
benefiting. However, there are two clouds on the
horizon. The first is the continuing pressure on the retail
sector. This pressure reflects weak tourist arrivals
(inbound tourist numbers fell by 6.1% y-o-y over the first
nine months of 2016, according to the Hong Kong
Tourist Board) and changes in mainland tourists’
spending patterns. The weakness of tourist arrivals in
turn reflects various factors in mainland China including
general economic uncertainty and the anti-corruption
drive, but most importantly - in our view - the steady
depreciation of the RMB, which has dropped by about
11% against the US dollar (to which the Hong Kong
dollar is pegged) since January 2014. We do not expect
the RMB to decline much further, so to that extent the
Hong Kong retail market is probably near the bottom.
However, recovery in the sector is likely to be gradual.
Figure 18: USD dollar vs RMB (last seven years)
Source: Bloomberg
The other cloud is medium-term prospects for the
residential property sector. Until very recently, we would
have said that prospects for the residential sector in the
near term were brightening. Improving economic news,
the 12% increase in the Hong Kong stock market over
Q3, the persistence of negative real interest rates and a
pool of pent up end-user demand had all driven a
recovery in sentiment in the Hong Kong residential
market. As a result, the overall rate of decline in prices in
both the mass and luxury segments had tapered off to
about 6% from their peak in September 2015. This drop
compares with a decline of 11% between September
2015 and March 2016.
However, we have revised our view following the recent
announcement by the Hong Kong government that it will
increase the ad valorem stamp duty to 15%, effective
from 5 November 2016. We expect that the new rate will
put pressure on both private residential growth and
investment demand. Overall, the flat rate ought to have a
bigger impact on the secondary market in terms of
investment volume as the primary market is dominated
by developers offering more selling incentives. We
expect home prices to stay flat in the short term as the
majority of owners are not desperate to sell, but to trend
down over the coming years as investors stay away.
Based on the latest development, we now predict that
mass market and luxury market home prices in Hong
Kong will fall between 5-8% in the next twelve months.
5.60
5.80
6.00
6.20
6.40
6.60
6.80
7.00
200
9 -
Dec
201
0 -
Ju
n
201
0 -
Dec
201
1 -
Ju
n
201
1 -
Dec
201
2 -
Ju
n
201
2 -
Dec
201
3 -
Ju
n
201
3 -
Dec
201
4 -
Ju
n
201
4 -
Dec
201
5 -
Ju
n
201
5 -
Dec
201
6 -
Ju
n
18 Asia Pacific:
the dragons rise anew | 14 November 2016 | Property Research | Colliers International
Figure 19: Hong Kong - mass vs luxury residential price trend
Source: Colliers, Rating and Valuation Department
The chance of a substantial downward correction in
Hong Kong residential property prices over the medium
term remains significant. Apart from very stretched
affordability, the potential for interest rate increases
following the lead of the US - most probably from
December onwards - and an ample pipeline of new
apartment supply represent important threats to the
recovery in market sentiment that had become apparent
before the changes in stamp duty.
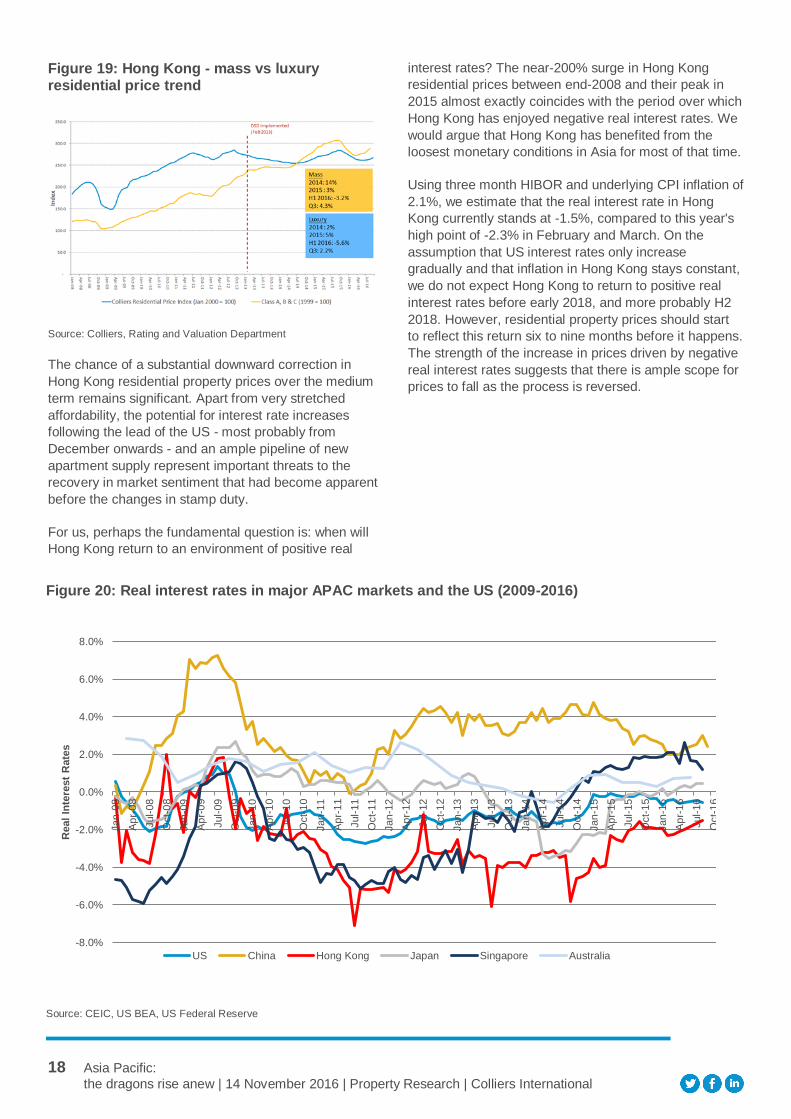
For us, perhaps the fundamental question is: when will
Hong Kong return to an environment of positive real
interest rates? The near-200% surge in Hong Kong
residential prices between end-2008 and their peak in
2015 almost exactly coincides with the period over which
Hong Kong has enjoyed negative real interest rates. We
would argue that Hong Kong has benefited from the
loosest monetary conditions in Asia for most of that time.
Using three month HIBOR and underlying CPI inflation of
2.1%, we estimate that the real interest rate in Hong
Kong currently stands at -1.5%, compared to this year's
high point of -2.3% in February and March. On the
assumption that US interest rates only increase
gradually and that inflation in Hong Kong stays constant,
we do not expect Hong Kong to return to positive real
interest rates before early 2018, and more probably H2
2018. However, residential property prices should start
to reflect this return six to nine months before it happens.
The strength of the increase in prices driven by negative
real interest rates suggests that there is ample scope for
prices to fall as the process is reversed.
Figure 20: Real interest rates in major APAC markets and the US (2009-2016)
Source: CEIC, US BEA, US Federal Reserve
-8.0%
-6.0%
-4.0%
-2.0%
0.0%
2.0%
4.0%
6.0%
8.0%
Jan
-08
Ap
r-0
8
Jul-
08
Oct-
08
Jan
-09
Ap
r-0
9
Jul-
09
Oct-
09
Jan
-10
Ap
r-1
0
Jul-
10
Oct-
10
Jan
-11
Ap
r-1
1
Jul-
11
Oct-
11
Jan
-12
Ap
r-1
2
Jul-
12
Oct-
12
Jan
-13
Ap
r-1
3
Jul-
13
Oct-
13
Jan
-14
Ap
r-1
4
Jul-
14
Oct-
14
Jan
-15
Ap
r-1
5
Jul-
15
Oct-
15
Jan
-16
Ap
r-1
6
Jul-
16
Oct-
16
Real
Inte
rest
Rate
s
US China Hong Kong Japan Singapore Australia
19 Asia Pacific:
the dragons rise anew | 14 November 2016 | Property Research | Colliers International
Singapore
Economic growth has been slowing
Singapore’s recent economic performance has been
disappointing. According to Oxford Economics, real GDP
in Singapore has increased at a compound average rate
of 6.7% since 1980; and the most recent boom year was
2010, during which, with growth of 15.2%, Singapore
was the world's second fastest-growing country after
Qatar. However, since then Singapore has slowed down
steadily. Real GDP growth fell from 3.3% y-o-y in 2014
to 2.0% in 2015, and looks set to fall further in 2016.
The slowdown seems to have intensified in recent
months. Based on the advance estimate for Q3 2016,
real GDP grew by only 0.6% y-on-y and contracted by
4.1% q-o-q on seasonally adjusted annualised basis.
Manufacturing activity shrank by 17.4% versus Q2 as an
earlier boost from the biomedical sector dissipated and
as Singapore's important transport engineering sector
shrank further. In addition, the services sector - which
accounts for two-thirds of the economy - declined for the
third quarter in a row.
Advance estimates of GDP are well-known to be
unreliable, and it is quite possible that the final number
for Q3 will be rather different from the weak initial
estimate. Nevertheless, the scale of the decline in the
manufacturing sector suggests that weakness will
continue into Q4. Real GDP growth for 2016 now looks
likely to be little higher than about 1.4%. Moreover, if the
economy shrinks in Q4 from the Q3 level, then a
technical recession (defined as two consecutive quarters
of negative growth) is possible.
At this stage it seems reasonable to expect the
Singapore economy to stay subdued into early 2017.
Looking further ahead, GDP growth should recover
gradually as global trade gradually accelerates, given the
Singapore economy's well-known gearing to international
trade flows. However, the pace of the pick-up trade
depends in part on the outcome of the US presidential
election (see later in this report).
A particular long-run challenge for Singapore is the
country's slowing population growth. Despite government
policies intended to boost Singapore's low birth rate,
after annual average growth of 2.7% over the past ten
years Oxford Economics predicts average annual growth
of just 1.3% over the next two decades. Restrictions on
foreign workers may eventually need to be eased if
labour supply growth is to recover.
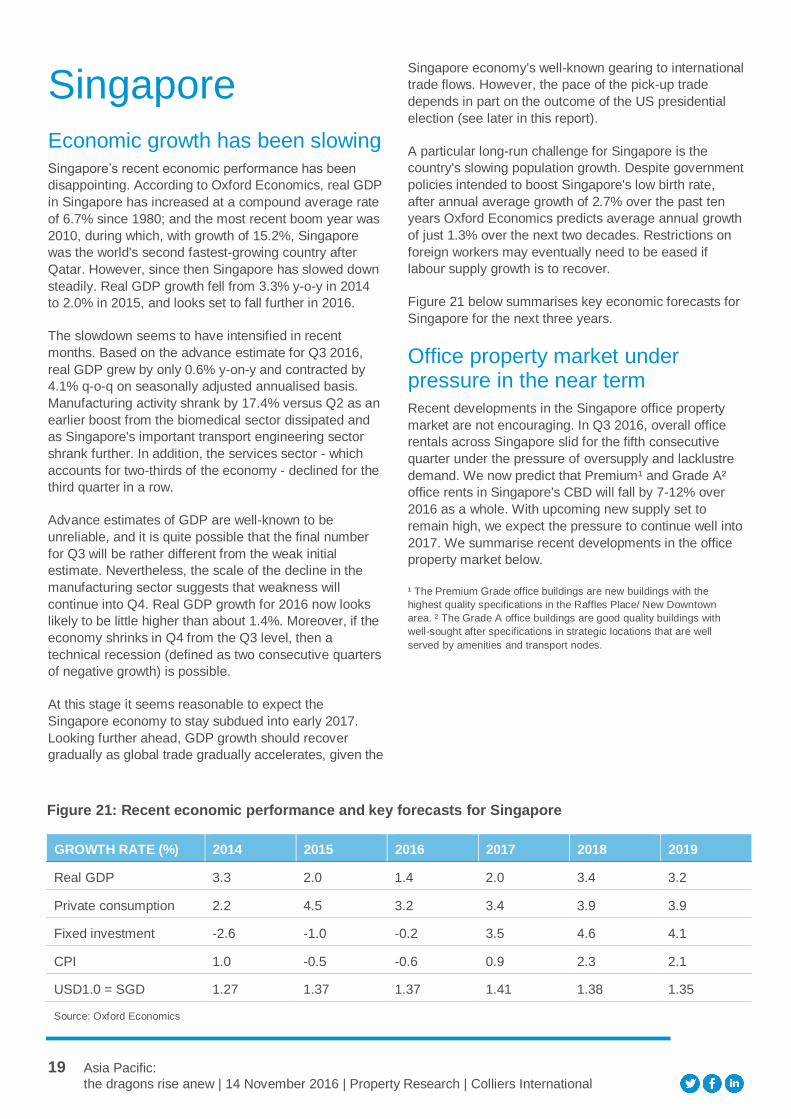
Figure 21 below summarises key economic forecasts for
Singapore for the next three years.
Office property market under pressure in the near term
Recent developments in the Singapore office property
market are not encouraging. In Q3 2016, overall office
rentals across Singapore slid for the fifth consecutive
quarter under the pressure of oversupply and lacklustre
demand. We now predict that Premium¹ and Grade A²
office rents in Singapore's CBD will fall by 7-12% over
2016 as a whole. With upcoming new supply set to
remain high, we expect the pressure to continue well into
2017. We summarise recent developments in the office
property market below.
¹ The Premium Grade office buildings are new buildings with the
highest quality specifications in the Raffles Place/ New Downtown
area. ² The Grade A office buildings are good quality buildings with
well-sought after specifications in strategic locations that are well
served by amenities and transport nodes.
Figure 21: Recent economic performance and key forecasts for Singapore
GROWTH RATE (%) 2014 2015 2016 2017 2018 2019
Real GDP 3.3 2.0 1.4 2.0 3.4 3.2
Private consumption 2.2 4.5 3.2 3.4 3.9 3.9
Fixed investment -2.6 -1.0 -0.2 3.5 4.6 4.1
CPI 1.0 -0.5 -0.6 0.9 2.3 2.1
USD1.0 = SGD 1.27 1.37 1.37 1.41 1.38 1.35
Source: Oxford Economics
20 Asia Pacific:
the dragons rise anew | 14 November 2016 | Property Research | Colliers International
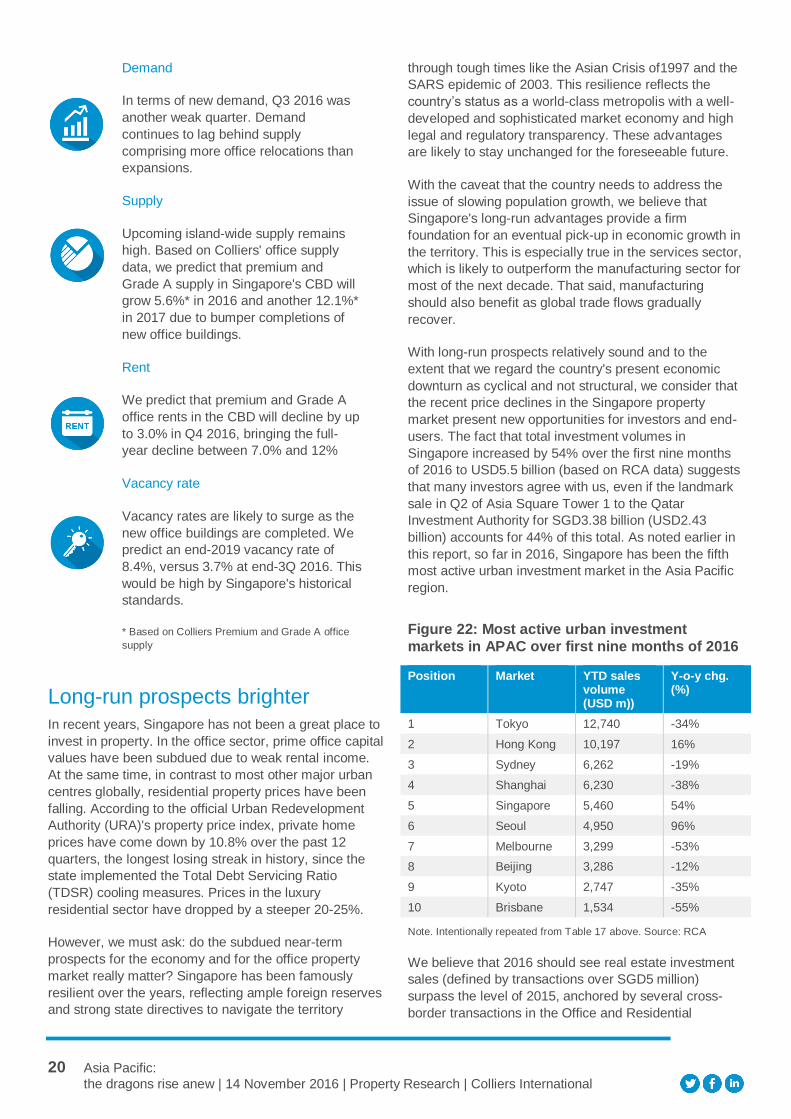
Demand
In terms of new demand, Q3 2016 was
another weak quarter. Demand
continues to lag behind supply
comprising more office relocations than
expansions.
Supply
Upcoming island-wide supply remains
high. Based on Colliers' office supply
data, we predict that premium and
Grade A supply in Singapore's CBD will
grow 5.6%* in 2016 and another 12.1%*
in 2017 due to bumper completions of
new office buildings.
Rent
We predict that premium and Grade A
office rents in the CBD will decline by up
to 3.0% in Q4 2016, bringing the full-
year decline between 7.0% and 12%
Vacancy rate
Vacancy rates are likely to surge as the
new office buildings are completed. We
predict an end-2019 vacancy rate of
8.4%, versus 3.7% at end-3Q 2016. This
would be high by Singapore's historical
standards.
* Based on Colliers Premium and Grade A office
supply
Long-run prospects brighter
In recent years, Singapore has not been a great place to
invest in property. In the office sector, prime office capital
values have been subdued due to weak rental income.
At the same time, in contrast to most other major urban
centres globally, residential property prices have been
falling. According to the official Urban Redevelopment
Authority (URA)'s property price index, private home
prices have come down by 10.8% over the past 12
quarters, the longest losing streak in history, since the
state implemented the Total Debt Servicing Ratio
(TDSR) cooling measures. Prices in the luxury
residential sector have dropped by a steeper 20-25%.
However, we must ask: do the subdued near-term
prospects for the economy and for the office property
market really matter? Singapore has been famously
resilient over the years, reflecting ample foreign reserves
and strong state directives to navigate the territory
through tough times like the Asian Crisis of1997 and the
SARS epidemic of 2003. This resilience reflects the
country’s status as a world-class metropolis with a well-
developed and sophisticated market economy and high
legal and regulatory transparency. These advantages
are likely to stay unchanged for the foreseeable future.
With the caveat that the country needs to address the
issue of slowing population growth, we believe that
Singapore's long-run advantages provide a firm
foundation for an eventual pick-up in economic growth in
the territory. This is especially true in the services sector,
which is likely to outperform the manufacturing sector for
most of the next decade. That said, manufacturing
should also benefit as global trade flows gradually
recover.
With long-run prospects relatively sound and to the
extent that we regard the country's present economic
downturn as cyclical and not structural, we consider that
the recent price declines in the Singapore property
market present new opportunities for investors and end-
users. The fact that total investment volumes in
Singapore increased by 54% over the first nine months
of 2016 to USD5.5 billion (based on RCA data) suggests
that many investors agree with us, even if the landmark
sale in Q2 of Asia Square Tower 1 to the Qatar
Investment Authority for SGD3.38 billion (USD2.43
billion) accounts for 44% of this total. As noted earlier in
this report, so far in 2016, Singapore has been the fifth
most active urban investment market in the Asia Pacific
region.
Figure 22: Most active urban investment
markets in APAC over first nine months of 2016
Position Market YTD sales volume (USD m))
Y-o-y chg. (%)
1 Tokyo 12,740 -34%
2 Hong Kong 10,197 16%
3 Sydney 6,262 -19%
4 Shanghai 6,230 -38%
5 Singapore 5,460 54%
6 Seoul 4,950 96%
7 Melbourne 3,299 -53%
8 Beijing 3,286 -12%
9 Kyoto 2,747 -35%
10 Brisbane 1,534 -55%
Note. Intentionally repeated from Table 17 above. Source: RCA
We believe that 2016 should see real estate investment
sales (defined by transactions over SGD5 million)
surpass the level of 2015, anchored by several cross-
border transactions in the Office and Residential
21 Asia Pacific:
the dragons rise anew | 14 November 2016 | Property Research | Colliers International
segments, where sovereign wealth funds, institutional
investors and high net worth individuals continue to
acquire trophy assets on a long-term view.
Looking forward, any easing of the cooling measures
could provide some impetus for participation in the luxury
residential sector. Foreigners may find it attractive to re-
enter the market when the additional buyer's stamp duty
of 15% imposed on foreigners is eventually relaxed or
removed.
Time to look at Singapore again
We believe that Singapore's prime real estate in general
should continue to be sought after by global institutional
investors looking for stable long-term returns in a
diversified portfolio. The near-term outlook for growth in
office rents is clouded by our assumption of a significant
increase in supply: hence our estimate of negative
average annual prime grade office rent growth (-2.1%)
between 2016 and 2019. However, the prime grade
office net operating yield for the Singapore CBD of 3.5%
is reasonably attractive - and more so than the
corresponding figure of 2.5% for prime grade office
property on Hong Kong Island.
The long-run attractions of Singapore explain, in our
view, why the investment market has been so firm in
Singapore recently: investors are looking beyond a
modest near-term decline in office rents to the prospect
of rental growth and capital appreciation further into the
future. As suggested, the office segment is not the only
part of the property market that is attractive for long-run
investment: the residential segment, including luxury
property, is well worth considering too.
22 Asia Pacific:
the dragons rise anew | 14 November 2016 | Property Research | Colliers International
Australia
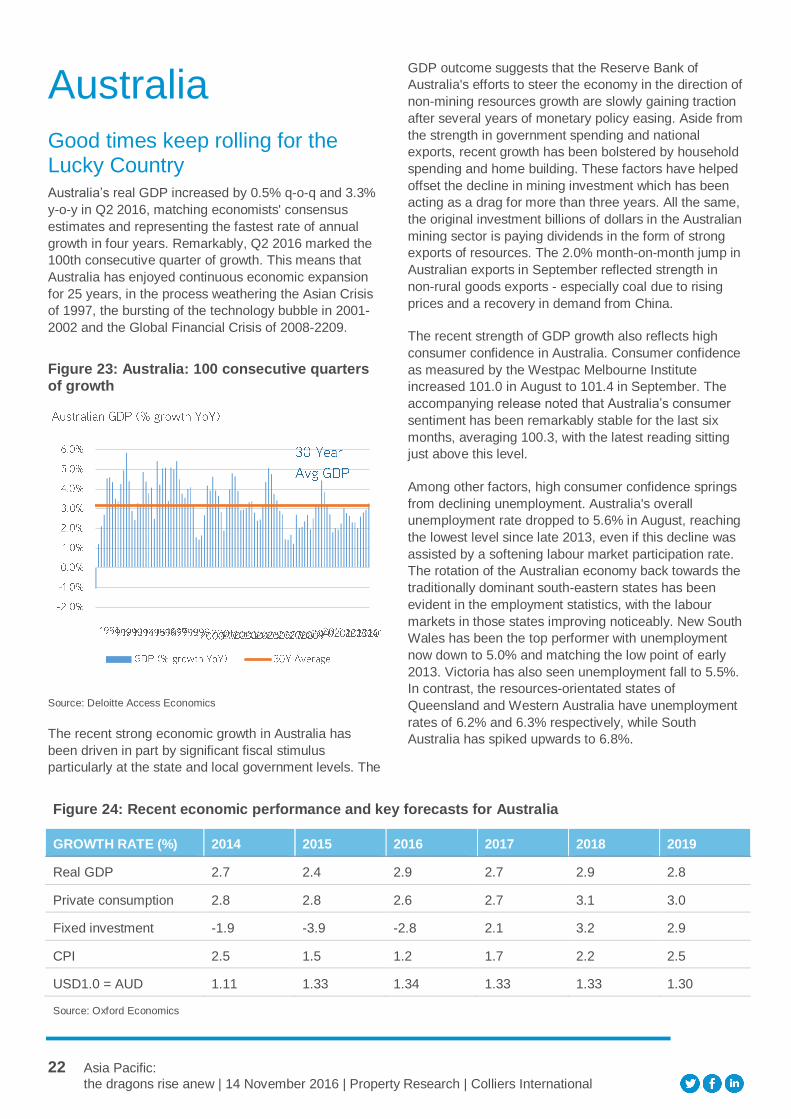
Good times keep rolling for the Lucky Country Australia’s real GDP increased by 0.5% q-o-q and 3.3%
y-o-y in Q2 2016, matching economists' consensus
estimates and representing the fastest rate of annual
growth in four years. Remarkably, Q2 2016 marked the
100th consecutive quarter of growth. This means that
Australia has enjoyed continuous economic expansion
for 25 years, in the process weathering the Asian Crisis
of 1997, the bursting of the technology bubble in 2001-
2002 and the Global Financial Crisis of 2008-2209.
Figure 23: Australia: 100 consecutive quarters of growth
Source: Deloitte Access Economics
The recent strong economic growth in Australia has
been driven in part by significant fiscal stimulus
particularly at the state and local government levels. The
GDP outcome suggests that the Reserve Bank of
Australia's efforts to steer the economy in the direction of
non-mining resources growth are slowly gaining traction
after several years of monetary policy easing. Aside from
the strength in government spending and national
exports, recent growth has been bolstered by household
spending and home building. These factors have helped
offset the decline in mining investment which has been
acting as a drag for more than three years. All the same,
the original investment billions of dollars in the Australian
mining sector is paying dividends in the form of strong
exports of resources. The 2.0% month-on-month jump in
Australian exports in September reflected strength in
non-rural goods exports - especially coal due to rising
prices and a recovery in demand from China.
The recent strength of GDP growth also reflects high
consumer confidence in Australia. Consumer confidence
as measured by the Westpac Melbourne Institute
increased 101.0 in August to 101.4 in September. The
accompanying release noted that Australia’s consumer
sentiment has been remarkably stable for the last six
months, averaging 100.3, with the latest reading sitting
just above this level.
Among other factors, high consumer confidence springs
from declining unemployment. Australia's overall
unemployment rate dropped to 5.6% in August, reaching
the lowest level since late 2013, even if this decline was
assisted by a softening labour market participation rate.
The rotation of the Australian economy back towards the
traditionally dominant south-eastern states has been
evident in the employment statistics, with the labour
markets in those states improving noticeably. New South
Wales has been the top performer with unemployment
now down to 5.0% and matching the low point of early
2013. Victoria has also seen unemployment fall to 5.5%.
In contrast, the resources-orientated states of
Queensland and Western Australia have unemployment
rates of 6.2% and 6.3% respectively, while South
Australia has spiked upwards to 6.8%.
Figure 24: Recent economic performance and key forecasts for Australia
GROWTH RATE (%) 2014 2015 2016 2017 2018 2019
Real GDP 2.7 2.4 2.9 2.7 2.9 2.8
Private consumption 2.8 2.8 2.6 2.7 3.1 3.0
Fixed investment -1.9 -3.9 -2.8 2.1 3.2 2.9
CPI 2.5 1.5 1.2 1.7 2.2 2.5
USD1.0 = AUD 1.11 1.33 1.34 1.33 1.33 1.30
Source: Oxford Economics
23 Asia Pacific:
the dragons rise anew | 14 November 2016 | Property Research | Colliers International
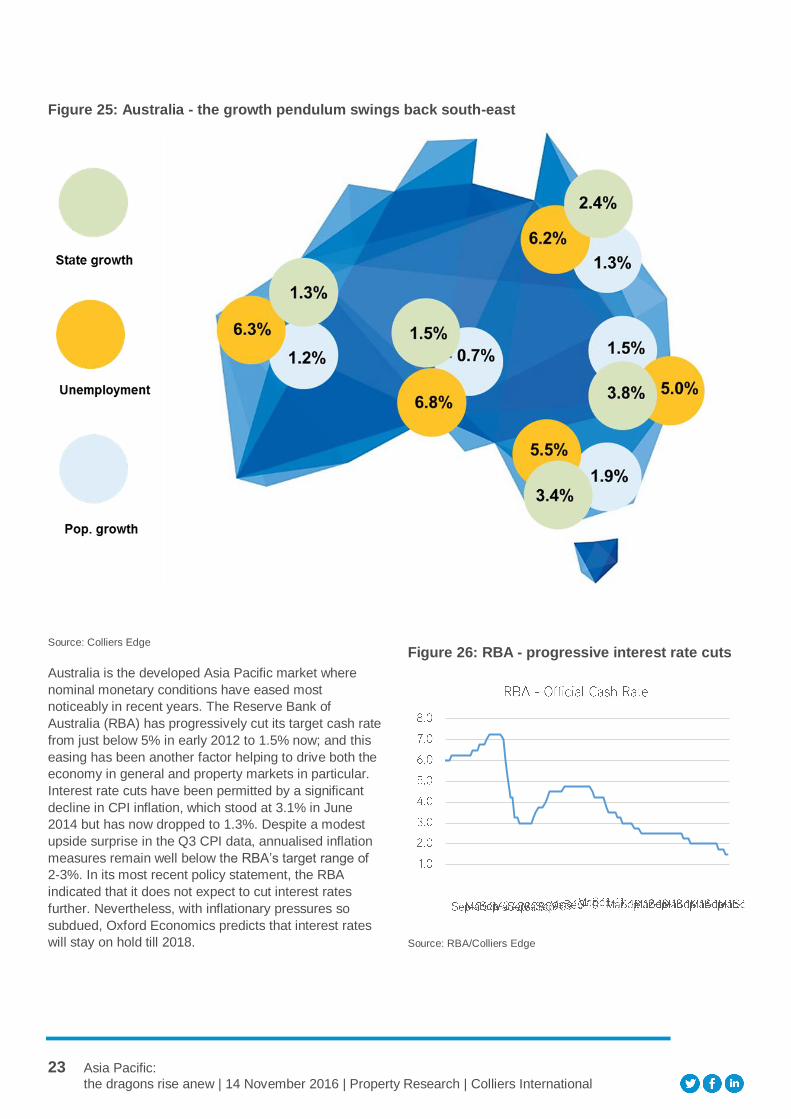
Source: Colliers Edge
Australia is the developed Asia Pacific market where
nominal monetary conditions have eased most
noticeably in recent years. The Reserve Bank of
Australia (RBA) has progressively cut its target cash rate
from just below 5% in early 2012 to 1.5% now; and this
easing has been another factor helping to drive both the
economy in general and property markets in particular.
Interest rate cuts have been permitted by a significant
decline in CPI inflation, which stood at 3.1% in June
2014 but has now dropped to 1.3%. Despite a modest
upside surprise in the Q3 CPI data, annualised inflation
measures remain well below the RBA’s target range of
2-3%. In its most recent policy statement, the RBA
indicated that it does not expect to cut interest rates
further. Nevertheless, with inflationary pressures so
subdued, Oxford Economics predicts that interest rates
will stay on hold till 2018.
Figure 26: RBA - progressive interest rate cuts
Source: RBA/Colliers Edge
Figure 25: Australia - the growth pendulum swings back south-east
24 Asia Pacific:
the dragons rise anew | 14 November 2016 | Property Research | Colliers International
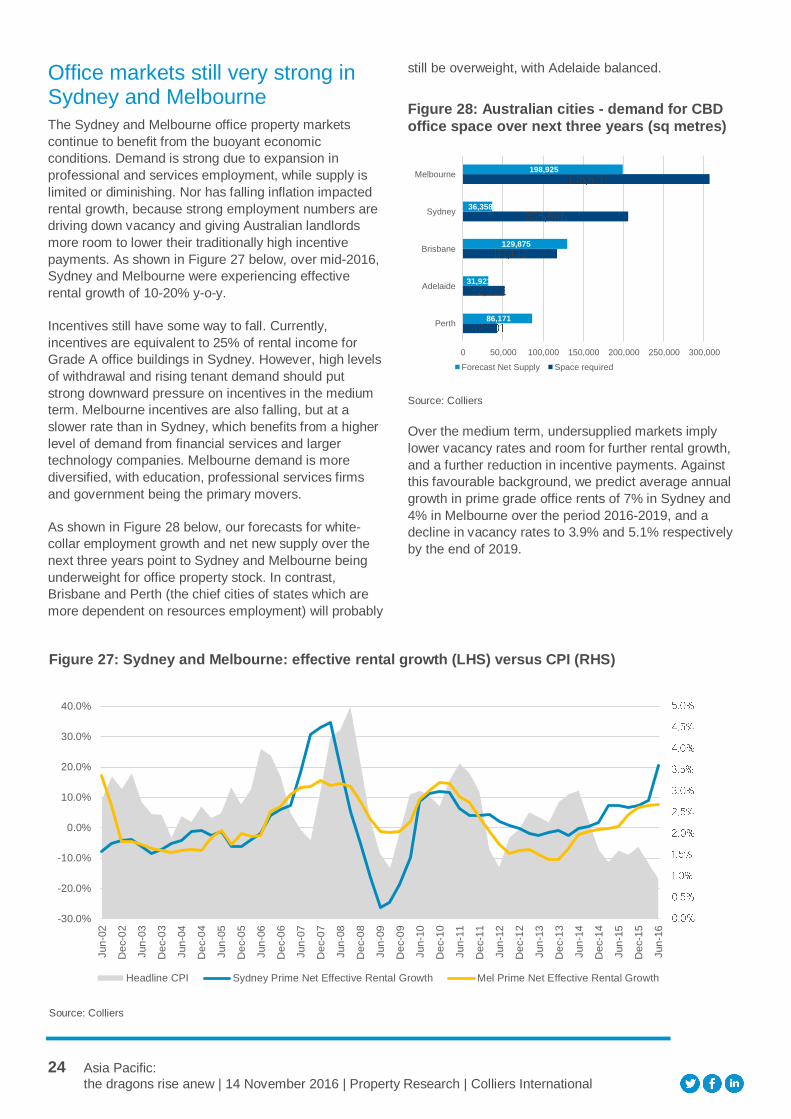
Office markets still very strong in Sydney and Melbourne
The Sydney and Melbourne office property markets
continue to benefit from the buoyant economic
conditions. Demand is strong due to expansion in
professional and services employment, while supply is
limited or diminishing. Nor has falling inflation impacted
rental growth, because strong employment numbers are
driving down vacancy and giving Australian landlords
more room to lower their traditionally high incentive
payments. As shown in Figure 27 below, over mid-2016,
Sydney and Melbourne were experiencing effective
rental growth of 10-20% y-o-y.
Incentives still have some way to fall. Currently,
incentives are equivalent to 25% of rental income for
Grade A office buildings in Sydney. However, high levels
of withdrawal and rising tenant demand should put
strong downward pressure on incentives in the medium
term. Melbourne incentives are also falling, but at a
slower rate than in Sydney, which benefits from a higher
level of demand from financial services and larger
technology companies. Melbourne demand is more
diversified, with education, professional services firms
and government being the primary movers.
As shown in Figure 28 below, our forecasts for white-
collar employment growth and net new supply over the
next three years point to Sydney and Melbourne being
underweight for office property stock. In contrast,
Brisbane and Perth (the chief cities of states which are
more dependent on resources employment) will probably
still be overweight, with Adelaide balanced.
Figure 28: Australian cities - demand for CBD
office space over next three years (sq metres)
Source: Colliers
Over the medium term, undersupplied markets imply
lower vacancy rates and room for further rental growth,
and a further reduction in incentive payments. Against
this favourable background, we predict average annual
growth in prime grade office rents of 7% in Sydney and
4% in Melbourne over the period 2016-2019, and a
decline in vacancy rates to 3.9% and 5.1% respectively
by the end of 2019.
86,171
31,921
129,875
36,358
198,925
0 50,000 100,000 150,000 200,000 250,000 300,000
Perth
Adelaide
Brisbane
Sydney
Melbourne
Forecast Net Supply Space required
Figure 27: Sydney and Melbourne: effective rental growth (LHS) versus CPI (RHS)
Source: Colliers
-30.0%
-20.0%
-10.0%
0.0%
10.0%
20.0%
30.0%
40.0%
Jun
-02
De
c-0
2
Jun
-03
De
c-0
3
Jun
-04
De
c-0
4
Jun
-05
De
c-0
5
Jun
-06
De
c-0
6
Jun
-07
De
c-0
7
Jun
-08
De
c-0
8
Jun
-09
De
c-0
9
Jun
-10
De
c-1
0
Jun
-11
De
c-1
1
Jun
-12
De
c-1
2
Jun
-13
De
c-1
3
Jun
-14
De
c-1
4
Jun
-15
De
c-1
5
Jun
-16
Headline CPI Sydney Prime Net Effective Rental Growth Mel Prime Net Effective Rental Growth
25 Asia Pacific:
the dragons rise anew | 14 November 2016 | Property Research | Colliers International
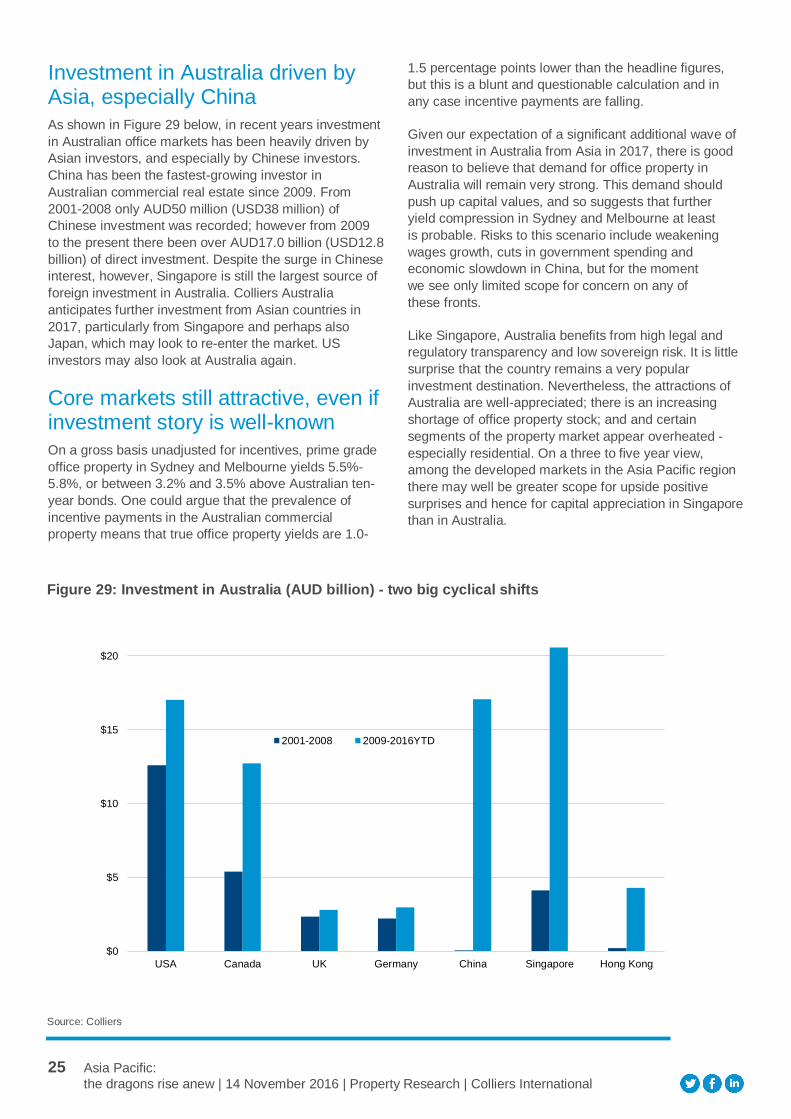
Investment in Australia driven by Asia, especially China
As shown in Figure 29 below, in recent years investment
in Australian office markets has been heavily driven by
Asian investors, and especially by Chinese investors.
China has been the fastest-growing investor in
Australian commercial real estate since 2009. From
2001-2008 only AUD50 million (USD38 million) of
Chinese investment was recorded; however from 2009
to the present there been over AUD17.0 billion (USD12.8
billion) of direct investment. Despite the surge in Chinese
interest, however, Singapore is still the largest source of
foreign investment in Australia. Colliers Australia
anticipates further investment from Asian countries in
2017, particularly from Singapore and perhaps also
Japan, which may look to re-enter the market. US
investors may also look at Australia again.
Core markets still attractive, even if investment story is well-known
On a gross basis unadjusted for incentives, prime grade
office property in Sydney and Melbourne yields 5.5%-
5.8%, or between 3.2% and 3.5% above Australian ten-
year bonds. One could argue that the prevalence of
incentive payments in the Australian commercial
property means that true office property yields are 1.0-
1.5 percentage points lower than the headline figures,
but this is a blunt and questionable calculation and in
any case incentive payments are falling.
Given our expectation of a significant additional wave of
investment in Australia from Asia in 2017, there is good
reason to believe that demand for office property in
Australia will remain very strong. This demand should
push up capital values, and so suggests that further
yield compression in Sydney and Melbourne at least
is probable. Risks to this scenario include weakening
wages growth, cuts in government spending and
economic slowdown in China, but for the moment
we see only limited scope for concern on any of
these fronts.
Like Singapore, Australia benefits from high legal and
regulatory transparency and low sovereign risk. It is little
surprise that the country remains a very popular
investment destination. Nevertheless, the attractions of
Australia are well-appreciated; there is an increasing
shortage of office property stock; and and certain
segments of the property market appear overheated -
especially residential. On a three to five year view,
among the developed markets in the Asia Pacific region
there may well be greater scope for upside positive
surprises and hence for capital appreciation in Singapore
than in Australia.
Figure 29: Investment in Australia (AUD billion) - two big cyclical shifts
Source: Colliers
$0
$5
$10
$15
$20
USA Canada UK Germany China Singapore Hong Kong
2001-2008 2009-2016YTD
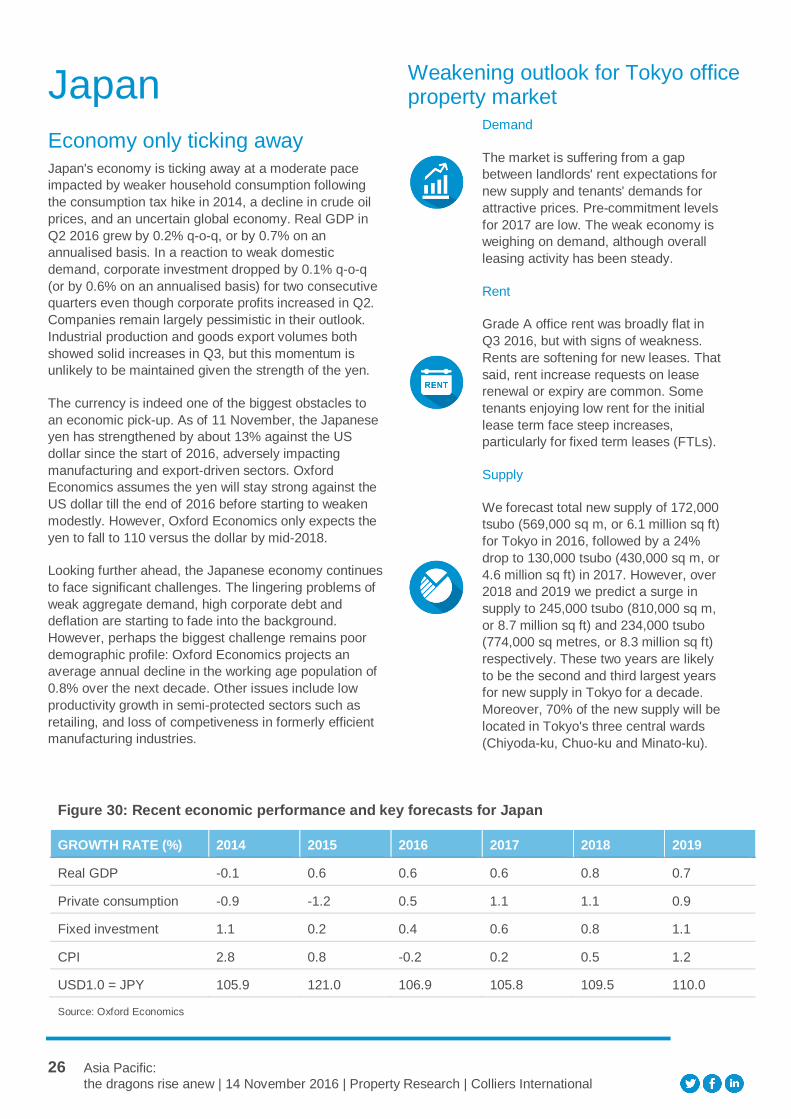
26 Asia Pacific:
the dragons rise anew | 14 November 2016 | Property Research | Colliers International
Japan
Economy only ticking away
Japan's economy is ticking away at a moderate pace
impacted by weaker household consumption following
the consumption tax hike in 2014, a decline in crude oil
prices, and an uncertain global economy. Real GDP in
Q2 2016 grew by 0.2% q-o-q, or by 0.7% on an
annualised basis. In a reaction to weak domestic
demand, corporate investment dropped by 0.1% q-o-q
(or by 0.6% on an annualised basis) for two consecutive
quarters even though corporate profits increased in Q2.
Companies remain largely pessimistic in their outlook.
Industrial production and goods export volumes both
showed solid increases in Q3, but this momentum is
unlikely to be maintained given the strength of the yen.
The currency is indeed one of the biggest obstacles to
an economic pick-up. As of 11 November, the Japanese
yen has strengthened by about 13% against the US
dollar since the start of 2016, adversely impacting
manufacturing and export-driven sectors. Oxford
Economics assumes the yen will stay strong against the
US dollar till the end of 2016 before starting to weaken
modestly. However, Oxford Economics only expects the
yen to fall to 110 versus the dollar by mid-2018.
Looking further ahead, the Japanese economy continues
to face significant challenges. The lingering problems of
weak aggregate demand, high corporate debt and
deflation are starting to fade into the background.
However, perhaps the biggest challenge remains poor
demographic profile: Oxford Economics projects an
average annual decline in the working age population of
0.8% over the next decade. Other issues include low
productivity growth in semi-protected sectors such as
retailing, and loss of competiveness in formerly efficient
manufacturing industries.
Weakening outlook for Tokyo office property market
Demand
The market is suffering from a gap
between landlords' rent expectations for
new supply and tenants' demands for
attractive prices. Pre-commitment levels
for 2017 are low. The weak economy is
weighing on demand, although overall
leasing activity has been steady.
Rent
Grade A office rent was broadly flat in
Q3 2016, but with signs of weakness.
Rents are softening for new leases. That
said, rent increase requests on lease
renewal or expiry are common. Some
tenants enjoying low rent for the initial
lease term face steep increases,
particularly for fixed term leases (FTLs).
Supply
We forecast total new supply of 172,000
tsubo (569,000 sq m, or 6.1 million sq ft)
for Tokyo in 2016, followed by a 24%
drop to 130,000 tsubo (430,000 sq m, or
4.6 million sq ft) in 2017. However, over
2018 and 2019 we predict a surge in
supply to 245,000 tsubo (810,000 sq m,
or 8.7 million sq ft) and 234,000 tsubo
(774,000 sq metres, or 8.3 million sq ft)
respectively. These two years are likely
to be the second and third largest years
for new supply in Tokyo for a decade.
Moreover, 70% of the new supply will be
located in Tokyo's three central wards
(Chiyoda-ku, Chuo-ku and Minato-ku).
Figure 30: Recent economic performance and key forecasts for Japan
GROWTH RATE (%) 2014 2015 2016 2017 2018 2019
Real GDP -0.1 0.6 0.6 0.6 0.8 0.7
Private consumption -0.9 -1.2 0.5 1.1 1.1 0.9
Fixed investment 1.1 0.2 0.4 0.6 0.8 1.1
CPI 2.8 0.8 -0.2 0.2 0.5 1.2
USD1.0 = JPY 105.9 121.0 106.9 105.8 109.5 110.0
Source: Oxford Economics
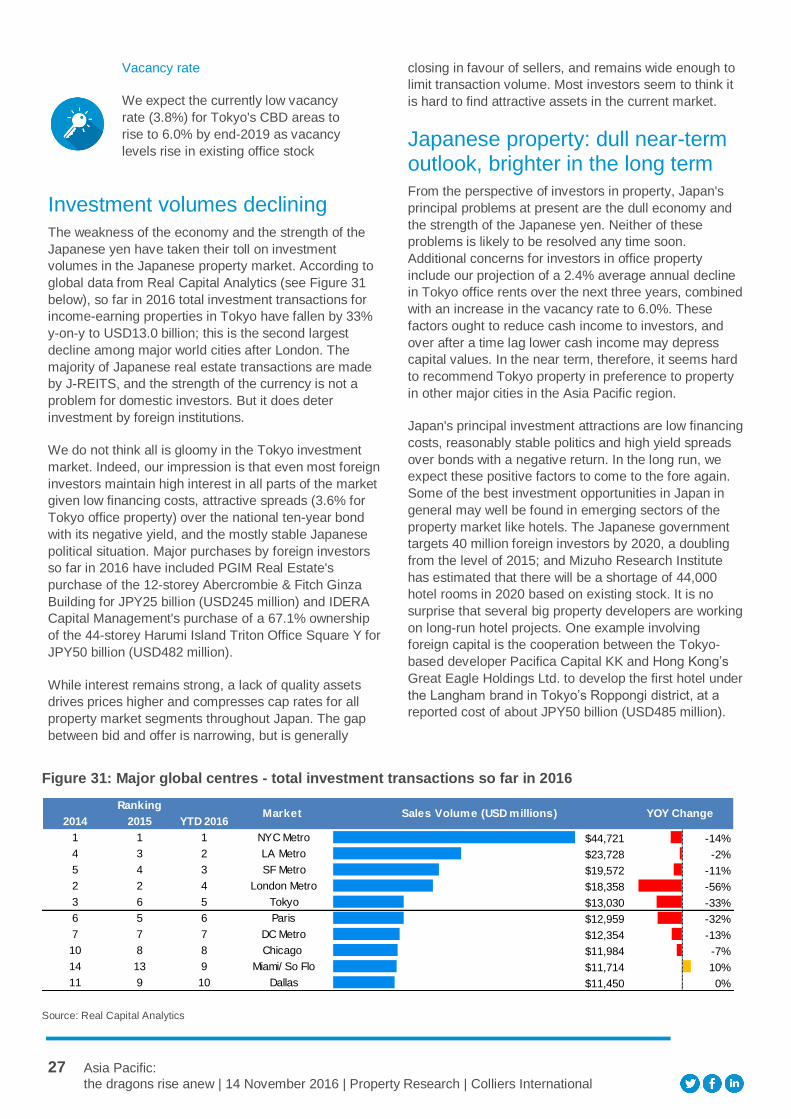
27 Asia Pacific:
the dragons rise anew | 14 November 2016 | Property Research | Colliers International
Vacancy rate
We expect the currently low vacancy
rate (3.8%) for Tokyo's CBD areas to
rise to 6.0% by end-2019 as vacancy
levels rise in existing office stock
Investment volumes declining
The weakness of the economy and the strength of the
Japanese yen have taken their toll on investment
volumes in the Japanese property market. According to
global data from Real Capital Analytics (see Figure 31
below), so far in 2016 total investment transactions for
income-earning properties in Tokyo have fallen by 33%
y-on-y to USD13.0 billion; this is the second largest
decline among major world cities after London. The
majority of Japanese real estate transactions are made
by J-REITS, and the strength of the currency is not a
problem for domestic investors. But it does deter
investment by foreign institutions.
We do not think all is gloomy in the Tokyo investment
market. Indeed, our impression is that even most foreign
investors maintain high interest in all parts of the market
given low financing costs, attractive spreads (3.6% for
Tokyo office property) over the national ten-year bond
with its negative yield, and the mostly stable Japanese
political situation. Major purchases by foreign investors
so far in 2016 have included PGIM Real Estate's
purchase of the 12-storey Abercrombie & Fitch Ginza
Building for JPY25 billion (USD245 million) and IDERA
Capital Management's purchase of a 67.1% ownership
of the 44-storey Harumi Island Triton Office Square Y for
JPY50 billion (USD482 million).
While interest remains strong, a lack of quality assets
drives prices higher and compresses cap rates for all
property market segments throughout Japan. The gap
between bid and offer is narrowing, but is generally
closing in favour of sellers, and remains wide enough to
limit transaction volume. Most investors seem to think it
is hard to find attractive assets in the current market.
Japanese property: dull near-term outlook, brighter in the long term From the perspective of investors in property, Japan's
principal problems at present are the dull economy and
the strength of the Japanese yen. Neither of these
problems is likely to be resolved any time soon.
Additional concerns for investors in office property
include our projection of a 2.4% average annual decline
in Tokyo office rents over the next three years, combined
with an increase in the vacancy rate to 6.0%. These
factors ought to reduce cash income to investors, and
over after a time lag lower cash income may depress
capital values. In the near term, therefore, it seems hard
to recommend Tokyo property in preference to property
in other major cities in the Asia Pacific region.
Japan's principal investment attractions are low financing
costs, reasonably stable politics and high yield spreads
over bonds with a negative return. In the long run, we
expect these positive factors to come to the fore again.
Some of the best investment opportunities in Japan in
general may well be found in emerging sectors of the
property market like hotels. The Japanese government
targets 40 million foreign investors by 2020, a doubling
from the level of 2015; and Mizuho Research Institute
has estimated that there will be a shortage of 44,000
hotel rooms in 2020 based on existing stock. It is no
surprise that several big property developers are working
on long-run hotel projects. One example involving
foreign capital is the cooperation between the Tokyo-
based developer Pacifica Capital KK and Hong Kong’s
Great Eagle Holdings Ltd. to develop the first hotel under
the Langham brand in Tokyo’s Roppongi district, at a
reported cost of about JPY50 billion (USD485 million).
Figure 31: Major global centres - total investment transactions so far in 2016
Source: Real Capital Analytics
2014 2015 YTD 2016
1 1 1 NYC Metro $44,721 -14%
4 3 2 LA Metro $23,728 -2%
5 4 3 SF Metro $19,572 -11%
2 2 4 London Metro $18,358 -56%
3 6 5 Tokyo $13,030 -33%
6 5 6 Paris $12,959 -32%
7 7 7 DC Metro $12,354 -13%
10 8 8 Chicago $11,984 -7%
14 13 9 Miami/ So Flo $11,714 10%
11 9 10 Dallas $11,450 0%
RankingMarket YOY ChangeSales Volume (USD millions)
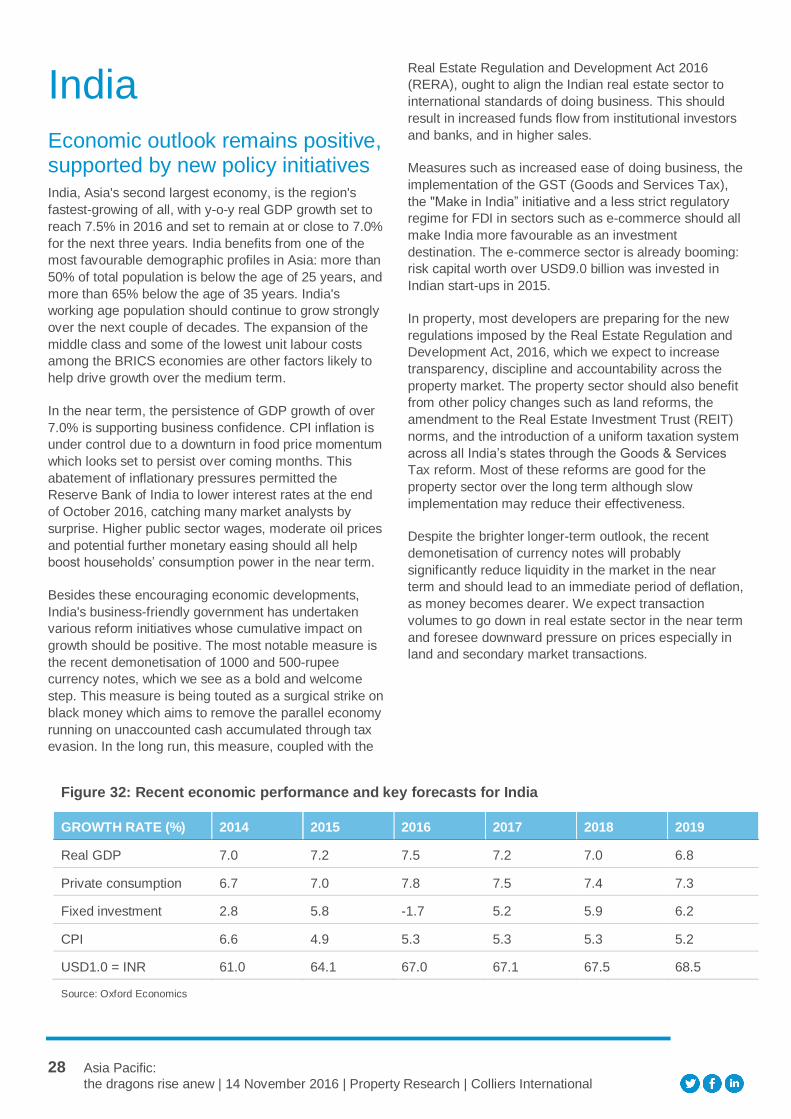
28 Asia Pacific:
the dragons rise anew | 14 November 2016 | Property Research | Colliers International
India
Economic outlook remains positive, supported by new policy initiatives India, Asia's second largest economy, is the region's
fastest-growing of all, with y-o-y real GDP growth set to
reach 7.5% in 2016 and set to remain at or close to 7.0%
for the next three years. India benefits from one of the
most favourable demographic profiles in Asia: more than
50% of total population is below the age of 25 years, and
more than 65% below the age of 35 years. India's
working age population should continue to grow strongly
over the next couple of decades. The expansion of the
middle class and some of the lowest unit labour costs
among the BRICS economies are other factors likely to
help drive growth over the medium term.
In the near term, the persistence of GDP growth of over
7.0% is supporting business confidence. CPI inflation is
under control due to a downturn in food price momentum
which looks set to persist over coming months. This
abatement of inflationary pressures permitted the
Reserve Bank of India to lower interest rates at the end
of October 2016, catching many market analysts by
surprise. Higher public sector wages, moderate oil prices
and potential further monetary easing should all help
boost households’ consumption power in the near term.
Besides these encouraging economic developments,
India's business-friendly government has undertaken
various reform initiatives whose cumulative impact on
growth should be positive. The most notable measure is
the recent demonetisation of 1000 and 500-rupee
currency notes, which we see as a bold and welcome
step. This measure is being touted as a surgical strike on
black money which aims to remove the parallel economy
running on unaccounted cash accumulated through tax
evasion. In the long run, this measure, coupled with the
Real Estate Regulation and Development Act 2016
(RERA), ought to align the Indian real estate sector to
international standards of doing business. This should
result in increased funds flow from institutional investors
and banks, and in higher sales.
Measures such as increased ease of doing business, the
implementation of the GST (Goods and Services Tax),
the "Make in India” initiative and a less strict regulatory
regime for FDI in sectors such as e-commerce should all
make India more favourable as an investment
destination. The e-commerce sector is already booming:
risk capital worth over USD9.0 billion was invested in
Indian start-ups in 2015.
In property, most developers are preparing for the new
regulations imposed by the Real Estate Regulation and
Development Act, 2016, which we expect to increase
transparency, discipline and accountability across the
property market. The property sector should also benefit
from other policy changes such as land reforms, the
amendment to the Real Estate Investment Trust (REIT)
norms, and the introduction of a uniform taxation system
across all India’s states through the Goods & Services
Tax reform. Most of these reforms are good for the
property sector over the long term although slow
implementation may reduce their effectiveness.
Despite the brighter longer-term outlook, the recent
demonetisation of currency notes will probably
significantly reduce liquidity in the market in the near
term and should lead to an immediate period of deflation,
as money becomes dearer. We expect transaction
volumes to go down in real estate sector in the near term
and foresee downward pressure on prices especially in
land and secondary market transactions.
Figure 32: Recent economic performance and key forecasts for India
GROWTH RATE (%) 2014 2015 2016 2017 2018 2019
Real GDP 7.0 7.2 7.5 7.2 7.0 6.8
Private consumption 6.7 7.0 7.8 7.5 7.4 7.3
Fixed investment 2.8 5.8 -1.7 5.2 5.9 6.2
CPI 6.6 4.9 5.3 5.3 5.3 5.2
USD1.0 = INR 61.0 64.1 67.0 67.1 67.5 68.5
Source: Oxford Economics
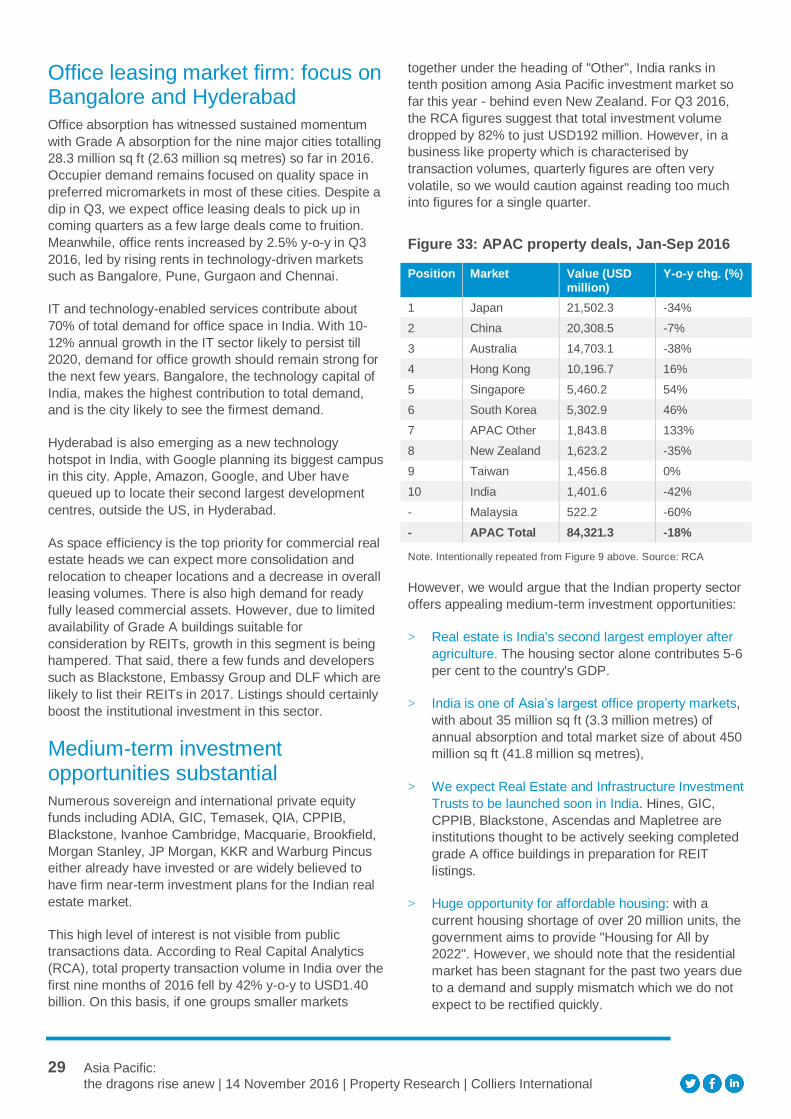
29 Asia Pacific:
the dragons rise anew | 14 November 2016 | Property Research | Colliers International
Office leasing market firm: focus on Bangalore and Hyderabad
Office absorption has witnessed sustained momentum
with Grade A absorption for the nine major cities totalling
28.3 million sq ft (2.63 million sq metres) so far in 2016.
Occupier demand remains focused on quality space in
preferred micromarkets in most of these cities. Despite a
dip in Q3, we expect office leasing deals to pick up in
coming quarters as a few large deals come to fruition.
Meanwhile, office rents increased by 2.5% y-o-y in Q3
2016, led by rising rents in technology-driven markets
such as Bangalore, Pune, Gurgaon and Chennai.
IT and technology-enabled services contribute about
70% of total demand for office space in India. With 10-
12% annual growth in the IT sector likely to persist till
2020, demand for office growth should remain strong for
the next few years. Bangalore, the technology capital of
India, makes the highest contribution to total demand,
and is the city likely to see the firmest demand.
Hyderabad is also emerging as a new technology
hotspot in India, with Google planning its biggest campus
in this city. Apple, Amazon, Google, and Uber have
queued up to locate their second largest development
centres, outside the US, in Hyderabad.
As space efficiency is the top priority for commercial real
estate heads we can expect more consolidation and
relocation to cheaper locations and a decrease in overall
leasing volumes. There is also high demand for ready
fully leased commercial assets. However, due to limited
availability of Grade A buildings suitable for
consideration by REITs, growth in this segment is being
hampered. That said, there a few funds and developers
such as Blackstone, Embassy Group and DLF which are
likely to list their REITs in 2017. Listings should certainly
boost the institutional investment in this sector.
Medium-term investment opportunities substantial
Numerous sovereign and international private equity
funds including ADIA, GIC, Temasek, QIA, CPPIB,
Blackstone, Ivanhoe Cambridge, Macquarie, Brookfield,
Morgan Stanley, JP Morgan, KKR and Warburg Pincus
either already have invested or are widely believed to
have firm near-term investment plans for the Indian real
estate market.
This high level of interest is not visible from public
transactions data. According to Real Capital Analytics
(RCA), total property transaction volume in India over the
first nine months of 2016 fell by 42% y-o-y to USD1.40
billion. On this basis, if one groups smaller markets
together under the heading of "Other", India ranks in
tenth position among Asia Pacific investment market so
far this year - behind even New Zealand. For Q3 2016,
the RCA figures suggest that total investment volume
dropped by 82% to just USD192 million. However, in a
business like property which is characterised by
transaction volumes, quarterly figures are often very
volatile, so we would caution against reading too much
into figures for a single quarter.
Figure 33: APAC property deals, Jan-Sep 2016
Position Market Value (USD million)
Y-o-y chg. (%)
1 Japan 21,502.3 -34%
2 China 20,308.5 -7%
3 Australia 14,703.1 -38%
4 Hong Kong 10,196.7 16%
5 Singapore 5,460.2 54%
6 South Korea 5,302.9 46%
7 APAC Other 1,843.8 133%
8 New Zealand 1,623.2 -35%
9 Taiwan 1,456.8 0%
10 India 1,401.6 -42%
- Malaysia 522.2 -60%
- APAC Total 84,321.3 -18%
Note. Intentionally repeated from Figure 9 above. Source: RCA
However, we would argue that the Indian property sector
offers appealing medium-term investment opportunities:
> Real estate is India's second largest employer after
agriculture. The housing sector alone contributes 5-6
per cent to the country's GDP.
> India is one of Asia’s largest office property markets,
with about 35 million sq ft (3.3 million metres) of
annual absorption and total market size of about 450
million sq ft (41.8 million sq metres),
> We expect Real Estate and Infrastructure Investment
Trusts to be launched soon in India. Hines, GIC,
CPPIB, Blackstone, Ascendas and Mapletree are
institutions thought to be actively seeking completed
grade A office buildings in preparation for REIT
listings.
> Huge opportunity for affordable housing: with a
current housing shortage of over 20 million units, the
government aims to provide "Housing for All by
2022". However, we should note that the residential
market has been stagnant for the past two years due
to a demand and supply mismatch which we do not
expect to be rectified quickly.
30 Asia Pacific:
the dragons rise anew | 14 November 2016 | Property Research | Colliers International
> Manufacturing revolution through "Make In India":
The “Make in India” initiative, 100% FDI in the e-
commerce sector and the new Goods and Services
Tax (GST) should fuel growth in the industrial and
warehousing segments of the property market.
> Industrial parks: Chinese developers such as
Wanda, Fosun and Country Garden are believed to
have major plans to invest in India. Wanda is thought
to be at the due diligence stage to develop 3,000
acres of “industrial townships”, while the private
equity firm Warburg Pincus and the property firm
Embassy announced earlier this year that they would
invest USD250m in industrial parks.
> Smart city initiative creating demand for Tier II and III
cities: the government has initiated the development
of 100 “smart cities” and rejuvenated 500 more.
Time for investors to put India on their radar screens India is a less developed country than China: GDP per
capita on a purchasing power parity basis was only
USD6,200 for India in 2015, compared to USD14,300 in
China (source: CIA World Factbook). Moreover, despite
its undoubted huge potential, India continues to suffer
from challenges such as inadequate infrastructure which
hold the country back. Such factors help explain why
most institutional investors consider India to be a deeper
emerging market than China, and why the Indian risk-
free rate is much higher than the Chinese (Indian ten-
year bonds yield 6.7% rather than 2.8% as in China).
However in the recent years the government has
proactively been investing in infrastructure projects and
encouraging public private partnership in this sector. In
the property sector, most investors still regard India as
non-core, and this situation is unlikely to change for
some time. It therefore makes little sense to suggest, for
example, that Indian office property is more attractive
than office property elsewhere in the Asia Pacific region
simply because it offers the highest absolute yields -
8.3% in the case of Mumbai's BKC district.
On the other hand, an increasing number of institutional
investors are already present in the Indian property
market, and the amounts of money that they have
committed or plan to commit are significant. Considering
the ample medium-term investment opportunities that we
perceive in India, we think it is time for investors to start
paying greater attention to the country. In this respect,
institutional investors will be following the example of
large multinational occupiers, which have already made
major commitments to markets such as Bangalore,
Mumbai, the National Capital Region and Hyderabad.
31 Asia Pacific:
the dragons rise anew | 14 November 2016 | Property Research | Colliers International
US election:
impact on Asia
Trump's victory surprises global markets, but less so than Brexit
At first sight, the unexpected victory of Donald Trump,
the Republican candidate, in this year's US presidential
election raises many challenges for Asia, including a
possible near-term hit to US and global confidence and
growth and radical trade policies targeting China and
other countries. We saw some of the possible
implications on 9 November in the form of falling Asian
stock markets and a sharp strengthening of traditional
safe haven assets such as gold and the Japanese yen.
It is possible that any turbulence in financial markets
following Mr Trump's victory will prove very short-term.
Indeed, the US equity market rallied strongly over the
days after Mr Trump's election, and the Dow Jones
Industrial Average closed at an all-time high on Friday 11
November (although the broader S&P 500 index remains
just short of its all-time high). Certainly, Mr Trump's
victory appears to be having a less adverse impact on
financial markets than the shock of Brexit, i.e. the UK's
vote to leave the European Union 23 June. Even if
politically driven tumult in financial markets restarts, for
the moment there are few grounds to believe that it will
lead to any long-run declines or recession in the US.
Expansionary and contractionary: different views about Trump's economic policies However, now that Mr Trump has won, we must start to
examine his policies. Mr Trump has many radical policy
proposals, but he did not articulate them very clearly
during his presidential campaign; nor is it clear which of
his policies he will actively promote first. Domestically,
Mr Trump has suggested that he will press for up to
USD1.0 trillion of tax reductions and a major clampdown
on illegal immigrant workers, while regarding foreign
policy he has suggested that he will press for tariffs of up
to 45% to be imposed on imports from China and other
countries.
In office, Mr Trump may prove less radical than his policy
proposals suggest. That said, elections for 34 of 100
seats in the Senate and all 435 seats in the House of
Representatives were held on the same day as the
presidential election. The outcome has been very good
for the Republican Party, which has regained control of
the Senate and retained control of the House of
Representatives. If Mr Trump does face opposition to his
policies, it will have to come from within his own party.
There seem to be two quite different schools of thought
about the probable domestic impact of Mr Trump's
economic vision. The first is that the large proposed tax
cuts will have an expansionary effect on the US
economy. This view appears to be coupled with the idea
that Mr Trump's administration will actively promote
large-scale infrastructure projects in order to stimulate
the economy. In this scenario, it is reasonable to expect
the US budget deficit to increase, and inflation to pick up.
This school of thought appears to have majority
acceptance so far, and explains why the US bond
market has experienced a major sell-off since Mr
Trump's election: the ten-year Treasury bond yield has
surged in just three days from 1.86% to 2.15%.
If inflation is set to pick up, then the Federal Reserve will
probably push up interest rates relatively quickly. Such
action ought to support the US dollar. This view may
explain why the dollar has strengthened over the past
few days, even against "safe haven" currencies such as
the Japanese yen. If it could be maintained over the
medium term, US dollar strength would be positive for
Asian manufacturing nations, since it would boost the
competitiveness of their exports. To a limited extent,
therefore, US dollar strength might compensate for
possible new tariffs on Asian imports.
The second school of thought is that Mr Trump's
proposed tax reductions will end up being financed
largely by cuts to government spending. The
combination of lower spending and the deportation of
large numbers of illegal immigrants (assuming that Mr
Trump carries out his campaign threats) will have a
contractionary effect on the US economy - perhaps not
straight away, but within a year or two.
Oxford Economics is a respected forecasting house
which, at least in the run-up to the election, subscribed to
this second view. In its "moderate Trump" scenario,
Oxford Economics posited tax cuts of USD1.0 trillion,
spending cuts of USD750bn and tariffs against China of
15%. This outcome would have a limited negative impact
on US growth and marginal effect globally. In its
"adverse Trump" scenario, Oxford Economics posited
tax cuts of USD1.0 trillion, front-loaded spending cuts of
USD1.0 trillion and tariffs against China of 45%, with
additional tariffs on South Korea and India This outcome
would have a significant negative impact on US growth
and materially reduce growth prospects in Asia.
It is obviously too early to take a very firm view one way
or the other. However, considering the positive economic
news that we have seen for the Asia Pacific region, and
32 Asia Pacific:
the dragons rise anew | 14 November 2016 | Property Research | Colliers International
especially China and Hong Kong, so far in 2016, in order
to avoid excessive optimism we prefer for the time being
to take the second view. Uncertainty has increased for
China in particular as a result of Mr Trump's election,
and this must temper our enthusiasm about improving
near-term prospects. However, we are keeping an open
mind, and will be ready to revise our opinion if and when
the evidence permits it.
Slow US interest rate rises would support Hong Kong property
What would be the implications for Asia of the
contractionary growth scenario for the US under Mr
Trump? We have been assuming that the US Federal
Reserve will raise interest rates again this December (as
it has already signalled it plans to do), and thereafter that
it will push up US interest rates steadily over the next
few years. However, if US growth does suffer under Mr
Trump, then the Federal Reserve may only raise interest
rates very gradually over the next few years, and
possibly barely raise them at all.
This prospect has positive implications for property
assets in Hong Kong, because Hong Kong interest rates
are effectively tied to US rates as a result of the
territory's currency peg. Hong Kong has enjoyed
negative real (i.e. inflation-adjusted) interest rates since
late 2009, and as a result has enjoyed what we would
argue are the loosest monetary conditions in Asia. This
prolonged period of easy money has coincided with an
increase in residential property prices of roughly 200%.
On the assumption that US interest rates only increase
gradually and that inflation in Hong Kong stays constant,
we do not expect Hong Kong to return to positive real
interest rates before early 2018, and possibly H2
2018.This outcome should support capital values across
most segments of the Hong Kong property market,
although residential prices will remain vulnerable to
further tightening measures similar to the harsh stamp
duty increases announced by the government last week.
USD weakness would hurt Japan and other Asian exporting nations
If US economic growth suffers and US interest rates
increase more slowly than we have assumed up to now,
the US dollar may also start to weaken after many years
of strength. This scenario would be negative for Asian
exporting countries, notably China which would be the
chief target of threatened new tariff barriers but also
Japan (where the domestic currency is already strong),
South Korea and Taiwan. This is because a weaker
dollar would reduce the competitiveness of their exports,
compounding the impact of possible weaker US demand
and new tariffs on imports.
We should add that the weakness of the domestic
economy and the strength of the Japanese yen have
already taken their toll on investment volumes in the
Japanese property market. According to global data from
Real Capital Analytics, so far in 2016 total investment
transactions for income-earning properties in Tokyo have
fallen by 34% y-on-y to USD13.0 billion; this is second
largest decline among major world cities after London. If
the yen continues to strengthen, foreign investors may
increasingly find themselves priced out of Japanese
property markets.
Direct implications for Asian property markets are limited
Direct medium-term implications of Mr Trump's victory
for the property markets within developing Asian
economies are more limited. China and India - perhaps
especially India - are experiencing strong secular growth
which is unlikely to slow sharply for the next few years.
Investors and large multinational occupiers should
continue to be attracted to important commercial
property markets like Shanghai regardless of who is US
president. Meanwhile, demand and supply in the
Chinese and Indian residential markets are driven largely
by domestic factors such as urbanisation, wealth levels,
interest rates, lending policies and real estate regulation
which have little to do with the US.
Trump and Brexit surprises should lower concern about Asia over time Perhaps the most important implication of Mr Trump’s
victory for Asia lies in the long term. In combination with
this year’s unexpected vote in the UK for Brexit, i.e.
departure from the European Union, the success of an
anti-Establishment candidate in the US should remind
global investors and property occupiers of the potential
for shocks in developed as well as emerging countries.
Since the Global Financial Crisis, US financial assets
have been in high demand and the US dollar has been
strong. This has been reflected in heavy capital outflows
from Asian real estate and stagnating capital inflows
over the past eight years or so. Despite possible near-
term volatility in emerging markets, we believe that the
twin developed market shocks this year of 2016 will
mitigate long-standing political and economic concerns
about Asia, and lead to higher demand for Asian
financial assets including property over time.

Copyright © 2016 Colliers International.
The information contained herein has been obtained from sources deemed reliable. While every reasonable effort has been made to ensure its accuracy, we cannot guarantee it. No responsibility is assumed for any inaccuracies. Readers are encouraged to consult their professional advisors prior to acting on any of the material contained in this report.
About Colliers International Group Inc.
Colliers International Group Inc. (NASDAQ: CIGI; TSX: CIG) is an
industry leading global real estate services company with more than
16,000 skilled professionals operating in 66 countries. With an enterprising culture and significant employee ownership, Colliers
professionals provide a full range of services to real estate
occupiers, owners and investors worldwide. Services include strategic advice and execution for property sales, leasing and
finance; global corporate solutions; property, facility and project
management; workplace solutions; appraisal, valuation and tax
consulting; customized research; and thought leadership consulting.
Colliers professionals think differently, share great ideas and offer
thoughtful and innovative advice that help clients accelerate their
success. Colliers has been ranked among the top 100 outsourcing
firms by the International Association of Outsourcing Professionals’ Global Outsourcing for 11 consecutive years, more than any other
real estate services firm.
colliers.com
554 offices in
66 countries on
6 continents United States: 153
Canada: 34
Latin America: 24
Asia Pacific: 231
EMEA: 112
$2.5 billion in annual revenue
2 billion square feet under management
16,000 professionals and staff
Primary Authors:
Andrew Haskins
Executive Director | Research | Asia
+852 2822 0511
Contributors:
Luke Dixon
Director | Research | Sydney CBD
+61 292 492 020
Daniel Lees
Director | Research | Sydney CBD
+61 292 570 327
Daniel Shih
Director | Research | Hong Kong
+852 2822 0654
Tricia Song
Director | Research | Singapore
+65 6531 8536
Carlby Xie
Senior Director | Research | China
+86 21 6141 3590
Ines Li
Associate Director | Research | Beijing
+86 10 8518 1633
Yumiko Yasuda
Head of Research | Japan
+81 3 5563 2174
Surabhi Arora
Senior Associate Director | Research | Gurgaon
+91 124 456 7580