Embed Size (px)
Citation preview
Pain and Gain March Quarter, 2015
A quarterly assessment of realised gross profit and loss based on dwelling re-sales over the March Quarter of 2015
Executive summary 3
National overview 4
Houses versus units 6
Investor vs owner occupier resales 7
Hold periods 8
Focus on regional markets 10
Unit dwellings within lifestyle markets 12
Pain & Gain: Sydney council regions 13
Pain & Gain: Melbourne council regions 14
Pain & Gain: Brisbane council regions 15
Pain & Gain: Adelaide council regions 16
Pain & Gain: Perth council regions 17
Pain & Gain: Hobart council regions 19
Pain & Gain: Darwin council regions 20
Pain & Gain: Canberra council regions 21
About CoreLogic RP Data 22
Disclaimers 23
Contents
Pain & Gain Report | March Quarter, 2015
Executive Summary
The Pain and Gain Report is a quarterly analysis of homes which were resold over the quarter. It compares the most recent sale price to the previous sale price in order to determine whether the property sold at a gross profit or gross loss. It provides a proxy for the performance of each housing market and highlights the magnitude of profit or loss the typical seller of a home makes across those regions analysed. Over the March 2015 quarter, 9.1% of all homes resold recorded a gross loss when compared to their previous purchase price. This figure was slightly higher than the 8.6% recorded at the end of 2014 but lower than the 9.6% over the same quarter last year. Although the proportion of loss-making resales rose, the figure has been fairly steady over the past 12 months. The total value of the loss-making resales over the quarter was $417 million with an average loss of $69,468. While 9.1% of resales were transacted at a loss, the vast majority (90.9%) of properties resold over the quarter did so at a profit. In fact, 30.7% of homes resold for more than double their previous purchase price. Across those homes which sold at a profit, the total value of this profit was recorded at $13.8 billion with the average gross profit recorded at $230,633. The data also highlights the fact that ownership of property, whether for investment or owner occupier purposes should be seen as a long-term investment. Across the country, those homes that resold at a loss had an average length of ownership of 6.0 years. Across all sales recording a gross profit the average length of ownership was recorded at 10.0 years, while homes which sold for more than double their previous purchase price were owned for an average of 16.8 years. The capital city housing markets continue to record a lower proportion of loss-making resales than regional areas of the country. The trends in regional areas are shifting with the proportion of loss-making resales falling in areas linked to tourism and lifestyle. On the other hand, housing markets linked to the resources sector are generally seeing an increase in loss-making resales as housing market conditions continue to deteriorate.
3
Pain & Gain Report | March Quarter, 2015
National Overview
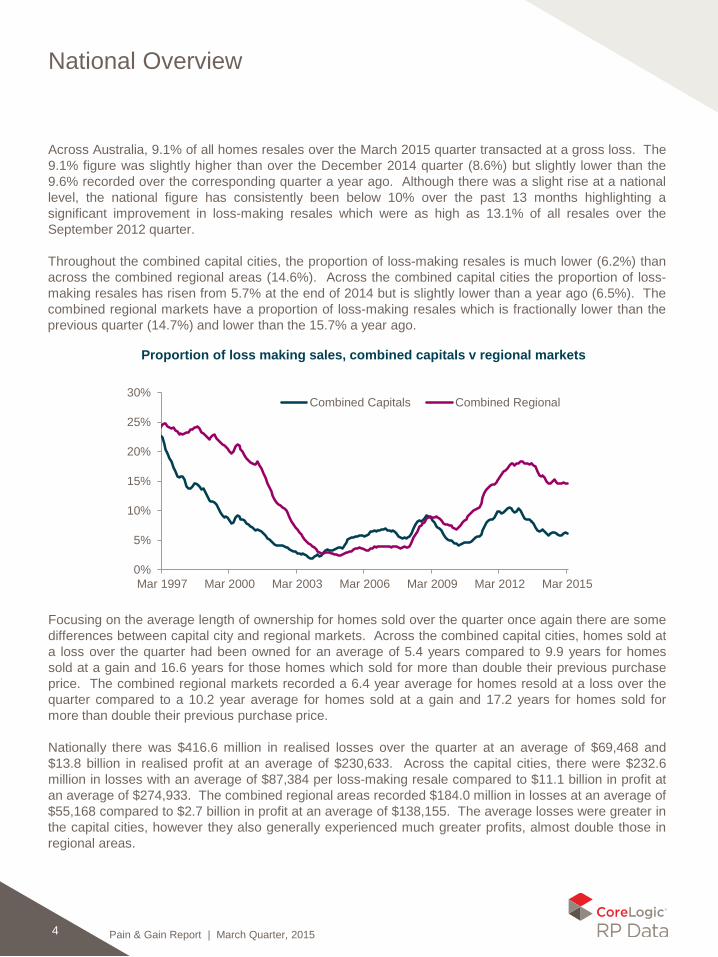
Across Australia, 9.1% of all homes resales over the March 2015 quarter transacted at a gross loss. The 9.1% figure was slightly higher than over the December 2014 quarter (8.6%) but slightly lower than the 9.6% recorded over the corresponding quarter a year ago. Although there was a slight rise at a national level, the national figure has consistently been below 10% over the past 13 months highlighting a significant improvement in loss-making resales which were as high as 13.1% of all resales over the September 2012 quarter. Throughout the combined capital cities, the proportion of loss-making resales is much lower (6.2%) than across the combined regional areas (14.6%). Across the combined capital cities the proportion of loss-making resales has risen from 5.7% at the end of 2014 but is slightly lower than a year ago (6.5%). The combined regional markets have a proportion of loss-making resales which is fractionally lower than the previous quarter (14.7%) and lower than the 15.7% a year ago.
4
Focusing on the average length of ownership for homes sold over the quarter once again there are some differences between capital city and regional markets. Across the combined capital cities, homes sold at a loss over the quarter had been owned for an average of 5.4 years compared to 9.9 years for homes sold at a gain and 16.6 years for those homes which sold for more than double their previous purchase price. The combined regional markets recorded a 6.4 year average for homes resold at a loss over the quarter compared to a 10.2 year average for homes sold at a gain and 17.2 years for homes sold for more than double their previous purchase price. Nationally there was $416.6 million in realised losses over the quarter at an average of $69,468 and $13.8 billion in realised profit at an average of $230,633. Across the capital cities, there were $232.6 million in losses with an average of $87,384 per loss-making resale compared to $11.1 billion in profit at an average of $274,933. The combined regional areas recorded $184.0 million in losses at an average of $55,168 compared to $2.7 billion in profit at an average of $138,155. The average losses were greater in the capital cities, however they also generally experienced much greater profits, almost double those in regional areas.
0%
5%
10%
15%
20%
25%
30%
Mar 1997 Mar 2000 Mar 2003 Mar 2006 Mar 2009 Mar 2012 Mar 2015
Combined Capitals Combined Regional
Proportion of loss making sales, combined capitals v regional markets
Pain & Gain Report | March Quarter, 2015
National Overview
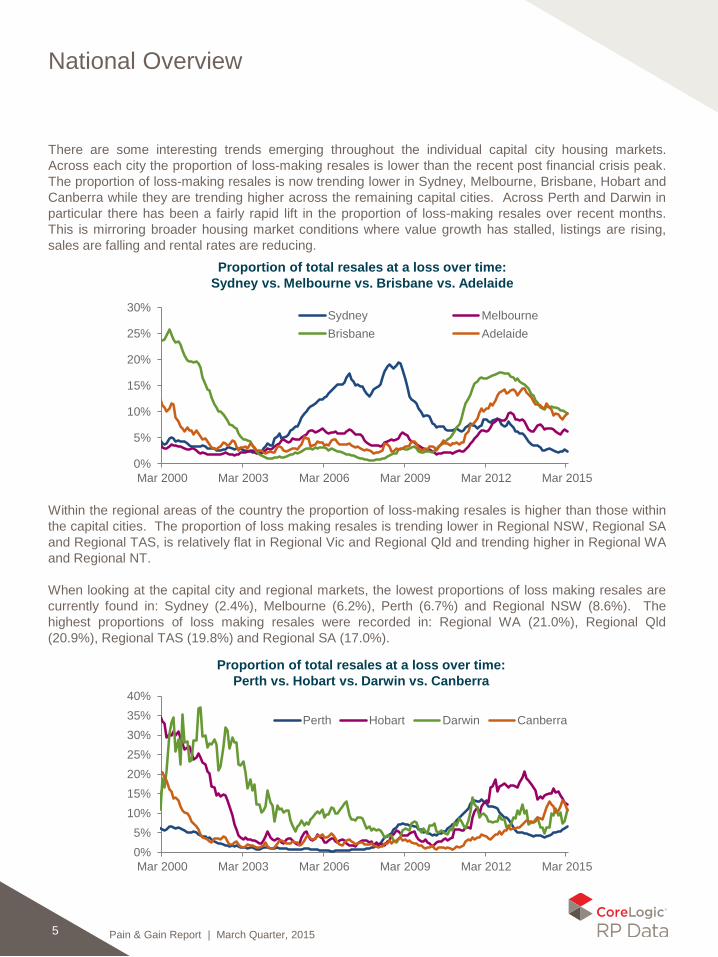
There are some interesting trends emerging throughout the individual capital city housing markets. Across each city the proportion of loss-making resales is lower than the recent post financial crisis peak. The proportion of loss-making resales is now trending lower in Sydney, Melbourne, Brisbane, Hobart and Canberra while they are trending higher across the remaining capital cities. Across Perth and Darwin in particular there has been a fairly rapid lift in the proportion of loss-making resales over recent months. This is mirroring broader housing market conditions where value growth has stalled, listings are rising, sales are falling and rental rates are reducing.
5
Within the regional areas of the country the proportion of loss-making resales is higher than those within the capital cities. The proportion of loss making resales is trending lower in Regional NSW, Regional SA and Regional TAS, is relatively flat in Regional Vic and Regional Qld and trending higher in Regional WA and Regional NT. When looking at the capital city and regional markets, the lowest proportions of loss making resales are currently found in: Sydney (2.4%), Melbourne (6.2%), Perth (6.7%) and Regional NSW (8.6%). The highest proportions of loss making resales were recorded in: Regional WA (21.0%), Regional Qld (20.9%), Regional TAS (19.8%) and Regional SA (17.0%).
0%
5%
10%
15%
20%
25%
30%
Mar 2000 Mar 2003 Mar 2006 Mar 2009 Mar 2012 Mar 2015
Sydney MelbourneBrisbane Adelaide
0%5%
10%15%20%25%30%35%40%
Mar 2000 Mar 2003 Mar 2006 Mar 2009 Mar 2012 Mar 2015
Perth Hobart Darwin Canberra
Proportion of total resales at a loss over time: Sydney vs. Melbourne vs. Brisbane vs. Adelaide
Proportion of total resales at a loss over time: Perth vs. Hobart vs. Darwin vs. Canberra
Pain & Gain Report | March Quarter, 2015
Houses versus Units
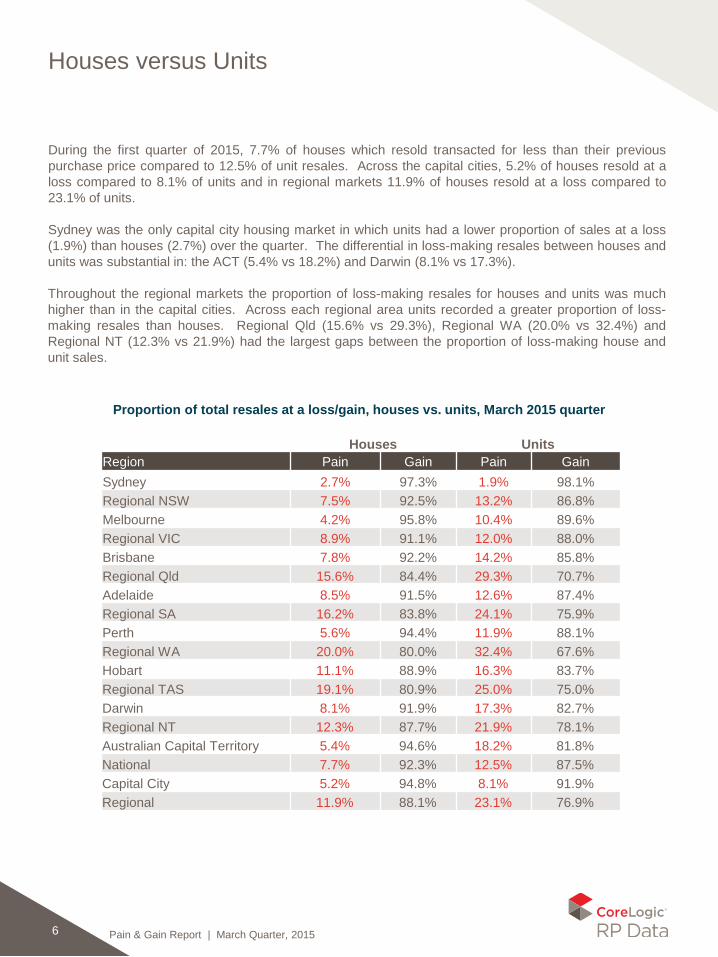
During the first quarter of 2015, 7.7% of houses which resold transacted for less than their previous purchase price compared to 12.5% of unit resales. Across the capital cities, 5.2% of houses resold at a loss compared to 8.1% of units and in regional markets 11.9% of houses resold at a loss compared to 23.1% of units. Sydney was the only capital city housing market in which units had a lower proportion of sales at a loss (1.9%) than houses (2.7%) over the quarter. The differential in loss-making resales between houses and units was substantial in: the ACT (5.4% vs 18.2%) and Darwin (8.1% vs 17.3%). Throughout the regional markets the proportion of loss-making resales for houses and units was much higher than in the capital cities. Across each regional area units recorded a greater proportion of loss-making resales than houses. Regional Qld (15.6% vs 29.3%), Regional WA (20.0% vs 32.4%) and Regional NT (12.3% vs 21.9%) had the largest gaps between the proportion of loss-making house and unit sales.
6
Houses Units Region Pain Gain Pain Gain Sydney 2.7% 97.3% 1.9% 98.1% Regional NSW 7.5% 92.5% 13.2% 86.8% Melbourne 4.2% 95.8% 10.4% 89.6% Regional VIC 8.9% 91.1% 12.0% 88.0% Brisbane 7.8% 92.2% 14.2% 85.8% Regional Qld 15.6% 84.4% 29.3% 70.7% Adelaide 8.5% 91.5% 12.6% 87.4% Regional SA 16.2% 83.8% 24.1% 75.9% Perth 5.6% 94.4% 11.9% 88.1% Regional WA 20.0% 80.0% 32.4% 67.6% Hobart 11.1% 88.9% 16.3% 83.7% Regional TAS 19.1% 80.9% 25.0% 75.0% Darwin 8.1% 91.9% 17.3% 82.7% Regional NT 12.3% 87.7% 21.9% 78.1% Australian Capital Territory 5.4% 94.6% 18.2% 81.8% National 7.7% 92.3% 12.5% 87.5% Capital City 5.2% 94.8% 8.1% 91.9% Regional 11.9% 88.1% 23.1% 76.9%
Proportion of total resales at a loss/gain, houses vs. units, March 2015 quarter
Pain & Gain Report | March Quarter, 2015
Investor vs Owner Occupier Resales
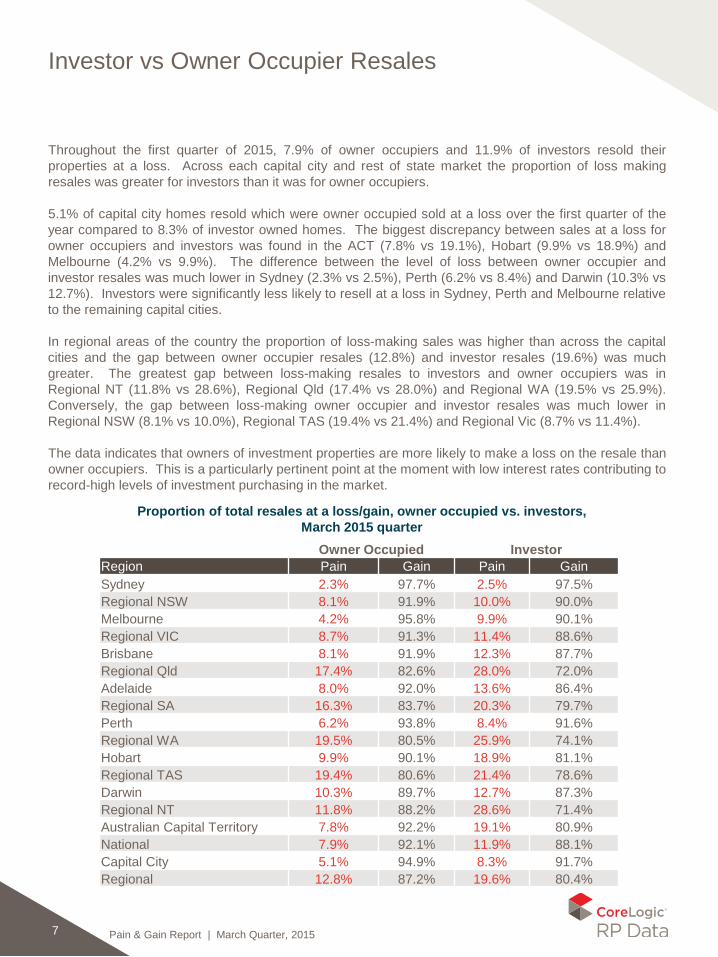
Throughout the first quarter of 2015, 7.9% of owner occupiers and 11.9% of investors resold their properties at a loss. Across each capital city and rest of state market the proportion of loss making resales was greater for investors than it was for owner occupiers. 5.1% of capital city homes resold which were owner occupied sold at a loss over the first quarter of the year compared to 8.3% of investor owned homes. The biggest discrepancy between sales at a loss for owner occupiers and investors was found in the ACT (7.8% vs 19.1%), Hobart (9.9% vs 18.9%) and Melbourne (4.2% vs 9.9%). The difference between the level of loss between owner occupier and investor resales was much lower in Sydney (2.3% vs 2.5%), Perth (6.2% vs 8.4%) and Darwin (10.3% vs 12.7%). Investors were significantly less likely to resell at a loss in Sydney, Perth and Melbourne relative to the remaining capital cities. In regional areas of the country the proportion of loss-making sales was higher than across the capital cities and the gap between owner occupier resales (12.8%) and investor resales (19.6%) was much greater. The greatest gap between loss-making resales to investors and owner occupiers was in Regional NT (11.8% vs 28.6%), Regional Qld (17.4% vs 28.0%) and Regional WA (19.5% vs 25.9%). Conversely, the gap between loss-making owner occupier and investor resales was much lower in Regional NSW (8.1% vs 10.0%), Regional TAS (19.4% vs 21.4%) and Regional Vic (8.7% vs 11.4%). The data indicates that owners of investment properties are more likely to make a loss on the resale than owner occupiers. This is a particularly pertinent point at the moment with low interest rates contributing to record-high levels of investment purchasing in the market.
7
Owner Occupied Investor Region Pain Gain Pain Gain Sydney 2.3% 97.7% 2.5% 97.5% Regional NSW 8.1% 91.9% 10.0% 90.0% Melbourne 4.2% 95.8% 9.9% 90.1% Regional VIC 8.7% 91.3% 11.4% 88.6% Brisbane 8.1% 91.9% 12.3% 87.7% Regional Qld 17.4% 82.6% 28.0% 72.0% Adelaide 8.0% 92.0% 13.6% 86.4% Regional SA 16.3% 83.7% 20.3% 79.7% Perth 6.2% 93.8% 8.4% 91.6% Regional WA 19.5% 80.5% 25.9% 74.1% Hobart 9.9% 90.1% 18.9% 81.1% Regional TAS 19.4% 80.6% 21.4% 78.6% Darwin 10.3% 89.7% 12.7% 87.3% Regional NT 11.8% 88.2% 28.6% 71.4% Australian Capital Territory 7.8% 92.2% 19.1% 80.9% National 7.9% 92.1% 11.9% 88.1% Capital City 5.1% 94.9% 8.3% 91.7% Regional 12.8% 87.2% 19.6% 80.4%
Proportion of total resales at a loss/gain, owner occupied vs. investors, March 2015 quarter
Pain & Gain Report | March Quarter, 2015
Hold Periods
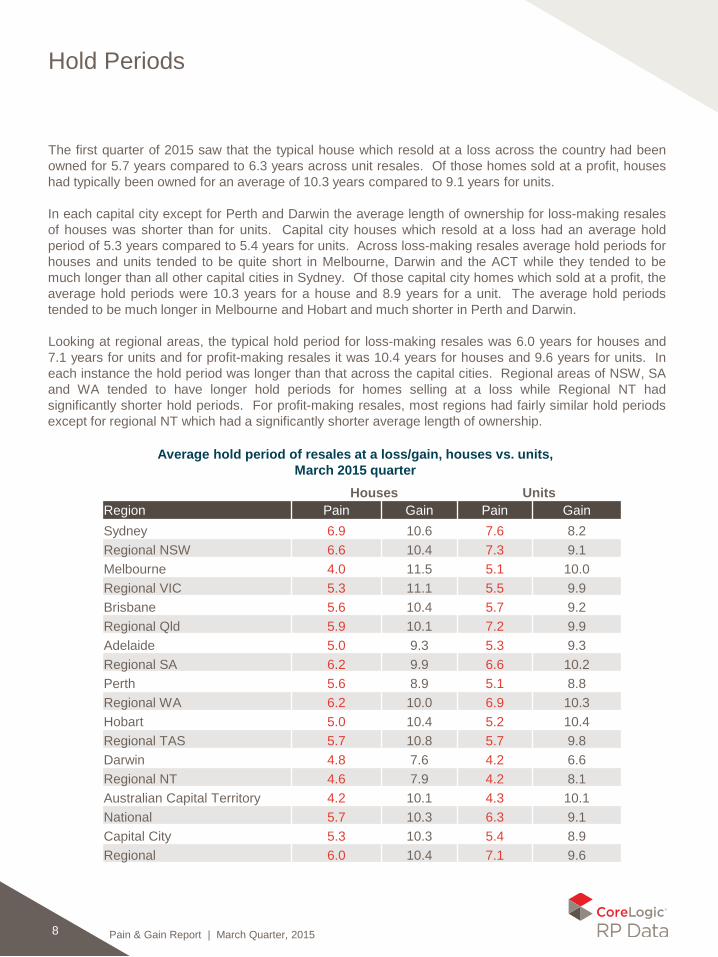
The first quarter of 2015 saw that the typical house which resold at a loss across the country had been owned for 5.7 years compared to 6.3 years across unit resales. Of those homes sold at a profit, houses had typically been owned for an average of 10.3 years compared to 9.1 years for units. In each capital city except for Perth and Darwin the average length of ownership for loss-making resales of houses was shorter than for units. Capital city houses which resold at a loss had an average hold period of 5.3 years compared to 5.4 years for units. Across loss-making resales average hold periods for houses and units tended to be quite short in Melbourne, Darwin and the ACT while they tended to be much longer than all other capital cities in Sydney. Of those capital city homes which sold at a profit, the average hold periods were 10.3 years for a house and 8.9 years for a unit. The average hold periods tended to be much longer in Melbourne and Hobart and much shorter in Perth and Darwin. Looking at regional areas, the typical hold period for loss-making resales was 6.0 years for houses and 7.1 years for units and for profit-making resales it was 10.4 years for houses and 9.6 years for units. In each instance the hold period was longer than that across the capital cities. Regional areas of NSW, SA and WA tended to have longer hold periods for homes selling at a loss while Regional NT had significantly shorter hold periods. For profit-making resales, most regions had fairly similar hold periods except for regional NT which had a significantly shorter average length of ownership.
8
Houses Units Region Pain Gain Pain Gain Sydney 6.9 10.6 7.6 8.2 Regional NSW 6.6 10.4 7.3 9.1 Melbourne 4.0 11.5 5.1 10.0 Regional VIC 5.3 11.1 5.5 9.9 Brisbane 5.6 10.4 5.7 9.2 Regional Qld 5.9 10.1 7.2 9.9 Adelaide 5.0 9.3 5.3 9.3 Regional SA 6.2 9.9 6.6 10.2 Perth 5.6 8.9 5.1 8.8 Regional WA 6.2 10.0 6.9 10.3 Hobart 5.0 10.4 5.2 10.4 Regional TAS 5.7 10.8 5.7 9.8 Darwin 4.8 7.6 4.2 6.6 Regional NT 4.6 7.9 4.2 8.1 Australian Capital Territory 4.2 10.1 4.3 10.1 National 5.7 10.3 6.3 9.1 Capital City 5.3 10.3 5.4 8.9 Regional 6.0 10.4 7.1 9.6
Average hold period of resales at a loss/gain, houses vs. units, March 2015 quarter
Pain & Gain Report | March Quarter, 2015
Hold Periods
Properties held for a short period are much more susceptible to loss Across resales of homes throughout the March 2015 quarter, those homes that were held for only a short period of time proved to be much more susceptible to loss. Although home values increased over the past 12 months, 13.0% of owners who purchased and resold in the same year recorded a gross loss (keep in mind these sales are only a fraction of all resales). Homes resold after being held for between 7 and 10 years were the most likely to record a gross loss (16.0%) followed by those held between 5 and 7 years (15.2%). The data also reiterates the long-term nature of housing investment as well as relatively weaker growth in values over the past decade. Far fewer homes are transacted at a loss when they are held for a decade or more. Looking across the regions of the country there is a divergence in the proportion of total resales that were at a loss and how long these homes have been owned for. In Sydney and Perth, homes previously purchased and sold over the past year were most likely to record a gross loss. In Melbourne, Adelaide, Hobart, and Canberra homes previously purchased between 2008 and 2010 were the most likely to record a gross loss. In Brisbane and Darwin, homes purchased between 2005 and 2007 were more regularly sold at a loss over the past quarter. The data highlights the divergent trends across housing markets over time. Once again, the long-term nature of housing investment is evident with very few homes recording a gross loss on sale once they have been owned for more than 10 years.
9
Pain & Gain Report | March Quarter, 2015
Focus on Regional Markets
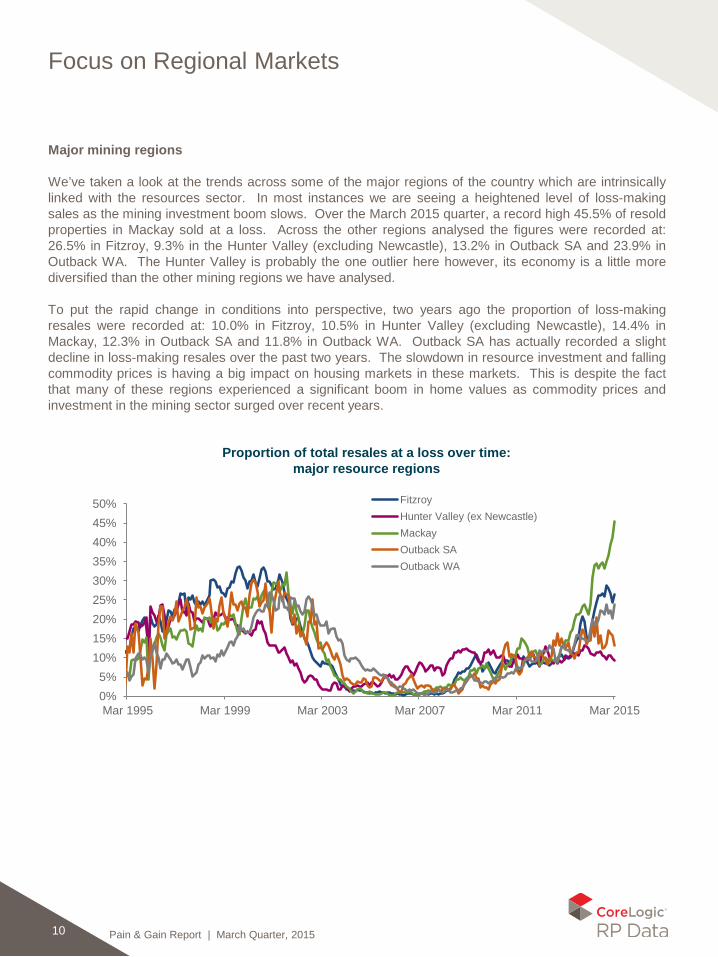
Major mining regions We’ve taken a look at the trends across some of the major regions of the country which are intrinsically linked with the resources sector. In most instances we are seeing a heightened level of loss-making sales as the mining investment boom slows. Over the March 2015 quarter, a record high 45.5% of resold properties in Mackay sold at a loss. Across the other regions analysed the figures were recorded at: 26.5% in Fitzroy, 9.3% in the Hunter Valley (excluding Newcastle), 13.2% in Outback SA and 23.9% in Outback WA. The Hunter Valley is probably the one outlier here however, its economy is a little more diversified than the other mining regions we have analysed. To put the rapid change in conditions into perspective, two years ago the proportion of loss-making resales were recorded at: 10.0% in Fitzroy, 10.5% in Hunter Valley (excluding Newcastle), 14.4% in Mackay, 12.3% in Outback SA and 11.8% in Outback WA. Outback SA has actually recorded a slight decline in loss-making resales over the past two years. The slowdown in resource investment and falling commodity prices is having a big impact on housing markets in these markets. This is despite the fact that many of these regions experienced a significant boom in home values as commodity prices and investment in the mining sector surged over recent years.
10
0%5%
10%15%20%25%30%35%40%45%50%
Mar 1995 Mar 1999 Mar 2003 Mar 2007 Mar 2011 Mar 2015
FitzroyHunter Valley (ex Newcastle)MackayOutback SAOutback WA
Proportion of total resales at a loss over time: major resource regions
Pain & Gain Report | March Quarter, 2015
Focus on Regional Markets
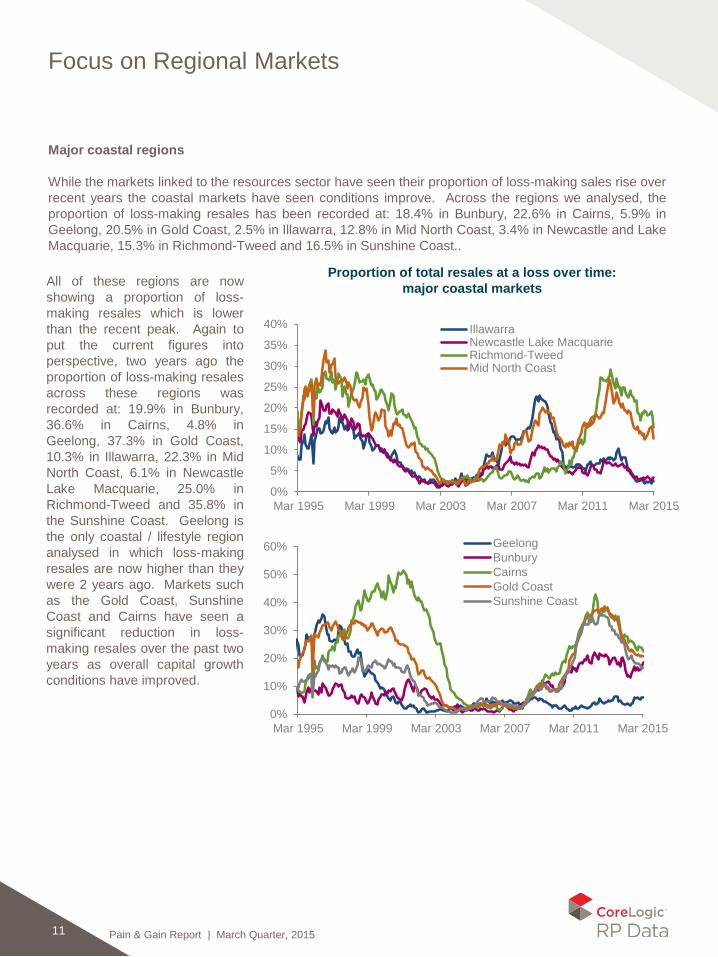
Major coastal regions While the markets linked to the resources sector have seen their proportion of loss-making sales rise over recent years the coastal markets have seen conditions improve. Across the regions we analysed, the proportion of loss-making resales has been recorded at: 18.4% in Bunbury, 22.6% in Cairns, 5.9% in Geelong, 20.5% in Gold Coast, 2.5% in Illawarra, 12.8% in Mid North Coast, 3.4% in Newcastle and Lake Macquarie, 15.3% in Richmond-Tweed and 16.5% in Sunshine Coast..
11
All of these regions are now showing a proportion of loss-making resales which is lower than the recent peak. Again to put the current figures into perspective, two years ago the proportion of loss-making resales across these regions was recorded at: 19.9% in Bunbury, 36.6% in Cairns, 4.8% in Geelong, 37.3% in Gold Coast, 10.3% in Illawarra, 22.3% in Mid North Coast, 6.1% in Newcastle Lake Macquarie, 25.0% in Richmond-Tweed and 35.8% in the Sunshine Coast. Geelong is the only coastal / lifestyle region analysed in which loss-making resales are now higher than they were 2 years ago. Markets such as the Gold Coast, Sunshine Coast and Cairns have seen a significant reduction in loss-making resales over the past two years as overall capital growth conditions have improved.
0%
5%
10%
15%
20%
25%
30%
35%
40%
Mar 1995 Mar 1999 Mar 2003 Mar 2007 Mar 2011 Mar 2015
IllawarraNewcastle Lake MacquarieRichmond-TweedMid North Coast
0%
10%
20%
30%
40%
50%
60%
Mar 1995 Mar 1999 Mar 2003 Mar 2007 Mar 2011 Mar 2015
GeelongBunburyCairnsGold CoastSunshine Coast
Proportion of total resales at a loss over time: major coastal markets

Pain & Gain Report | March Quarter, 2015
Unit dwellings within lifestyle markets are generally showing the largest proportion of loss-making re-sales
Proportion of loss-making re-sales March Quarter 2015 non-capital city SA4 regions and GCCSA regions, houses and units
12
From a regional perspective the largest proportion of loss-making resales were located in the following regions:
Mackay (Qld) (45.5%)
Townsville (Qld) (30.7%)
Wide Bay (Qld) (28.3%)
Fitzroy (Qld) (26.5%)
Outback (WA) (23.9%)
Wheat Belt (WA) (23.8%)
Cairns (Qld) (22.6%)
Launceston and North East (Tas) (21.0%)
Gold Coast (Qld) (20.5%)
The lowest proportion of loss-making resales were recorded in the following regions:
Sydney (NSW) (2.4%)
Illawarra (NSW) (2.5%)
Toowoomba (Qld) (2.7%)
Newcastle and Lake Macquarie (NSW) (3.4%)
Bendigo (Vic) (4.0%)
Southern Highlands and Shoalhaven (NSW) (5.2%)
Geelong (Vic) (5.9%)
Melbourne (Vic) (6.2%)
Perth (WA) (6.7%)
Outback (Qld) (7.3%).
0% 10% 20% 30% 40% 50%
Australian Capital TerritoryCapital Region
Central WestCoffs Harbour - Grafton
Far West and OranaHunter Valley exc Newcastle
IllawarraMid North Coast
MurrayNew England and North West
Newcastle and Lake MacquarieRichmond - Tweed
RiverinaSouthern Highlands and Shoalhaven
SydneyDarwin
Northern Territory - OutbackBrisbane
CairnsDarling Downs - Maranoa
FitzroyGold Coast
MackayQueensland - Outback
Sunshine CoastToowoomba
TownsvilleWide BayAdelaide
Barossa - Yorke - Mid NorthSouth Australia - Outback
South Australia - South EastHobart
Launceston and North EastSouth East
West and North WestBallarat
BendigoGeelong
HumeLatrobe - Gippsland
MelbourneNorth WestShepparton
Warrnambool and South WestBunbury
PerthWestern Australia - Outback
Western Australia - Wheat Belt
AC T
NS
WN
TQ
LDS
ATA
SV
ICW
A
UnitsHouses
ACT
Pain & Gain Report | March Quarter, 2015
Pain & Gain Sydney council regions
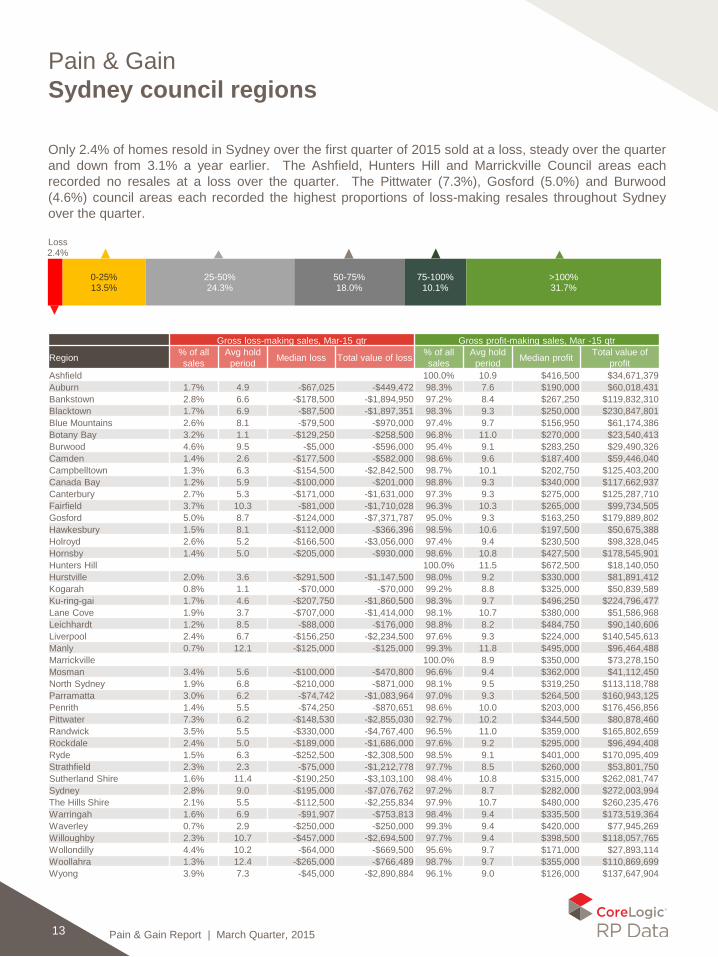
Only 2.4% of homes resold in Sydney over the first quarter of 2015 sold at a loss, steady over the quarter and down from 3.1% a year earlier. The Ashfield, Hunters Hill and Marrickville Council areas each recorded no resales at a loss over the quarter. The Pittwater (7.3%), Gosford (5.0%) and Burwood (4.6%) council areas each recorded the highest proportions of loss-making resales throughout Sydney over the quarter.
13
Gross loss-making sales, Mar-15 qtr Gross profit-making sales, Mar -15 qtr
Region % of all sales
Avg hold period Median loss Total value of loss % of all
sales Avg hold
period Median profit Total value of profit
Ashfield 100.0% 10.9 $416,500 $34,671,379 Auburn 1.7% 4.9 -$67,025 -$449,472 98.3% 7.6 $190,000 $60,018,431 Bankstown 2.8% 6.6 -$178,500 -$1,894,950 97.2% 8.4 $267,250 $119,832,310 Blacktown 1.7% 6.9 -$87,500 -$1,897,351 98.3% 9.3 $250,000 $230,847,801 Blue Mountains 2.6% 8.1 -$79,500 -$970,000 97.4% 9.7 $156,950 $61,174,386 Botany Bay 3.2% 1.1 -$129,250 -$258,500 96.8% 11.0 $270,000 $23,540,413 Burwood 4.6% 9.5 -$5,000 -$596,000 95.4% 9.1 $283,250 $29,490,326 Camden 1.4% 2.6 -$177,500 -$582,000 98.6% 9.6 $187,400 $59,446,040 Campbelltown 1.3% 6.3 -$154,500 -$2,842,500 98.7% 10.1 $202,750 $125,403,200 Canada Bay 1.2% 5.9 -$100,000 -$201,000 98.8% 9.3 $340,000 $117,662,937 Canterbury 2.7% 5.3 -$171,000 -$1,631,000 97.3% 9.3 $275,000 $125,287,710 Fairfield 3.7% 10.3 -$81,000 -$1,710,028 96.3% 10.3 $265,000 $99,734,505 Gosford 5.0% 8.7 -$124,000 -$7,371,787 95.0% 9.3 $163,250 $179,889,802 Hawkesbury 1.5% 8.1 -$112,000 -$366,396 98.5% 10.6 $197,500 $50,675,388 Holroyd 2.6% 5.2 -$166,500 -$3,056,000 97.4% 9.4 $230,500 $98,328,045 Hornsby 1.4% 5.0 -$205,000 -$930,000 98.6% 10.8 $427,500 $178,545,901 Hunters Hill 100.0% 11.5 $672,500 $18,140,050 Hurstville 2.0% 3.6 -$291,500 -$1,147,500 98.0% 9.2 $330,000 $81,891,412 Kogarah 0.8% 1.1 -$70,000 -$70,000 99.2% 8.8 $325,000 $50,839,589 Ku-ring-gai 1.7% 4.6 -$207,750 -$1,860,500 98.3% 9.7 $496,250 $224,796,477 Lane Cove 1.9% 3.7 -$707,000 -$1,414,000 98.1% 10.7 $380,000 $51,586,968 Leichhardt 1.2% 8.5 -$88,000 -$176,000 98.8% 8.2 $484,750 $90,140,606 Liverpool 2.4% 6.7 -$156,250 -$2,234,500 97.6% 9.3 $224,000 $140,545,613 Manly 0.7% 12.1 -$125,000 -$125,000 99.3% 11.8 $495,000 $96,464,488 Marrickville 100.0% 8.9 $350,000 $73,278,150 Mosman 3.4% 5.6 -$100,000 -$470,800 96.6% 9.4 $362,000 $41,112,450 North Sydney 1.9% 6.8 -$210,000 -$871,000 98.1% 9.5 $319,250 $113,118,788 Parramatta 3.0% 6.2 -$74,742 -$1,083,964 97.0% 9.3 $264,500 $160,943,125 Penrith 1.4% 5.5 -$74,250 -$870,651 98.6% 10.0 $203,000 $176,456,856 Pittwater 7.3% 6.2 -$148,530 -$2,855,030 92.7% 10.2 $344,500 $80,878,460 Randwick 3.5% 5.5 -$330,000 -$4,767,400 96.5% 11.0 $359,000 $165,802,659 Rockdale 2.4% 5.0 -$189,000 -$1,686,000 97.6% 9.2 $295,000 $96,494,408 Ryde 1.5% 6.3 -$252,500 -$2,308,500 98.5% 9.1 $401,000 $170,095,409 Strathfield 2.3% 2.3 -$75,000 -$1,212,778 97.7% 8.5 $260,000 $53,801,750 Sutherland Shire 1.6% 11.4 -$190,250 -$3,103,100 98.4% 10.8 $315,000 $262,081,747 Sydney 2.8% 9.0 -$195,000 -$7,076,762 97.2% 8.7 $282,000 $272,003,994 The Hills Shire 2.1% 5.5 -$112,500 -$2,255,834 97.9% 10.7 $480,000 $260,235,476 Warringah 1.6% 6.9 -$91,907 -$753,813 98.4% 9.4 $335,500 $173,519,364 Waverley 0.7% 2.9 -$250,000 -$250,000 99.3% 9.4 $420,000 $77,945,269 Willoughby 2.3% 10.7 -$457,000 -$2,694,500 97.7% 9.4 $398,500 $118,057,765 Wollondilly 4.4% 10.2 -$64,000 -$669,500 95.6% 9.7 $171,000 $27,893,114 Woollahra 1.3% 12.4 -$265,000 -$766,489 98.7% 9.7 $355,000 $110,869,699 Wyong 3.9% 7.3 -$45,000 -$2,890,884 96.1% 9.0 $126,000 $137,647,904
Loss 2.4%
0-25% 13.5%
25-50% 24.3%
50-75% 18.0%
75-100% 10.1%
>100% 31.7%
Pain & Gain Report | March Quarter, 2015
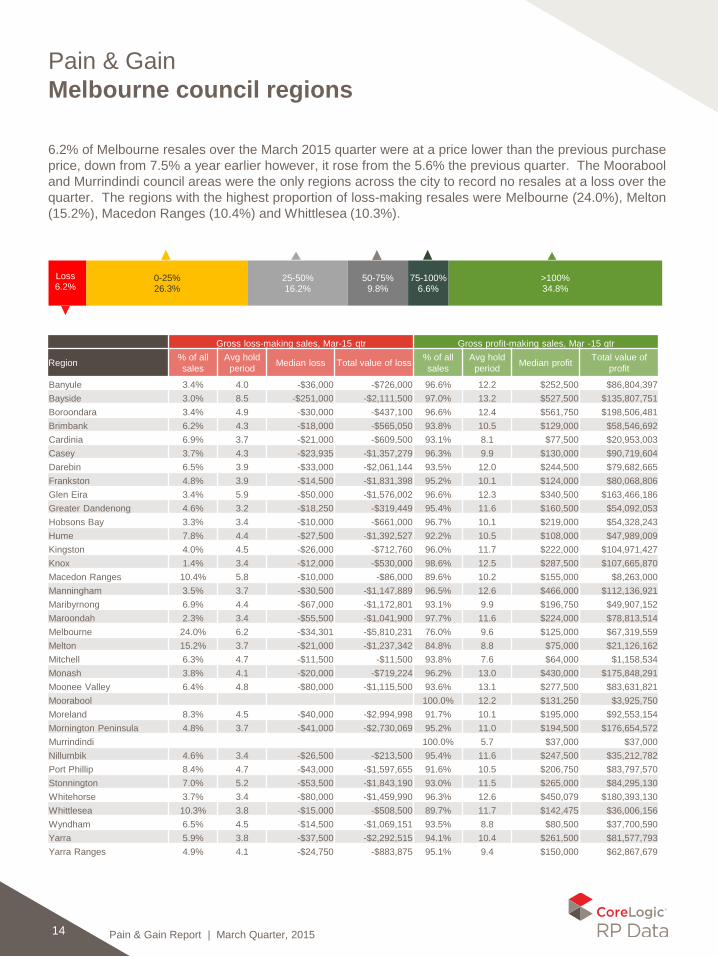
Loss 6.2%
0-25% 26.3%
25-50% 16.2%
50-75% 9.8%
75-100% 6.6%
>100% 34.8%
Pain & Gain Melbourne council regions
6.2% of Melbourne resales over the March 2015 quarter were at a price lower than the previous purchase price, down from 7.5% a year earlier however, it rose from the 5.6% the previous quarter. The Moorabool and Murrindindi council areas were the only regions across the city to record no resales at a loss over the quarter. The regions with the highest proportion of loss-making resales were Melbourne (24.0%), Melton (15.2%), Macedon Ranges (10.4%) and Whittlesea (10.3%).
14
Gross loss-making sales, Mar-15 qtr Gross profit-making sales, Mar -15 qtr
Region % of all sales
Avg hold period Median loss Total value of loss % of all
sales Avg hold
period Median profit Total value of profit
Banyule 3.4% 4.0 -$36,000 -$726,000 96.6% 12.2 $252,500 $86,804,397 Bayside 3.0% 8.5 -$251,000 -$2,111,500 97.0% 13.2 $527,500 $135,807,751 Boroondara 3.4% 4.9 -$30,000 -$437,100 96.6% 12.4 $561,750 $198,506,481 Brimbank 6.2% 4.3 -$18,000 -$565,050 93.8% 10.5 $129,000 $58,546,692 Cardinia 6.9% 3.7 -$21,000 -$609,500 93.1% 8.1 $77,500 $20,953,003 Casey 3.7% 4.3 -$23,935 -$1,357,279 96.3% 9.9 $130,000 $90,719,604 Darebin 6.5% 3.9 -$33,000 -$2,061,144 93.5% 12.0 $244,500 $79,682,665 Frankston 4.8% 3.9 -$14,500 -$1,831,398 95.2% 10.1 $124,000 $80,068,806 Glen Eira 3.4% 5.9 -$50,000 -$1,576,002 96.6% 12.3 $340,500 $163,466,186 Greater Dandenong 4.6% 3.2 -$18,250 -$319,449 95.4% 11.6 $160,500 $54,092,053 Hobsons Bay 3.3% 3.4 -$10,000 -$661,000 96.7% 10.1 $219,000 $54,328,243 Hume 7.8% 4.4 -$27,500 -$1,392,527 92.2% 10.5 $108,000 $47,989,009 Kingston 4.0% 4.5 -$26,000 -$712,760 96.0% 11.7 $222,000 $104,971,427 Knox 1.4% 3.4 -$12,000 -$530,000 98.6% 12.5 $287,500 $107,665,870 Macedon Ranges 10.4% 5.8 -$10,000 -$86,000 89.6% 10.2 $155,000 $8,263,000 Manningham 3.5% 3.7 -$30,500 -$1,147,889 96.5% 12.6 $466,000 $112,136,921 Maribyrnong 6.9% 4.4 -$67,000 -$1,172,801 93.1% 9.9 $196,750 $49,907,152 Maroondah 2.3% 3.4 -$55,500 -$1,041,900 97.7% 11.6 $224,000 $78,813,514 Melbourne 24.0% 6.2 -$34,301 -$5,810,231 76.0% 9.6 $125,000 $67,319,559 Melton 15.2% 3.7 -$21,000 -$1,237,342 84.8% 8.8 $75,000 $21,126,162 Mitchell 6.3% 4.7 -$11,500 -$11,500 93.8% 7.6 $64,000 $1,158,534 Monash 3.8% 4.1 -$20,000 -$719,224 96.2% 13.0 $430,000 $175,848,291 Moonee Valley 6.4% 4.8 -$80,000 -$1,115,500 93.6% 13.1 $277,500 $83,631,821 Moorabool 100.0% 12.2 $131,250 $3,925,750 Moreland 8.3% 4.5 -$40,000 -$2,994,998 91.7% 10.1 $195,000 $92,553,154 Mornington Peninsula 4.8% 3.7 -$41,000 -$2,730,069 95.2% 11.0 $194,500 $176,654,572 Murrindindi 100.0% 5.7 $37,000 $37,000 Nillumbik 4.6% 3.4 -$26,500 -$213,500 95.4% 11.6 $247,500 $35,212,782 Port Phillip 8.4% 4.7 -$43,000 -$1,597,655 91.6% 10.5 $206,750 $83,797,570 Stonnington 7.0% 5.2 -$53,500 -$1,843,190 93.0% 11.5 $265,000 $84,295,130 Whitehorse 3.7% 3.4 -$80,000 -$1,459,990 96.3% 12.6 $450,079 $180,393,130 Whittlesea 10.3% 3.8 -$15,000 -$508,500 89.7% 11.7 $142,475 $36,006,156 Wyndham 6.5% 4.5 -$14,500 -$1,069,151 93.5% 8.8 $80,500 $37,700,590 Yarra 5.9% 3.8 -$37,500 -$2,292,515 94.1% 10.4 $261,500 $81,577,793 Yarra Ranges 4.9% 4.1 -$24,750 -$883,875 95.1% 9.4 $150,000 $62,867,679
Pain & Gain Report | March Quarter, 2015
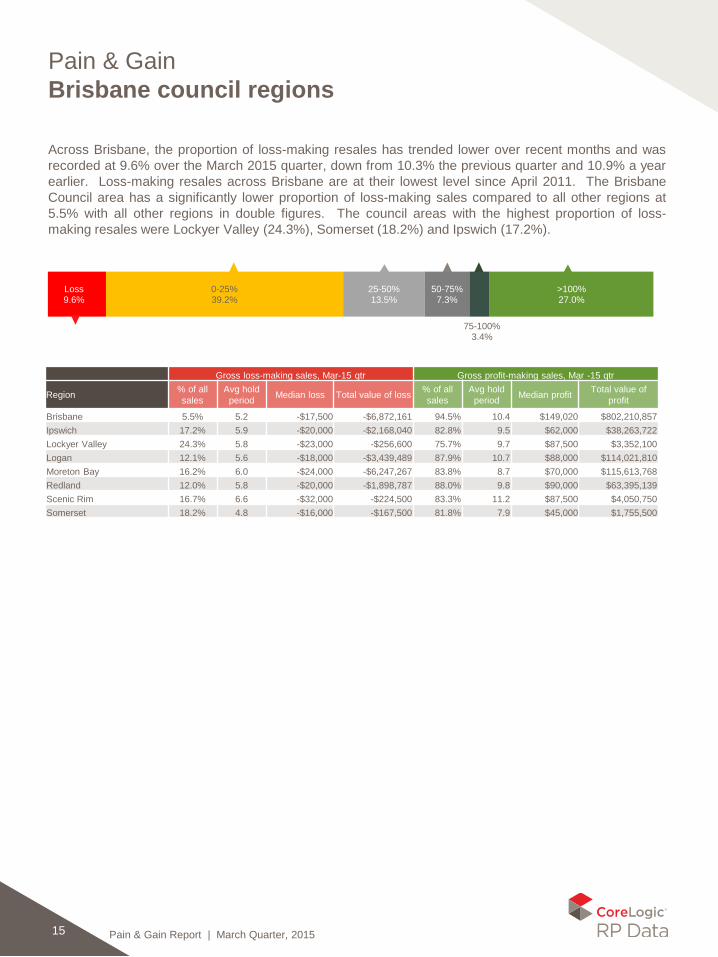
Loss 9.6%
0-25% 39.2%
25-50% 13.5%
50-75% 7.3%
75-100% 3.4%
>100% 27.0%
Pain & Gain Brisbane council regions
Across Brisbane, the proportion of loss-making resales has trended lower over recent months and was recorded at 9.6% over the March 2015 quarter, down from 10.3% the previous quarter and 10.9% a year earlier. Loss-making resales across Brisbane are at their lowest level since April 2011. The Brisbane Council area has a significantly lower proportion of loss-making sales compared to all other regions at 5.5% with all other regions in double figures. The council areas with the highest proportion of loss-making resales were Lockyer Valley (24.3%), Somerset (18.2%) and Ipswich (17.2%).
15
Gross loss-making sales, Mar-15 qtr Gross profit-making sales, Mar -15 qtr
Region % of all sales
Avg hold period Median loss Total value of loss % of all
sales Avg hold
period Median profit Total value of profit
Brisbane 5.5% 5.2 -$17,500 -$6,872,161 94.5% 10.4 $149,020 $802,210,857 Ipswich 17.2% 5.9 -$20,000 -$2,168,040 82.8% 9.5 $62,000 $38,263,722 Lockyer Valley 24.3% 5.8 -$23,000 -$256,600 75.7% 9.7 $87,500 $3,352,100 Logan 12.1% 5.6 -$18,000 -$3,439,489 87.9% 10.7 $88,000 $114,021,810 Moreton Bay 16.2% 6.0 -$24,000 -$6,247,267 83.8% 8.7 $70,000 $115,613,768 Redland 12.0% 5.8 -$20,000 -$1,898,787 88.0% 9.8 $90,000 $63,395,139 Scenic Rim 16.7% 6.6 -$32,000 -$224,500 83.3% 11.2 $87,500 $4,050,750 Somerset 18.2% 4.8 -$16,000 -$167,500 81.8% 7.9 $45,000 $1,755,500
Pain & Gain Report | March Quarter, 2015
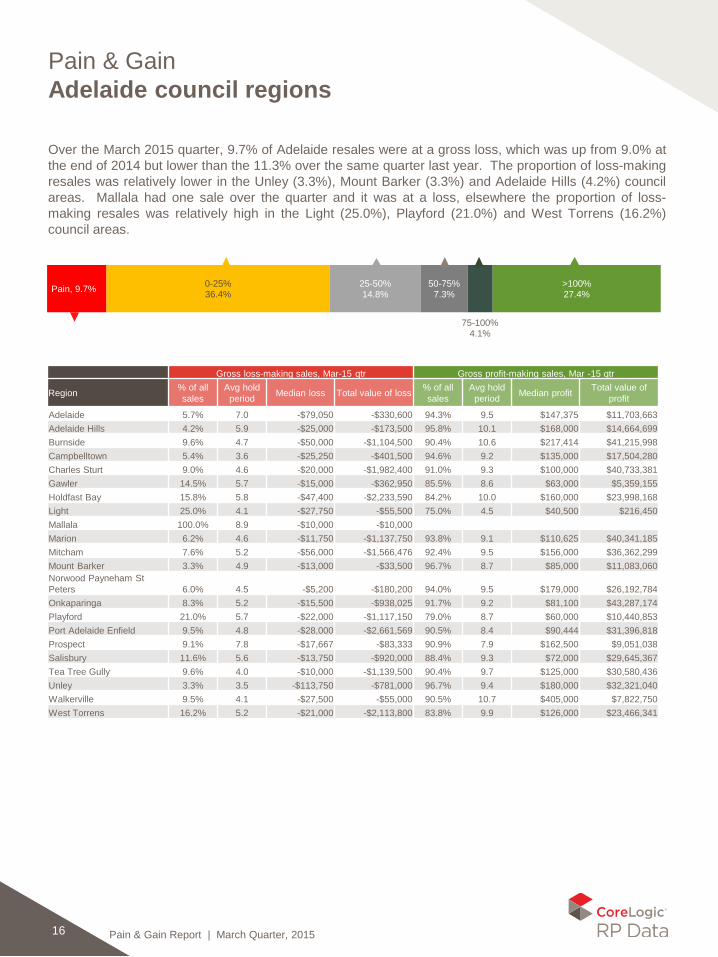
Pain, 9.7% 0-25% 36.4%
25-50% 14.8%
50-75% 7.3%
75-100% 4.1%
>100% 27.4%
Pain & Gain Adelaide council regions
Over the March 2015 quarter, 9.7% of Adelaide resales were at a gross loss, which was up from 9.0% at the end of 2014 but lower than the 11.3% over the same quarter last year. The proportion of loss-making resales was relatively lower in the Unley (3.3%), Mount Barker (3.3%) and Adelaide Hills (4.2%) council areas. Mallala had one sale over the quarter and it was at a loss, elsewhere the proportion of loss-making resales was relatively high in the Light (25.0%), Playford (21.0%) and West Torrens (16.2%) council areas.
16
Gross loss-making sales, Mar-15 qtr Gross profit-making sales, Mar -15 qtr
Region % of all sales
Avg hold period Median loss Total value of loss % of all
sales Avg hold
period Median profit Total value of profit
Adelaide 5.7% 7.0 -$79,050 -$330,600 94.3% 9.5 $147,375 $11,703,663 Adelaide Hills 4.2% 5.9 -$25,000 -$173,500 95.8% 10.1 $168,000 $14,664,699 Burnside 9.6% 4.7 -$50,000 -$1,104,500 90.4% 10.6 $217,414 $41,215,998 Campbelltown 5.4% 3.6 -$25,250 -$401,500 94.6% 9.2 $135,000 $17,504,280 Charles Sturt 9.0% 4.6 -$20,000 -$1,982,400 91.0% 9.3 $100,000 $40,733,381 Gawler 14.5% 5.7 -$15,000 -$362,950 85.5% 8.6 $63,000 $5,359,155 Holdfast Bay 15.8% 5.8 -$47,400 -$2,233,590 84.2% 10.0 $160,000 $23,998,168 Light 25.0% 4.1 -$27,750 -$55,500 75.0% 4.5 $40,500 $216,450 Mallala 100.0% 8.9 -$10,000 -$10,000 Marion 6.2% 4.6 -$11,750 -$1,137,750 93.8% 9.1 $110,625 $40,341,185 Mitcham 7.6% 5.2 -$56,000 -$1,566,476 92.4% 9.5 $156,000 $36,362,299 Mount Barker 3.3% 4.9 -$13,000 -$33,500 96.7% 8.7 $85,000 $11,083,060 Norwood Payneham St Peters 6.0% 4.5 -$5,200 -$180,200 94.0% 9.5 $179,000 $26,192,784 Onkaparinga 8.3% 5.2 -$15,500 -$938,025 91.7% 9.2 $81,100 $43,287,174 Playford 21.0% 5.7 -$22,000 -$1,117,150 79.0% 8.7 $60,000 $10,440,853 Port Adelaide Enfield 9.5% 4.8 -$28,000 -$2,661,569 90.5% 8.4 $90,444 $31,396,818 Prospect 9.1% 7.8 -$17,667 -$83,333 90.9% 7.9 $162,500 $9,051,038 Salisbury 11.6% 5.6 -$13,750 -$920,000 88.4% 9.3 $72,000 $29,645,367 Tea Tree Gully 9.6% 4.0 -$10,000 -$1,139,500 90.4% 9.7 $125,000 $30,580,436 Unley 3.3% 3.5 -$113,750 -$781,000 96.7% 9.4 $180,000 $32,321,040 Walkerville 9.5% 4.1 -$27,500 -$55,000 90.5% 10.7 $405,000 $7,822,750 West Torrens 16.2% 5.2 -$21,000 -$2,113,800 83.8% 9.9 $126,000 $23,466,341

Pain & Gain Report | March Quarter, 2015
Loss 6.7%
0-25% 34.3%
25-50% 9.8%
50-75% 7.3%
75-100% 4.7%
>100% 40.2%
Pain & Gain Perth council regions
6.7% of resold homes across Perth in the March 2015 quarter were sold for less than the previous purchased price compared to 5.5% the previous quarter and 4.4% a year earlier. The 6.7% of resales at a loss is the highest for the city since February 2013. The East Fremantle and Peppermint Grove council areas recorded no resales at a loss over the quarter while Belmont (1.7%) and Gosnells recorded less than 2% at a loss. The highest proportion of loss-making resales occurred in the Perth (23.8%), Cottesloe (22.2%) and Mandurah (18.6%) council areas.
17
Gross loss-making sales, Mar-15 qtr Gross profit-making sales, Mar -15 qtr
Region % of all sales
Avg hold period Median loss Total value of loss % of all
sales Avg hold
period Median profit Total value of profit
Armadale 6.8% 5.8 -$20,000 -$1,198,000 93.2% 8.6 $203,000 $51,016,035 Bassendean 2.4% 3.4 -$40,000 -$40,000 97.6% 8.6 $150,000 $8,388,350 Bayswater 2.5% 4.6 -$10,000 -$121,000 97.5% 8.8 $150,000 $50,891,188 Belmont 1.7% 3.1 -$21,000 -$42,000 98.3% 9.3 $149,750 $27,067,612 Cambridge 3.8% 6.9 -$175,000 -$750,000 96.3% 9.8 $210,000 $30,869,450 Canning 2.9% 3.1 -$100,000 -$817,600 97.1% 9.2 $238,000 $80,227,170 Claremont 15.8% 6.4 -$135,000 -$540,000 84.2% 12.4 $377,500 $7,120,500 Cockburn 3.6% 5.1 -$47,500 -$1,110,000 96.4% 8.7 $232,000 $82,283,539 Cottesloe 22.2% 7.8 -$168,750 -$587,500 77.8% 9.5 $374,250 $5,677,000 East Fremantle 100.0% 9.8 $413,000 $13,288,000 Fremantle 8.0% 5.2 -$40,000 -$521,000 92.0% 8.9 $170,000 $21,737,298 Gosnells 1.9% 3.7 -$36,850 -$224,700 98.1% 8.8 $150,000 $59,043,624 Joondalup 5.3% 4.0 -$20,000 -$1,880,010 94.7% 10.4 $230,000 $143,438,466 Kalamunda 1.0% 5.3 -$30,000 -$60,000 99.0% 8.9 $212,500 $48,739,004 Kwinana 7.5% 6.0 -$9,750 -$187,000 92.5% 7.2 $139,500 $23,740,100 Mandurah 18.6% 6.8 -$50,000 -$8,966,580 81.4% 9.6 $162,000 $78,277,360 Melville 4.7% 4.3 -$47,500 -$1,480,500 95.3% 10.3 $289,500 $94,741,253 Mosman Park 6.3% 6.5 -$31,750 -$63,500 93.8% 8.3 $157,500 $8,335,500 Mundaring 13.2% 6.7 -$130,500 -$2,016,000 86.8% 10.2 $205,000 $18,451,300 Murray 15.1% 6.1 -$32,500 -$590,000 84.9% 9.5 $230,000 $11,241,000 Nedlands 8.8% 4.9 -$30,000 -$82,000 91.2% 12.0 $575,000 $19,363,500 Peppermint Grove 100.0% 5.9 $30,000 $30,000 Perth 23.8% 5.1 -$20,000 -$1,516,212 76.2% 7.5 $77,000 $16,143,825 Rockingham 7.8% 5.8 -$26,000 -$2,199,000 92.2% 7.6 $137,000 $92,556,946 Serpentine-Jarrahdale 3.4% 6.3 -$9,950 -$19,900 96.6% 6.2 $268,500 $14,017,000 South Perth 10.4% 5.1 -$70,000 -$2,237,500 89.6% 9.9 $222,000 $42,531,333 Stirling 6.0% 3.8 -$26,000 -$3,261,963 94.0% 9.4 $170,000 $197,943,972 Subiaco 11.3% 5.6 -$43,500 -$439,000 88.7% 8.7 $127,000 $18,092,930 Swan 5.1% 5.5 -$32,250 -$1,298,500 94.9% 8.5 $216,000 $83,977,655 Victoria Park 10.7% 4.5 -$111,000 -$1,829,300 89.3% 9.4 $180,000 $23,963,500 Vincent 4.3% 8.1 -$80,000 -$296,500 95.7% 8.8 $170,000 $19,380,500 Wanneroo 3.0% 5.6 -$15,000 -$844,400 97.0% 7.7 $199,250 $131,401,448
Pain & Gain Report | March Quarter, 2015
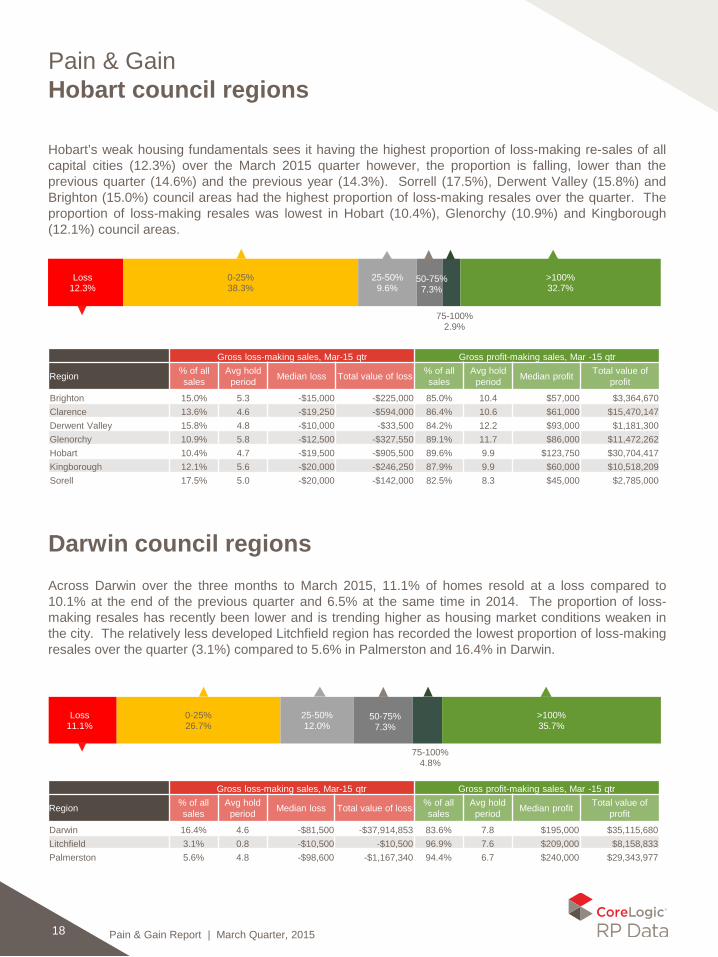
Loss 11.1%
0-25% 26.7%
25-50% 12.0%
50-75% 7.3%
75-100% 4.8%
>100% 35.7%
Loss 12.3%
0-25% 38.3%
25-50% 9.6%
50-75% 7.3%
75-100% 2.9%
>100% 32.7%
Pain & Gain Hobart council regions
Hobart’s weak housing fundamentals sees it having the highest proportion of loss-making re-sales of all capital cities (12.3%) over the March 2015 quarter however, the proportion is falling, lower than the previous quarter (14.6%) and the previous year (14.3%). Sorrell (17.5%), Derwent Valley (15.8%) and Brighton (15.0%) council areas had the highest proportion of loss-making resales over the quarter. The proportion of loss-making resales was lowest in Hobart (10.4%), Glenorchy (10.9%) and Kingborough (12.1%) council areas.
18
Darwin council regions Across Darwin over the three months to March 2015, 11.1% of homes resold at a loss compared to 10.1% at the end of the previous quarter and 6.5% at the same time in 2014. The proportion of loss-making resales has recently been lower and is trending higher as housing market conditions weaken in the city. The relatively less developed Litchfield region has recorded the lowest proportion of loss-making resales over the quarter (3.1%) compared to 5.6% in Palmerston and 16.4% in Darwin.
Gross loss-making sales, Mar-15 qtr Gross profit-making sales, Mar -15 qtr
Region % of all sales
Avg hold period Median loss Total value of loss % of all
sales Avg hold
period Median profit Total value of profit
Brighton 15.0% 5.3 -$15,000 -$225,000 85.0% 10.4 $57,000 $3,364,670 Clarence 13.6% 4.6 -$19,250 -$594,000 86.4% 10.6 $61,000 $15,470,147 Derwent Valley 15.8% 4.8 -$10,000 -$33,500 84.2% 12.2 $93,000 $1,181,300 Glenorchy 10.9% 5.8 -$12,500 -$327,550 89.1% 11.7 $86,000 $11,472,262 Hobart 10.4% 4.7 -$19,500 -$905,500 89.6% 9.9 $123,750 $30,704,417 Kingborough 12.1% 5.6 -$20,000 -$246,250 87.9% 9.9 $60,000 $10,518,209 Sorell 17.5% 5.0 -$20,000 -$142,000 82.5% 8.3 $45,000 $2,785,000
Gross loss-making sales, Mar-15 qtr Gross profit-making sales, Mar -15 qtr
Region % of all sales
Avg hold period Median loss Total value of loss % of all
sales Avg hold
period Median profit Total value of profit
Darwin 16.4% 4.6 -$81,500 -$37,914,853 83.6% 7.8 $195,000 $35,115,680 Litchfield 3.1% 0.8 -$10,500 -$10,500 96.9% 7.6 $209,000 $8,158,833 Palmerston 5.6% 4.8 -$98,600 -$1,167,340 94.4% 6.7 $240,000 $29,343,977

Pain & Gain Report | March Quarter, 2015
Loss 10.6%
0-25% 33.3%
25-50% 16.3%
50-75% 7.3%
75-100% 4.5%
>100% 28.3%
Pain & Gain Canberra council regions
19
Over the three months to March 2015, 10.6% of Canberra homes re-sold at a loss compared to 11.8% over the previous quarter and 8.6% a year earlier.
Gross loss-making sales, Mar-15 qtr Gross profit-making sales, Mar -15 qtr
Region % of all sales
Avg hold period Median loss Total value of loss % of all
sales Avg hold
period Median profit Total value of profit
Unincorporated ACT 10.6% 4.3 -$24,200 -$3,975,697 89.4% 10.1 $152,250 $177,944,772

Pain & Gain Report | March Quarter, 2015
About CoreLogic RP Data CoreLogic RP Data is a wholly owned subsidiary of CoreLogic (NYSE: CLGX),which is the largest data and analytics company in the world with revenues of $1.3Bn USD from 50,000 business and government customers and over 1 million end users. CoreLogic RP Data provides property information, analytics and services across Australia and New Zealand and is currently developing and growing partnerships throughout Asia. With Australia’s most comprehensive property databases, the company’s combined data offering is derived from public, contributory and proprietary sources and includes over 500 million decision points spanning over three decades of collection, providing detailed coverage of property and other encumbrances such as tenancy, location, hazard risk and related performance information. With over 11,000 customers and 120,000 end users, CoreLogic RP Data is the leading provider of property data, analytics and related services to consumers, investors, real estate, mortgage, finance, banking, insurance, developers, wealth management and government. CoreLogic RP Data delivers value to clients through unique data, analytics, workflow technology, advisory and geo spatial services. Clients rely on CoreLogic RP Data to help identify and manage growth opportunities, improve performance and mitigate risk. CoreLogic RP Data employs over 480 people at nine locations across Australia and in New Zealand. For more information call 1300 734 318 or visit www.corelogic.com.au
Granular Data and Analytics Driving Growth in your Business CoreLogic RP Data produces an advanced suite of housing market analytics that provides key insights for understanding housing market conditions at a granular geographic level. Granular data is often used for portfolio analysis and benchmarking, risk assessments and understanding development feasibility and market sizing. It gives industry professionals valuable modules which provide essential analytics and insights for decision making and strategy formation within the residential property asset class. We can tailor reports to suit your business requirements. Call us on 1300 734 318 or email us at [email protected] or visit us at www.corelogic.com.au
Market Scorecard: Monitor and measure performance of an individual office or a Franchise brand month on month through a detailed view of the Real Estate Listing and Sales market share across Australia. With the ability to gather market share statistics within your active market this product is designed to identify the competing brands and independents at a suburb, postcode, user defined territory and State level. Easily locate growth opportunities and market hotspots allowing you to view the performance of the established offices in these new areas of interest.
Market Trends: Detailed housing market indicators down to the suburb level, with data in time series or snapshot delivered monthly. CoreLogic RP Data’s Market Trends data is segmented across houses and units. The Market Trends data includes key housing market metrics such as median prices, median values, transaction volumes, rental statistics, vendor metrics such as average selling time and vendor discounting rates.
CoreLogic RP Data Indices: The suite of CoreLogic RP Data Indices range from simple market measurements such as median prices through to repeat sales indices and our flagship hedonic home value indices. The CoreLogic RP Data Hedonic index has been specifically designed to track the value of a portfolio of properties over time and is relied upon by Australian regulators and industry as the most up to date and accurate measurement of housing market performance.
Economist Pack: A suite of indices and indicators designed specifically for Australian economic commentators who require the most up to date and detailed view of housing market conditions. The economist pack includes the CoreLogic RP Data Hedonic indices for capital cities and ‘rest of state’ indices, the stratified hedonic index, hedonic total return index, auction clearance rates and median prices.
Investor Concentration Report: Understanding ownership concentrations is an important part of assessing risk. Areas with high investor concentrations are typically allocated higher risk ratings due to the over-representation of a particular segment of the market. Through a series of rules and logic, CoreLogic RP Data has flagged the likely ownership type of every residential property nationally as either owner occupied, investor owned or government owned.
Mortgage Market Trend Report: CoreLogic RP Data is in a unique position to monitor mortgage related housing market activity. Transaction volumes, dwelling values and mortgage related valuation events all comprise our Mortgage market trend report which provides an invaluable tool for mortgage industry benchmarking and strategy.
20
Pain & Gain Report | March Quarter, 2015
Disclaimers In compiling this publication, RP Data Pty Ltd trading as CoreLogic has relied upon information supplied by a number of external sources. CoreLogic does not warrant its accuracy or completeness and to the full extent allowed by law excludes liability in contract, tort or otherwise, for any loss or damage sustained by subscribers, or by any other person or body corporate arising from or in connection with the supply or use of the whole or any part of the information in this publication through any cause whatsoever and limits any liability it may have to the amount paid to CoreLogic for the supply of such information. Queensland Data Based on or contains data provided by the State of Queensland (Department of Natural Resources and Mines) 2015. In consideration of the State permitting use of this data you acknowledge and agree that the State gives no warranty in relation to the data (including accuracy, reliability, completeness, currency or suitability) and accepts no liability (including without limitation, liability in negligence) for any loss, damage or costs (including consequential damage) relating to any use of the data. Data must not be used for direct marketing or be used in breach of the privacy laws. South Australian Data This information is based on data supplied by the South Australian Government and is published by permission. The South Australian Government does not accept any responsibility for the accuracy or completeness of the published information or suitability for any purpose of the published information or the underlying data. New South Wales Data Contains property sales information provided under licence from the Land and Property Information (“LPI”). RP Data is authorised as a Property Sales Information provider by the LPI. Victorian Data The State of Victoria owns the copyright in the Property Sales Data which constitutes the basis of this report and reproduction of that data in any way without the consent of the State of Victoria will constitute a breach of the Copyright Act 1968 (Cth). The State of Victoria does not warrant the accuracy or completeness of the information contained in this report and any person using or relying upon such information does so on the basis that the State of Victoria accepts no responsibility or liability whatsoever for any errors, faults, defects or omissions in the information supplied. Western Australian Data Based on information provided by and with the permission of the Western Australian Land Information Authority (2014) trading as Landgate. Australian Capital Territory Data The Territory Data is the property of the Australian Capital Territory. No part of it may in any form or by any means (electronic, mechanical, microcopying, photocopying, recording or otherwise) be reproduced, stored in a retrieval system or transmitted without prior written permission. Enquiries should be directed to: Director, Customer Services ACT Planning and Land Authority GPO Box 1908 Canberra ACT 2601. Tasmanian Data This product incorporates data that is copyright owned by the Crown in Right of Tasmania. The data has been used in the product with the permission of the Crown in Right of Tasmania. The Crown in Right of Tasmania and its employees and agents: a) give no warranty regarding the data’s accuracy, completeness, currency or suitability for any particular purpose; and b) do not accept liability howsoever arising, including but not limited to negligence for any loss resulting from the use of or reliance upon the data.
Base data from the LIST © State of Tasmania http://www.thelist.tas.gov.au
21