Embed Size (px)
Citation preview
winter 2014
development proposal for
GAS WORKS FLATS1900 N Northlake Way
ACKNOWLEDGMENTSMaria Barrientos, Barrientos LLC
Jon Schack, Schack A+D
Dugan Earl, Revolve Development
TJ Lehman, Mack Urban
Matt Orr, Apartment Financial
Joe Ferguson, Lake Union Partners
Heidi Turner, Blanton Turner
Anne Marie Koehler, CBRE
Mark Speidel, I.L. Gross Structural Engineers
Brian Gibson, MRJ Constructors
Gary Beem, Northwest Commercial Mortgage
Bryce Taylor, GLY Construction
Corey Marx, JLL
CJ Bowles, CBRE
Austin Besse, Weber Thompson
Jeff Peterson, CPL
Monica Wallace, Wallace Properties
A special thanks to:
Al Levine
Chris Bitter
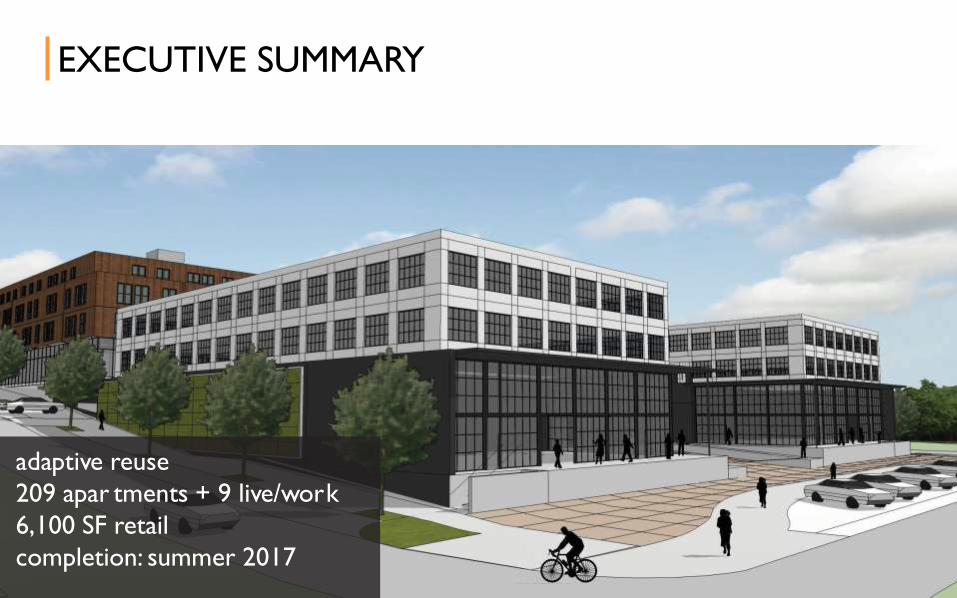
EXECUTIVE SUMMARY
adaptive reuse
209 apar tments + 9 live/work
6,100 SF retail
completion: summer 2017
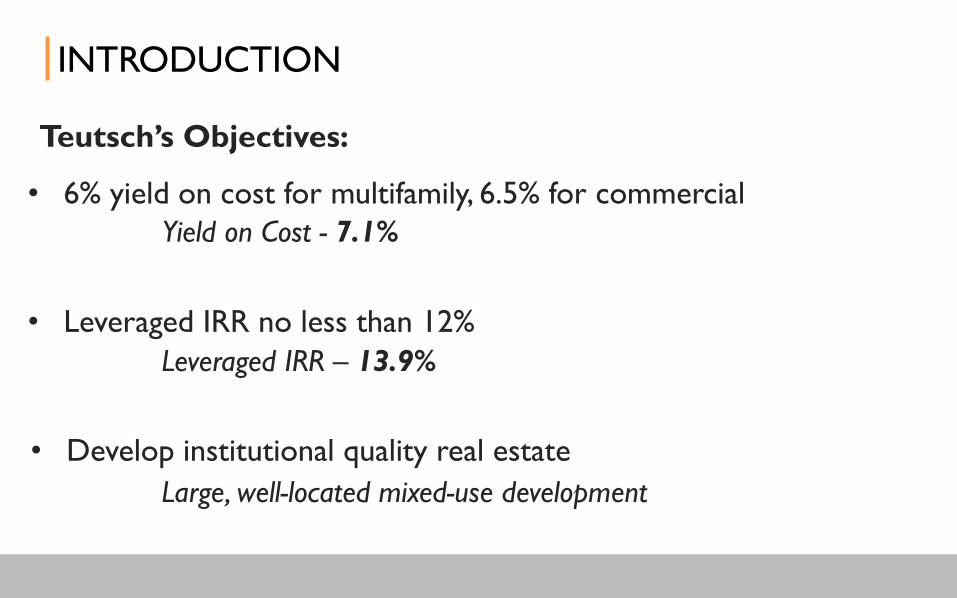
Yield on Cost - 7.1%
Large, well-located mixed-use development
Leveraged IRR – 13.9%
INTRODUCTION
• Leveraged IRR no less than 12%
• 6% yield on cost for multifamily, 6.5% for commercial
• Develop institutional quality real estate
Teutsch’s Objectives:
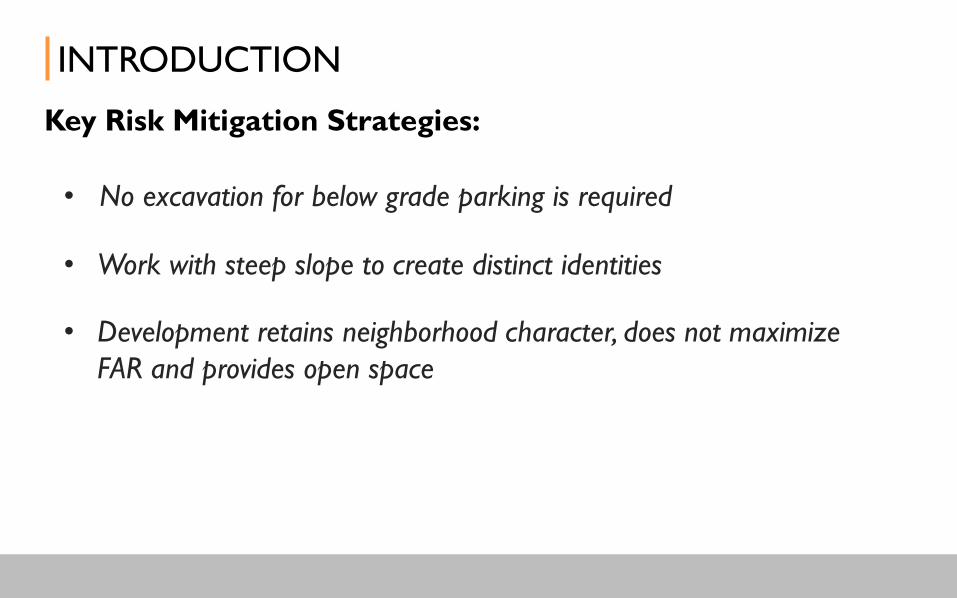
INTRODUCTION
Key Risk Mitigation Strategies:
• No excavation for below grade parking is required
• Development retains neighborhood character, does not maximize
FAR and provides open space
• Work with steep slope to create distinct identities
SITE CONTEXT
01
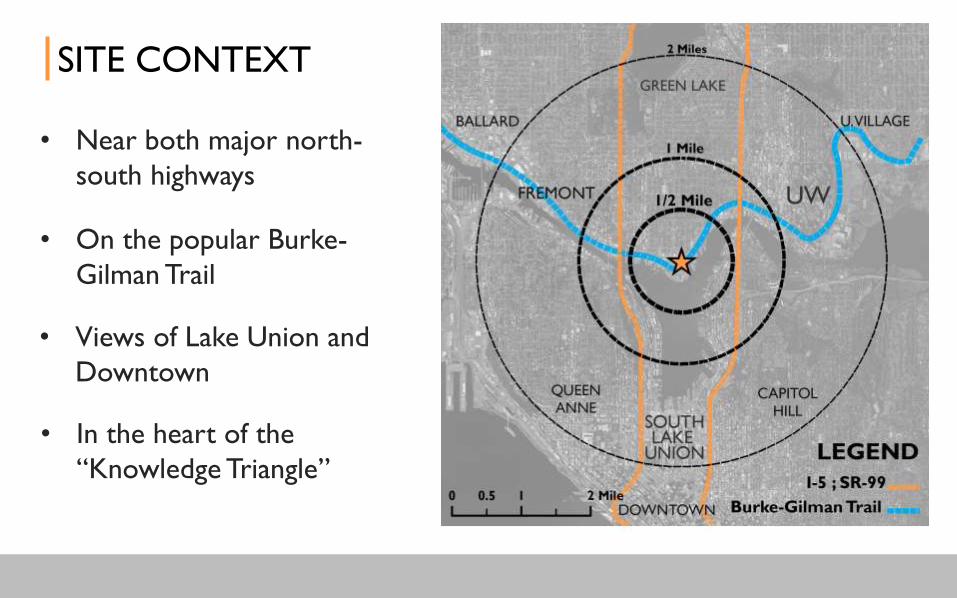
• In the heart of the
“Knowledge Triangle”
• Near both major north-
south highways
• On the popular Burke-
Gilman Trail
• Views of Lake Union and
Downtown
SITE CONTEXT
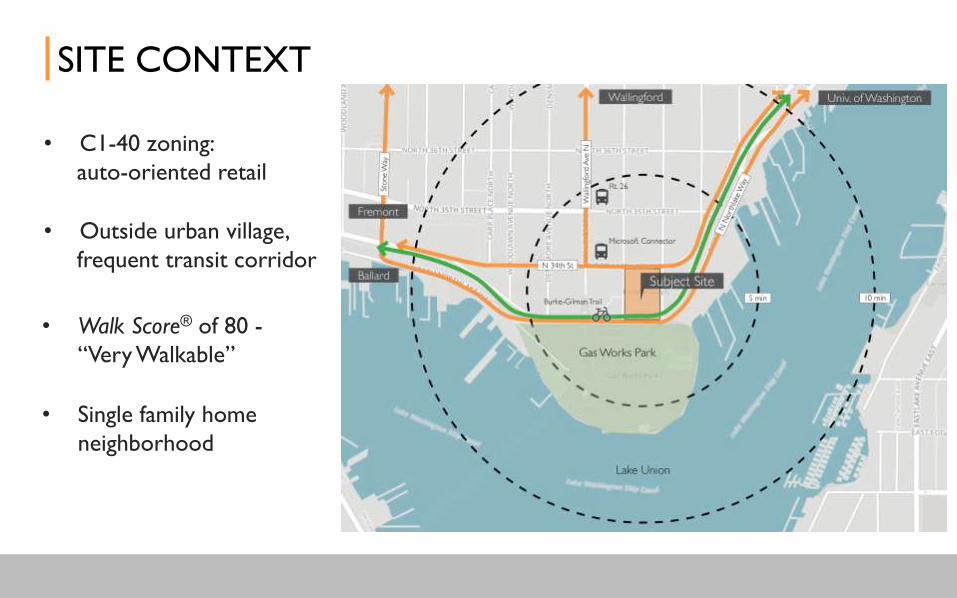
• C1-40 zoning:
auto-oriented retail
• Walk Score® of 80 -
“Very Walkable”
• Outside urban village,
frequent transit corridor
SITE CONTEXT
• Single family home
neighborhood
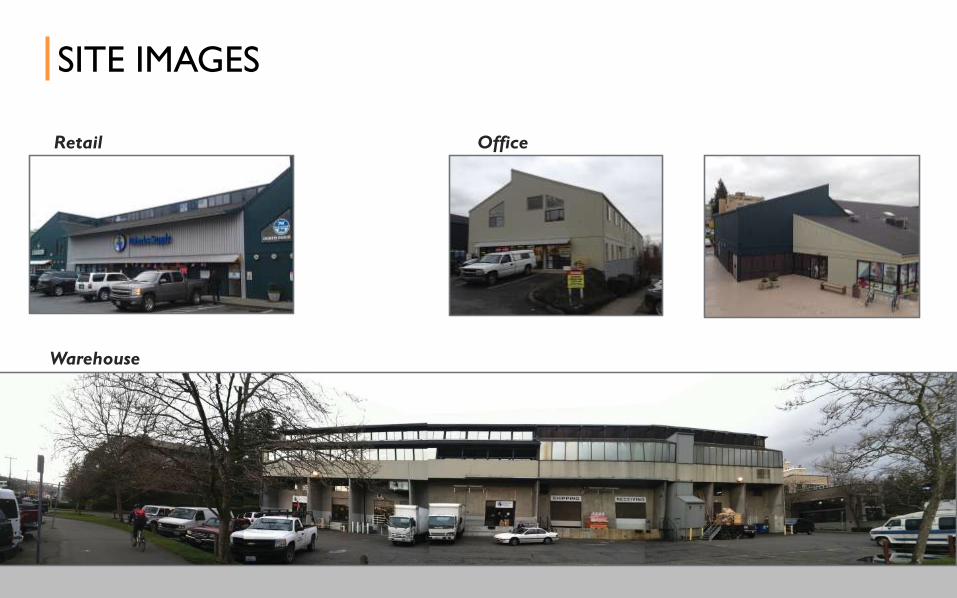
Retail Office
Warehouse
SITE IMAGES
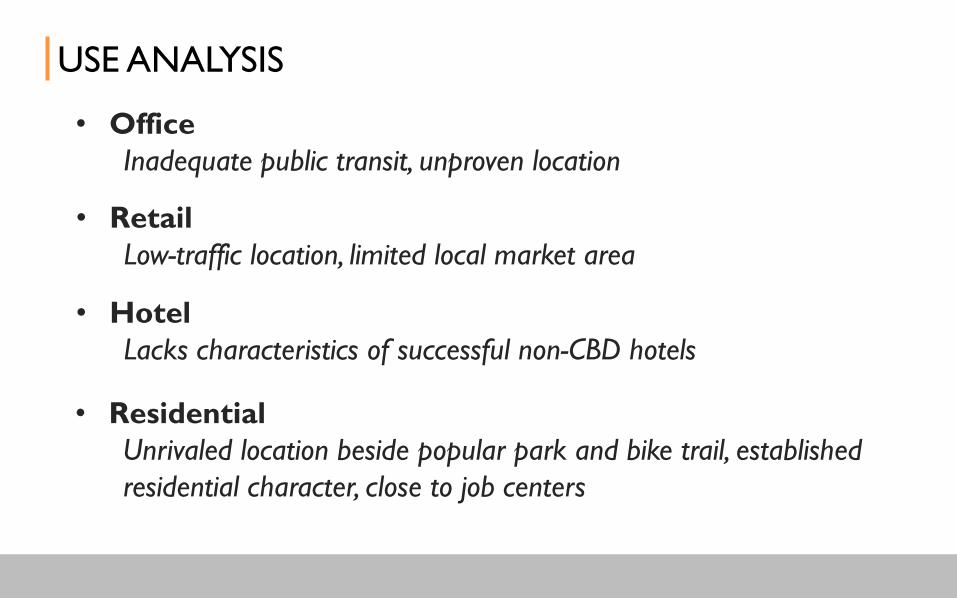
• Office
Inadequate public transit, unproven location
USE ANALYSIS
• Retail
Low-traffic location, limited local market area
• Hotel
Lacks characteristics of successful non-CBD hotels
• Residential
Unrivaled location beside popular park and bike trail, established
residential character, close to job centers
USE ANALYSIS
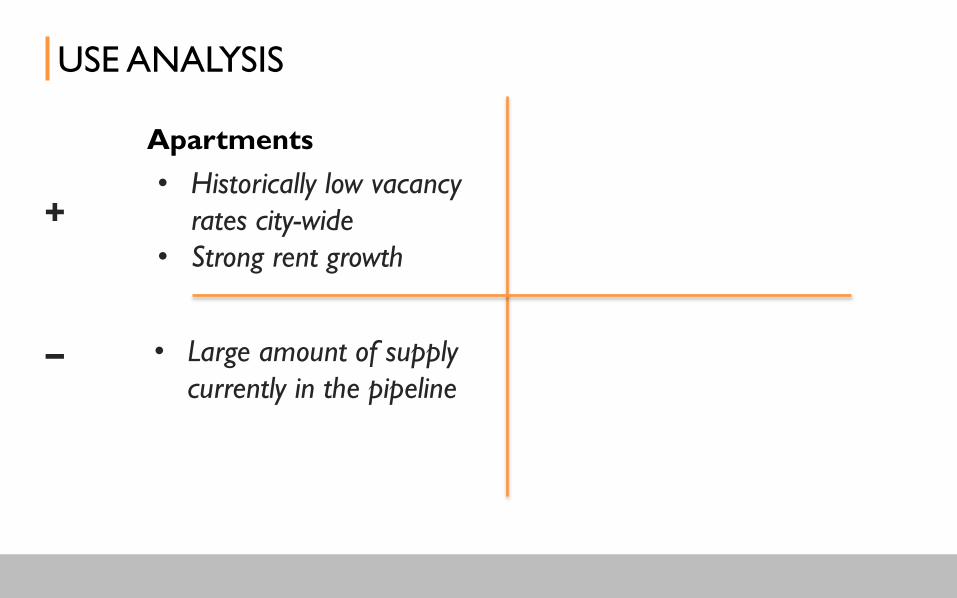
Apartments Condominiums
• Historically low vacancy
rates city-wide
• Strong rent growth
• Little supply
• Low interest rates
• Large amount of supply
currently in the pipeline
+
– • Increased development
complexity
• Interest rates may rise
• Does not mesh with seven-
year hold

MARKET ANALYSIS
02
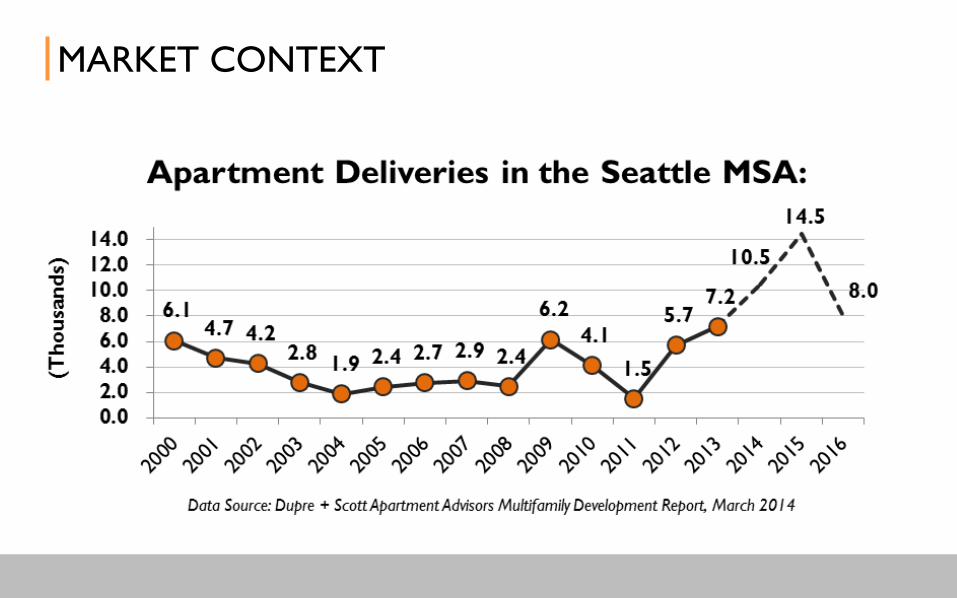
MARKET CONTEXT
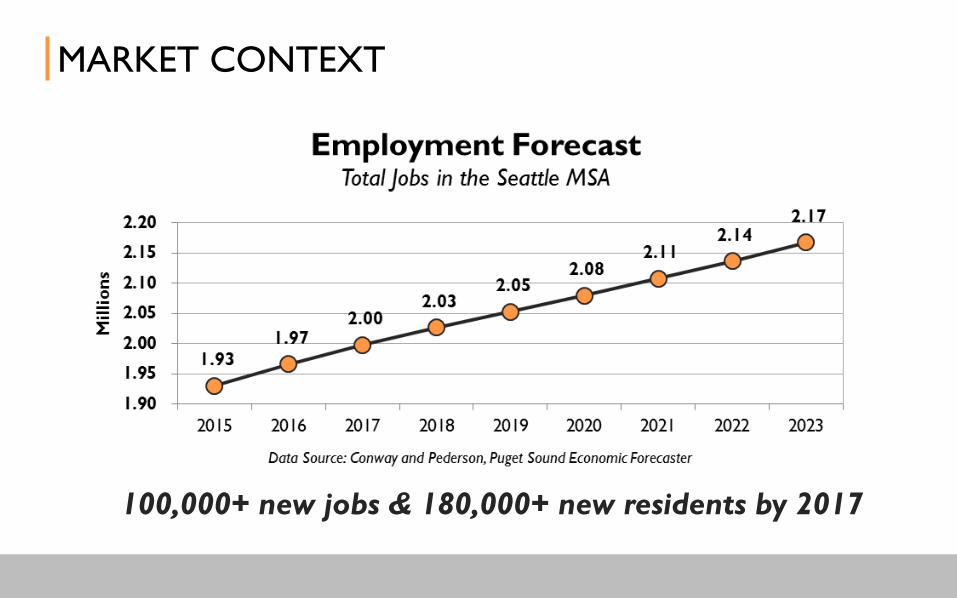
MARKET CONTEXT
100,000+ new jobs & 180,000+ new residents by 2017
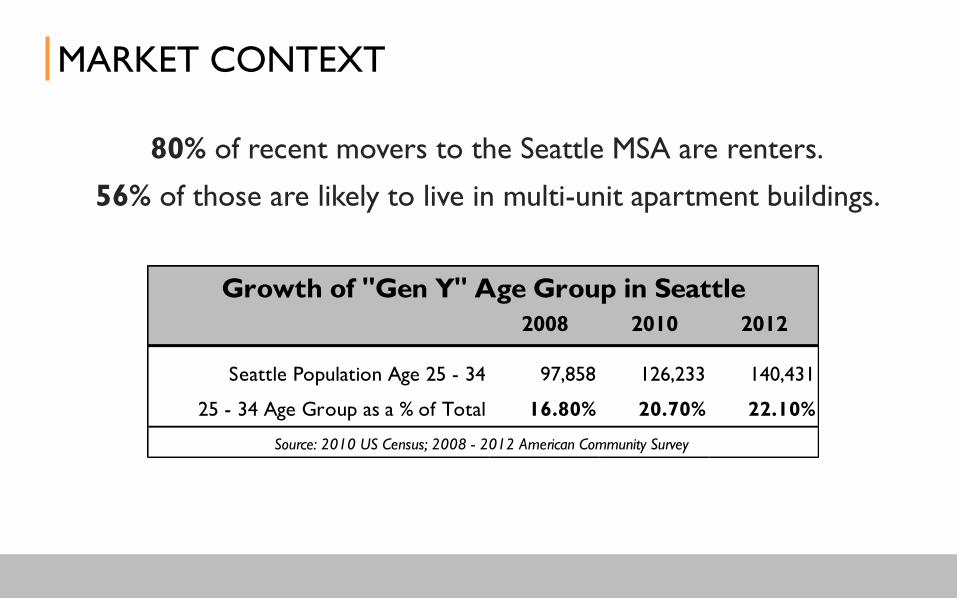
80% of recent movers to the Seattle MSA are renters.
56% of those are likely to live in multi-unit apartment buildings.
MARKET CONTEXT
2008 2010 2012
Seattle Population Age 25 - 34 97,858 126,233 140,431
25 - 34 Age Group as a % of Total 16.80% 20.70% 22.10%
Growth of "Gen Y" Age Group in Seattle
Source: 2010 US Census; 2008 - 2012 American Community Survey
MARKET CONTEXT
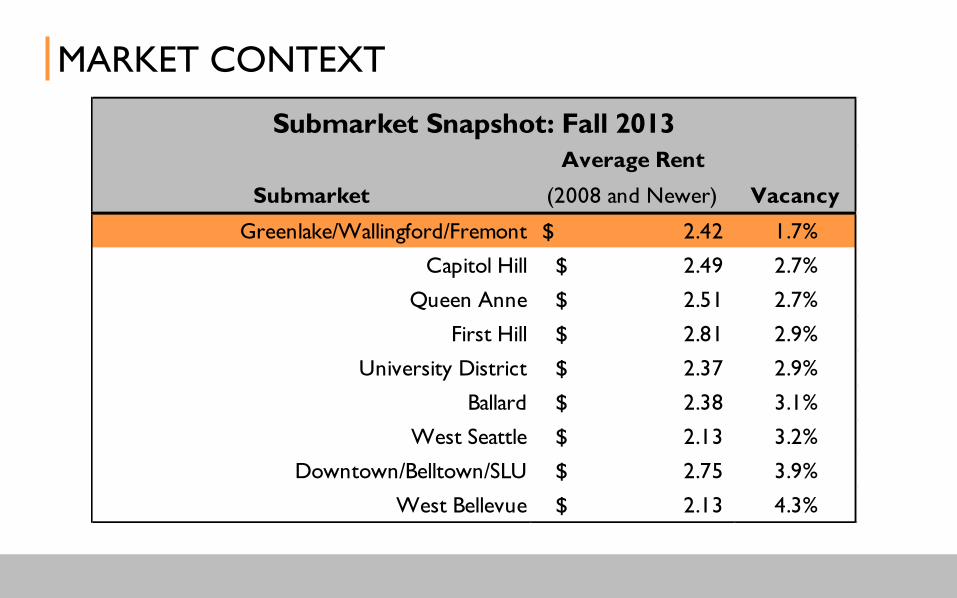
Submarket
Average Rent
(2008 and Newer) Vacancy
Greenlake/Wallingford/Fremont 2.42$ 1.7%
Capitol Hill 2.49$ 2.7%
Queen Anne 2.51$ 2.7%
First Hill 2.81$ 2.9%
University District 2.37$ 2.9%
Ballard 2.38$ 3.1%
West Seattle 2.13$ 3.2%
Downtown/Belltown/SLU 2.75$ 3.9%
West Bellevue 2.13$ 4.3%
Submarket Snapshot: Fall 2013
MARKET CONTEXT
MARKET CONTEXT
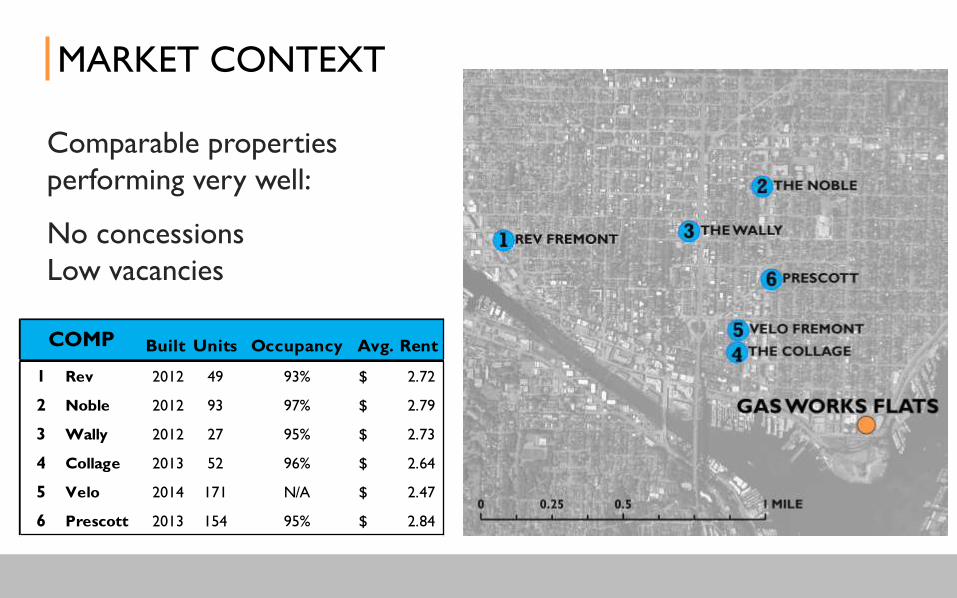
Built Units Occupancy Avg. Rent
1 Rev 2012 49 93% 2.72$
2 Noble 2012 93 97% 2.79$
3 Wally 2012 27 95% 2.73$
4 Collage 2013 52 96% 2.64$
5 Velo 2014 171 N/A 2.47$
6 Prescott 2013 154 95% 2.84$
COMP
Comparable properties
performing very well:
No concessions
Low vacancies
MARKET CONTEXT
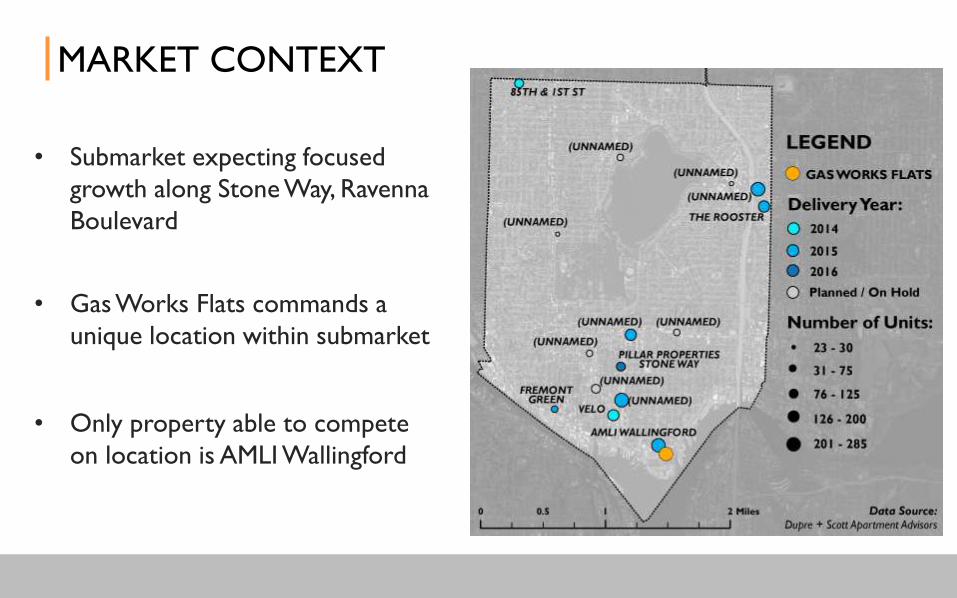
• Gas Works Flats commands a
unique location within submarket
• Only property able to compete
on location is AMLI Wallingford
• Submarket expecting focused
growth along Stone Way, Ravenna
Boulevard
WHAT WE’RE PROPOSING
03
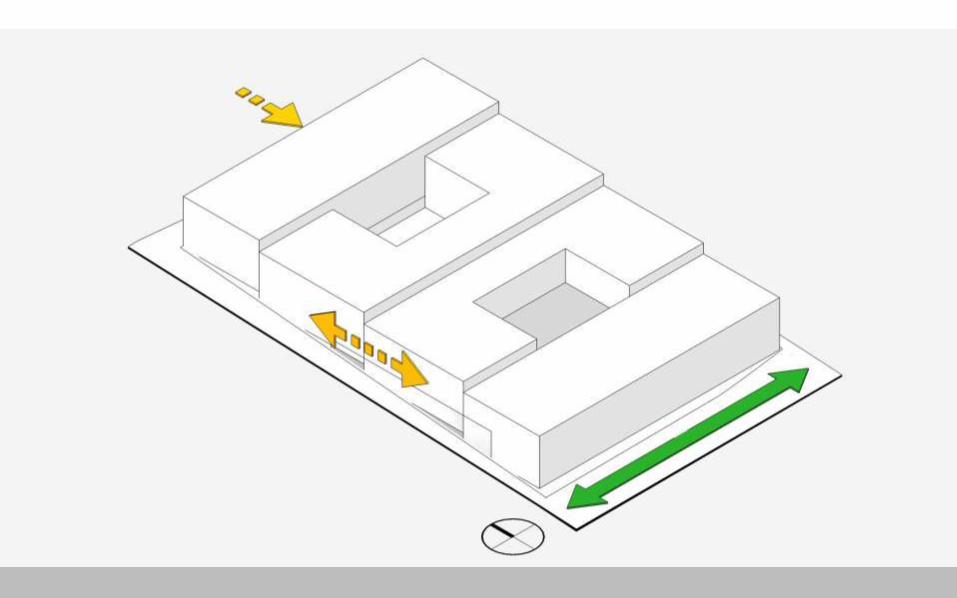
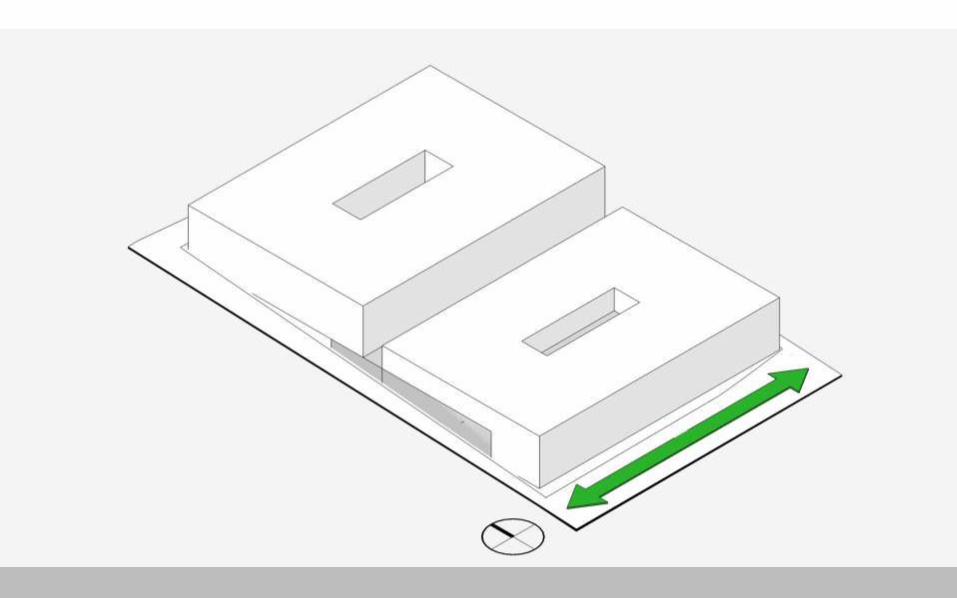
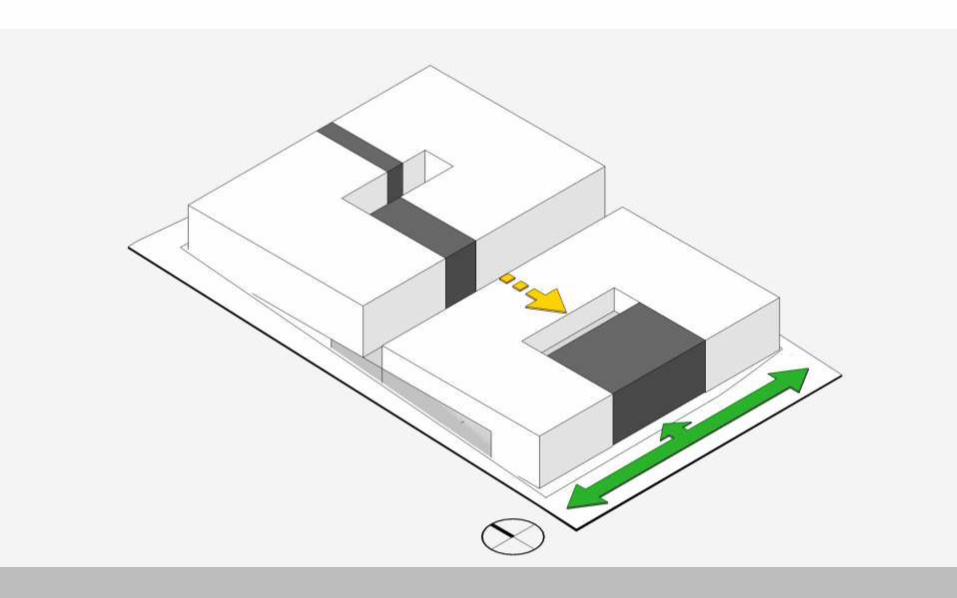
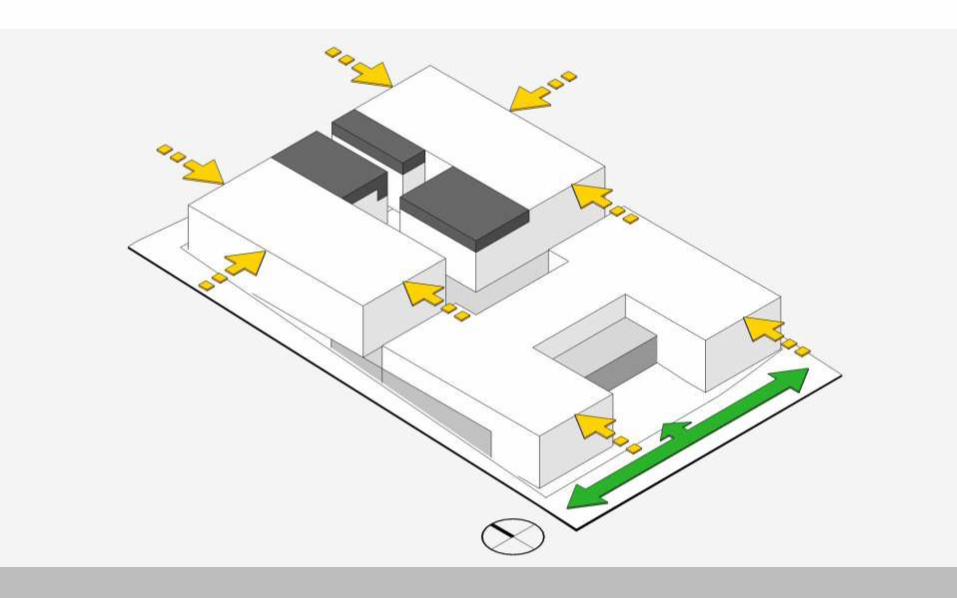
DESIGN GOALS
• Embrace the site and its surroundings
• Match product to market demands
• Differentiate by design
• Utilized embodied energy of existing structures
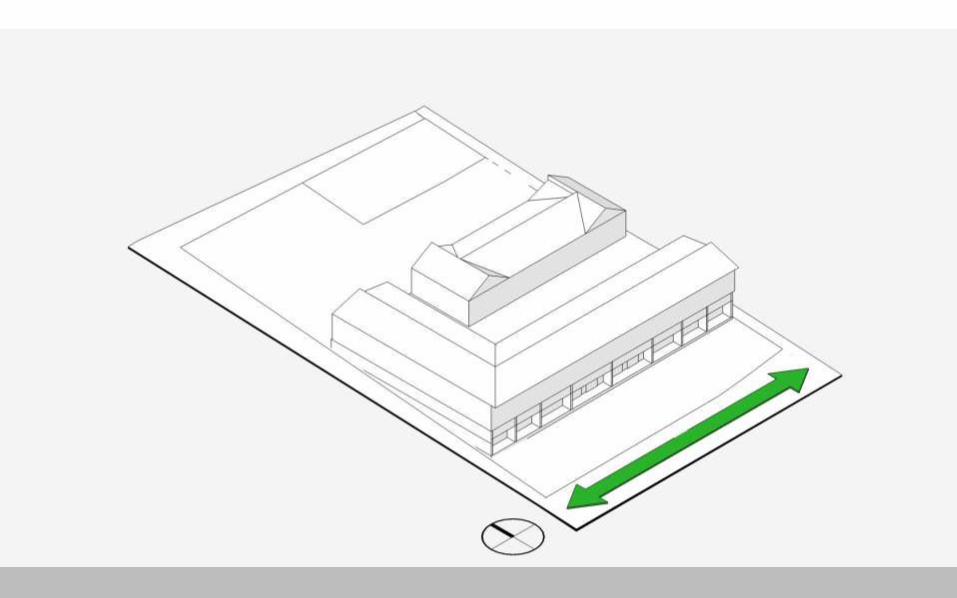
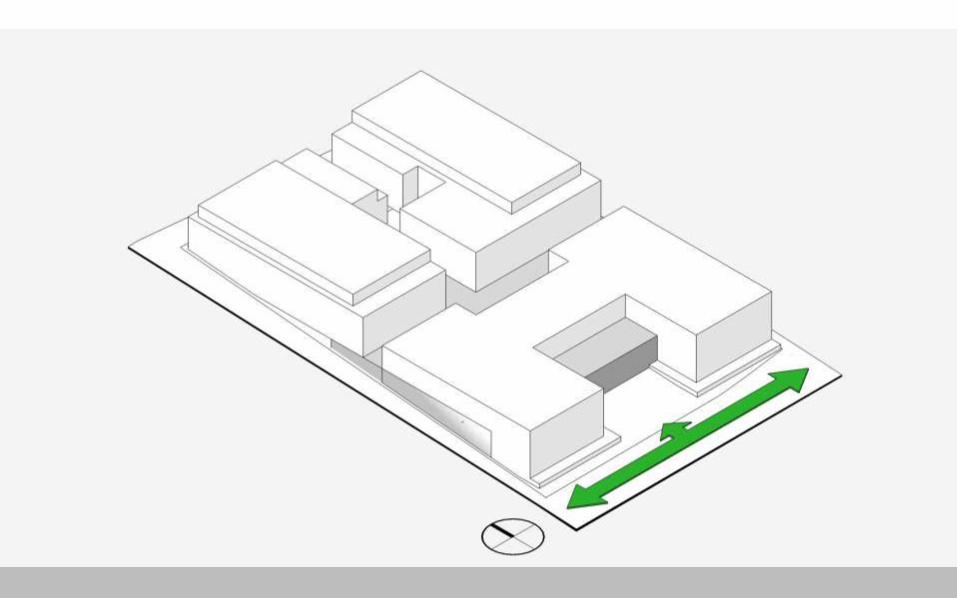
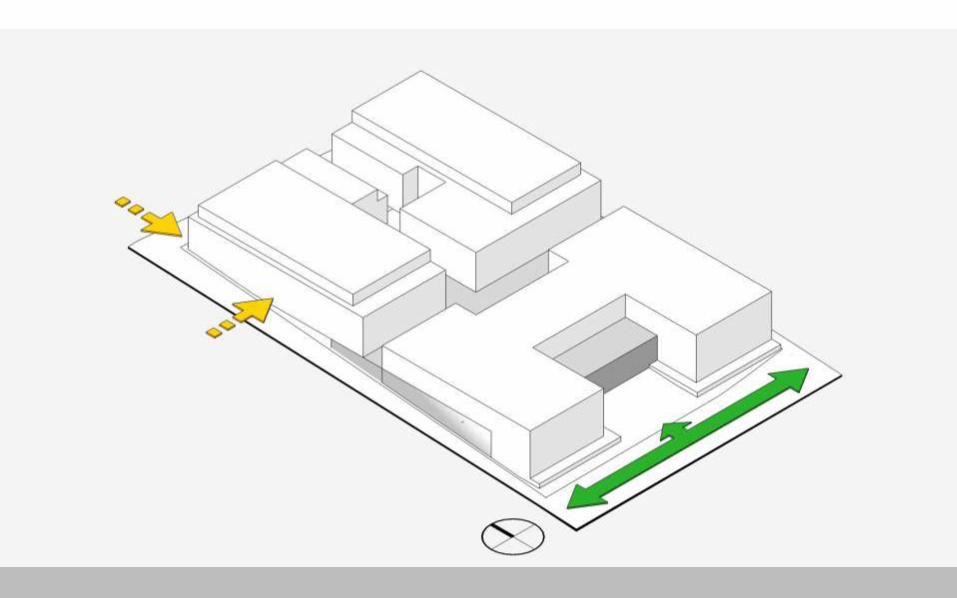
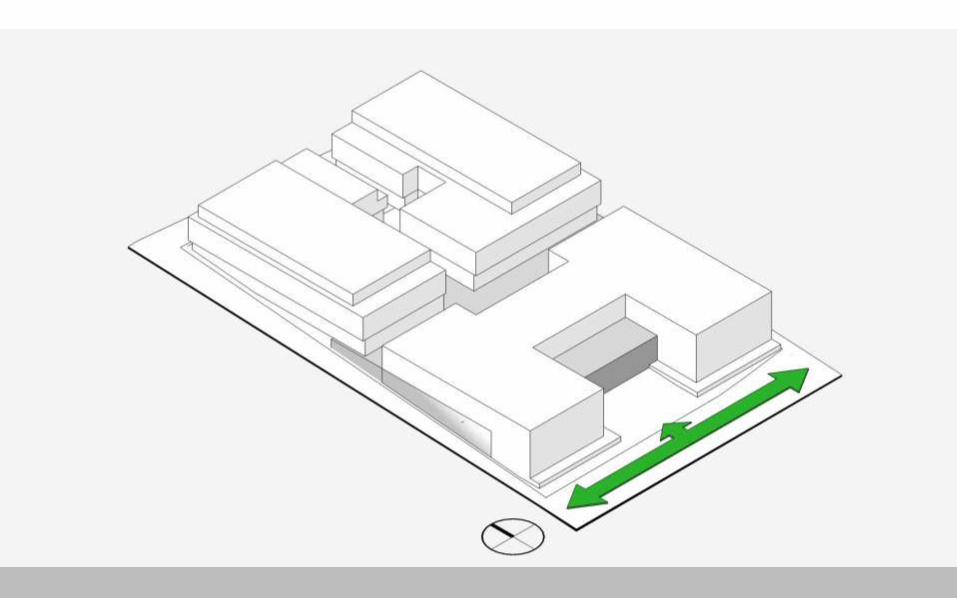
DESIGN PROCESS
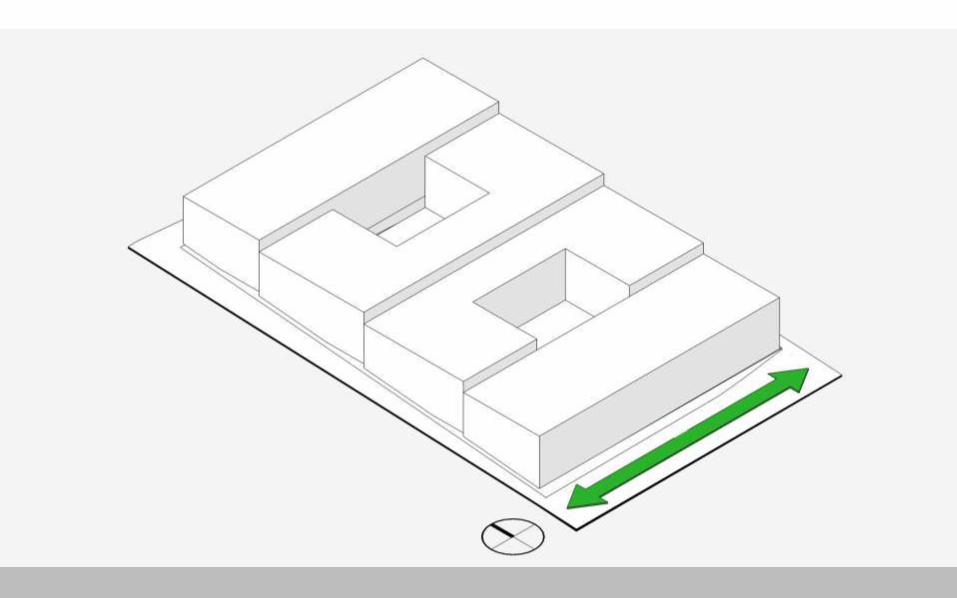
DESIGN PROCESS

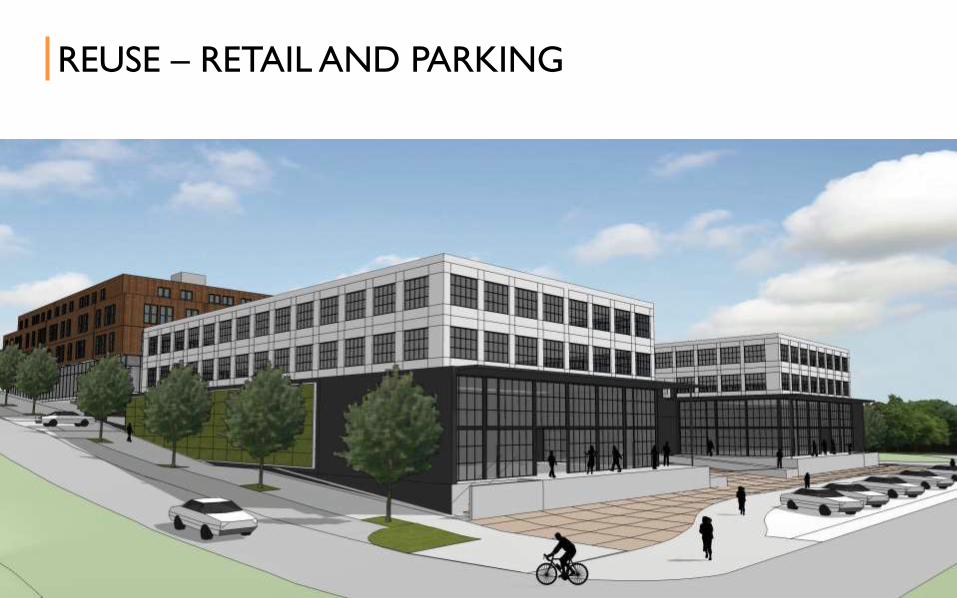
REUSE – RETAIL AND PARKING
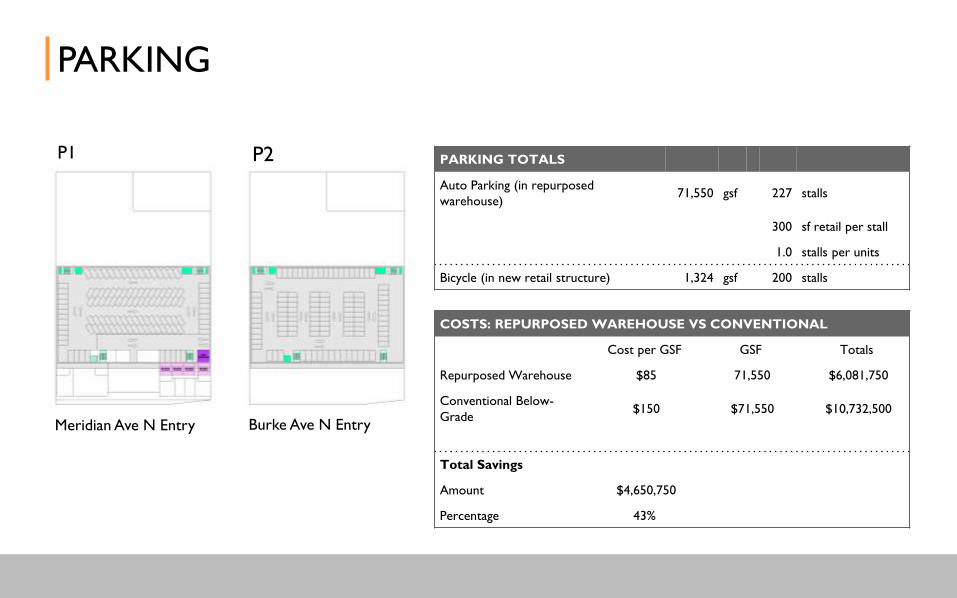
PARKING
PARKING TOTALS
Auto Parking (in repurposed
warehouse)71,550 gsf 227 stalls
300 sf retail per stall
1.0 stalls per units
Bicycle (in new retail structure) 1,324 gsf 200 stalls
COSTS: REPURPOSED WAREHOUSE VS CONVENTIONAL
Cost per GSF GSF Totals
Repurposed Warehouse $85 71,550 $6,081,750
Conventional Below-
Grade$150 $71,550 $10,732,500
Total Savings
Amount $4,650,750
Percentage 43%
P1 P2
Meridian Ave N Entry Burke Ave N Entry
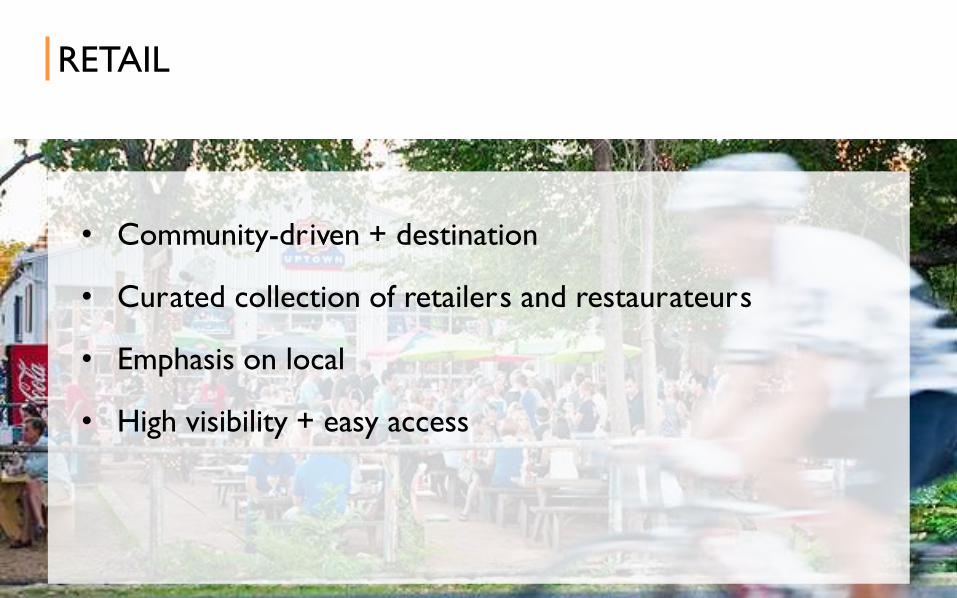
RETAIL
• Community-driven + destination
• Curated collection of retailers and restaurateurs
• Emphasis on local
• High visibility + easy access
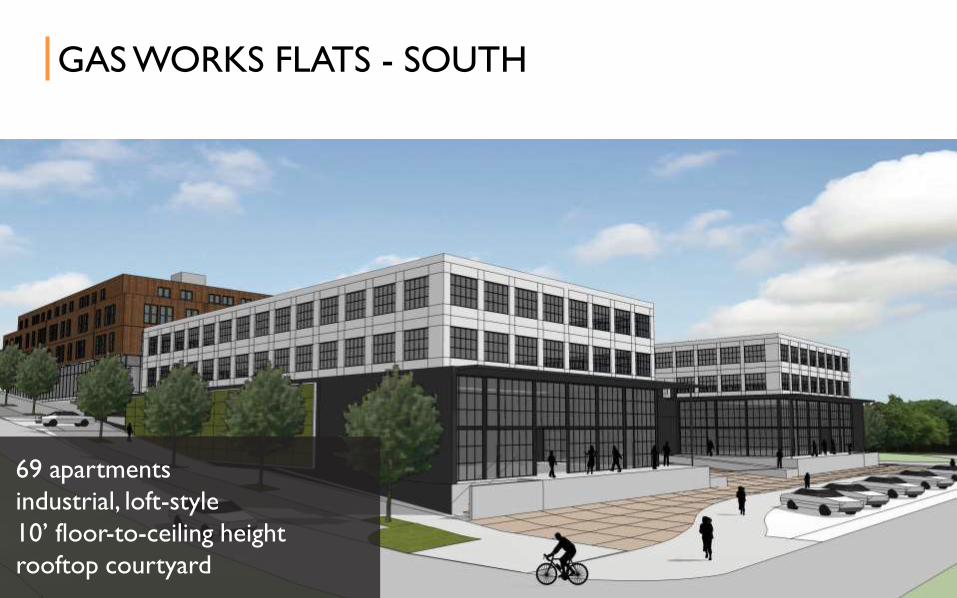
GAS WORKS FLATS - SOUTH
69 apartments
industrial, loft-style
10’ floor-to-ceiling height
rooftop courtyard
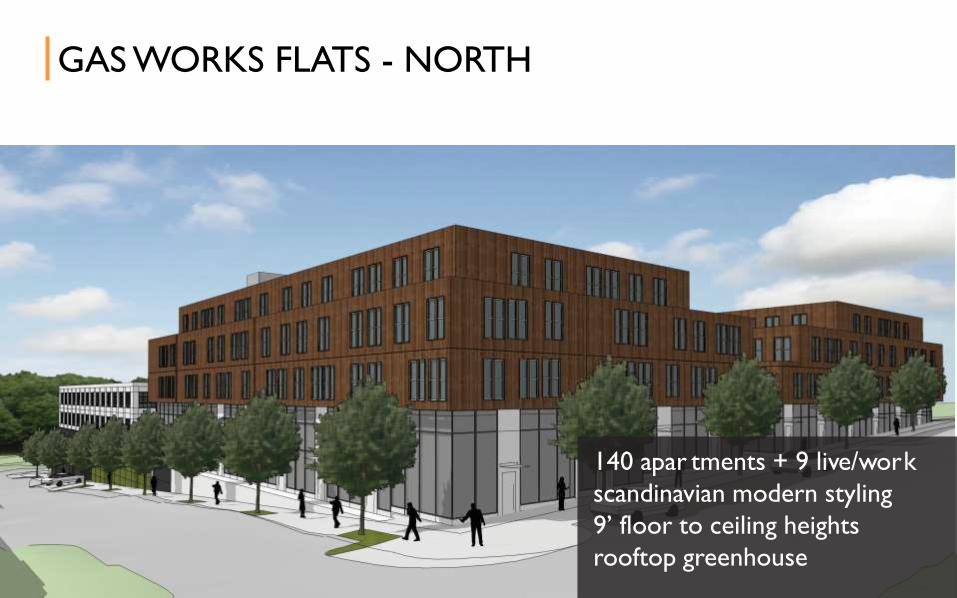
GAS WORKS FLATS - NORTH
140 apar tments + 9 live/work
scandinavian modern styling
9’ floor to ceiling heights
rooftop greenhouse
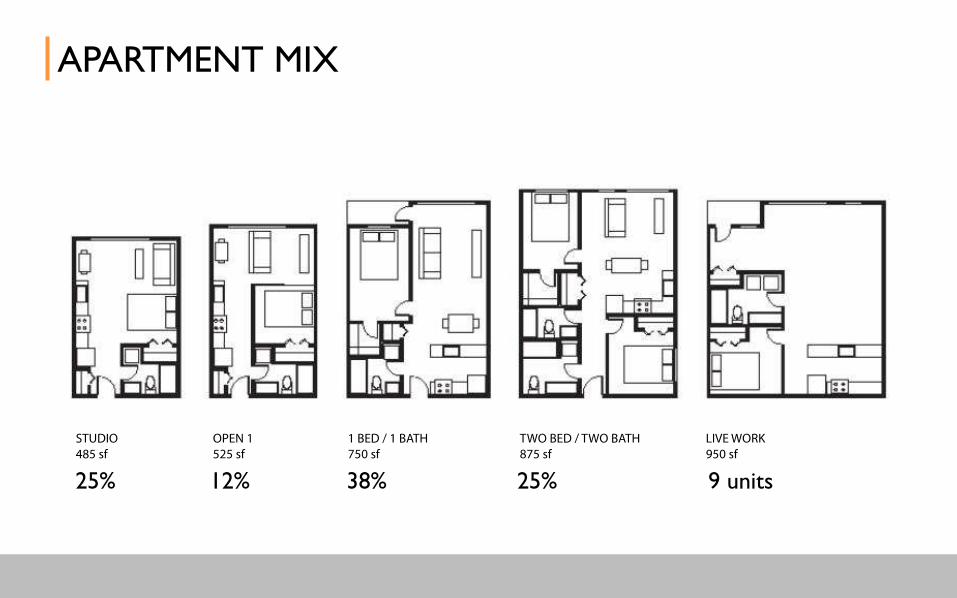
APARTMENT MIX
25%38%12%25% 9 units
HOW WE’RE GOING TO BUILD IT
04
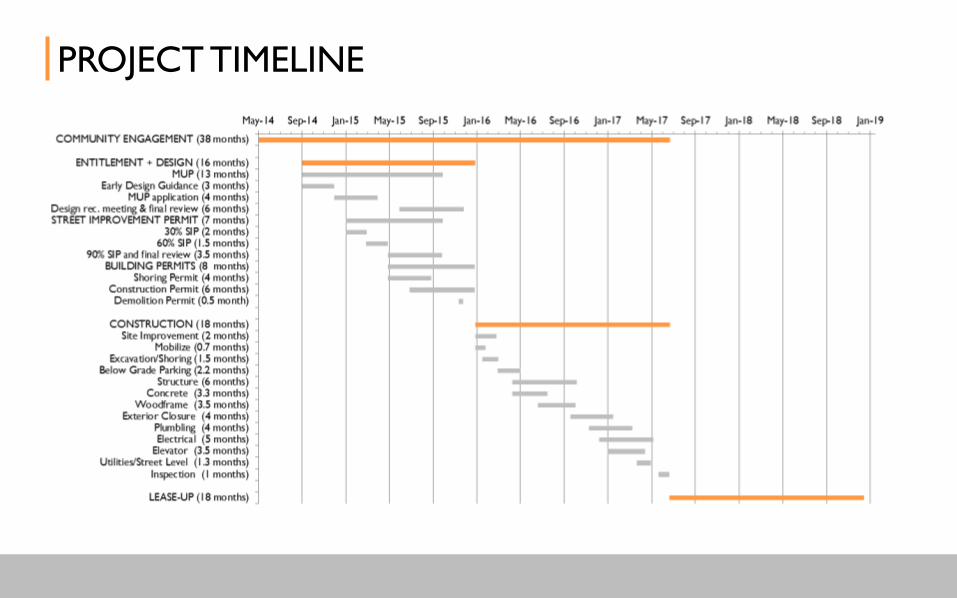
PROJECT TIMELINE
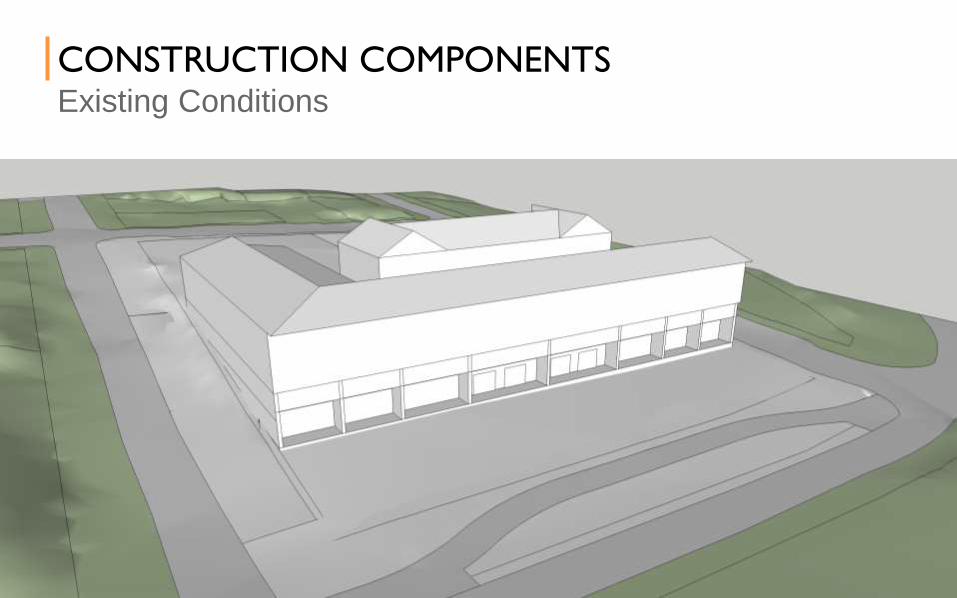
CONSTRUCTION COMPONENTSExisting Conditions
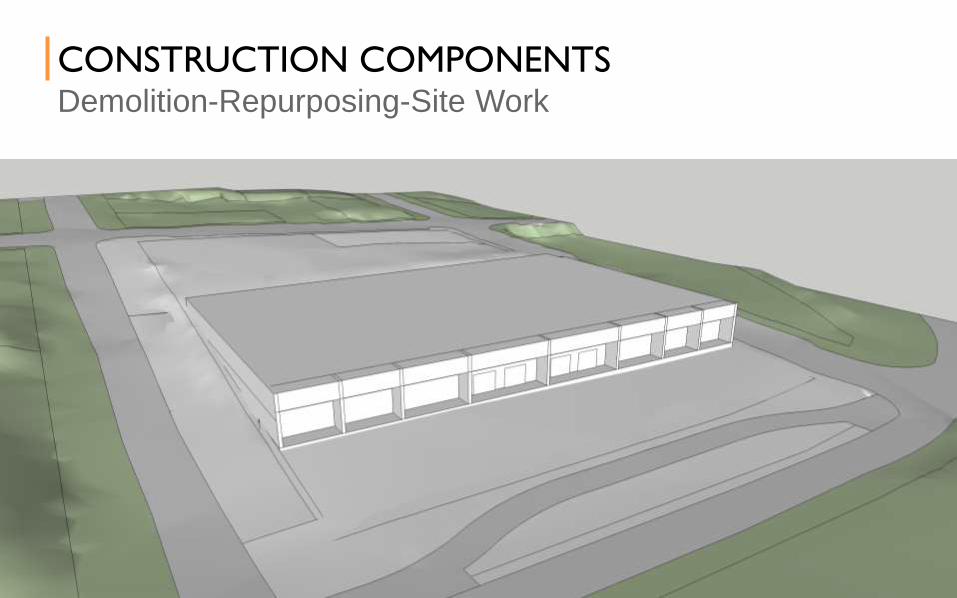
CONSTRUCTION COMPONENTSDemolition-Repurposing-Site Work
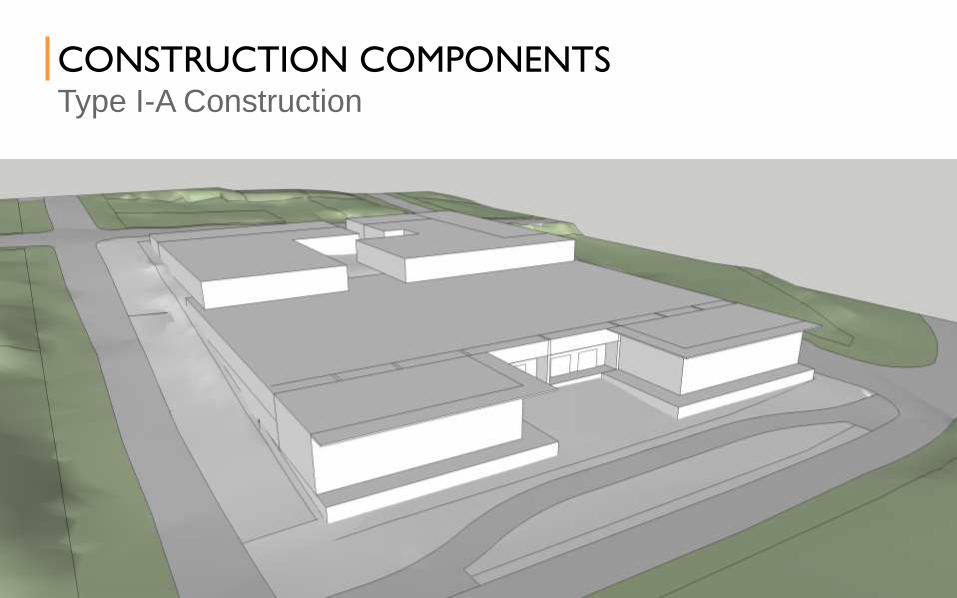
CONSTRUCTION COMPONENTSType I-A Construction
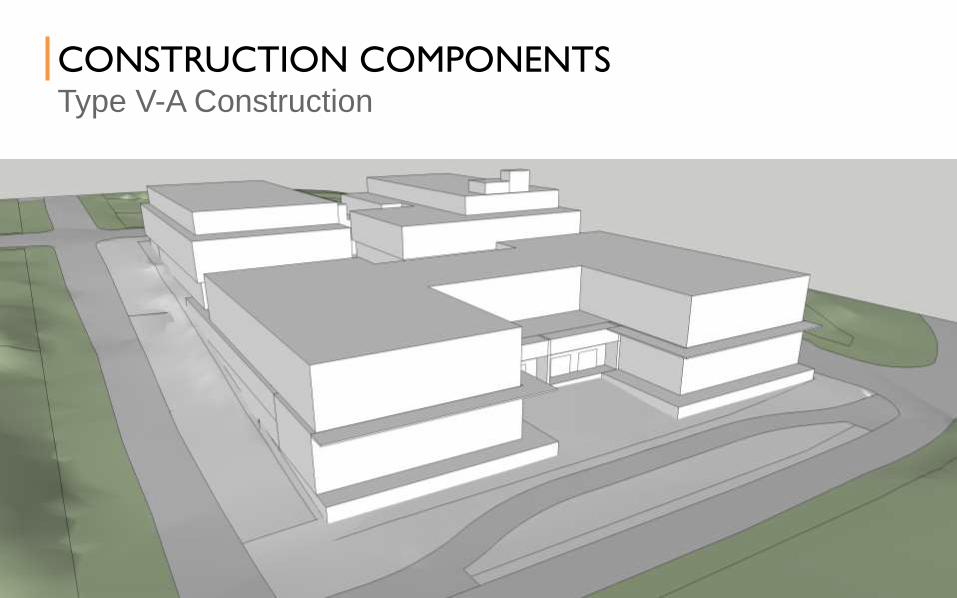
CONSTRUCTION COMPONENTSType V-A Construction
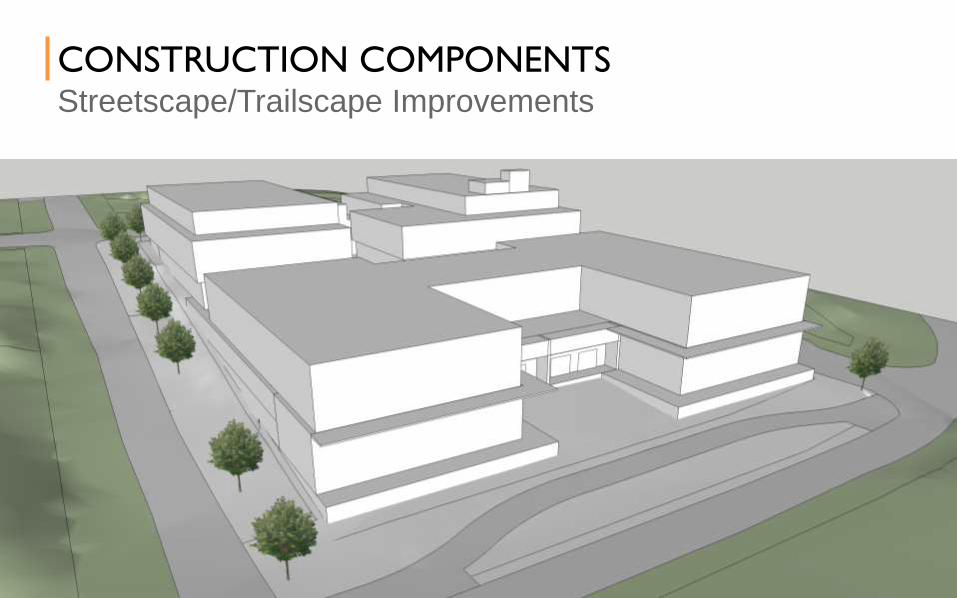
CONSTRUCTION COMPONENTSStreetscape/Trailscape Improvements
HOW IT PERFORMS
05
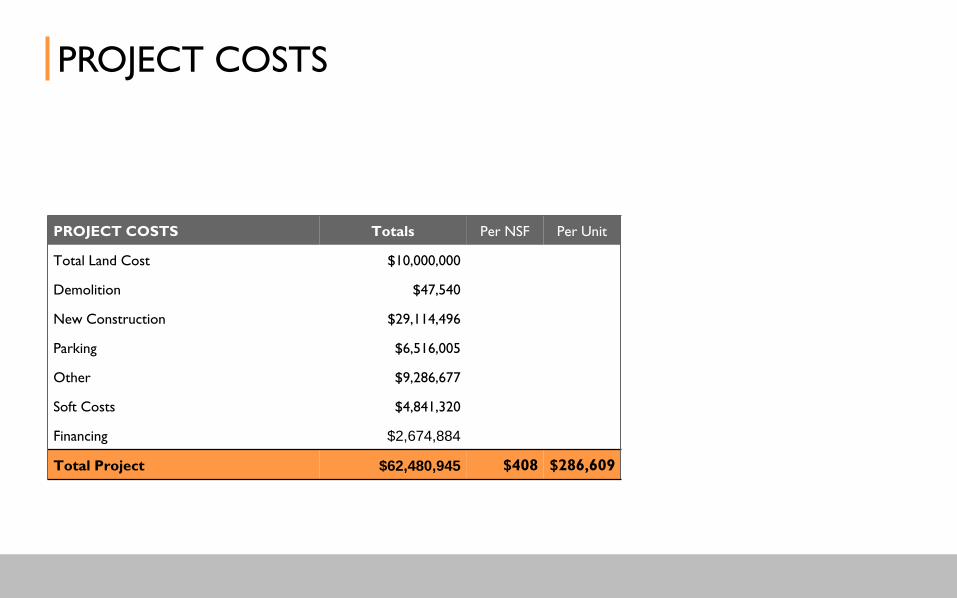
PROJECT COSTS
PROJECT COSTS Totals Per NSF Per Unit
Total Land Cost $10,000,000
Demolition $47,540
New Construction $29,114,496
Parking $6,516,005
Other $9,286,677
Soft Costs $4,841,320
Financing $2,674,884
Total Project $62,480,945 $408 $286,609
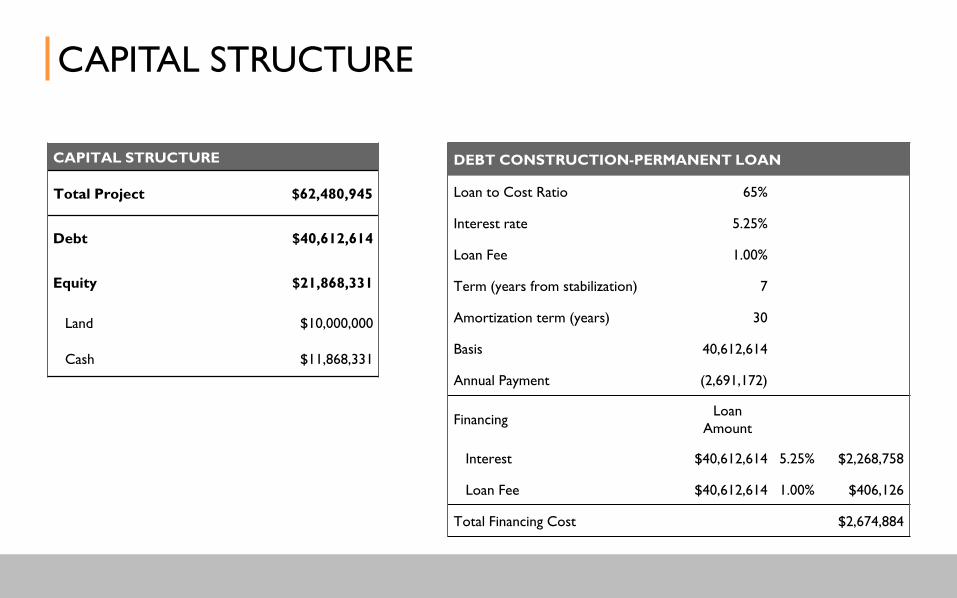
CAPITAL STRUCTURE
DEBT CONSTRUCTION-PERMANENT LOAN
Loan to Cost Ratio 65%
Interest rate 5.25%
Loan Fee 1.00%
Term (years from stabilization) 7
Amortization term (years) 30
Basis 40,612,614
Annual Payment (2,691,172)
FinancingLoan
Amount
Interest $40,612,614 5.25% $2,268,758
Loan Fee $40,612,614 1.00% $406,126
Total Financing Cost $2,674,884
CAPITAL STRUCTURE
Total Project $62,480,945
Debt $40,612,614
Equity $21,868,331
Land $10,000,000
Cash $11,868,331
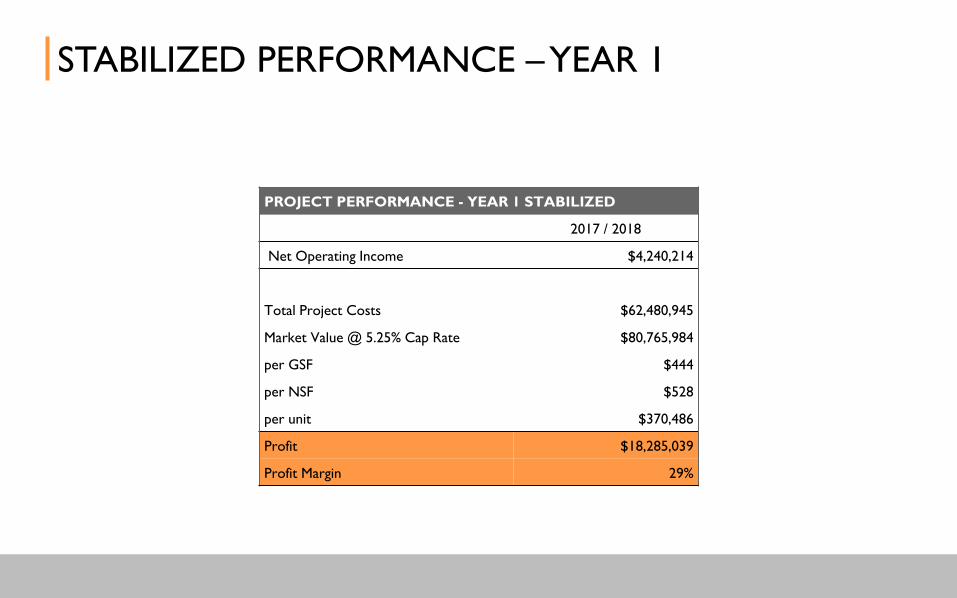
STABILIZED PERFORMANCE –YEAR 1
PROJECT PERFORMANCE - YEAR 1 STABILIZED
2017 / 2018
Net Operating Income $4,240,214
Total Project Costs $62,480,945
Market Value @ 5.25% Cap Rate $80,765,984
per GSF $444
per NSF $528
per unit $370,486
Profit $18,285,039
Profit Margin 29%
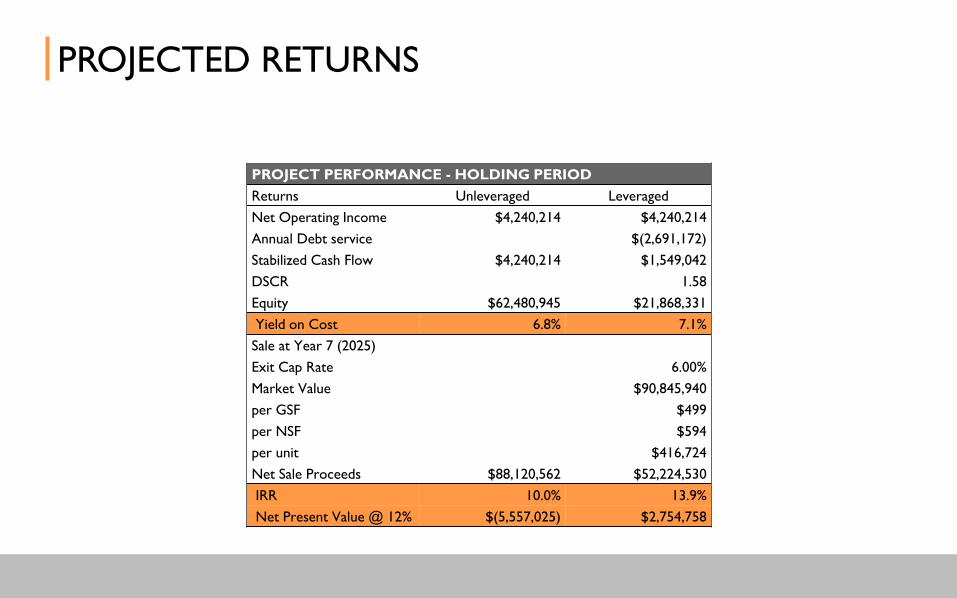
PROJECTED RETURNS
PROJECT PERFORMANCE - HOLDING PERIOD
Returns Unleveraged Leveraged
Net Operating Income $4,240,214 $4,240,214
Annual Debt service $(2,691,172)
Stabilized Cash Flow $4,240,214 $1,549,042
DSCR 1.58
Equity $62,480,945 $21,868,331
Yield on Cost 6.8% 7.1%
Sale at Year 7 (2025)
Exit Cap Rate 6.00%
Market Value $90,845,940
per GSF $499
per NSF $594
per unit $416,724
Net Sale Proceeds $88,120,562 $52,224,530
IRR 10.0% 13.9%
Net Present Value @ 12% $(5,557,025) $2,754,758
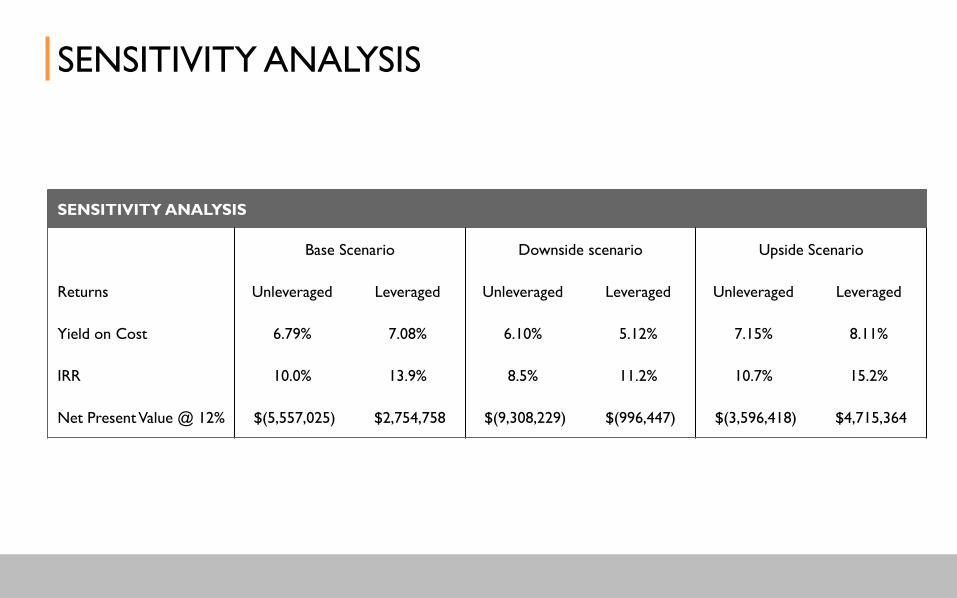
SENSITIVITY ANALYSIS
SENSITIVITY ANALYSIS
Base Scenario Downside scenario Upside Scenario
Returns Unleveraged Leveraged Unleveraged Leveraged Unleveraged Leveraged
Yield on Cost 6.79% 7.08% 6.10% 5.12% 7.15% 8.11%
IRR 10.0% 13.9% 8.5% 11.2% 10.7% 15.2%
Net Present Value @ 12% $(5,557,025) $2,754,758 $(9,308,229) $(996,447) $(3,596,418) $4,715,364
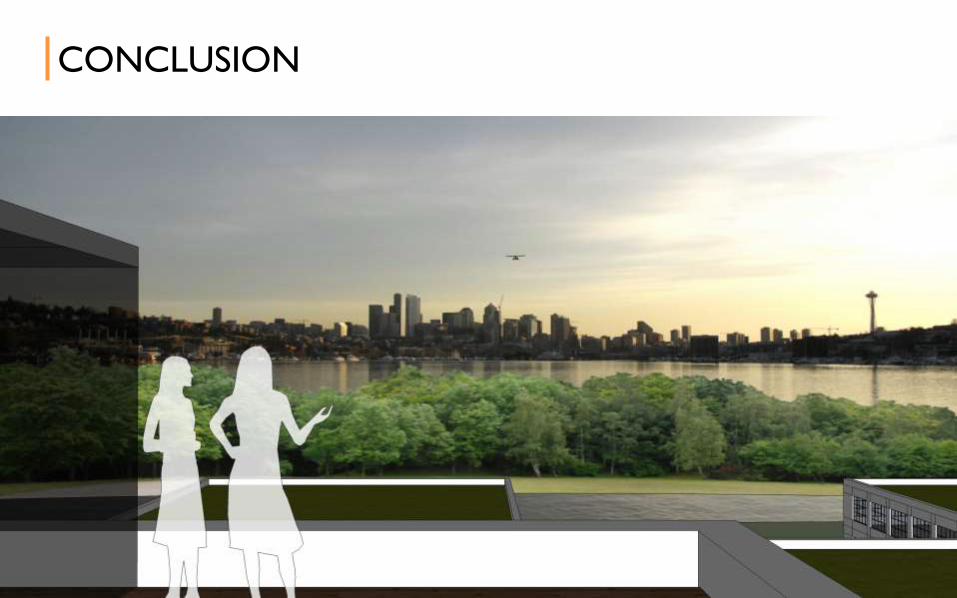
CONCLUSION

APPENDIX
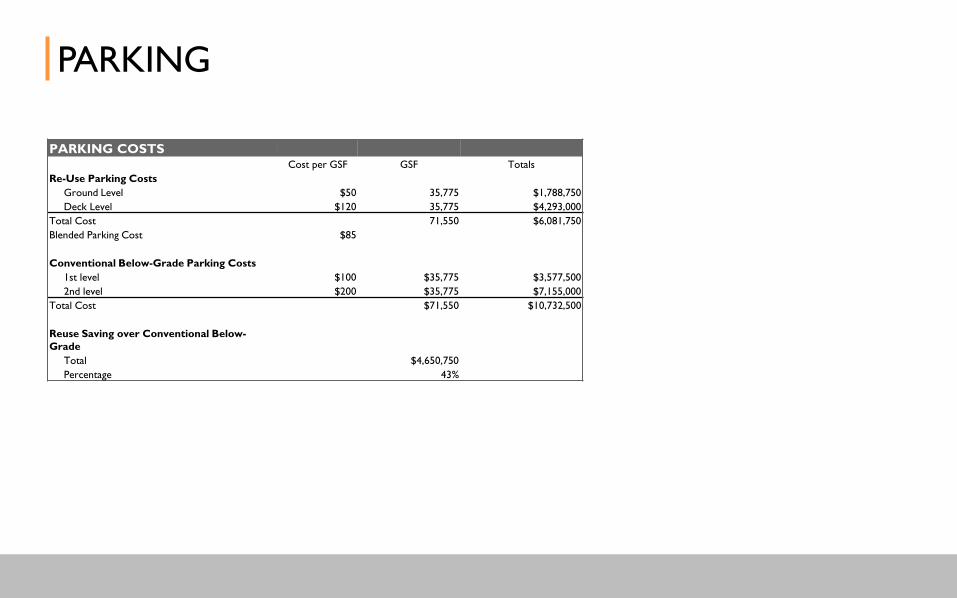
PARKING
PARKING COSTSCost per GSF GSF Totals
Re-Use Parking Costs
Ground Level $50 35,775 $1,788,750
Deck Level $120 35,775 $4,293,000
Total Cost 71,550 $6,081,750
Blended Parking Cost $85
Conventional Below-Grade Parking Costs
1st level $100 $35,775 $3,577,500
2nd level $200 $35,775 $7,155,000
Total Cost $71,550 $10,732,500
Reuse Saving over Conventional Below-
Grade
Total $4,650,750
Percentage 43%
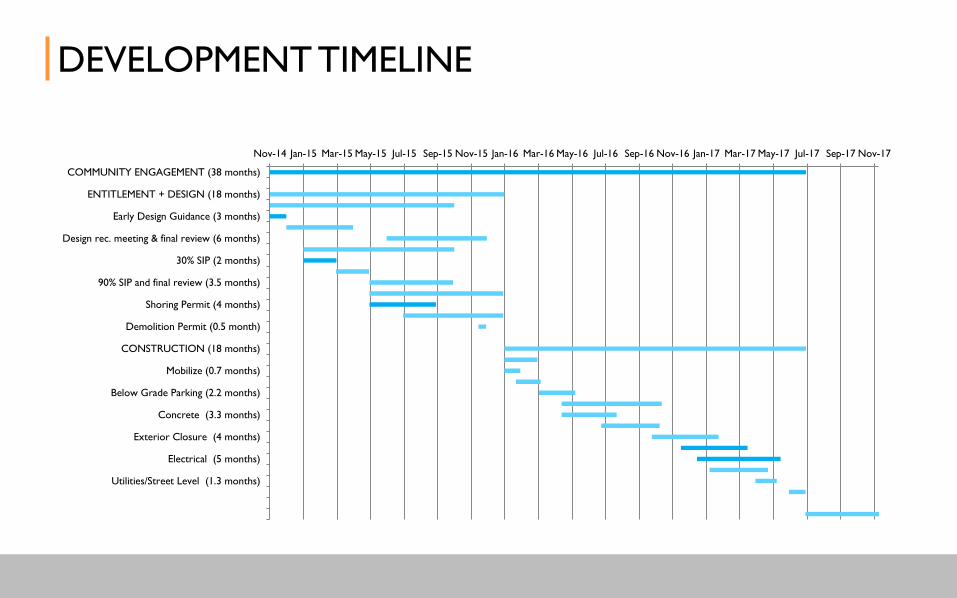
DEVELOPMENT TIMELINE
Nov-14 Jan-15 Mar-15 May-15 Jul-15 Sep-15 Nov-15 Jan-16 Mar-16 May-16 Jul-16 Sep-16 Nov-16 Jan-17 Mar-17 May-17 Jul-17 Sep-17 Nov-17
COMMUNITY ENGAGEMENT (38 months)
ENTITLEMENT + DESIGN (18 months)
Early Design Guidance (3 months)
Design rec. meeting & final review (6 months)
30% SIP (2 months)
90% SIP and final review (3.5 months)
Shoring Permit (4 months)
Demolition Permit (0.5 month)
CONSTRUCTION (18 months)
Mobilize (0.7 months)
Below Grade Parking (2.2 months)
Concrete (3.3 months)
Exterior Closure (4 months)
Electrical (5 months)
Utilities/Street Level (1.3 months)
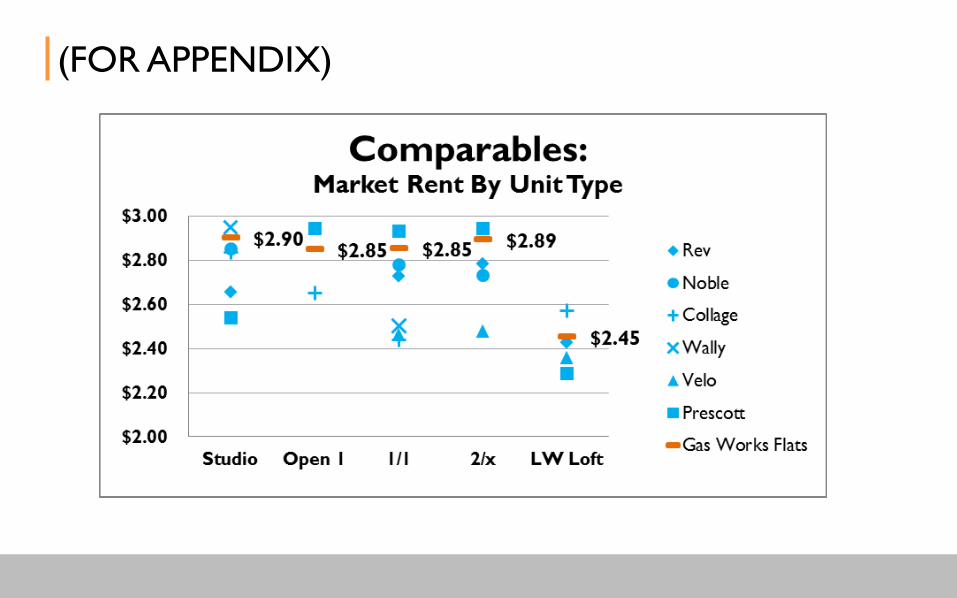
(FOR APPENDIX)
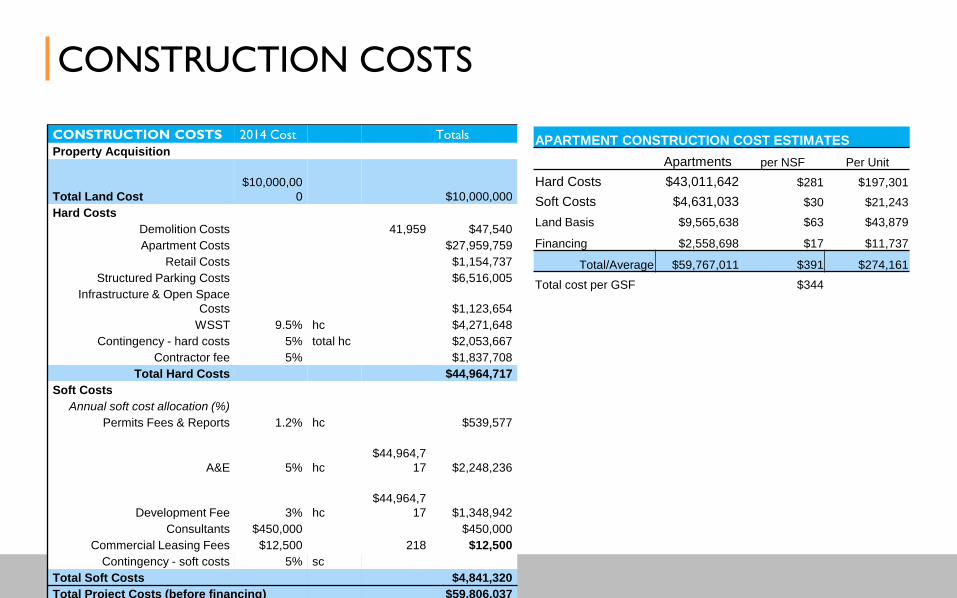
CONSTRUCTION COSTS
CONSTRUCTION COSTS 2014 Cost Totals
Property Acquisition
Total Land Cost
$10,000,00
0 $10,000,000
Hard Costs
Demolition Costs 41,959 $47,540
Apartment Costs $27,959,759
Retail Costs $1,154,737
Structured Parking Costs $6,516,005
Infrastructure & Open Space
Costs $1,123,654
WSST 9.5% hc $4,271,648
Contingency - hard costs 5% total hc $2,053,667
Contractor fee 5% $1,837,708
Total Hard Costs $44,964,717
Soft Costs
Annual soft cost allocation (%)
Permits Fees & Reports 1.2% hc $539,577
A&E 5% hc
$44,964,7
17 $2,248,236
Development Fee 3% hc
$44,964,7
17 $1,348,942
Consultants $450,000 $450,000
Commercial Leasing Fees $12,500 218 $12,500
Contingency - soft costs 5% sc
Total Soft Costs $4,841,320
Total Project Costs (before financing) $59,806,037
APARTMENT CONSTRUCTION COST ESTIMATES
Apartments per NSF Per Unit
Hard Costs $43,011,642 $281 $197,301
Soft Costs $4,631,033 $30 $21,243
Land Basis $9,565,638 $63 $43,879
Financing $2,558,698 $17 $11,737
Total/Average $59,767,011 $391 $274,161
Total cost per GSF $344
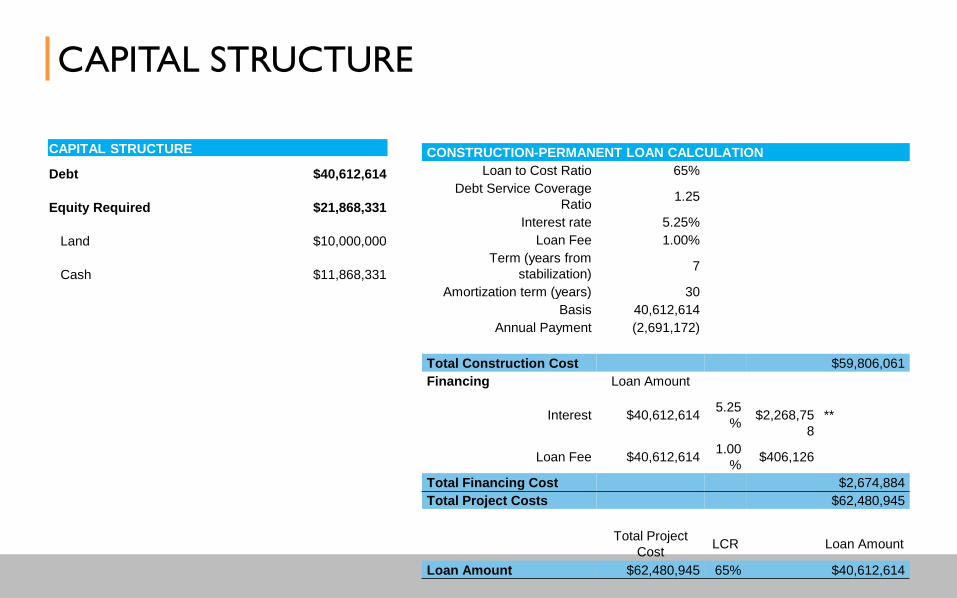
CAPITAL STRUCTURE
CONSTRUCTION-PERMANENT LOAN CALCULATION
Loan to Cost Ratio 65%
Debt Service Coverage
Ratio1.25
Interest rate 5.25%
Loan Fee 1.00%
Term (years from
stabilization)7
Amortization term (years) 30
Basis 40,612,614
Annual Payment (2,691,172)
Total Construction Cost $59,806,061
Financing Loan Amount
Interest $40,612,614 5.25
%$2,268,75
8
**
Loan Fee $40,612,614 1.00
%$406,126
Total Financing Cost $2,674,884
Total Project Costs $62,480,945
Total Project
CostLCR Loan Amount
Loan Amount $62,480,945 65% $40,612,614
CAPITAL STRUCTURE
Debt $40,612,614
Equity Required $21,868,331
Land $10,000,000
Cash $11,868,331
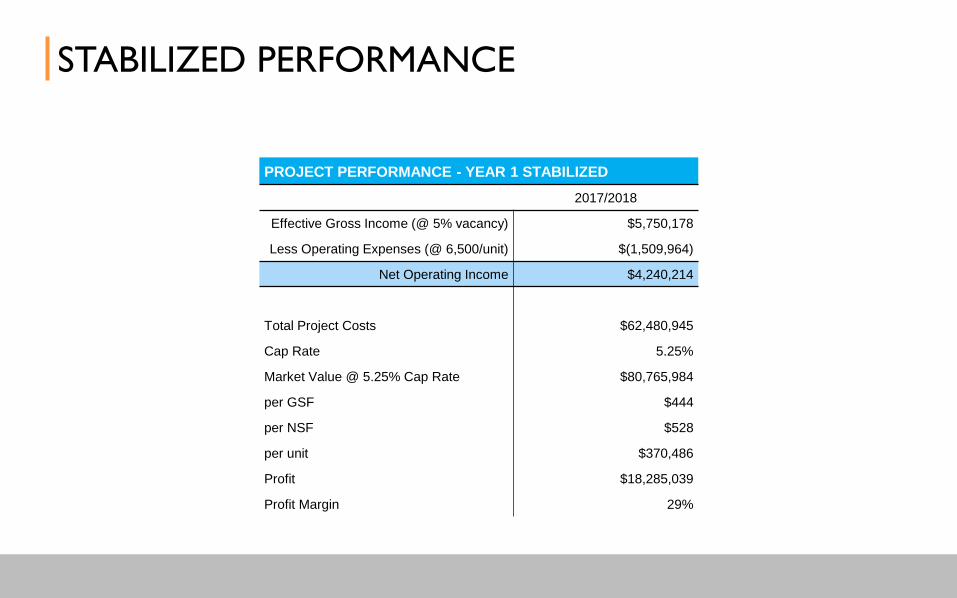
STABILIZED PERFORMANCE
PROJECT PERFORMANCE - YEAR 1 STABILIZED
2017/2018
Effective Gross Income (@ 5% vacancy) $5,750,178
Less Operating Expenses (@ 6,500/unit) $(1,509,964)
Net Operating Income $4,240,214
Total Project Costs $62,480,945
Cap Rate 5.25%
Market Value @ 5.25% Cap Rate $80,765,984
per GSF $444
per NSF $528
per unit $370,486
Profit $18,285,039
Profit Margin 29%
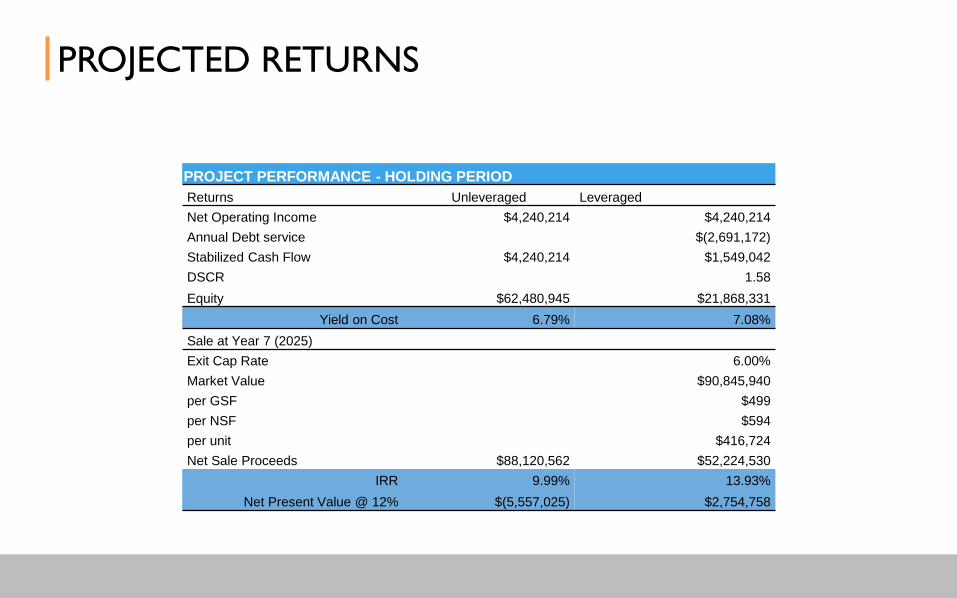
PROJECTED RETURNS
PROJECT PERFORMANCE - HOLDING PERIOD
Returns Unleveraged Leveraged
Net Operating Income $4,240,214 $4,240,214
Annual Debt service $(2,691,172)
Stabilized Cash Flow $4,240,214 $1,549,042
DSCR 1.58
Equity $62,480,945 $21,868,331
Yield on Cost 6.79% 7.08%
Sale at Year 7 (2025)
Exit Cap Rate 6.00%
Market Value $90,845,940
per GSF $499
per NSF $594
per unit $416,724
Net Sale Proceeds $88,120,562 $52,224,530
IRR 9.99% 13.93%
Net Present Value @ 12% $(5,557,025) $2,754,758
SENSITIVITY ANALYSIS
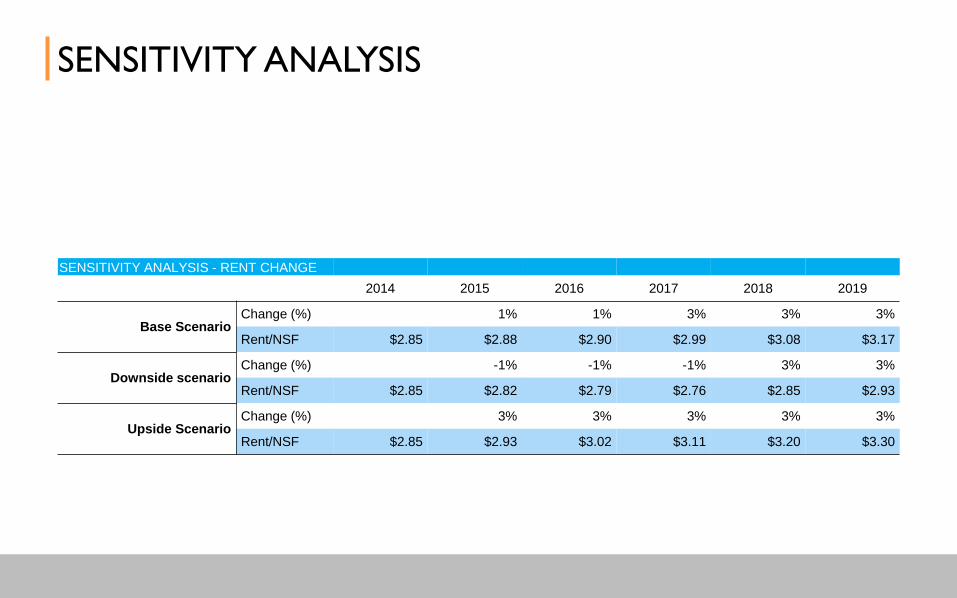
SENSITIVITY ANALYSIS - RENT CHANGE
2014 2015 2016 2017 2018 2019
Base ScenarioChange (%) 1% 1% 3% 3% 3%
Rent/NSF $2.85 $2.88 $2.90 $2.99 $3.08 $3.17
Downside scenarioChange (%) -1% -1% -1% 3% 3%
Rent/NSF $2.85 $2.82 $2.79 $2.76 $2.85 $2.93
Upside ScenarioChange (%) 3% 3% 3% 3% 3%
Rent/NSF $2.85 $2.93 $3.02 $3.11 $3.20 $3.30
SENSITIVITY ANALYSIS
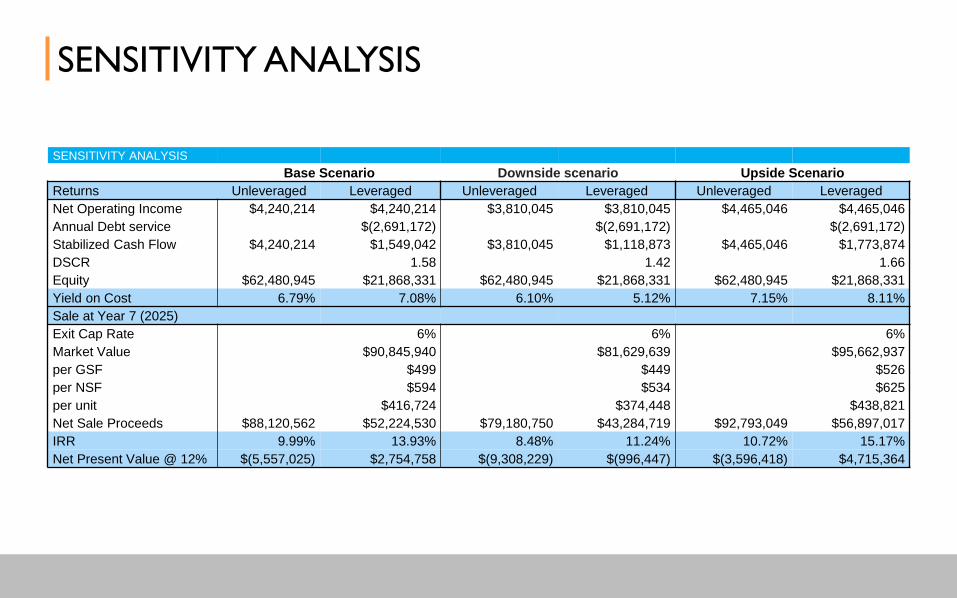
SENSITIVITY ANALYSIS
Base Scenario Downside scenario Upside Scenario
Returns Unleveraged Leveraged Unleveraged Leveraged Unleveraged Leveraged
Net Operating Income $4,240,214 $4,240,214 $3,810,045 $3,810,045 $4,465,046 $4,465,046
Annual Debt service $(2,691,172) $(2,691,172) $(2,691,172)
Stabilized Cash Flow $4,240,214 $1,549,042 $3,810,045 $1,118,873 $4,465,046 $1,773,874
DSCR 1.58 1.42 1.66
Equity $62,480,945 $21,868,331 $62,480,945 $21,868,331 $62,480,945 $21,868,331
Yield on Cost 6.79% 7.08% 6.10% 5.12% 7.15% 8.11%
Sale at Year 7 (2025)
Exit Cap Rate 6% 6% 6%
Market Value $90,845,940 $81,629,639 $95,662,937
per GSF $499 $449 $526
per NSF $594 $534 $625
per unit $416,724 $374,448 $438,821
Net Sale Proceeds $88,120,562 $52,224,530 $79,180,750 $43,284,719 $92,793,049 $56,897,017
IRR 9.99% 13.93% 8.48% 11.24% 10.72% 15.17%
Net Present Value @ 12% $(5,557,025) $2,754,758 $(9,308,229) $(996,447) $(3,596,418) $4,715,364