Embed Size (px)
Citation preview
ICICI Securities Limited, ICICI Centre, H.T. Parekh Marg, Churchgate, Mumbai – 400 020, India. Phone: +91 22 2288 2460/70 Fax: +91 22 2288 2448
ICICI Securities Inc, 461 Fifth Avenue, 16th Floor, New York, NY 10017. Phone: +1 212 921 2344 / +1 212 453 6704 Fax: +1 212 453 6710
January 30, 2015
Market data as on Jan 29, 2015 INDICES
% chg (DoD)
BSE Sensex 29682 0.4 S&P CNX Nifty 8952 0.4 BSE 100 9019 0.3 BSE 200 3685 0.2
OVERSEAS MARKETS# % chg
(DoD) Dow Jones 17417 1.3 Nasdaq Comp. 4683 1.0 S&P 500 2021 1.0 Hang Seng 24566 (0.1) Nikkei 17717 0.6 ADVANCES/DECLINES (BSE)
Group A B S Advances 132 1001 271 Declines 164 1031 287 Unchanged 4 93 37 FII TURNOVER (BSE+NSE)* (Rs mn)
Bought Sold Net 74,060 55,450 18,610
NEW HIGHS AND LOWS (BSE)
Group A B S High 29 70 41 Lows 6 48 25 CURRENCY
US$1 = Rs61.50 *FII turnover (BSE + NSE) as on Jan28, 2015
India Update
CCoonntteennttss Page 2 HDFC (Rs1,316): Exactly as expected AddPage 4 Sesa Sterlite (Rs201): Aluminium production ramp up holds key AddPage 6 Dr Reddy’s (Rs3,363): EBITDA margin outlook impacted by Russia sales HoldPage 8 Pidilite Ind (Rs576): Results below estimates, RM benefit still to show up HoldPage 10 IDFC (Rs171): Preparations on in earnest BuyPage 12 Torrent Pharma (Rs1,138): Strong outlook for India business BuyPage 14 Havells (Rs263): Weak domestic sales, one-offs at Sylvania mar results AddPage 16 Shriram City Union Finance (Rs2,142): Growth returns in parts ReducePage 18 OBC (Rs241): On a slippery wicket ReducePage 20 GSFC (Rs101): Improving fundamental, correction warrants upgrade AddPage 22 Results date reckoner Page 23 Recent reports/updates
HHiigghhlliigghhttss Sector/event Impact FINANCIALS – HDFC: Q3FY15 results review and earnings revision
HDFC’s Q3FY15 earnings print lived up to its billing as a ‘no-surprises’ company and were in-line with expectations (PAT grew 11.6% YoY). The broad business trends were also aligned with our predictions. The loan book (including off-balance sheet assets) grew at 15.6% YoY, with individual loans (17.8% growth YoY) remaining the primary growth driver. Non-individual loan portfolio only increased 1.1% QoQ. Reported NIM remained stable at 3.93%, a marginal 6bps drop from the corresponding quarter last year. Stripping out subsidiary valuation, the core mortgage business currently trades at 4.3x 1-yr fwd P/core BVPS (DTL deduction from special reserve added back). In our valuation methodology for housing finance stocks we accord P/B premium in proportion to excess sustainable RoE over a base CoE of 14%. Our target multiple for the core business is 4x 1-yr fwd P/core BVPS (increased from 3.5x to reflect the rate cycle having turned a corner). We roll over from FY16E to FY17E for subsidiary valuations and factor in a new valuation benchmark for the life insurance business based on the recent stake sale in HDFC Life. Life Insurance is valued at Rs117 per share and increases by almost 75% per share due to change in the valuation benchmark. We arrive at a SOTP based target of Rs1,380 (Rs1,150 earlier). With HDFC Bank yet to report numbers we use the target price of Rs968 set for it by I-Sec Research at the time of its Q2FY15 report. A Rs100 increase in HDFC Bank target price will increase our HDFC target price by Rs34. We maintain our ADD recommendation.
Market movement over last fortnight Volumes in Rs mn (BSE and NSE) Advances & Declines ratio (BSE)
0
40,000
80,000
120,000
160,000
200,000
240,000
280,000
19/1 21/1 23/1 25/1 27/1 29/1
BSE NSE
8300
8400
8500
8600
8700
8800
8900
9000
28000
28500
29000
29500
30000
19/1 21/1 23/1 25/1 27/1 29/1
BSE (LHS) NSE (RHS)
0.2
0.4
0.6
0.8
1.0
1.2
1.4
1.6
1.8
19/1 21/1 23/1 25/1 27/1 29/1
India Update, January 30, 2015 ICICI Securities
2
HDFC (Add) FINANCIALS Q3FY15 RESULT REVIEW AND EARNINGS REVISION
Exactly as expected Rs,1316 Santanu Chakrabarti (+91 22 6637 7351) [email protected] Yash Modi (+91 22 6637 7314) [email protected]
HDFC’s Q3FY15 earnings print lived up to its billing as a ‘no-surprises’ company and were in-line with expectations (PAT grew 11.6% YoY). The broad business trends were also aligned with our predictions. The loan book (including off-balance sheet assets) grew at 15.6% YoY, with individual loans (17.8% growth YoY) remaining the primary growth driver. Non-individual loan portfolio only increased 1.1% QoQ. Reported NIM remained stable at 3.93%, a marginal 6bps drop from the corresponding quarter last year. Stripping out subsidiary valuation, the core mortgage business currently trades at 4.3x 1-yr fwd P/core BVPS (DTL deduction from special reserve added back). In our valuation methodology for housing finance stocks we accord P/B premium in proportion to excess sustainable RoE over a base CoE of 14%. Our target multiple for the core business is 4x 1-yr fwd P/core BVPS (increased from 3.5x to reflect the rate cycle having turned a corner). We roll over from FY16E to FY17E for subsidiary valuations and factor in a new valuation benchmark for the life insurance business based on the recent stake sale in HDFC Life. Life Insurance is valued at Rs117 per share and increases by almost 75% per share due to change in the valuation benchmark. We arrive at a SOTP based target of Rs1,380 (Rs1,150 earlier). With HDFC Bank yet to report numbers we use the target price of Rs968 set for it by I-Sec Research at the time of its Q2FY15 report. A Rs100 increase in HDFC Bank target price will increase our HDFC target price by Rs34. We maintain our ADD recommendation.
Table 1: Valuations summary
Y/E Mar
EPS (Rs)
P/E (x)
P/BV (x)
Price (29/01/15) (Rs) 1,316 2014 34.9 37.7 7.3 M.Cap. (Rs bn) 1,93452 wk Range (Rs) 1,345/765 2015E 37.0 35.6 6.8 M.Cap (US$ bn) 31.3Dividend yield FY15E (%) 1.2 2016E 43.6 30.2 6.1 Shares Out (mn) 1470BSE Sensex 29682 2017E 51.1 25.8 5.5 Free Float (%) 100
Source: Company data, I-Sec Research
• Growth continues to be led by individual loans. Individual loans grew at 4.3% QoQ, re-iterating the management confidence in the time tested principle that this segment has best defensive qualities on asset quality in an adverse economic environment. Despite attractive (yield wise) opportunities aplenty in the developer finance segment the company has remained cautious in the last few quarters and has not alluded to any major shift in business outlook in its current commentary.
• History suggests most margin gains beyond threshold likely to be passed on. Margins remained healthy recording a calculated NIM of 3.43%, a marginal 2bps drop YoY. Yields at 11.84% were down only 9bps YoY reflecting pricing discipline, especially as non individual business proportion receded, while borrowing costs reduced 4bps YoY to 9.27%, thanks to nimble liability management. As policy rates ease further, the company has much legroom to cut lending rates to boost growth without compromising on profitability.
• Healthy cushion of capital to leverage into any economic recovery. Tier 1 stood at 16.5% and leverage at 7.6x. If and when confidence improves the company will have the option to leverage further/ raise payouts to boost RoE. Typically, leveraging can happen if non-individual loans pick up from an economic recovery. Even adjusting for likely ~200bps reduction in tier-1 capital, due to Basel 3 norms requiring risk capital deduction on account of its stake in HDFC Bank, its position is quite comfortable even if NBFC guidelines of 10% Tier-1 is adopted for HFCs by NHB.
Target price Rs1,380 Earnings revision (%) FY15E FY16E FY17E NII ↑ 0.1 ↓ 0.4 ↓ 0.4 PPP ↓ 0.7 ↓ 0.5 ↓ 0.5 EPS ↓ 1.0 ↓ 0.5 ↓ 0.5 Target price revision Rs1,380 from Rs1,150
India Update, January 30, 2015 ICICI Securities
3
Table 2: Q3FY15 results review (Rs mn, year ending March 31)
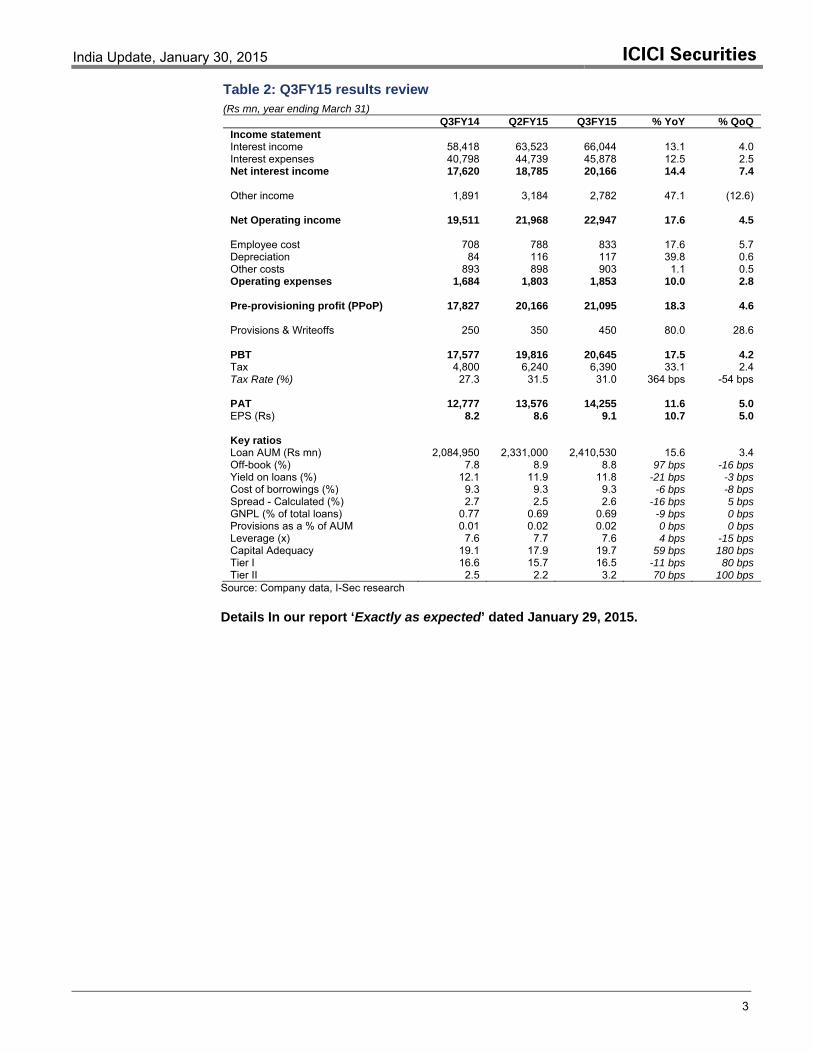
Q3FY14 Q2FY15 Q3FY15 % YoY % QoQ Income statement Interest income 58,418 63,523 66,044 13.1 4.0 Interest expenses 40,798 44,739 45,878 12.5 2.5 Net interest income 17,620 18,785 20,166 14.4 7.4 Other income 1,891 3,184 2,782 47.1 (12.6) Net Operating income 19,511 21,968 22,947 17.6 4.5 Employee cost 708 788 833 17.6 5.7 Depreciation 84 116 117 39.8 0.6 Other costs 893 898 903 1.1 0.5 Operating expenses 1,684 1,803 1,853 10.0 2.8 Pre-provisioning profit (PPoP) 17,827 20,166 21,095 18.3 4.6 Provisions & Writeoffs 250 350 450 80.0 28.6 PBT 17,577 19,816 20,645 17.5 4.2 Tax 4,800 6,240 6,390 33.1 2.4 Tax Rate (%) 27.3 31.5 31.0 364 bps -54 bps PAT 12,777 13,576 14,255 11.6 5.0 EPS (Rs) 8.2 8.6 9.1 10.7 5.0 Key ratios Loan AUM (Rs mn) 2,084,950 2,331,000 2,410,530 15.6 3.4 Off-book (%) 7.8 8.9 8.8 97 bps -16 bps Yield on loans (%) 12.1 11.9 11.8 -21 bps -3 bps Cost of borrowings (%) 9.3 9.3 9.3 -6 bps -8 bps Spread - Calculated (%) 2.7 2.5 2.6 -16 bps 5 bps GNPL (% of total loans) 0.77 0.69 0.69 -9 bps 0 bps Provisions as a % of AUM 0.01 0.02 0.02 0 bps 0 bps Leverage (x) 7.6 7.7 7.6 4 bps -15 bps Capital Adequacy 19.1 17.9 19.7 59 bps 180 bps Tier I 16.6 15.7 16.5 -11 bps 80 bps Tier II 2.5 2.2 3.2 70 bps 100 bps
Source: Company data, I-Sec research Details In our report ‘Exactly as expected’ dated January 29, 2015.
India Update, January 30, 2015 ICICI Securities
4
Sesa Sterlite (Add) METALS Q3FY15 RESULT REVIEW
Aluminium production ramp up holds key Rs201 Abhijit Mitra (+91 22 6637 7289) [email protected] Ansuman Deb (+91 22 6637 7312) [email protected]
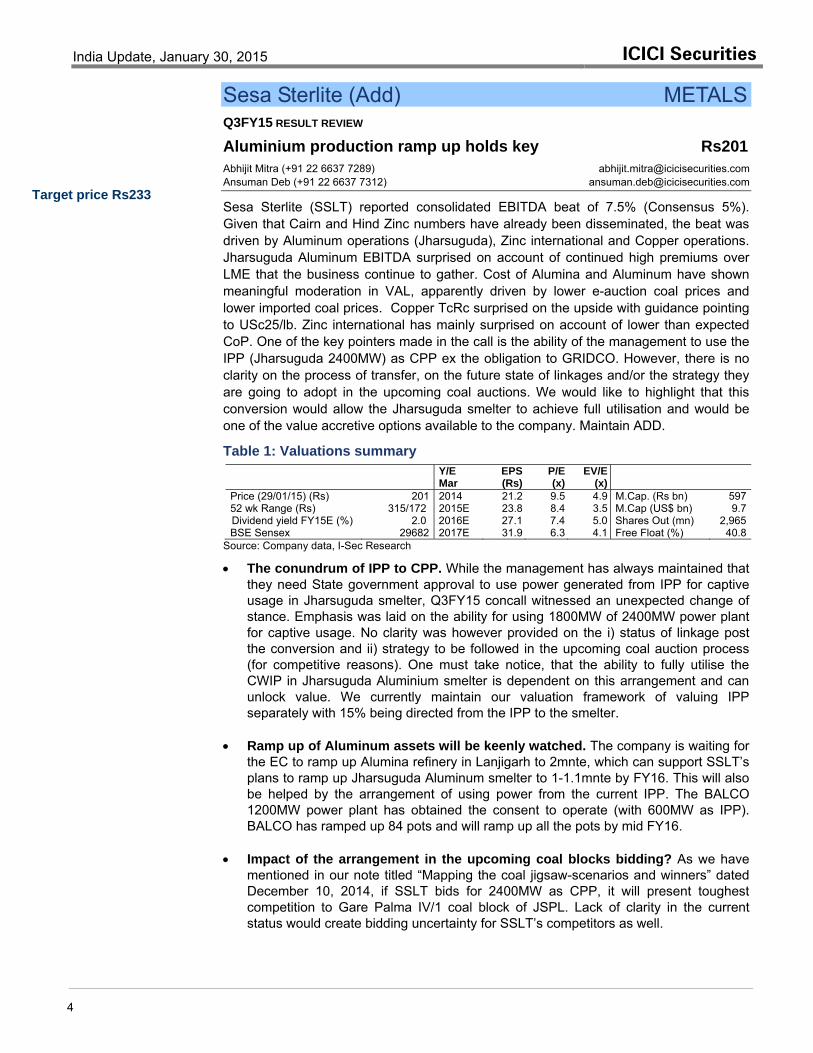
Sesa Sterlite (SSLT) reported consolidated EBITDA beat of 7.5% (Consensus 5%). Given that Cairn and Hind Zinc numbers have already been disseminated, the beat was driven by Aluminum operations (Jharsuguda), Zinc international and Copper operations. Jharsuguda Aluminum EBITDA surprised on account of continued high premiums over LME that the business continue to gather. Cost of Alumina and Aluminum have shown meaningful moderation in VAL, apparently driven by lower e-auction coal prices and lower imported coal prices. Copper TcRc surprised on the upside with guidance pointing to USc25/lb. Zinc international has mainly surprised on account of lower than expected CoP. One of the key pointers made in the call is the ability of the management to use the IPP (Jharsuguda 2400MW) as CPP ex the obligation to GRIDCO. However, there is no clarity on the process of transfer, on the future state of linkages and/or the strategy they are going to adopt in the upcoming coal auctions. We would like to highlight that this conversion would allow the Jharsuguda smelter to achieve full utilisation and would be one of the value accretive options available to the company. Maintain ADD.
Table 1: Valuations summary
Y/E Mar
EPS (Rs)
P/E (x)
EV/E (x)
Price (29/01/15) (Rs) 201 2014 21.2 9.5 4.9 M.Cap. (Rs bn) 59752 wk Range (Rs) 315/172 2015E 23.8 8.4 3.5 M.Cap (US$ bn) 9.7Dividend yield FY15E (%) 2.0 2016E 27.1 7.4 5.0 Shares Out (mn) 2,965BSE Sensex 29682 2017E 31.9 6.3 4.1 Free Float (%) 40.8
Source: Company data, I-Sec Research
• The conundrum of IPP to CPP. While the management has always maintained that they need State government approval to use power generated from IPP for captive usage in Jharsuguda smelter, Q3FY15 concall witnessed an unexpected change of stance. Emphasis was laid on the ability for using 1800MW of 2400MW power plant for captive usage. No clarity was however provided on the i) status of linkage post the conversion and ii) strategy to be followed in the upcoming coal auction process (for competitive reasons). One must take notice, that the ability to fully utilise the CWIP in Jharsuguda Aluminium smelter is dependent on this arrangement and can unlock value. We currently maintain our valuation framework of valuing IPP separately with 15% being directed from the IPP to the smelter.
• Ramp up of Aluminum assets will be keenly watched. The company is waiting for the EC to ramp up Alumina refinery in Lanjigarh to 2mnte, which can support SSLT’s plans to ramp up Jharsuguda Aluminum smelter to 1-1.1mnte by FY16. This will also be helped by the arrangement of using power from the current IPP. The BALCO 1200MW power plant has obtained the consent to operate (with 600MW as IPP). BALCO has ramped up 84 pots and will ramp up all the pots by mid FY16.
• Impact of the arrangement in the upcoming coal blocks bidding? As we have mentioned in our note titled “Mapping the coal jigsaw-scenarios and winners” dated December 10, 2014, if SSLT bids for 2400MW as CPP, it will present toughest competition to Gare Palma IV/1 coal block of JSPL. Lack of clarity in the current status would create bidding uncertainty for SSLT’s competitors as well.
Target price Rs233
India Update, January 30, 2015 ICICI Securities
5
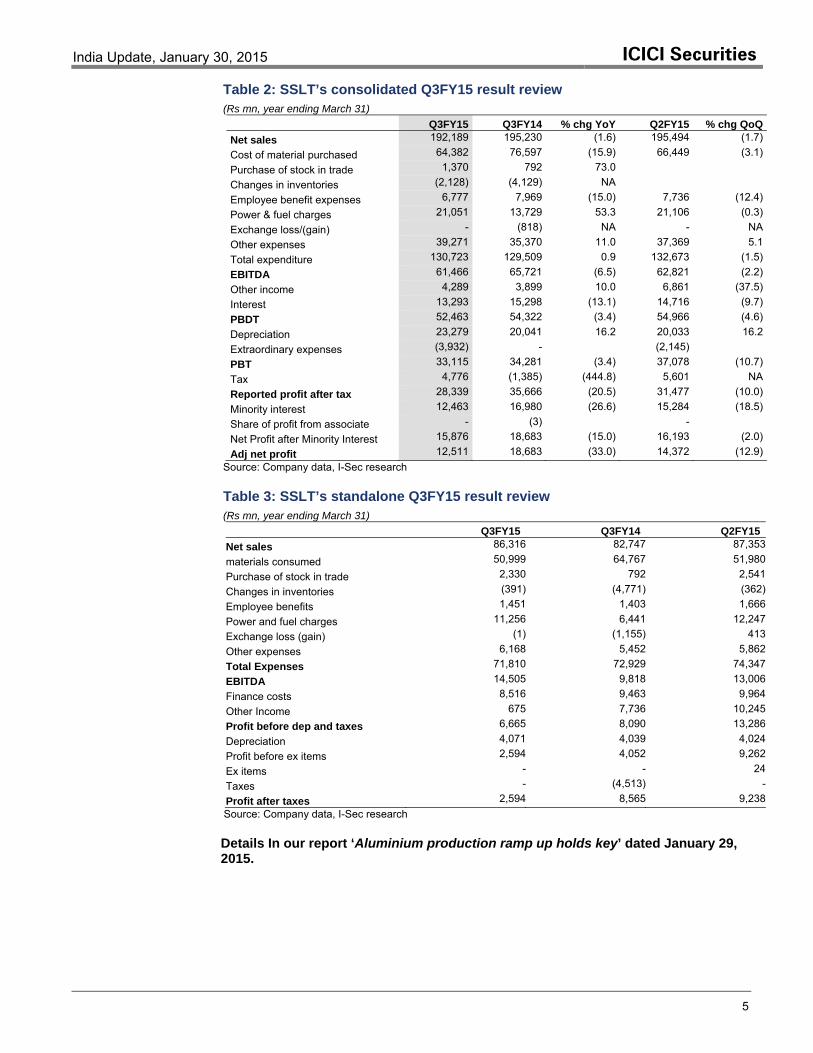
Table 2: SSLT’s consolidated Q3FY15 result review (Rs mn, year ending March 31)
Q3FY15 Q3FY14 % chg YoY Q2FY15 % chg QoQNet sales 192,189 195,230 (1.6) 195,494 (1.7)
Cost of material purchased 64,382 76,597 (15.9) 66,449 (3.1)
Purchase of stock in trade 1,370 792 73.0
Changes in inventories (2,128) (4,129) NA
Employee benefit expenses 6,777 7,969 (15.0) 7,736 (12.4)
Power & fuel charges 21,051 13,729 53.3 21,106 (0.3)
Exchange loss/(gain) - (818) NA - NA
Other expenses 39,271 35,370 11.0 37,369 5.1
Total expenditure 130,723 129,509 0.9 132,673 (1.5)
EBITDA 61,466 65,721 (6.5) 62,821 (2.2)
Other income 4,289 3,899 10.0 6,861 (37.5)
Interest 13,293 15,298 (13.1) 14,716 (9.7)
PBDT 52,463 54,322 (3.4) 54,966 (4.6)
Depreciation 23,279 20,041 16.2 20,033 16.2
Extraordinary expenses (3,932) - (2,145)
PBT 33,115 34,281 (3.4) 37,078 (10.7)
Tax 4,776 (1,385) (444.8) 5,601 NA
Reported profit after tax 28,339 35,666 (20.5) 31,477 (10.0)
Minority interest 12,463 16,980 (26.6) 15,284 (18.5)
Share of profit from associate - (3) -
Net Profit after Minority Interest 15,876 18,683 (15.0) 16,193 (2.0)
Adj net profit 12,511 18,683 (33.0) 14,372 (12.9)Source: Company data, I-Sec research
Table 3: SSLT’s standalone Q3FY15 result review (Rs mn, year ending March 31)
Q3FY15 Q3FY14 Q2FY15Net sales 86,316 82,747 87,353
materials consumed 50,999 64,767 51,980 Purchase of stock in trade 2,330 792 2,541
Changes in inventories (391) (4,771) (362)Employee benefits 1,451 1,403 1,666
Power and fuel charges 11,256 6,441 12,247 Exchange loss (gain) (1) (1,155) 413
Other expenses 6,168 5,452 5,862 Total Expenses 71,810 72,929 74,347
EBITDA 14,505 9,818 13,006 Finance costs 8,516 9,463 9,964
Other Income 675 7,736 10,245 Profit before dep and taxes 6,665 8,090 13,286
Depreciation 4,071 4,039 4,024 Profit before ex items 2,594 4,052 9,262
Ex items - - 24 Taxes - (4,513) -
Profit after taxes 2,594 8,565 9,238 Source: Company data, I-Sec research Details In our report ‘Aluminium production ramp up holds key’ dated January 29, 2015.
India Update, January 30, 2015 ICICI Securities
6
Dr Reddy’s Lab (Downgrade to Hold) PHARMA Q3FY15 RESULT REVIEW AND EARNINGS REVISION
EBITDA margin outlook impacted by Russia sales Rs3,363 Kartik Mehta (+91 22 6637 7230) [email protected] Gagan Borana (+91 22 6637 7480) [email protected]
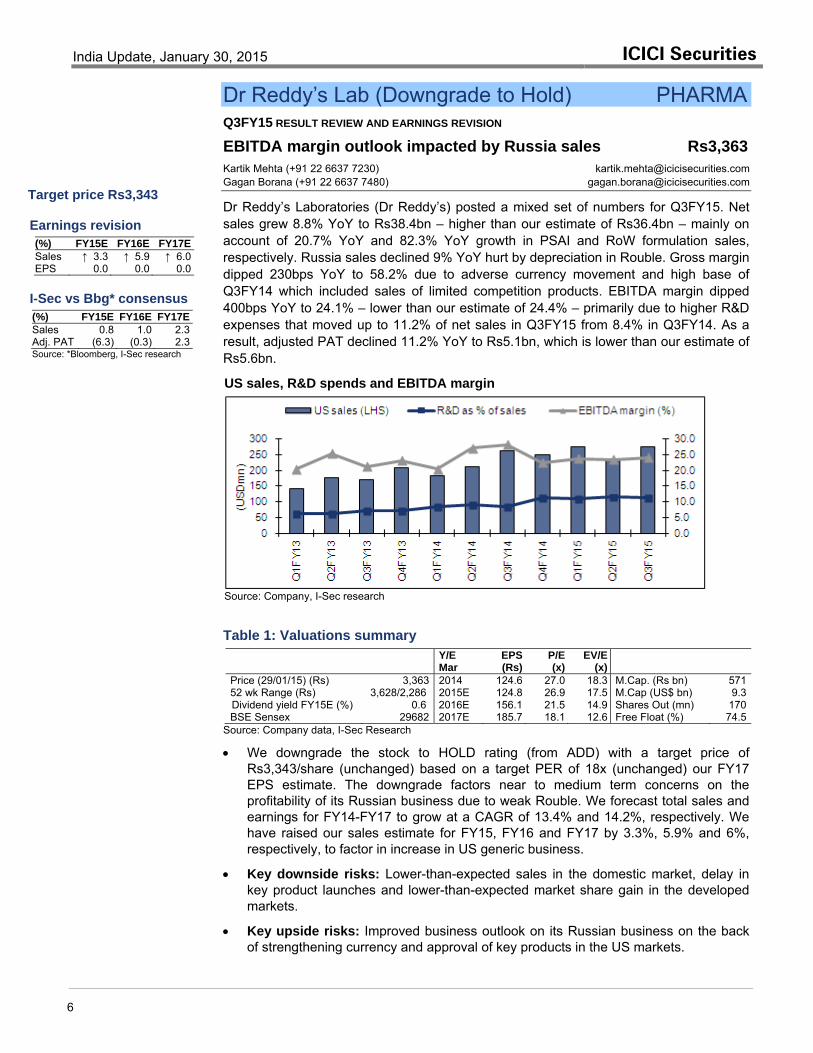
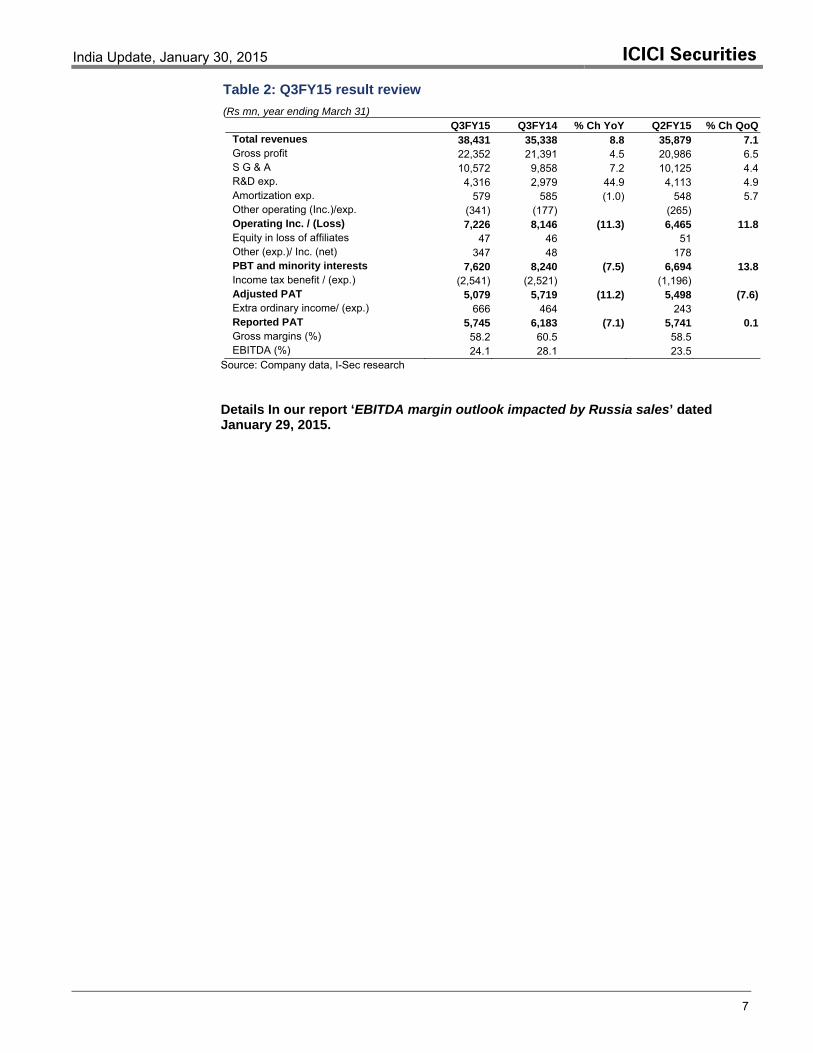
Dr Reddy’s Laboratories (Dr Reddy’s) posted a mixed set of numbers for Q3FY15. Net sales grew 8.8% YoY to Rs38.4bn – higher than our estimate of Rs36.4bn – mainly on account of 20.7% YoY and 82.3% YoY growth in PSAI and RoW formulation sales, respectively. Russia sales declined 9% YoY hurt by depreciation in Rouble. Gross margin dipped 230bps YoY to 58.2% due to adverse currency movement and high base of Q3FY14 which included sales of limited competition products. EBITDA margin dipped 400bps YoY to 24.1% – lower than our estimate of 24.4% – primarily due to higher R&D expenses that moved up to 11.2% of net sales in Q3FY15 from 8.4% in Q3FY14. As a result, adjusted PAT declined 11.2% YoY to Rs5.1bn, which is lower than our estimate of Rs5.6bn.
US sales, R&D spends and EBITDA margin
Source: Company, I-Sec research
Table 1: Valuations summary
Y/E Mar
EPS (Rs)
P/E (x)
EV/E (x)
Price (29/01/15) (Rs) 3,363 2014 124.6 27.0 18.3 M.Cap. (Rs bn) 57152 wk Range (Rs) 3,628/2,286 2015E 124.8 26.9 17.5 M.Cap (US$ bn) 9.3Dividend yield FY15E (%) 0.6 2016E 156.1 21.5 14.9 Shares Out (mn) 170BSE Sensex 29682 2017E 185.7 18.1 12.6 Free Float (%) 74.5
Source: Company data, I-Sec Research
• We downgrade the stock to HOLD rating (from ADD) with a target price of Rs3,343/share (unchanged) based on a target PER of 18x (unchanged) our FY17 EPS estimate. The downgrade factors near to medium term concerns on the profitability of its Russian business due to weak Rouble. We forecast total sales and earnings for FY14-FY17 to grow at a CAGR of 13.4% and 14.2%, respectively. We have raised our sales estimate for FY15, FY16 and FY17 by 3.3%, 5.9% and 6%, respectively, to factor in increase in US generic business.
• Key downside risks: Lower-than-expected sales in the domestic market, delay in key product launches and lower-than-expected market share gain in the developed markets.
• Key upside risks: Improved business outlook on its Russian business on the back of strengthening currency and approval of key products in the US markets.
Target price Rs3,343 Earnings revision (%) FY15E FY16E FY17E Sales ↑ 3.3 ↑ 5.9 ↑ 6.0 EPS 0.0 0.0 0.0 I-Sec vs Bbg* consensus (%) FY15E FY16E FY17E Sales 0.8 1.0 2.3 Adj. PAT (6.3) (0.3) 2.3 Source: *Bloomberg, I-Sec research
India Update, January 30, 2015 ICICI Securities
7
Table 2: Q3FY15 result review (Rs mn, year ending March 31)
Q3FY15 Q3FY14 % Ch YoY Q2FY15 % Ch QoQTotal revenues 38,431 35,338 8.8 35,879 7.1 Gross profit 22,352 21,391 4.5 20,986 6.5 S G & A 10,572 9,858 7.2 10,125 4.4 R&D exp. 4,316 2,979 44.9 4,113 4.9 Amortization exp. 579 585 (1.0) 548 5.7 Other operating (Inc.)/exp. (341) (177) (265) Operating Inc. / (Loss) 7,226 8,146 (11.3) 6,465 11.8 Equity in loss of affiliates 47 46 51 Other (exp.)/ Inc. (net) 347 48 178 PBT and minority interests 7,620 8,240 (7.5) 6,694 13.8 Income tax benefit / (exp.) (2,541) (2,521) (1,196) Adjusted PAT 5,079 5,719 (11.2) 5,498 (7.6)Extra ordinary income/ (exp.) 666 464 243 Reported PAT 5,745 6,183 (7.1) 5,741 0.1 Gross margins (%) 58.2 60.5 58.5 EBITDA (%) 24.1 28.1 23.5
Source: Company data, I-Sec research Details In our report ‘EBITDA margin outlook impacted by Russia sales’ dated January 29, 2015.
India Update, January 30, 2015 ICICI Securities
8
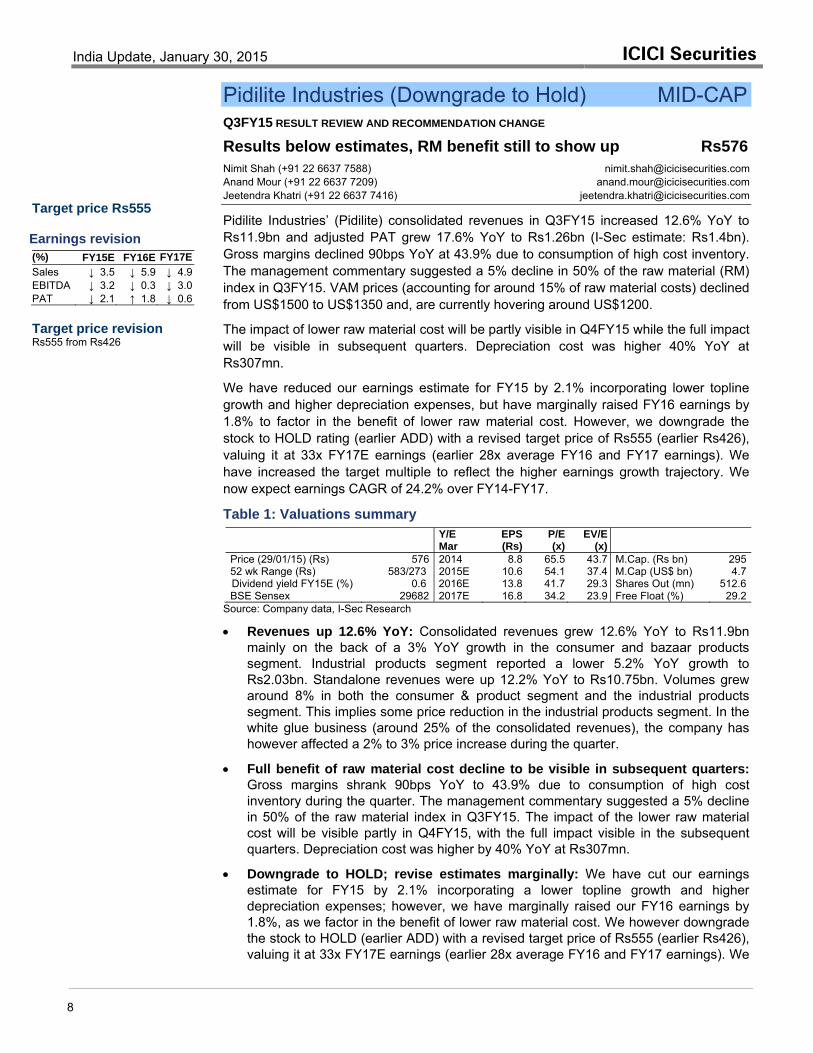
Pidilite Industries (Downgrade to Hold) MID-CAP Q3FY15 RESULT REVIEW AND RECOMMENDATION CHANGE
Results below estimates, RM benefit still to show up Rs576 Nimit Shah (+91 22 6637 7588) [email protected] Anand Mour (+91 22 6637 7209) [email protected] Jeetendra Khatri (+91 22 6637 7416) [email protected]
Pidilite Industries’ (Pidilite) consolidated revenues in Q3FY15 increased 12.6% YoY to Rs11.9bn and adjusted PAT grew 17.6% YoY to Rs1.26bn (I-Sec estimate: Rs1.4bn). Gross margins declined 90bps YoY at 43.9% due to consumption of high cost inventory. The management commentary suggested a 5% decline in 50% of the raw material (RM) index in Q3FY15. VAM prices (accounting for around 15% of raw material costs) declined from US$1500 to US$1350 and, are currently hovering around US$1200.
The impact of lower raw material cost will be partly visible in Q4FY15 while the full impact will be visible in subsequent quarters. Depreciation cost was higher 40% YoY at Rs307mn.
We have reduced our earnings estimate for FY15 by 2.1% incorporating lower topline growth and higher depreciation expenses, but have marginally raised FY16 earnings by 1.8% to factor in the benefit of lower raw material cost. However, we downgrade the stock to HOLD rating (earlier ADD) with a revised target price of Rs555 (earlier Rs426), valuing it at 33x FY17E earnings (earlier 28x average FY16 and FY17 earnings). We have increased the target multiple to reflect the higher earnings growth trajectory. We now expect earnings CAGR of 24.2% over FY14-FY17.
Table 1: Valuations summary
Y/E Mar
EPS (Rs)
P/E (x)
EV/E (x)
Price (29/01/15) (Rs) 576 2014 8.8 65.5 43.7 M.Cap. (Rs bn) 29552 wk Range (Rs) 583/273 2015E 10.6 54.1 37.4 M.Cap (US$ bn) 4.7Dividend yield FY15E (%) 0.6 2016E 13.8 41.7 29.3 Shares Out (mn) 512.6BSE Sensex 29682 2017E 16.8 34.2 23.9 Free Float (%) 29.2
Source: Company data, I-Sec Research
• Revenues up 12.6% YoY: Consolidated revenues grew 12.6% YoY to Rs11.9bn mainly on the back of a 3% YoY growth in the consumer and bazaar products segment. Industrial products segment reported a lower 5.2% YoY growth to Rs2.03bn. Standalone revenues were up 12.2% YoY to Rs10.75bn. Volumes grew around 8% in both the consumer & product segment and the industrial products segment. This implies some price reduction in the industrial products segment. In the white glue business (around 25% of the consolidated revenues), the company has however affected a 2% to 3% price increase during the quarter.
• Full benefit of raw material cost decline to be visible in subsequent quarters: Gross margins shrank 90bps YoY to 43.9% due to consumption of high cost inventory during the quarter. The management commentary suggested a 5% decline in 50% of the raw material index in Q3FY15. The impact of the lower raw material cost will be visible partly in Q4FY15, with the full impact visible in the subsequent quarters. Depreciation cost was higher by 40% YoY at Rs307mn.
• Downgrade to HOLD; revise estimates marginally: We have cut our earnings estimate for FY15 by 2.1% incorporating a lower topline growth and higher depreciation expenses; however, we have marginally raised our FY16 earnings by 1.8%, as we factor in the benefit of lower raw material cost. We however downgrade the stock to HOLD (earlier ADD) with a revised target price of Rs555 (earlier Rs426), valuing it at 33x FY17E earnings (earlier 28x average FY16 and FY17 earnings). We
Target price Rs555 Earnings revision (%) FY15E FY16E FY17E Sales ↓ 3.5 ↓ 5.9 ↓ 4.9 EBITDA ↓ 3.2 ↓ 0.3 ↓ 3.0 PAT ↓ 2.1 ↑ 1.8 ↓ 0.6 Target price revision Rs555 from Rs426
India Update, January 30, 2015 ICICI Securities
9
have increased the target multiple to reflect the higher earnings growth trajectory. We now expect earnings CAGR of 24.2% over FY14-FY17.
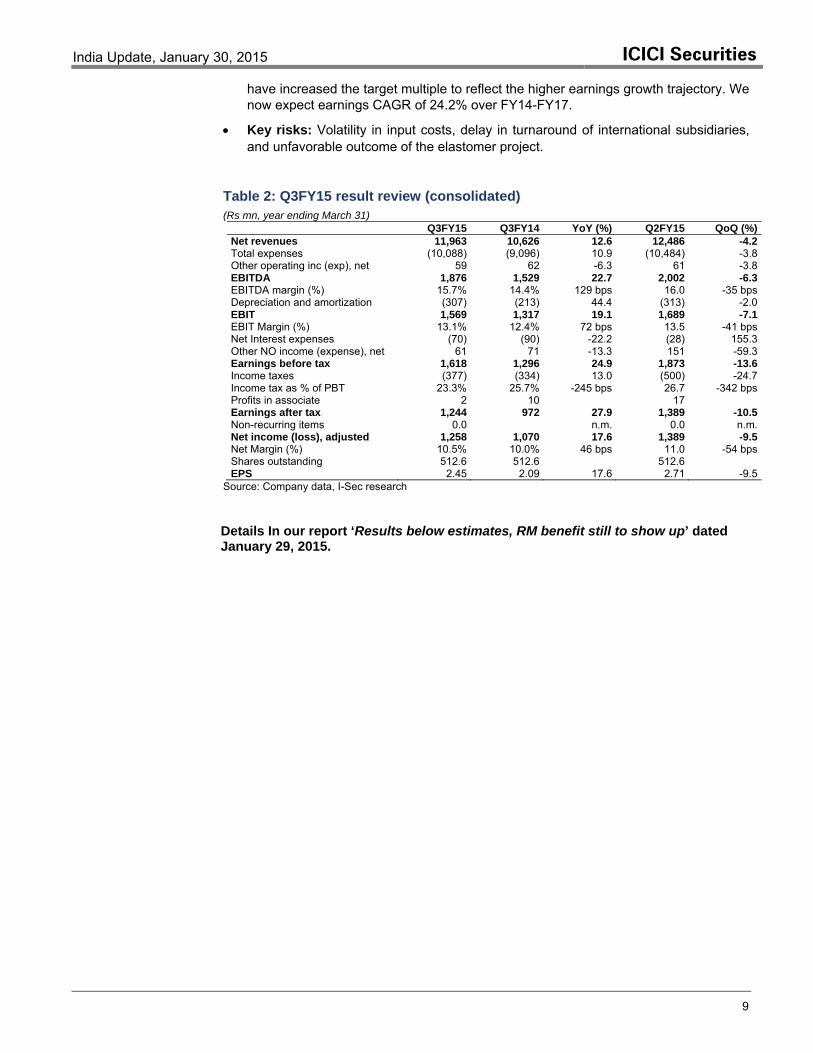
• Key risks: Volatility in input costs, delay in turnaround of international subsidiaries, and unfavorable outcome of the elastomer project.
Table 2: Q3FY15 result review (consolidated) (Rs mn, year ending March 31)
Q3FY15 Q3FY14 YoY (%) Q2FY15 QoQ (%)Net revenues 11,963 10,626 12.6 12,486 -4.2Total expenses (10,088) (9,096) 10.9 (10,484) -3.8Other operating inc (exp), net 59 62 -6.3 61 -3.8EBITDA 1,876 1,529 22.7 2,002 -6.3EBITDA margin (%) 15.7% 14.4% 129 bps 16.0 -35 bpsDepreciation and amortization (307) (213) 44.4 (313) -2.0EBIT 1,569 1,317 19.1 1,689 -7.1EBIT Margin (%) 13.1% 12.4% 72 bps 13.5 -41 bpsNet Interest expenses (70) (90) -22.2 (28) 155.3Other NO income (expense), net 61 71 -13.3 151 -59.3Earnings before tax 1,618 1,296 24.9 1,873 -13.6Income taxes (377) (334) 13.0 (500) -24.7Income tax as % of PBT 23.3% 25.7% -245 bps 26.7 -342 bpsProfits in associate 2 10 17 Earnings after tax 1,244 972 27.9 1,389 -10.5Non-recurring items 0.0 n.m. 0.0 n.m.Net income (loss), adjusted 1,258 1,070 17.6 1,389 -9.5Net Margin (%) 10.5% 10.0% 46 bps 11.0 -54 bpsShares outstanding 512.6 512.6 512.6 EPS 2.45 2.09 17.6 2.71 -9.5
Source: Company data, I-Sec research Details In our report ‘Results below estimates, RM benefit still to show up’ dated January 29, 2015.
India Update, January 30, 2015 ICICI Securities
10
IDFC (Buy) FINANCIALS Q3FY15 RESULT REVIEW AND EARNINGS REVISION
Preparations on in earnest Rs171 Santanu Chakrabarti (+91 22 6637 7351) [email protected] Yash Modi (+91 22 6637 7314) [email protected]
IDFC’s Q3FY15 earnings was in-line with consensus estimates but significantly below ours on the back of lower than expected other income and higher than expected provisioning. The key features of the result that stand out are:
• The company continues to provide heavily (31bps of assets provided towards loans in the quarter) and provisioning has now reached 3.9% of loan assets while GNPA levels stand stable at 0.68% (6bps QoQ increase in the quarter). Restructured loans also remained stable at 6.1% of total loans.
• Treasury investments increased 42% QoQ on a high base and stand at Rs254.6bn (29.5% of balance sheet assets). This should suffice as its entire SLR portfolio in IDFC bank! Clearly, this is an interest rate view that the company has taken, as the SLR build need not have been this fast and early.
• Growth remains elusive with loan assets declining 1.9% QoQ. The fact that this happened while telecom sector loans increased 8.2% QoQ shows that but for such short term low yield loans, book run-off is even higher. Energy and transportation sector loan book declined 4.4% and 4.2% respectively. With loan growth no longer an impediment to bank conversion (given zero regulatory cost of incremental project loan growth in a post-infra bond regulation dispensation) – the decline clearly points to a lack of suitable opportunities rather than management willingness.
• Operating costs remain high as expected with other (non-salary) operating costs at 17bps of assets vs earlier run-rate of 9-12bps per quarter. The company is obviously investing into bank-ready systems and processes.
Table 1: Valuations summary
Y/E Mar
EPS (Rs)
P/E (x)
EV/E (x)
Price (29/01/15) (Rs) 171 2014 12.1 14.1 1.9 M.Cap. (Rs bn) 27152 wk Range (Rs) 175/91 2015E 11.9 14.4 1.8 M.Cap (US$ bn) 4.4Dividend yield FY15E (%) 1.5 2016E 11.2 15.2 1.6 Shares Out (mn) 1590BSE Sensex 29682 2017E 14.9 11.5 1.5 Free Float (%) 100
Source: Company data, I-Sec Research
• We feel there is a strong case for the bank eventually trading north of 2x 1-yr fwd P/BVPS given its RoE profile (steady state ~22%) and roll over our TP to Rs225 from Rs220 (maintaining a target multiple of 1.9x 1-yr fwd P/ core BVPS, 10% holding company discount). Under the de-merger scheme, IDFC shareholders will get one share of the bank for every share held, residual ownership of the bank with NOFHC will be 53% (the share count of the bank will therefore be ~2.13x that of IDFC, the 3% buffer likely being kept for ESOP related dilutions). We maintain our BUY recommendation.
• New regulations enhance return profile and the freedom to grow. As we tried to quantify the impact of the infra bond regulation on the return profile of IDFC post bank conversion, we built in significant conservatism by assuming i) limited usage of the 7yr+ debt raising ceiling (as defined by the current document) ii) maintained RIDF deployment at levels that are frankly still ridiculously high (the deployment is a 350bps negative carry trade) and iii) nearly zero benefit of doubt in CASA sourcing, asset diversification and PSL asset origination. Despite all this the FY21E RoE is ~22% in our calculation. The actual return profile is likely to surprise on the upside in
Target price Rs225 Earnings revision
(%) FY15E FY16E NII ↑ 1.3 ↓ 22.0 PPoP ↓ 6.6 ↑ 3.1 PAT ↓10.6 ↑ 2.0
Source: I-Sec research Target price revision Rs225 from Rs220
India Update, January 30, 2015 ICICI Securities
11
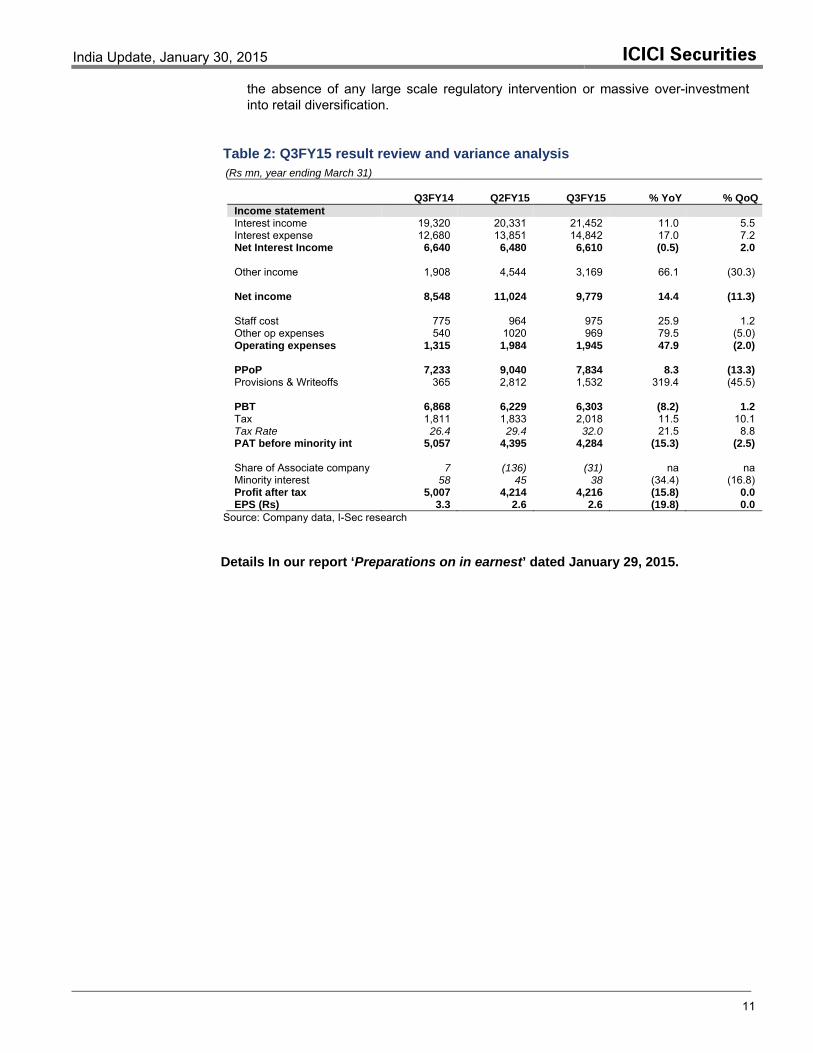
the absence of any large scale regulatory intervention or massive over-investment into retail diversification.
Table 2: Q3FY15 result review and variance analysis (Rs mn, year ending March 31)
Q3FY14 Q2FY15 Q3FY15 % YoY % QoQIncome statement Interest income 19,320 20,331 21,452 11.0 5.5 Interest expense 12,680 13,851 14,842 17.0 7.2 Net Interest Income 6,640 6,480 6,610 (0.5) 2.0 Other income 1,908 4,544 3,169 66.1 (30.3) Net income 8,548 11,024 9,779 14.4 (11.3) Staff cost 775 964 975 25.9 1.2 Other op expenses 540 1020 969 79.5 (5.0) Operating expenses 1,315 1,984 1,945 47.9 (2.0) PPoP 7,233 9,040 7,834 8.3 (13.3) Provisions & Writeoffs 365 2,812 1,532 319.4 (45.5) PBT 6,868 6,229 6,303 (8.2) 1.2 Tax 1,811 1,833 2,018 11.5 10.1 Tax Rate 26.4 29.4 32.0 21.5 8.8 PAT before minority int 5,057 4,395 4,284 (15.3) (2.5) Share of Associate company 7 (136) (31) na na Minority interest 58 45 38 (34.4) (16.8) Profit after tax 5,007 4,214 4,216 (15.8) 0.0 EPS (Rs) 3.3 2.6 2.6 (19.8) 0.0
Source: Company data, I-Sec research Details In our report ‘Preparations on in earnest’ dated January 29, 2015.
India Update, January 30, 2015 ICICI Securities
12
Torrent Pharma (Buy) PHARMA Q3FY15 RESULT REVIEW AND EARNINGS REVISION
Strong outlook for India business Rs1,138 Kartik Mehta (+91 22 6637 7230) [email protected] Gagan Borana (+91 22 6637 7480) [email protected]
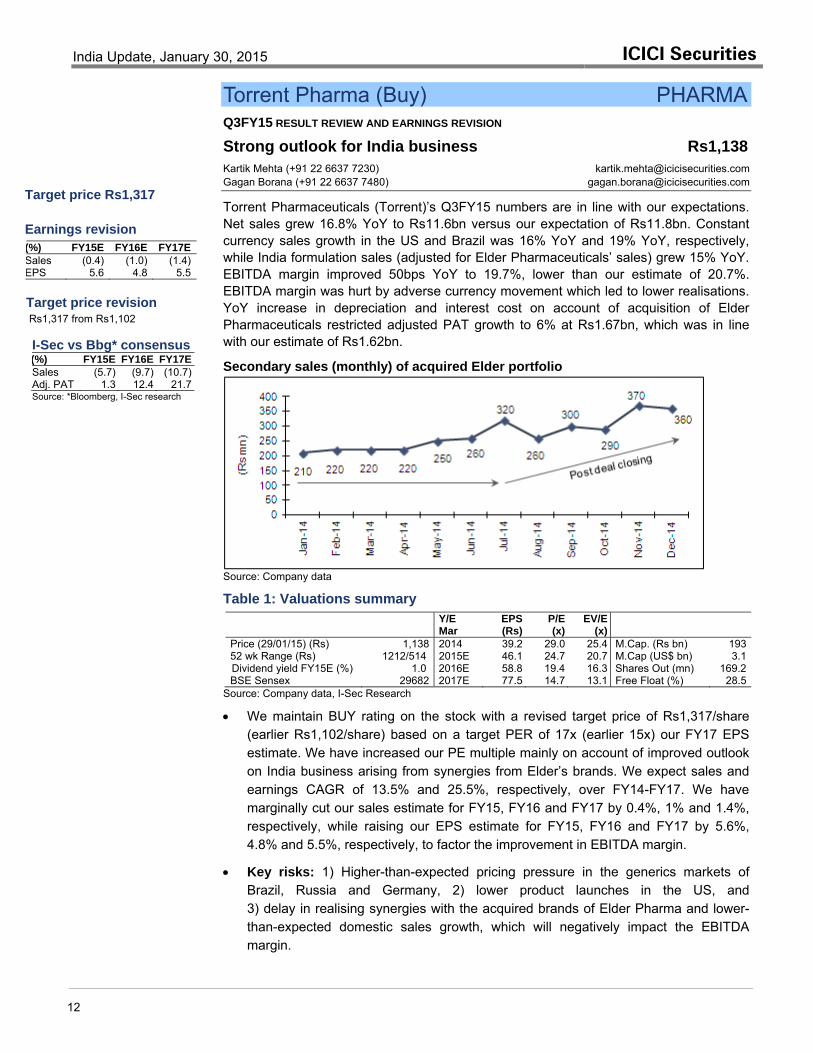
Torrent Pharmaceuticals (Torrent)’s Q3FY15 numbers are in line with our expectations. Net sales grew 16.8% YoY to Rs11.6bn versus our expectation of Rs11.8bn. Constant currency sales growth in the US and Brazil was 16% YoY and 19% YoY, respectively, while India formulation sales (adjusted for Elder Pharmaceuticals’ sales) grew 15% YoY. EBITDA margin improved 50bps YoY to 19.7%, lower than our estimate of 20.7%. EBITDA margin was hurt by adverse currency movement which led to lower realisations. YoY increase in depreciation and interest cost on account of acquisition of Elder Pharmaceuticals restricted adjusted PAT growth to 6% at Rs1.67bn, which was in line with our estimate of Rs1.62bn.
Secondary sales (monthly) of acquired Elder portfolio
Source: Company data
Table 1: Valuations summary
Y/E Mar
EPS (Rs)
P/E (x)
EV/E (x)
Price (29/01/15) (Rs) 1,138 2014 39.2 29.0 25.4 M.Cap. (Rs bn) 19352 wk Range (Rs) 1212/514 2015E 46.1 24.7 20.7 M.Cap (US$ bn) 3.1Dividend yield FY15E (%) 1.0 2016E 58.8 19.4 16.3 Shares Out (mn) 169.2BSE Sensex 29682 2017E 77.5 14.7 13.1 Free Float (%) 28.5
Source: Company data, I-Sec Research
• We maintain BUY rating on the stock with a revised target price of Rs1,317/share (earlier Rs1,102/share) based on a target PER of 17x (earlier 15x) our FY17 EPS estimate. We have increased our PE multiple mainly on account of improved outlook on India business arising from synergies from Elder’s brands. We expect sales and earnings CAGR of 13.5% and 25.5%, respectively, over FY14-FY17. We have marginally cut our sales estimate for FY15, FY16 and FY17 by 0.4%, 1% and 1.4%, respectively, while raising our EPS estimate for FY15, FY16 and FY17 by 5.6%, 4.8% and 5.5%, respectively, to factor the improvement in EBITDA margin.
• Key risks: 1) Higher-than-expected pricing pressure in the generics markets of Brazil, Russia and Germany, 2) lower product launches in the US, and 3) delay in realising synergies with the acquired brands of Elder Pharma and lower-than-expected domestic sales growth, which will negatively impact the EBITDA margin.
Target price Rs1,317 Earnings revision (%) FY15E FY16E FY17E Sales (0.4) (1.0) (1.4) EPS 5.6 4.8 5.5
Target price revision Rs1,317 from Rs1,102
I-Sec vs Bbg* consensus (%) FY15E FY16E FY17E Sales (5.7) (9.7) (10.7) Adj. PAT 1.3 12.4 21.7 Source: *Bloomberg, I-Sec research
India Update, January 30, 2015 ICICI Securities
13
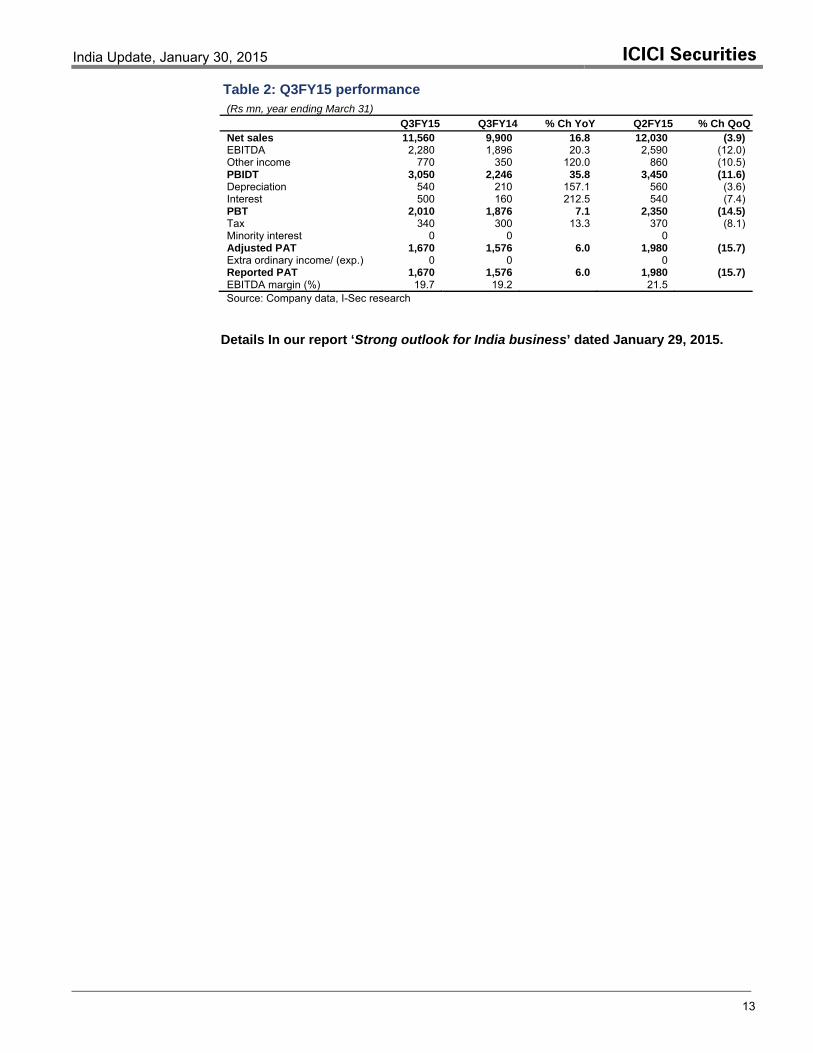
Table 2: Q3FY15 performance (Rs mn, year ending March 31) Q3FY15 Q3FY14 % Ch YoY Q2FY15 % Ch QoQNet sales 11,560 9,900 16.8 12,030 (3.9) EBITDA 2,280 1,896 20.3 2,590 (12.0) Other income 770 350 120.0 860 (10.5) PBIDT 3,050 2,246 35.8 3,450 (11.6) Depreciation 540 210 157.1 560 (3.6) Interest 500 160 212.5 540 (7.4) PBT 2,010 1,876 7.1 2,350 (14.5) Tax 340 300 13.3 370 (8.1) Minority interest 0 0 0 Adjusted PAT 1,670 1,576 6.0 1,980 (15.7) Extra ordinary income/ (exp.) 0 0 0 Reported PAT 1,670 1,576 6.0 1,980 (15.7) EBITDA margin (%) 19.7 19.2 21.5 Source: Company data, I-Sec research
Details In our report ‘Strong outlook for India business’ dated January 29, 2015.
India Update, January 30, 2015 ICICI Securities
14
Havells India (Add) MID-CAP Q3FY15 RESULT REVIEW AND EARNINGS REVISION
Weak domestic sales, one-offs at Sylvania mar results Rs263 Vikash Mantri (+91 22 6637 7161) [email protected] Jayant Dongre (+91 22 6637 7339) [email protected]
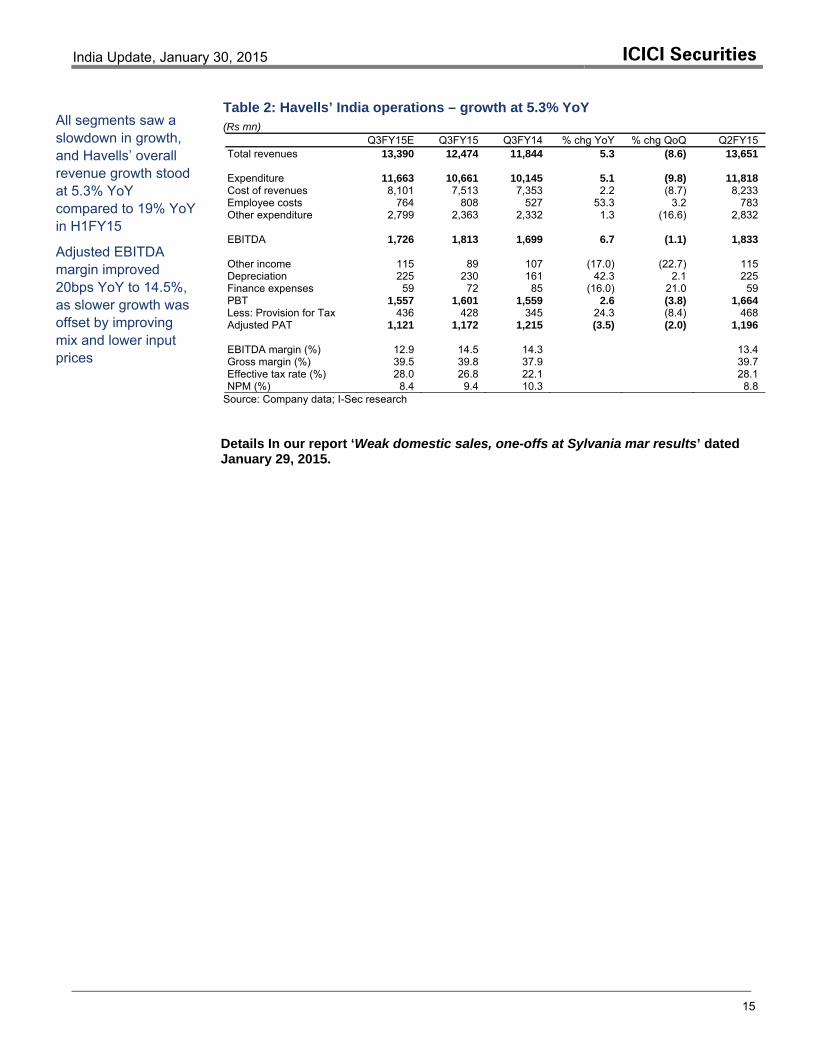
Havells India’s (Havells) reported weak numbers with a 5.3%YoY domestic revenue growth albeit in line with pre-result management commentary on slowdown in the overall market. Standalone EBITDA margin increased by 20bps YoY to 14.5% driven by strong cost control and revenue mix enabling better contribution margins from the lighting and cables division. Major disappointment came from Sylvania owing to various one-time costs (below EBITDA) which led to EUR10.7mn loss (I-Sec: PAT of EUR0.7mn). Consumer sentiment on the ground remains weak as evident by similar comments from companies like TTK Prestige and V-Guard. The Havells management continues to guide for a similar growth in Q4FY15 but remains hopeful of recovery going forward. We cut our standalone sales forecasts for Havells on continued weak consumer sentiment and have reduced our Sylvania estimates to factor increased pension costs, forex-related losses, other one-offs as well as lower exchange rate (EUR/INR at 72 vs 80 earlier) post-FY16. We raise our DCF-based target price for the stock to Rs295, as we roll forward to FY16E which offsets the earnings cut. We maintain our ADD rating on Havells and recommend buying on dips.
Table 1: Valuations summary
Y/E Mar
EPS (Rs)
P/E (x)
EV/E (x)
Price (29/01/15) (Rs) 263 2014 7.2 36.8 21.8 M.Cap. (Rs bn) 16452 wk Range (Rs) 347/151 2015E 6.5 40.5 20.1 M.Cap (US$ bn) 2.7Dividend yield FY15E (%) 1.2 2016E 10.7 24.6 15.6 Shares Out (mn) 624BSE Sensex 29682 2017E 13.5 19.4 12.6 Free Float (%) 38.4
Source: Company data, I-Sec Research
• Standalone India business grew 5.3% YoY as growth slowed across all segments. EBITDA was marginally ahead of our estimate at Rs1.81bn (I-Sec: Rs1.73bn) mainly on better contribution due to improved mix (higher sales from domestic cable and high-margin fixtures). Electric Cons. durables was the only segment that posted double-digit growth, while the Lighting and Fixtures business was flat YoY as growth in LED offset decline in traditional luminaries. We have cut our sales growth forecast to 12.3%, 14.6% and 14.6% for FY15, FY16 and FY17 (earlier 18.4%, 17.4% and 16.5%) respectively.
• Sylvania – one-offs impact results: Sylvania’s revenues at EUR111mn were marginally weaker than expected. Europe growth slowed to 2.6% YoY after a good Q2FY15 and Americas growth of 7% YoY was impacted by the weaker euro. However, adjusted EBITDA margin of 5.0% (I-Sec: 5.1%) was in line with expectation. EBITDA includes a one-off charge of EUR2.9mn owing to sales return and rebate in Thailand. Below EBITDA, there were other one-offs: pensions costs (EUR6.1mn), fixed asset impairment (EUR1.3mn) and retrospective tax assessment in Italy (EUR2mn). Considering the one-offs and lower EUR/INR, we have reduced our sales, reported EBITDA and PAT estimates by 11%, 22% and 30% for FY16 and 11%, 17% and 21% for FY17 respectively.
• Raise target price to Rs295, maintain ADD: We increase our target price for Havells to Rs295/share (earlier Rs278/share) on the back of rollover of DCF to FY16E, which offset the lower earnings estimates. We value Havells’ standalone at Rs290, implying a P/E of 24.4x FY17E. We attribute Rs5/share for Sylvania and maintain our ADD rating. We recommend adding the stock on dips.
Target price Rs295 Earnings revision (%) FY15E FY16E FY17E Sales ↓ 5.7 ↓ 8.9 ↓ 9.8 EBITDA ↓ 14.9 ↓ 9.9 ↓ 7.9 EPS ↓ 32.2 ↓ 12.1 ↓ 10.0 Target price revision Rs295 from Rs278
India Update, January 30, 2015 ICICI Securities
15
Table 2: Havells’ India operations – growth at 5.3% YoY (Rs mn)
Q3FY15E Q3FY15 Q3FY14 % chg YoY % chg QoQ Q2FY15 Total revenues 13,390 12,474 11,844 5.3 (8.6) 13,651 Expenditure 11,663 10,661 10,145 5.1 (9.8) 11,818 Cost of revenues 8,101 7,513 7,353 2.2 (8.7) 8,233 Employee costs 764 808 527 53.3 3.2 783 Other expenditure 2,799 2,363 2,332 1.3 (16.6) 2,832
EBITDA 1,726 1,813 1,699 6.7 (1.1) 1,833 Other income 115 89 107 (17.0) (22.7) 115 Depreciation 225 230 161 42.3 2.1 225 Finance expenses 59 72 85 (16.0) 21.0 59 PBT 1,557 1,601 1,559 2.6 (3.8) 1,664 Less: Provision for Tax 436 428 345 24.3 (8.4) 468 Adjusted PAT 1,121 1,172 1,215 (3.5) (2.0) 1,196 EBITDA margin (%) 12.9 14.5 14.3 13.4 Gross margin (%) 39.5 39.8 37.9 39.7 Effective tax rate (%) 28.0 26.8 22.1 28.1 NPM (%) 8.4 9.4 10.3 8.8
Source: Company data; I-Sec research Details In our report ‘Weak domestic sales, one-offs at Sylvania mar results’ dated January 29, 2015.
All segments saw a slowdown in growth, and Havells’ overall revenue growth stood at 5.3% YoY compared to 19% YoY in H1FY15
Adjusted EBITDA margin improved 20bps YoY to 14.5%, as slower growth was offset by improving mix and lower input prices
India Update, January 30, 2015 ICICI Securities
16
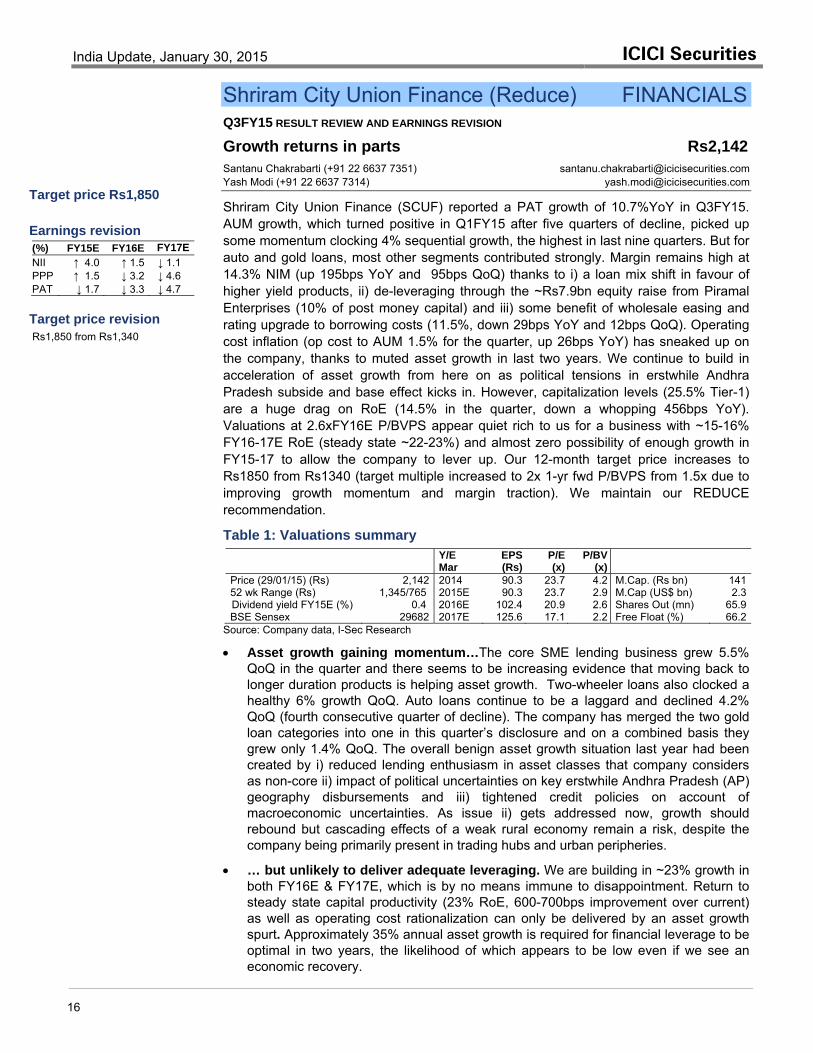
Shriram City Union Finance (Reduce) FINANCIALS Q3FY15 RESULT REVIEW AND EARNINGS REVISION
Growth returns in parts Rs2,142 Santanu Chakrabarti (+91 22 6637 7351) [email protected] Yash Modi (+91 22 6637 7314) [email protected]
Shriram City Union Finance (SCUF) reported a PAT growth of 10.7%YoY in Q3FY15. AUM growth, which turned positive in Q1FY15 after five quarters of decline, picked up some momentum clocking 4% sequential growth, the highest in last nine quarters. But for auto and gold loans, most other segments contributed strongly. Margin remains high at 14.3% NIM (up 195bps YoY and 95bps QoQ) thanks to i) a loan mix shift in favour of higher yield products, ii) de-leveraging through the ~Rs7.9bn equity raise from Piramal Enterprises (10% of post money capital) and iii) some benefit of wholesale easing and rating upgrade to borrowing costs (11.5%, down 29bps YoY and 12bps QoQ). Operating cost inflation (op cost to AUM 1.5% for the quarter, up 26bps YoY) has sneaked up on the company, thanks to muted asset growth in last two years. We continue to build in acceleration of asset growth from here on as political tensions in erstwhile Andhra Pradesh subside and base effect kicks in. However, capitalization levels (25.5% Tier-1) are a huge drag on RoE (14.5% in the quarter, down a whopping 456bps YoY). Valuations at 2.6xFY16E P/BVPS appear quiet rich to us for a business with ~15-16% FY16-17E RoE (steady state ~22-23%) and almost zero possibility of enough growth in FY15-17 to allow the company to lever up. Our 12-month target price increases to Rs1850 from Rs1340 (target multiple increased to 2x 1-yr fwd P/BVPS from 1.5x due to improving growth momentum and margin traction). We maintain our REDUCE recommendation.
Table 1: Valuations summary
Y/E Mar
EPS (Rs)
P/E (x)
P/BV (x)
Price (29/01/15) (Rs) 2,142 2014 90.3 23.7 4.2 M.Cap. (Rs bn) 14152 wk Range (Rs) 1,345/765 2015E 90.3 23.7 2.9 M.Cap (US$ bn) 2.3Dividend yield FY15E (%) 0.4 2016E 102.4 20.9 2.6 Shares Out (mn) 65.9BSE Sensex 29682 2017E 125.6 17.1 2.2 Free Float (%) 66.2
Source: Company data, I-Sec Research
• Asset growth gaining momentum…The core SME lending business grew 5.5% QoQ in the quarter and there seems to be increasing evidence that moving back to longer duration products is helping asset growth. Two-wheeler loans also clocked a healthy 6% growth QoQ. Auto loans continue to be a laggard and declined 4.2% QoQ (fourth consecutive quarter of decline). The company has merged the two gold loan categories into one in this quarter’s disclosure and on a combined basis they grew only 1.4% QoQ. The overall benign asset growth situation last year had been created by i) reduced lending enthusiasm in asset classes that company considers as non-core ii) impact of political uncertainties on key erstwhile Andhra Pradesh (AP) geography disbursements and iii) tightened credit policies on account of macroeconomic uncertainties. As issue ii) gets addressed now, growth should rebound but cascading effects of a weak rural economy remain a risk, despite the company being primarily present in trading hubs and urban peripheries.
• … but unlikely to deliver adequate leveraging. We are building in ~23% growth in both FY16E & FY17E, which is by no means immune to disappointment. Return to steady state capital productivity (23% RoE, 600-700bps improvement over current) as well as operating cost rationalization can only be delivered by an asset growth spurt. Approximately 35% annual asset growth is required for financial leverage to be optimal in two years, the likelihood of which appears to be low even if we see an economic recovery.
Target price Rs1,850 Earnings revision (%) FY15E FY16E FY17E NII ↑ 4.0 ↑ 1.5 ↓ 1.1 PPP ↑ 1.5 ↓ 3.2 ↓ 4.6 PAT ↓ 1.7 ↓ 3.3 ↓ 4.7 Target price revision Rs1,850 from Rs1,340
India Update, January 30, 2015 ICICI Securities
17
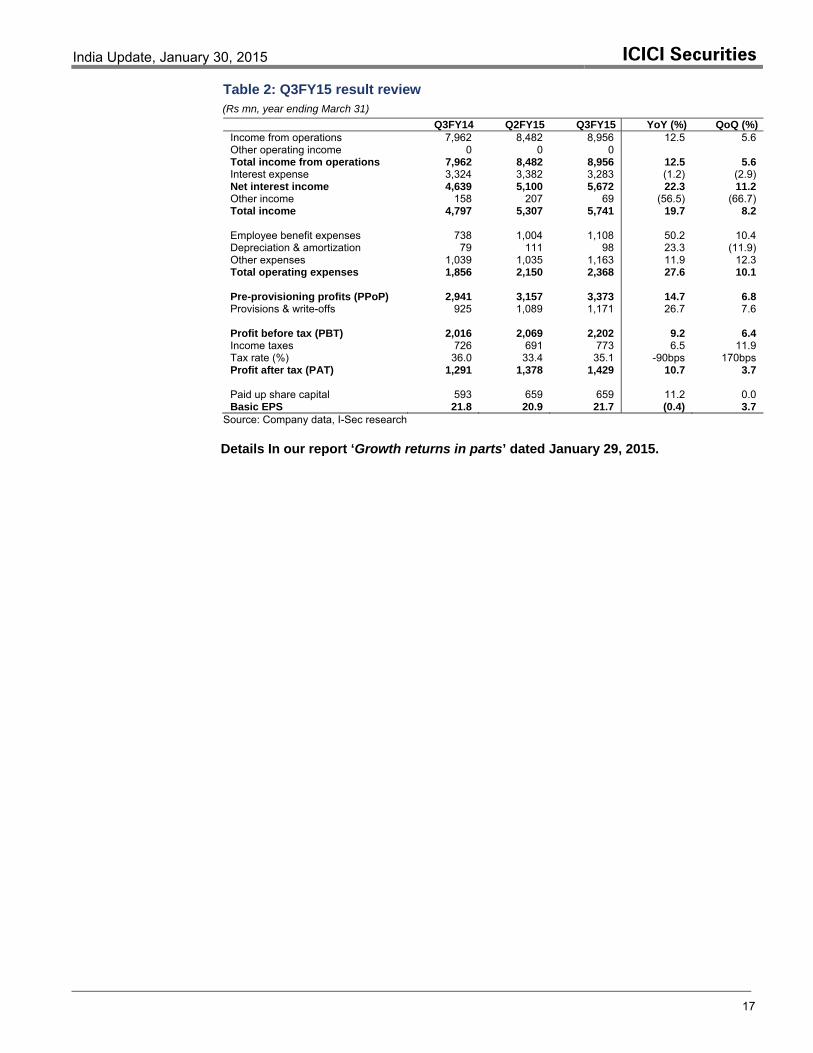
Table 2: Q3FY15 result review (Rs mn, year ending March 31)
Q3FY14 Q2FY15 Q3FY15 YoY (%) QoQ (%)Income from operations 7,962 8,482 8,956 12.5 5.6 Other operating income 0 0 0 Total income from operations 7,962 8,482 8,956 12.5 5.6 Interest expense 3,324 3,382 3,283 (1.2) (2.9) Net interest income 4,639 5,100 5,672 22.3 11.2 Other income 158 207 69 (56.5) (66.7) Total income 4,797 5,307 5,741 19.7 8.2 Employee benefit expenses 738 1,004 1,108 50.2 10.4 Depreciation & amortization 79 111 98 23.3 (11.9) Other expenses 1,039 1,035 1,163 11.9 12.3 Total operating expenses 1,856 2,150 2,368 27.6 10.1 Pre-provisioning profits (PPoP) 2,941 3,157 3,373 14.7 6.8 Provisions & write-offs 925 1,089 1,171 26.7 7.6 Profit before tax (PBT) 2,016 2,069 2,202 9.2 6.4 Income taxes 726 691 773 6.5 11.9 Tax rate (%) 36.0 33.4 35.1 -90bps 170bps Profit after tax (PAT) 1,291 1,378 1,429 10.7 3.7 Paid up share capital 593 659 659 11.2 0.0 Basic EPS 21.8 20.9 21.7 (0.4) 3.7
Source: Company data, I-Sec research Details In our report ‘Growth returns in parts’ dated January 29, 2015.
India Update, January 30, 2015 ICICI Securities
18
Oriental Bank of Commerce (Reduce) BANKING Q3FY15 RESULT REVIEW AND EARNINGS REVISION
On a slippery wicket Rs241 Shashin Upadhyay (+91 22 6637 7572) [email protected] Parul Gulati (+91 22 6637 7510) [email protected]
Oriental Bank of Commerce (OBC)’s Q3FY15 performance was marred by continued stress on asset quality and income reversals on earlier sale of NPAs to ARC. Bad assets accretion is at all-time high and the outlook continues to remain dim especially given the rising loan exposure to risky segments. NIM improved sequentially despite higher slippages, sharp decline in CD ratio and decline in proportion of CASA deposits, and was aided by higher decline in cost of deposits. Operating performance was further aided by significantly higher trading gains and lower other expenses, but this is unlikely to remain a trend. We do not estimate significant pressure on core spreads, partially aided by the management’s strategy to focus on the same over business growth. However, improvement in asset quality could take longer time than was earlier estimated, leading to higher gross slippages and provisioning estimates for FY16E. We maintain REDUCE rating on the stock due to rising slippages and low RoE at 9.1%/12% in FY15/FY16. Our target price of Rs266 discounts FY17E P/AdjBV by 0.6x.
Table 1: Valuations summary
Y/E Mar
EPS (Rs)
P/E (x)
P/BV (x)
Price (29/01/15) (Rs) 241 2014 45.5 3.8 0.4 M.Cap. (Rs bn) 82.352 wk Range (Rs) 366/162 2015E 42.2 4.1 0.4 M.Cap (US$ bn) 1.3Dividend yield FY15E (%) 2.3 2016E 56.4 3.1 0.4 Shares Out (mn) 292.9BSE Sensex 29682 2017E 61.7 2.8 0.3 Free Float (%) 40.9
Source: Company data, I-Sec Research
• Asset quality under scanner again: Total bad assets (gross slippages + incremental restructuring) spiked to Rs34bn, 10.2% (annualized) of loans, compared to Rs17bn in Q2FY15. Slippages stood at 3.8% (annualized) of loans, with restructured loans contributing 54%. Despite higher slippages from the restructuring book, the outstanding restructured loans came in higher at 9.0%, with incremental restructuring at 6.2% (annualized) of loans. The asset quality headwinds are unlikely to abate in near future as – a) improvement in economy is coming with lag, b) management raising its gross slippage guidance for Q4FY15E to 0.7% of loans, and c) indicative pipeline for incremental restructuring in Q4FY15E to be at 1.4% of loans. We therefore raise our gross slippage estimates to 2.7% for FY15E and 1.4% for FY16E.
• Margins driven by cost control; profit on sale to ARC reversals drive earnings lower: Despite higher slippages, decline in the CASA proportion to 23.7% and a sharp decline of 400bps in CD ratio, the NIMs at 2.69% improved by 6bps QoQ, aided by a 12bps QoQ improvement in core spreads (reported) led by a 15bps decline in cost of deposits. The NIMs were also impacted by booking of higher treasury gains, which stood at 0.3% of average investments annualized. The management’s strategy to focus on maintaining spreads over higher loan growth will augur well with margins and, we estimate them to improve to 2.5% and 2.6% in FY16E and FY17E, respectively. OBC has reversed Rs1.37bn of profits booked on issue of security receipts for sell down of NPAs to ARC, leading to a sharp rise in provisions to 0.7% of loans. It also has to reverse Rs2.8bn of similar adjustment and management indicates that it is in consultation with RBI to account for these in FY16E. We see elevated provisioning for FY15E and FY16E at 1.8% and 1.1% of total loans, respectively.
Target price Rs266 Earnings revision (%) FY15E FY16E Loans ↓ 2.6 ↓ 2.6 Deposits ↑ 1.3 ↑ 1.5 NII ↑ 1.5 ↑ 3.7 PPP ↑ 3.5 ↑ 1.7 PAT ↓15.6 ↓ 7.6 Adj BV ↓10.3 ↓ 8.2
India Update, January 30, 2015 ICICI Securities
19
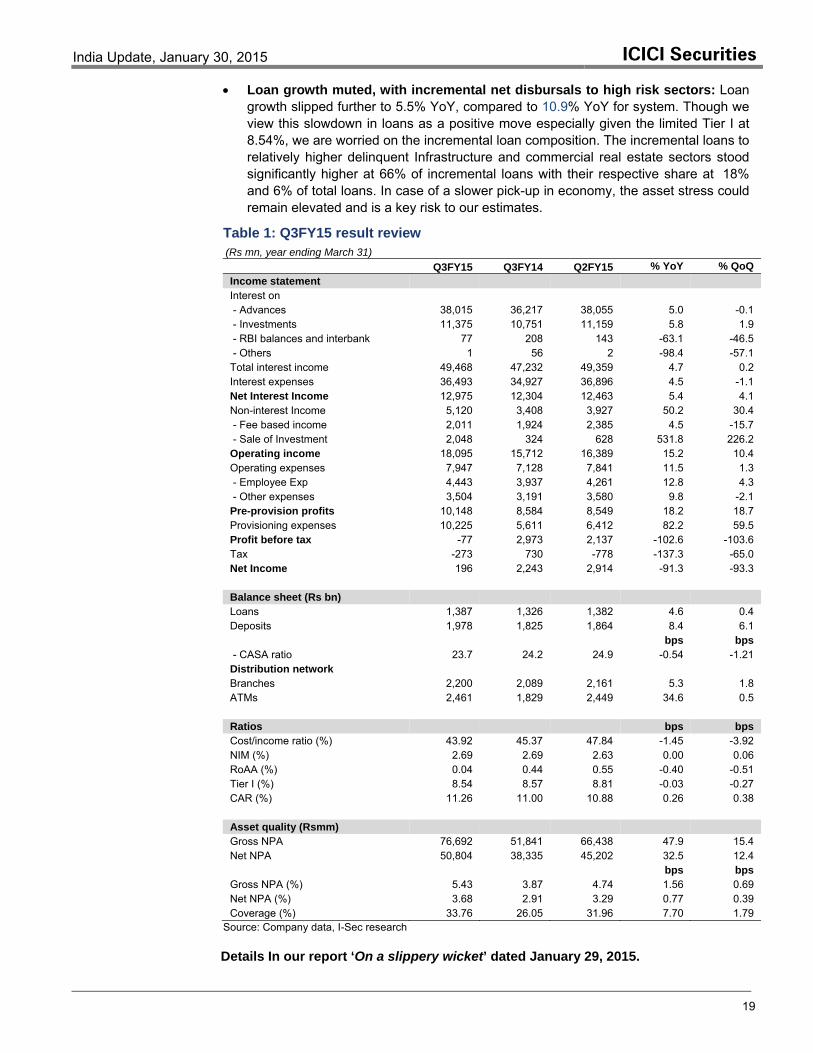
• Loan growth muted, with incremental net disbursals to high risk sectors: Loan growth slipped further to 5.5% YoY, compared to 10.9% YoY for system. Though we view this slowdown in loans as a positive move especially given the limited Tier I at 8.54%, we are worried on the incremental loan composition. The incremental loans to relatively higher delinquent Infrastructure and commercial real estate sectors stood significantly higher at 66% of incremental loans with their respective share at 18% and 6% of total loans. In case of a slower pick-up in economy, the asset stress could remain elevated and is a key risk to our estimates.
Table 1: Q3FY15 result review (Rs mn, year ending March 31)
Q3FY15 Q3FY14 Q2FY15 % YoY % QoQ Income statement Interest on - Advances 38,015 36,217 38,055 5.0 -0.1 - Investments 11,375 10,751 11,159 5.8 1.9 - RBI balances and interbank 77 208 143 -63.1 -46.5 - Others 1 56 2 -98.4 -57.1 Total interest income 49,468 47,232 49,359 4.7 0.2 Interest expenses 36,493 34,927 36,896 4.5 -1.1 Net Interest Income 12,975 12,304 12,463 5.4 4.1 Non-interest Income 5,120 3,408 3,927 50.2 30.4 - Fee based income 2,011 1,924 2,385 4.5 -15.7 - Sale of Investment 2,048 324 628 531.8 226.2 Operating income 18,095 15,712 16,389 15.2 10.4 Operating expenses 7,947 7,128 7,841 11.5 1.3 - Employee Exp 4,443 3,937 4,261 12.8 4.3 - Other expenses 3,504 3,191 3,580 9.8 -2.1 Pre-provision profits 10,148 8,584 8,549 18.2 18.7 Provisioning expenses 10,225 5,611 6,412 82.2 59.5 Profit before tax -77 2,973 2,137 -102.6 -103.6 Tax -273 730 -778 -137.3 -65.0 Net Income 196 2,243 2,914 -91.3 -93.3 Balance sheet (Rs bn) Loans 1,387 1,326 1,382 4.6 0.4 Deposits 1,978 1,825 1,864 8.4 6.1 bps bps - CASA ratio 23.7 24.2 24.9 -0.54 -1.21 Distribution network Branches 2,200 2,089 2,161 5.3 1.8 ATMs 2,461 1,829 2,449 34.6 0.5 Ratios bps bps Cost/income ratio (%) 43.92 45.37 47.84 -1.45 -3.92 NIM (%) 2.69 2.69 2.63 0.00 0.06 RoAA (%) 0.04 0.44 0.55 -0.40 -0.51 Tier I (%) 8.54 8.57 8.81 -0.03 -0.27 CAR (%) 11.26 11.00 10.88 0.26 0.38 Asset quality (Rsmm) Gross NPA 76,692 51,841 66,438 47.9 15.4 Net NPA 50,804 38,335 45,202 32.5 12.4 bps bps Gross NPA (%) 5.43 3.87 4.74 1.56 0.69 Net NPA (%) 3.68 2.91 3.29 0.77 0.39 Coverage (%) 33.76 26.05 31.96 7.70 1.79
Source: Company data, I-Sec research Details In our report ‘On a slippery wicket’ dated January 29, 2015.
India Update, January 30, 2015 ICICI Securities
20
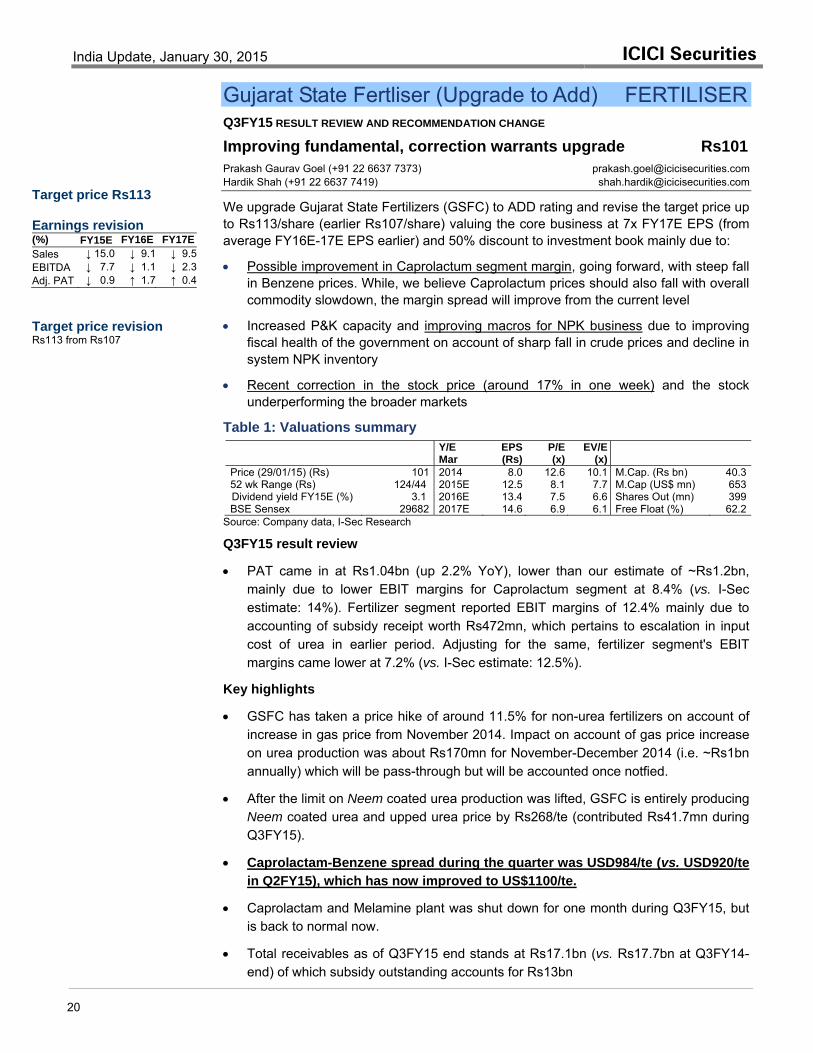
Gujarat State Fertliser (Upgrade to Add) FERTILISER Q3FY15 RESULT REVIEW AND RECOMMENDATION CHANGE
Improving fundamental, correction warrants upgrade Rs101 Prakash Gaurav Goel (+91 22 6637 7373) [email protected] Hardik Shah (+91 22 6637 7419) [email protected]
We upgrade Gujarat State Fertilizers (GSFC) to ADD rating and revise the target price up to Rs113/share (earlier Rs107/share) valuing the core business at 7x FY17E EPS (from average FY16E-17E EPS earlier) and 50% discount to investment book mainly due to:
• Possible improvement in Caprolactum segment margin, going forward, with steep fall in Benzene prices. While, we believe Caprolactum prices should also fall with overall commodity slowdown, the margin spread will improve from the current level
• Increased P&K capacity and improving macros for NPK business due to improving fiscal health of the government on account of sharp fall in crude prices and decline in system NPK inventory
• Recent correction in the stock price (around 17% in one week) and the stock underperforming the broader markets
Table 1: Valuations summary
Y/E Mar
EPS (Rs)
P/E (x)
EV/E (x)
Price (29/01/15) (Rs) 101 2014 8.0 12.6 10.1 M.Cap. (Rs bn) 40.352 wk Range (Rs) 124/44 2015E 12.5 8.1 7.7 M.Cap (US$ mn) 653Dividend yield FY15E (%) 3.1 2016E 13.4 7.5 6.6 Shares Out (mn) 399BSE Sensex 29682 2017E 14.6 6.9 6.1 Free Float (%) 62.2
Source: Company data, I-Sec Research
Q3FY15 result review
• PAT came in at Rs1.04bn (up 2.2% YoY), lower than our estimate of ~Rs1.2bn, mainly due to lower EBIT margins for Caprolactum segment at 8.4% (vs. I-Sec estimate: 14%). Fertilizer segment reported EBIT margins of 12.4% mainly due to accounting of subsidy receipt worth Rs472mn, which pertains to escalation in input cost of urea in earlier period. Adjusting for the same, fertilizer segment's EBIT margins came lower at 7.2% (vs. I-Sec estimate: 12.5%).
Key highlights
• GSFC has taken a price hike of around 11.5% for non-urea fertilizers on account of increase in gas price from November 2014. Impact on account of gas price increase on urea production was about Rs170mn for November-December 2014 (i.e. ~Rs1bn annually) which will be pass-through but will be accounted once notfied.
• After the limit on Neem coated urea production was lifted, GSFC is entirely producing Neem coated urea and upped urea price by Rs268/te (contributed Rs41.7mn during Q3FY15).
• Caprolactam-Benzene spread during the quarter was USD984/te (vs. USD920/te in Q2FY15), which has now improved to US$1100/te.
• Caprolactam and Melamine plant was shut down for one month during Q3FY15, but is back to normal now.
• Total receivables as of Q3FY15 end stands at Rs17.1bn (vs. Rs17.7bn at Q3FY14-end) of which subsidy outstanding accounts for Rs13bn
Target price Rs113 Earnings revision (%) FY15E FY16E FY17E Sales ↓ 15.0 ↓ 9.1 ↓ 9.5 EBITDA ↓ 7.7 ↓ 1.1 ↓ 2.3 Adj. PAT ↓ 0.9 ↑ 1.7 ↑ 0.4 Target price revision Rs113 from Rs107
India Update, January 30, 2015 ICICI Securities
21
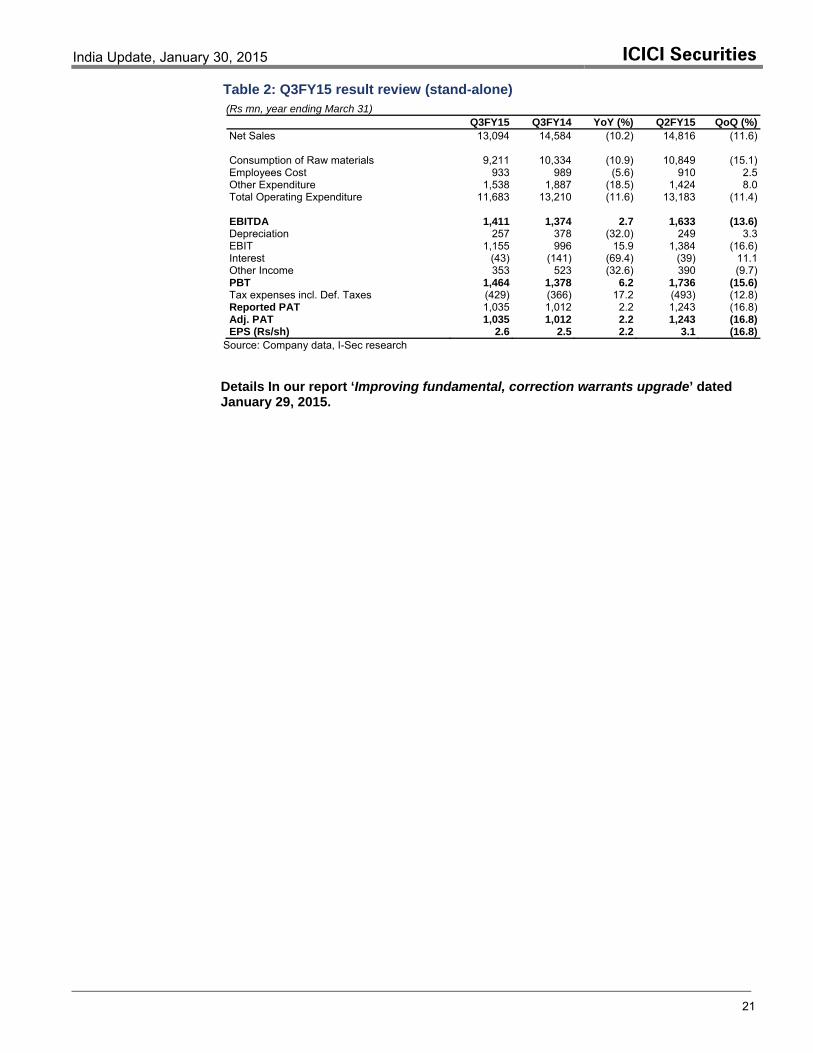
Table 2: Q3FY15 result review (stand-alone) (Rs mn, year ending March 31)
Q3FY15 Q3FY14 YoY (%) Q2FY15 QoQ (%)Net Sales 13,094 14,584 (10.2) 14,816 (11.6) Consumption of Raw materials 9,211 10,334 (10.9) 10,849 (15.1)Employees Cost 933 989 (5.6) 910 2.5Other Expenditure 1,538 1,887 (18.5) 1,424 8.0Total Operating Expenditure 11,683 13,210 (11.6) 13,183 (11.4) EBITDA 1,411 1,374 2.7 1,633 (13.6)Depreciation 257 378 (32.0) 249 3.3EBIT 1,155 996 15.9 1,384 (16.6)Interest (43) (141) (69.4) (39) 11.1Other Income 353 523 (32.6) 390 (9.7)PBT 1,464 1,378 6.2 1,736 (15.6)Tax expenses incl. Def. Taxes (429) (366) 17.2 (493) (12.8)Reported PAT 1,035 1,012 2.2 1,243 (16.8)Adj. PAT 1,035 1,012 2.2 1,243 (16.8)EPS (Rs/sh) 2.6 2.5 2.2 3.1 (16.8)
Source: Company data, I-Sec research Details In our report ‘Improving fundamental, correction warrants upgrade’ dated January 29, 2015.
India Update, January 30, 2015 ICICI Securities
22
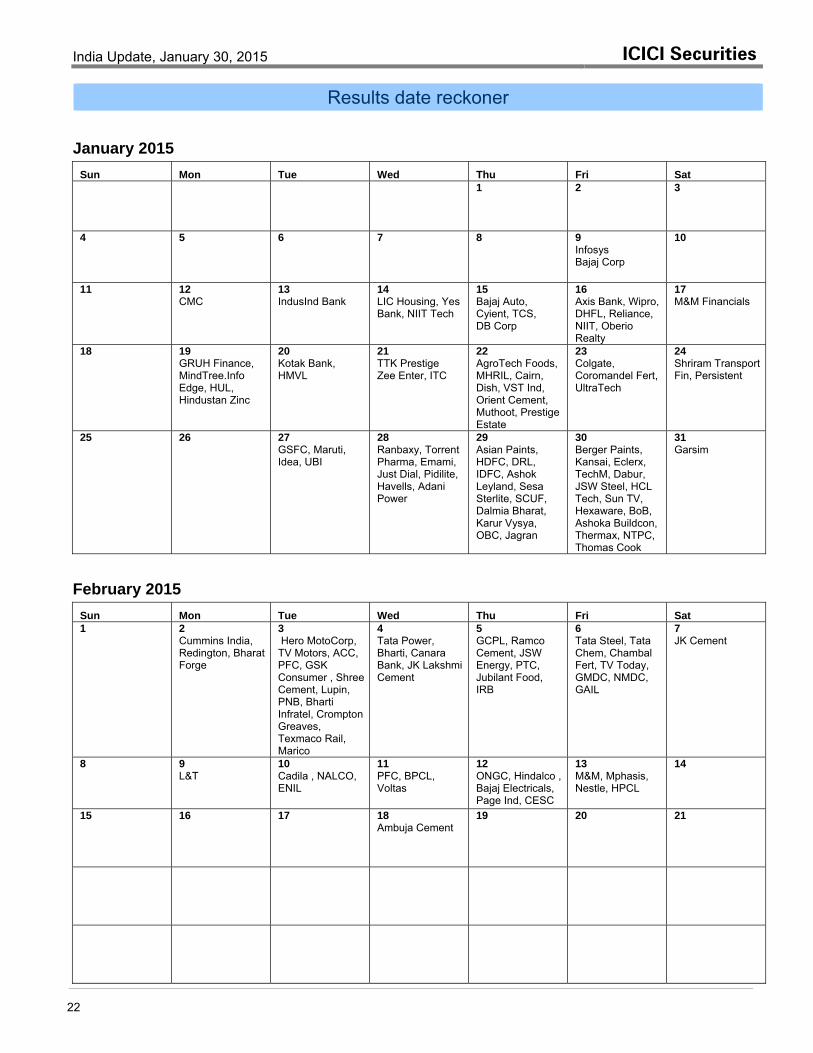
Results date reckoner
January 2015
Sun Mon Tue Wed Thu Fri Sat 1 2 3
4 5 6 7 8 9 Infosys Bajaj Corp
10
11 12 CMC
13 IndusInd Bank
14 LIC Housing, Yes Bank, NIIT Tech
15 Bajaj Auto, Cyient, TCS, DB Corp
16 Axis Bank, Wipro, DHFL, Reliance, NIIT, Oberio Realty
17 M&M Financials
18 19 GRUH Finance, MindTree.Info Edge, HUL, Hindustan Zinc
20 Kotak Bank, HMVL
21 TTK Prestige Zee Enter, ITC
22 AgroTech Foods, MHRIL, Cairn, Dish, VST Ind, Orient Cement, Muthoot, Prestige Estate
23 Colgate, Coromandel Fert, UltraTech
24 Shriram Transport Fin, Persistent
25 26 27 GSFC, Maruti, Idea, UBI
28 Ranbaxy, Torrent Pharma, Emami, Just Dial, Pidilite, Havells, Adani Power
29 Asian Paints, HDFC, DRL, IDFC, Ashok Leyland, Sesa Sterlite, SCUF, Dalmia Bharat, Karur Vysya, OBC, Jagran
30 Berger Paints, Kansai, Eclerx, TechM, Dabur, JSW Steel, HCL Tech, Sun TV, Hexaware, BoB, Ashoka Buildcon, Thermax, NTPC, Thomas Cook
31 Garsim
February 2015
Sun Mon Tue Wed Thu Fri Sat 1 2
Cummins India, Redington, Bharat Forge
3 Hero MotoCorp, TV Motors, ACC, PFC, GSK Consumer , Shree Cement, Lupin, PNB, Bharti Infratel, Crompton Greaves, Texmaco Rail, Marico
4 Tata Power, Bharti, Canara Bank, JK Lakshmi Cement
5 GCPL, Ramco Cement, JSW Energy, PTC, Jubilant Food, IRB
6 Tata Steel, Tata Chem, Chambal Fert, TV Today, GMDC, NMDC, GAIL
7 JK Cement
8 9 L&T
10 Cadila , NALCO, ENIL
11 PFC, BPCL, Voltas
12 ONGC, Hindalco , Bajaj Electricals, Page Ind, CESC
13 M&M, Mphasis, Nestle, HPCL
14
15 16 17 18 Ambuja Cement
19
20 21
India Update, January 30, 2015 ICICI Securities
23
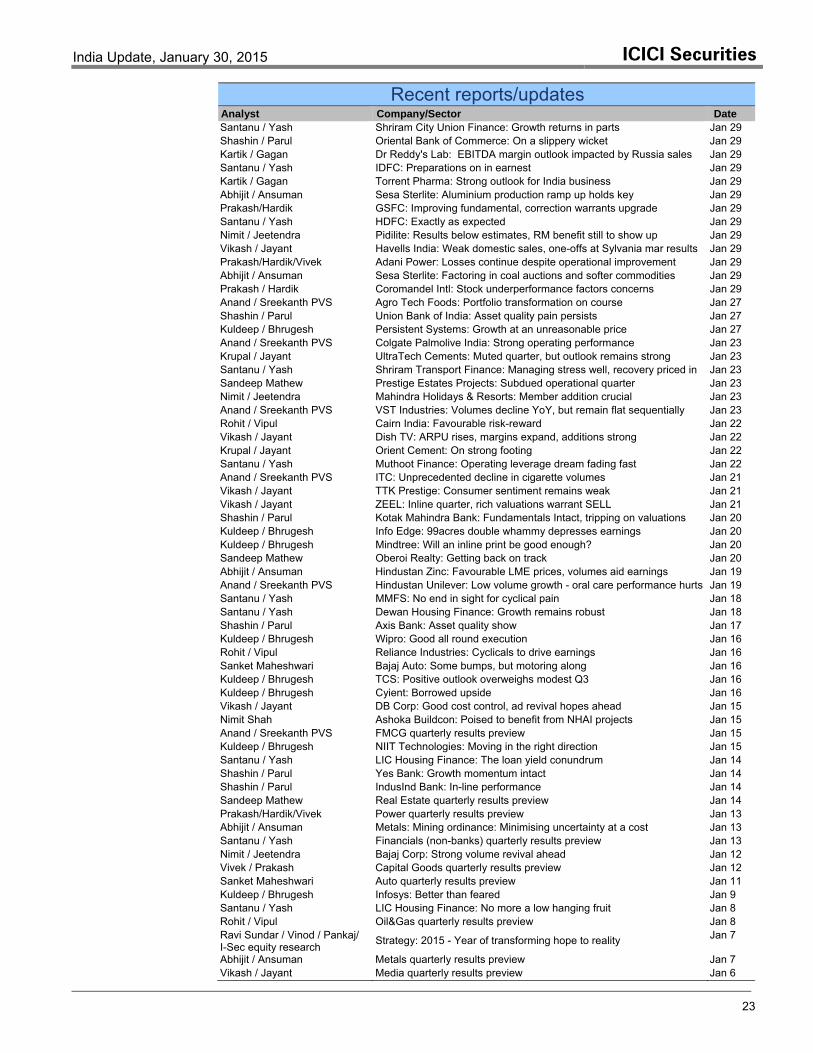
Recent reports/updates Analyst Company/Sector Date Santanu / Yash Shriram City Union Finance: Growth returns in parts Jan 29 Shashin / Parul Oriental Bank of Commerce: On a slippery wicket Jan 29 Kartik / Gagan Dr Reddy's Lab: EBITDA margin outlook impacted by Russia sales Jan 29 Santanu / Yash IDFC: Preparations on in earnest Jan 29 Kartik / Gagan Torrent Pharma: Strong outlook for India business Jan 29 Abhijit / Ansuman Sesa Sterlite: Aluminium production ramp up holds key Jan 29 Prakash/Hardik GSFC: Improving fundamental, correction warrants upgrade Jan 29 Santanu / Yash HDFC: Exactly as expected Jan 29 Nimit / Jeetendra Pidilite: Results below estimates, RM benefit still to show up Jan 29 Vikash / Jayant Havells India: Weak domestic sales, one-offs at Sylvania mar results Jan 29 Prakash/Hardik/Vivek Adani Power: Losses continue despite operational improvement Jan 29 Abhijit / Ansuman Sesa Sterlite: Factoring in coal auctions and softer commodities Jan 29 Prakash / Hardik Coromandel Intl: Stock underperformance factors concerns Jan 29 Anand / Sreekanth PVS Agro Tech Foods: Portfolio transformation on course Jan 27 Shashin / Parul Union Bank of India: Asset quality pain persists Jan 27 Kuldeep / Bhrugesh Persistent Systems: Growth at an unreasonable price Jan 27 Anand / Sreekanth PVS Colgate Palmolive India: Strong operating performance Jan 23 Krupal / Jayant UltraTech Cements: Muted quarter, but outlook remains strong Jan 23 Santanu / Yash Shriram Transport Finance: Managing stress well, recovery priced in Jan 23 Sandeep Mathew Prestige Estates Projects: Subdued operational quarter Jan 23 Nimit / Jeetendra Mahindra Holidays & Resorts: Member addition crucial Jan 23 Anand / Sreekanth PVS VST Industries: Volumes decline YoY, but remain flat sequentially Jan 23 Rohit / Vipul Cairn India: Favourable risk-reward Jan 22 Vikash / Jayant Dish TV: ARPU rises, margins expand, additions strong Jan 22 Krupal / Jayant Orient Cement: On strong footing Jan 22 Santanu / Yash Muthoot Finance: Operating leverage dream fading fast Jan 22 Anand / Sreekanth PVS ITC: Unprecedented decline in cigarette volumes Jan 21 Vikash / Jayant TTK Prestige: Consumer sentiment remains weak Jan 21 Vikash / Jayant ZEEL: Inline quarter, rich valuations warrant SELL Jan 21 Shashin / Parul Kotak Mahindra Bank: Fundamentals Intact, tripping on valuations Jan 20 Kuldeep / Bhrugesh Info Edge: 99acres double whammy depresses earnings Jan 20 Kuldeep / Bhrugesh Mindtree: Will an inline print be good enough? Jan 20 Sandeep Mathew Oberoi Realty: Getting back on track Jan 20 Abhijit / Ansuman Hindustan Zinc: Favourable LME prices, volumes aid earnings Jan 19 Anand / Sreekanth PVS Hindustan Unilever: Low volume growth - oral care performance hurts Jan 19 Santanu / Yash MMFS: No end in sight for cyclical pain Jan 18 Santanu / Yash Dewan Housing Finance: Growth remains robust Jan 18 Shashin / Parul Axis Bank: Asset quality show Jan 17 Kuldeep / Bhrugesh Wipro: Good all round execution Jan 16 Rohit / Vipul Reliance Industries: Cyclicals to drive earnings Jan 16 Sanket Maheshwari Bajaj Auto: Some bumps, but motoring along Jan 16 Kuldeep / Bhrugesh TCS: Positive outlook overweighs modest Q3 Jan 16 Kuldeep / Bhrugesh Cyient: Borrowed upside Jan 16 Vikash / Jayant DB Corp: Good cost control, ad revival hopes ahead Jan 15 Nimit Shah Ashoka Buildcon: Poised to benefit from NHAI projects Jan 15 Anand / Sreekanth PVS FMCG quarterly results preview Jan 15 Kuldeep / Bhrugesh NIIT Technologies: Moving in the right direction Jan 15 Santanu / Yash LIC Housing Finance: The loan yield conundrum Jan 14 Shashin / Parul Yes Bank: Growth momentum intact Jan 14 Shashin / Parul IndusInd Bank: In-line performance Jan 14 Sandeep Mathew Real Estate quarterly results preview Jan 14 Prakash/Hardik/Vivek Power quarterly results preview Jan 13 Abhijit / Ansuman Metals: Mining ordinance: Minimising uncertainty at a cost Jan 13 Santanu / Yash Financials (non-banks) quarterly results preview Jan 13 Nimit / Jeetendra Bajaj Corp: Strong volume revival ahead Jan 12 Vivek / Prakash Capital Goods quarterly results preview Jan 12 Sanket Maheshwari Auto quarterly results preview Jan 11 Kuldeep / Bhrugesh Infosys: Better than feared Jan 9 Santanu / Yash LIC Housing Finance: No more a low hanging fruit Jan 8 Rohit / Vipul Oil&Gas quarterly results preview Jan 8 Ravi Sundar / Vinod / Pankaj/ I-Sec equity research Strategy: 2015 - Year of transforming hope to reality Jan 7
Abhijit / Ansuman Metals quarterly results preview Jan 7 Vikash / Jayant Media quarterly results preview Jan 6
India Update, January 30, 2015 ICICI Securities
24
This report may be distributed in Singapore by ICICI Securities, Inc. (Singapore branch). Any recipients of this report in Singapore should contact ICICI Securities, Inc. (Singapore branch) in respect of any matters arising from, or in connection with, this report. The contact details of ICICI Securities, Inc. (Singapore branch) are as follows: Address: 10 Collyer Quay, #37-16 Ocean Financial Tower, Singapore - 049315, Tel: +65 6232 2451 and email: [email protected], [email protected].
"In case of eligible investors based in Japan, charges for brokerage services on execution of transactions do not in substance constitute charge for research reports and no charges are levied for providing research reports to such investors."
New I-Sec investment ratings (all ratings based on absolute return) BUY: >15% return; ADD: 5% to 15% return; HOLD: Negative 5% to Positive 5% return; REDUCE: Negative 5% to Negative 15% return; SELL: < negative 15% return
ANALYST CERTIFICATION We /I, Santanu Chakrabarti, PGDM; Yash Modi, PGDM; Vikash Mantri, PGDM; Jayant Dongre, PGDM; Prakash Gaurav Goel, CA; Hardik Shah, CA; Kartik Mehta, CA; Gagan Borana, PGDM; Nimit Shah, CA; Jeetendra Khatri, BMS; Abhijit Mitra, MBA (Finance), BE, Ansuman Deb, MBA, BE; Shashin Upadhyay, MBA; Parul Gulati, MBA; CFA (ICFAI); Research Analysts, authors and the names subscribed to this report, hereby certify that all of the views expressed in this research report accurately reflect our views about the subject issuer(s) or securities. We also certify that no part of our compensation was, is, or will be directly or indirectly related to the specific recommendation(s) or view(s) in this report. Analysts are not registered as research analysts by FINRA and are not associated persons of the ICICI Securities Inc. Terms & conditions and other disclosures: ICICI Securities Limited (ICICI Securities) is a full-service, integrated investment banking and is, inter alia, engaged in the business of stock brokering and distribution of financial products. ICICI Securities is a wholly-owned subsidiary of ICICI Bank which is India’s largest private sector bank and has its various subsidiaries engaged in businesses of housing finance, asset management, life insurance, general insurance, venture capital fund management, etc. (“associates”), the details in respect of which are available on www.icicibank.com. ICICI Securities is one of the leading merchant bankers/ underwriters of securities and participate in virtually all securities trading markets in India. We and our associates might have investment banking and other business relationship with a significant percentage of companies covered by our Investment Research Department. ICICI Securities generally prohibits its analysts, persons reporting to analysts and their relatives from maintaining a financial interest in the securities or derivatives of any companies that the analysts cover. The information and opinions in this report have been prepared by ICICI Securities and are subject to change without any notice. The report and information contained herein is strictly confidential and meant solely for the selected recipient and may not be altered in any way, transmitted to, copied or distributed, in part or in whole, to any other person or to the media or reproduced in any form, without prior written consent of ICICI Securities. While we would endeavour to update the information herein on a reasonable basis, ICICI Securities is under no obligation to update or keep the information current. Also, there may be regulatory, compliance or other reasons that may prevent ICICI Securities from doing so. Non-rated securities indicate that rating on a particular security has been suspended temporarily and such suspension is in compliance with applicable regulations and/or ICICI Securities policies, in circumstances where ICICI Securities might be acting in an advisory capacity to this company, or in certain other circumstances. This report is based on information obtained from public sources and sources believed to be reliable, but no independent verification has been made nor is its accuracy or completeness guaranteed. This report and information herein is solely for informational purpose and shall not be used or considered as an offer document or solicitation of offer to buy or sell or subscribe for securities or other financial instruments. Though disseminated to all the customers simultaneously, not all customers may receive this report at the same time. ICICI Securities will not treat recipients as customers by virtue of their receiving this report. Nothing in this report constitutes investment, legal, accounting and tax advice or a representation that any investment or strategy is suitable or appropriate to your specific circumstances. The securities discussed and opinions expressed in this report may not be suitable for all investors, who must make their own investment decisions, based on their own investment objectives, financial positions and needs of specific recipient. This may not be taken in substitution for the exercise of independent judgment by any recipient. The recipient should independently evaluate the investment risks. The value and return on investment may vary because of changes in interest rates, foreign exchange rates or any other reason. ICICI Securities accepts no liabilities whatsoever for any loss or damage of any kind arising out of the use of this report. Past performance is not necessarily a guide to future performance. Investors are advised to see Risk Disclosure Document to understand the risks associated before investing in the securities markets. Actual results may differ materially from those set forth in projections. Forward-looking statements are not predictions and may be subject to change without notice. ICICI Securities or its associates might have managed or co-managed public offering of securities for the subject company or might have been mandated by the subject company for any other assignment in the past twelve months. ICICI Securities or its associates might have received any compensation from the companies mentioned in the report during the period preceding twelve months from the date of this report for services in respect of managing or co-managing public offerings, corporate finance, investment banking or merchant banking, brokerage services or other advisory service in a merger or specific transaction. ICICI Securities or its associates might have received any compensation for products or services other than investment banking or merchant banking or brokerage services from the companies mentioned in the report in the past twelve months. ICICI Securities encourages independence in research report preparation and strives to minimize conflict in preparation of research report. ICICI Securities or its analysts did not receive any compensation or other benefits from the companies mentioned in the report or third party in connection with preparation of the research report. Accordingly, neither ICICI Securities nor Research Analysts have any material conflict of interest at the time of publication of this report. It is confirmed that Santanu Chakrabarti, PGDM; Yash Modi, PGDM; Vikash Mantri, PGDM; Jayant Dongre, PGDM; Prakash Gaurav Goel, CA; Hardik Shah, CA; Kartik Mehta, CA; Gagan Borana, PGDM; Nimit Shah, CA; Jeetendra Khatri, BMS; Abhijit Mitra, MBA (Finance), BE, Ansuman Deb, MBA, BE; Shashin Upadhyay, MBA; Parul Gulati, MBA; CFA (ICFAI); Research Analysts of this report have not received any compensation from the companies mentioned in the report in the preceding twelve months. Compensation of our Research Analysts is not based on any specific merchant banking, investment banking or brokerage service transactions. ICICI Securities or its subsidiaries collectively or Research Analysts do not own 1% or more of the equity securities of the Company mentioned in the report as of the last day of the month preceding the publication of the research report. Since associates of ICICI Securities are engaged in various financial service businesses, they might have financial interests or beneficial ownership in various companies including the subject company/companies mentioned in this report. It is confirmed that Santanu Chakrabarti, PGDM; Yash Modi, PGDM; Vikash Mantri, PGDM; Jayant Dongre, PGDM; Prakash Gaurav Goel, CA; Hardik Shah, CA; Kartik Mehta, CA; Gagan Borana, PGDM; Nimit Shah, CA; Jeetendra Khatri, BMS; Abhijit Mitra, MBA (Finance), BE, Ansuman Deb, MBA, BE; Shashin Upadhyay, MBA; Parul Gulati, MBA; CFA (ICFAI); Research Analysts do not serve as an officer, director or employee of the companies mentioned in the report. ICICI Securities may have issued other reports that are inconsistent with and reach different conclusion from the information presented in this report. Neither the Research Analysts nor ICICI Securities have been engaged in market making activity for the companies mentioned in the report. We submit that no material disciplinary action has been taken on ICICI Securities by any Regulatory Authority impacting Equity Research Analysis activities. This report is not directed or intended for distribution to, or use by, any person or entity who is a citizen or resident of or located in any locality, state, country or other jurisdiction, where such distribution, publication, availability or use would be contrary to law, regulation or which would subject ICICI Securities and affiliates to any registration or licensing requirement within such jurisdiction. The securities described herein may or may not be eligible for sale in all jurisdictions or to certain category of investors. Persons in whose possession this document may come are required to inform themselves of and to observe such restriction. This report has not been prepared by ICICI Securities, Inc. However, ICICI Securities, Inc. has reviewed the report and, in so far as it includes current or historical information, it is believed to be reliable, although its accuracy and completeness cannot be guaranteed.


![INDEX [] · 2010-07-22 · 6. The Company has transferred unclaimed dividends of erstwhile Torrent Power AEC Limited and Torrent Power SEC Limited upto the financial year ended on](https://img.pdfslide.us/doc/110x75/5fa9dc3453145347887d68a9/index-2010-07-22-6-the-company-has-transferred-unclaimed-dividends-of-erstwhile.jpg)