Embed Size (px)
Citation preview
The Global Economy, Emerging Markets and Geopolitical Risk:
Where We Are and Where We Are Going
Remarks by Alvaro Uribe Velez
October 2011
3 Issues to be covered
1. The emerging markets revolution (10 Minutes)
2. Latin-Americas great opportunity (15 Minutes)
3. Some lessons from the Colombian Experience (15 Minutes)
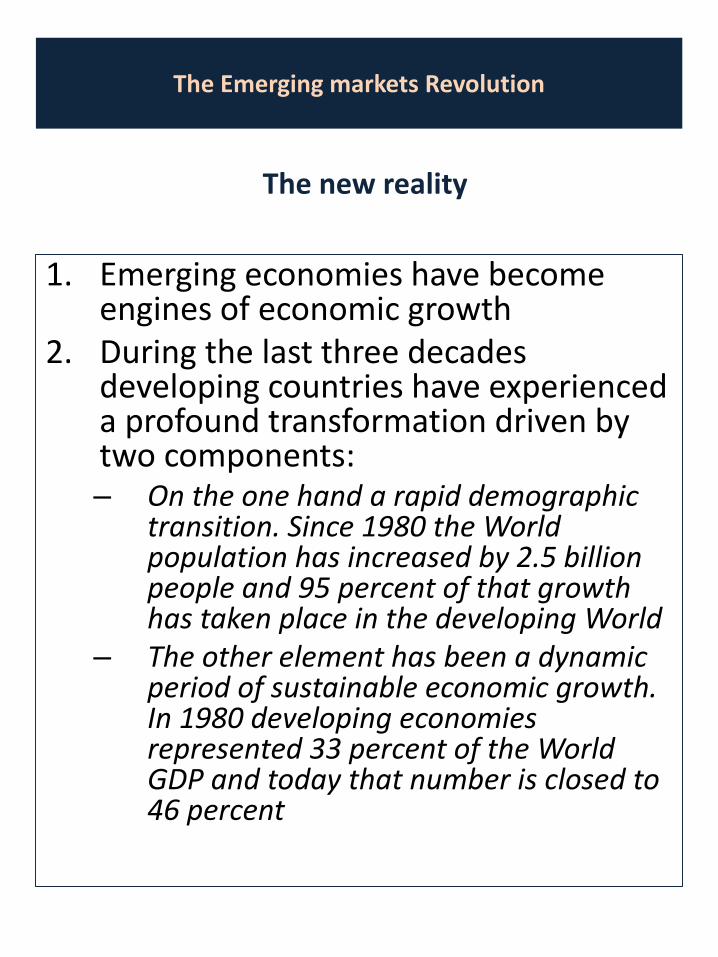
The Emerging markets Revolution
1. Emerging economies have become engines of economic growth
2. During the last three decades developing countries have experienced a profound transformation driven by two components: – On the one hand a rapid demographic
transition. Since 1980 the World population has increased by 2.5 billion people and 95 percent of that growth has taken place in the developing World
– The other element has been a dynamic period of sustainable economic growth. In 1980 developing economies represented 33 percent of the World GDP and today that number is closed to 46 percent
The new reality
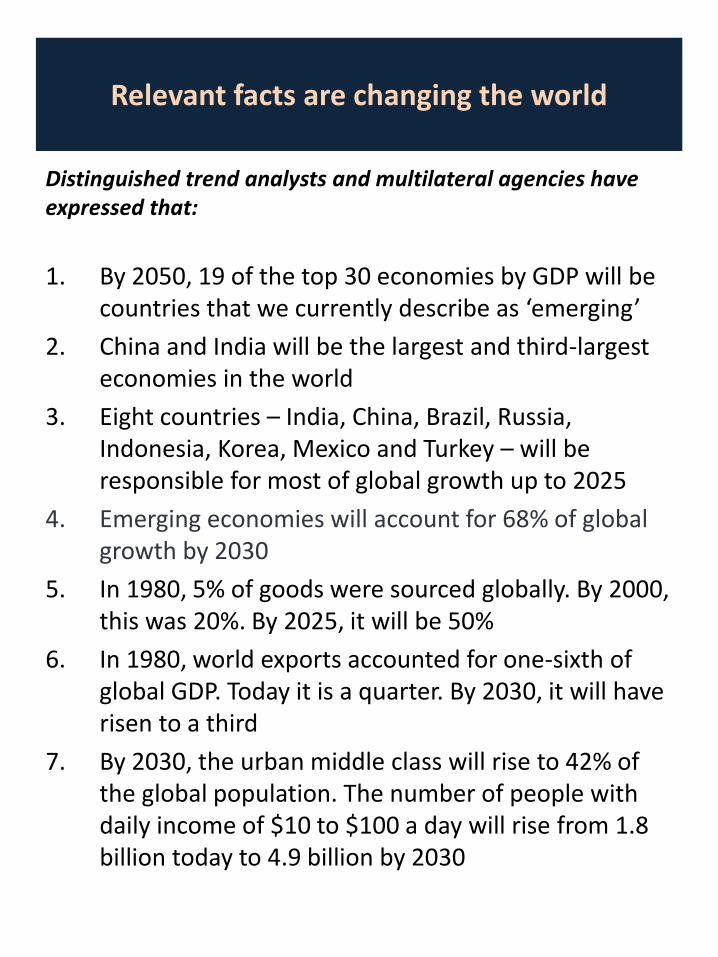
Relevant facts are changing the world
1. By 2050, 19 of the top 30 economies by GDP will be countries that we currently describe as ‘emerging’
2. China and India will be the largest and third-largest economies in the world
3. Eight countries – India, China, Brazil, Russia, Indonesia, Korea, Mexico and Turkey – will be responsible for most of global growth up to 2025
4. Emerging economies will account for 68% of global growth by 2030
5. In 1980, 5% of goods were sourced globally. By 2000, this was 20%. By 2025, it will be 50%
6. In 1980, world exports accounted for one-sixth of global GDP. Today it is a quarter. By 2030, it will have risen to a third
7. By 2030, the urban middle class will rise to 42% of the global population. The number of people with daily income of $10 to $100 a day will rise from 1.8 billion today to 4.9 billion by 2030
Distinguished trend analysts and multilateral agencies have expressed that:
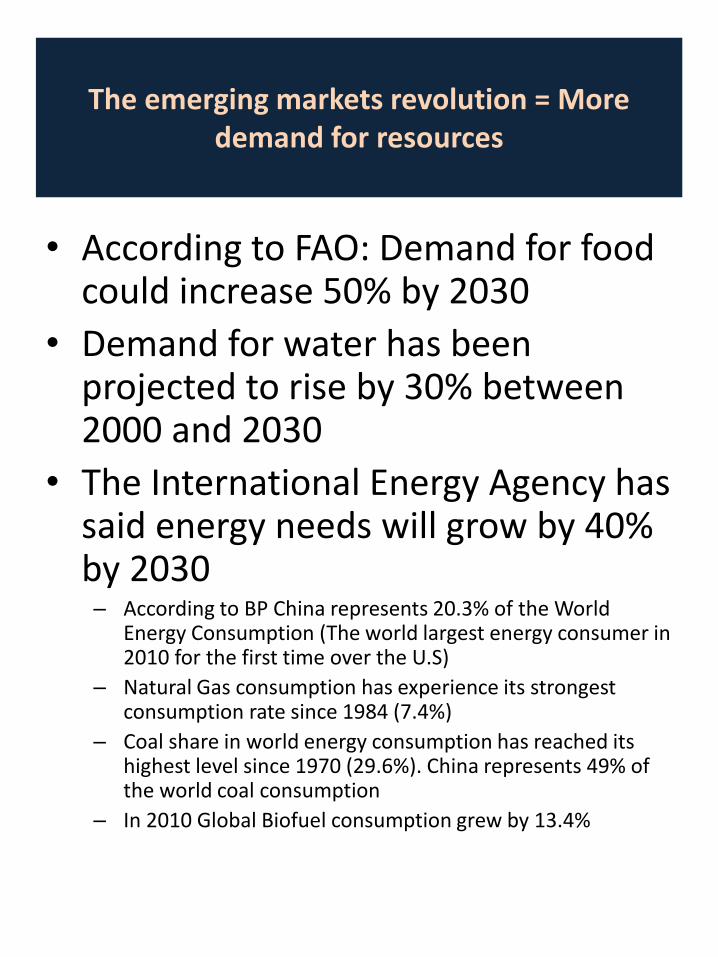
The emerging markets revolution = More demand for resources
• According to FAO: Demand for food could increase 50% by 2030
• Demand for water has been projected to rise by 30% between 2000 and 2030
• The International Energy Agency has said energy needs will grow by 40% by 2030– According to BP China represents 20.3% of the World
Energy Consumption (The world largest energy consumer in 2010 for the first time over the U.S)
– Natural Gas consumption has experience its strongest consumption rate since 1984 (7.4%)
– Coal share in world energy consumption has reached its highest level since 1970 (29.6%). China represents 49% of the world coal consumption
– In 2010 Global Biofuel consumption grew by 13.4%
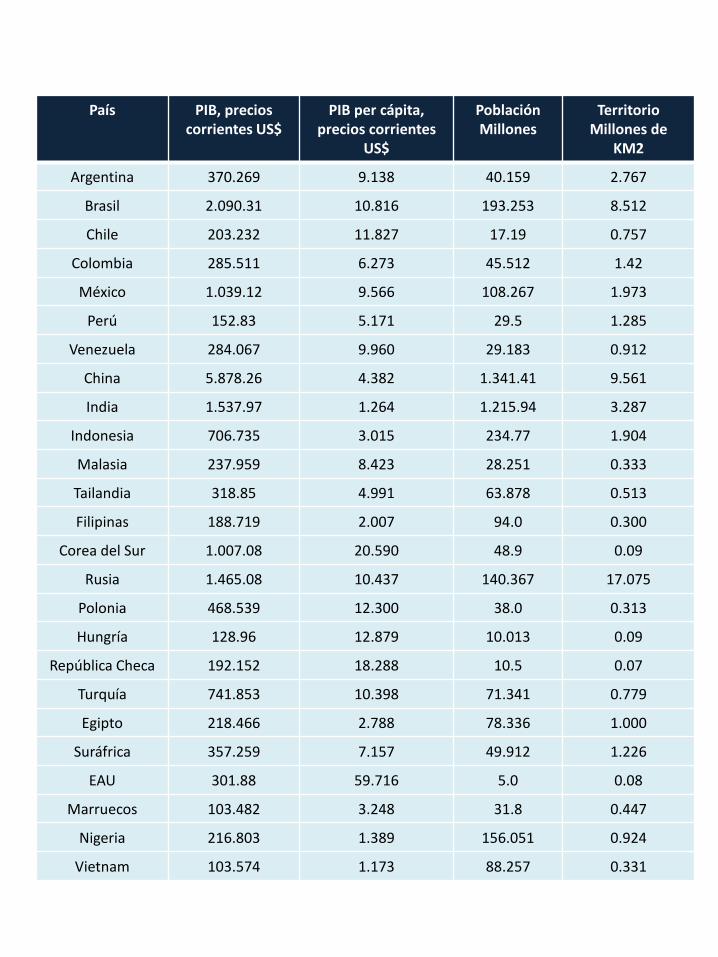
País PIB, precios corrientes US$
PIB per cápita, precios corrientes
US$
Población Millones
Territorio Millones de
KM2
Argentina 370.269 9.138 40.159 2.767
Brasil 2.090.31 10.816 193.253 8.512
Chile 203.232 11.827 17.19 0.757
Colombia 285.511 6.273 45.512 1.42
México 1.039.12 9.566 108.267 1.973
Perú 152.83 5.171 29.5 1.285
Venezuela 284.067 9.960 29.183 0.912
China 5.878.26 4.382 1.341.41 9.561
India 1.537.97 1.264 1.215.94 3.287
Indonesia 706.735 3.015 234.77 1.904
Malasia 237.959 8.423 28.251 0.333
Tailandia 318.85 4.991 63.878 0.513
Filipinas 188.719 2.007 94.0 0.300
Corea del Sur 1.007.08 20.590 48.9 0.09
Rusia 1.465.08 10.437 140.367 17.075
Polonia 468.539 12.300 38.0 0.313
Hungría 128.96 12.879 10.013 0.09
República Checa 192.152 18.288 10.5 0.07
Turquía 741.853 10.398 71.341 0.779
Egipto 218.466 2.788 78.336 1.000
Suráfrica 357.259 7.157 49.912 1.226
EAU 301.88 59.716 5.0 0.08
Marruecos 103.482 3.248 31.8 0.447
Nigeria 216.803 1.389 156.051 0.924
Vietnam 103.574 1.173 88.257 0.331
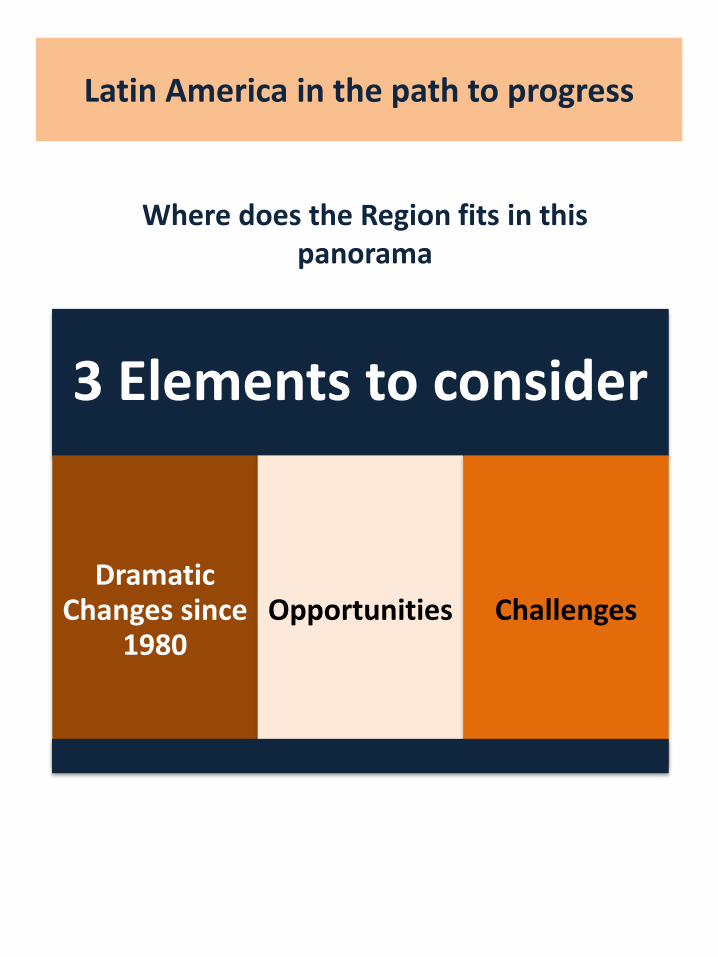
3 Elements to consider
Dramatic Changes since
1980Opportunities Challenges
Latin America in the path to progress
Where does the Region fits in this panorama
A new Regional Reality
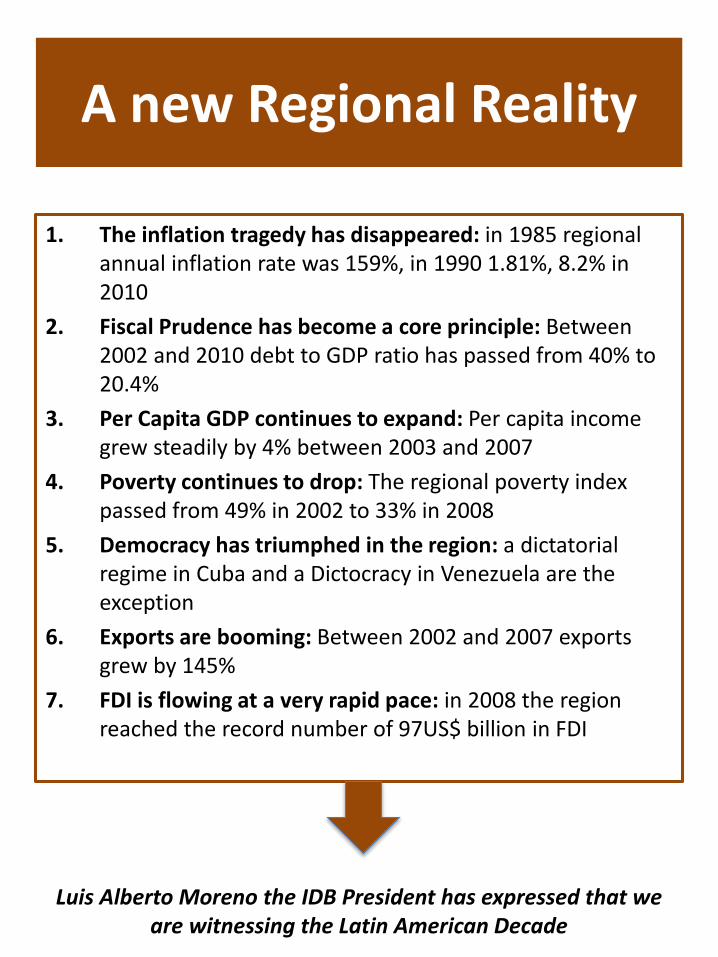
1. The inflation tragedy has disappeared: in 1985 regional annual inflation rate was 159%, in 1990 1.81%, 8.2% in 2010
2. Fiscal Prudence has become a core principle: Between 2002 and 2010 debt to GDP ratio has passed from 40% to 20.4%
3. Per Capita GDP continues to expand: Per capita income grew steadily by 4% between 2003 and 2007
4. Poverty continues to drop: The regional poverty index passed from 49% in 2002 to 33% in 2008
5. Democracy has triumphed in the region: a dictatorial regime in Cuba and a Dictocracy in Venezuela are the exception
6. Exports are booming: Between 2002 and 2007 exports grew by 145%
7. FDI is flowing at a very rapid pace: in 2008 the region reached the record number of 97US$ billion in FDI
Luis Alberto Moreno the IDB President has expressed that we are witnessing the Latin American Decade
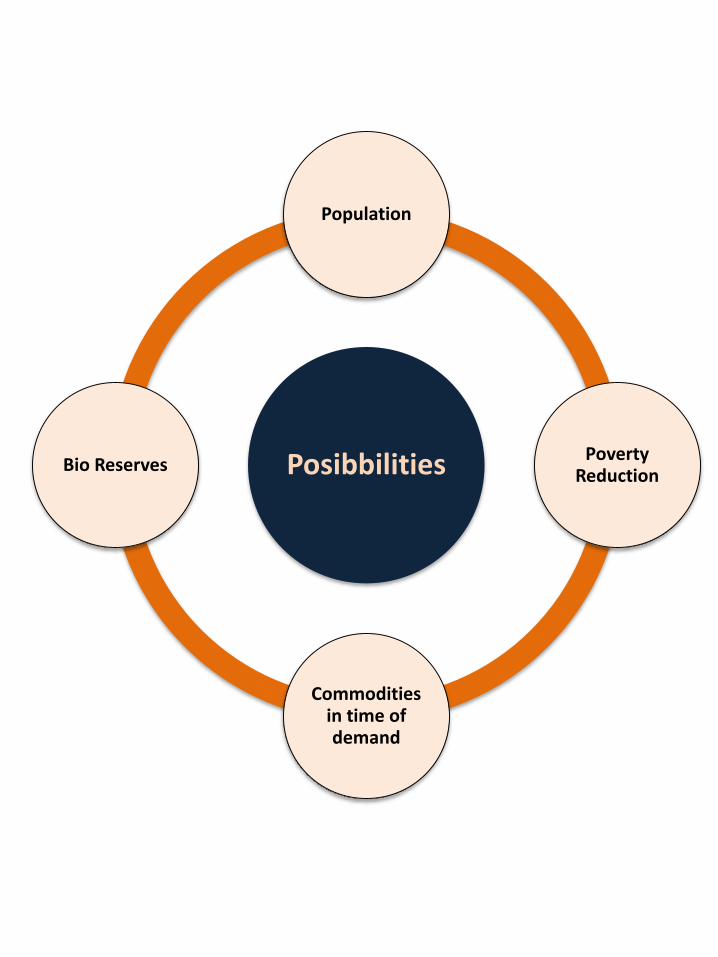
Posibbilities
Population
Poverty Reduction
Commodities in time of demand
Bio Reserves
Population
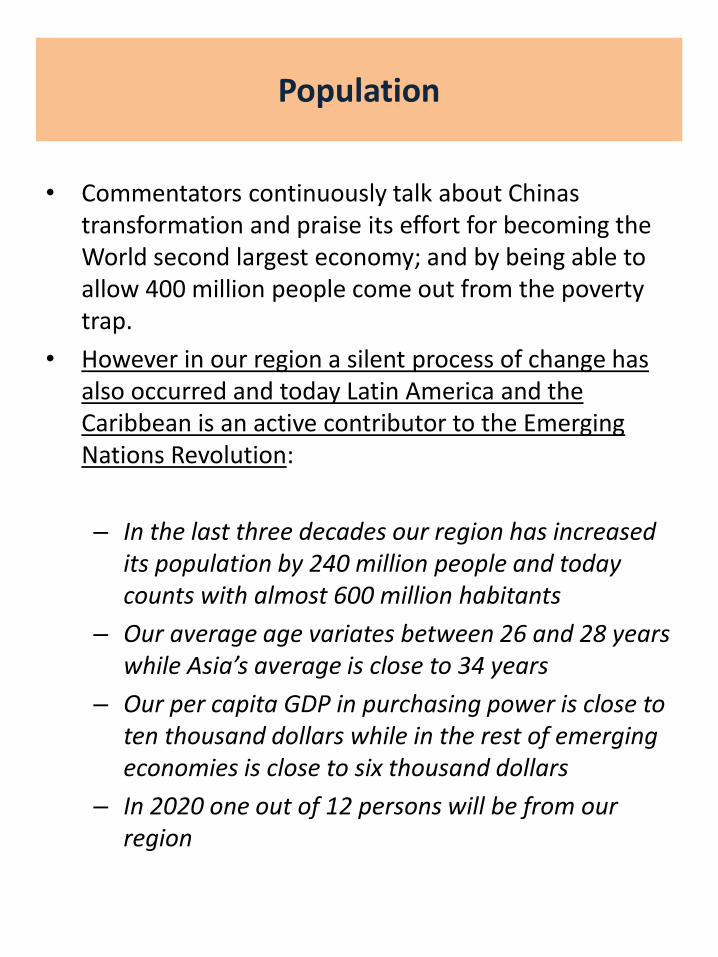
• Commentators continuously talk about Chinas transformation and praise its effort for becoming the World second largest economy; and by being able to allow 400 million people come out from the poverty trap.
• However in our region a silent process of change has also occurred and today Latin America and the Caribbean is an active contributor to the Emerging Nations Revolution:
– In the last three decades our region has increased its population by 240 million people and today counts with almost 600 million habitants
– Our average age variates between 26 and 28 years while Asia’s average is close to 34 years
– Our per capita GDP in purchasing power is close to ten thousand dollars while in the rest of emerging economies is close to six thousand dollars
– In 2020 one out of 12 persons will be from our region
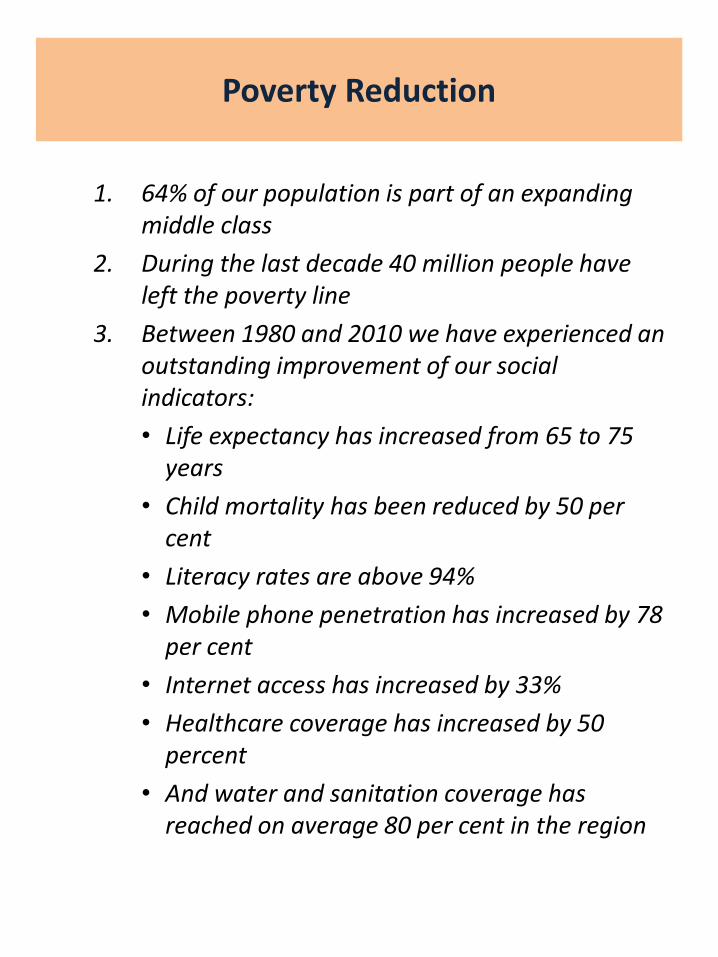
Poverty Reduction
1. 64% of our population is part of an expanding middle class
2. During the last decade 40 million people have left the poverty line
3. Between 1980 and 2010 we have experienced an outstanding improvement of our social indicators:
• Life expectancy has increased from 65 to 75 years
• Child mortality has been reduced by 50 per cent
• Literacy rates are above 94%
• Mobile phone penetration has increased by 78 per cent
• Internet access has increased by 33%
• Healthcare coverage has increased by 50 percent
• And water and sanitation coverage has reached on average 80 per cent in the region
Commodities in time of demand
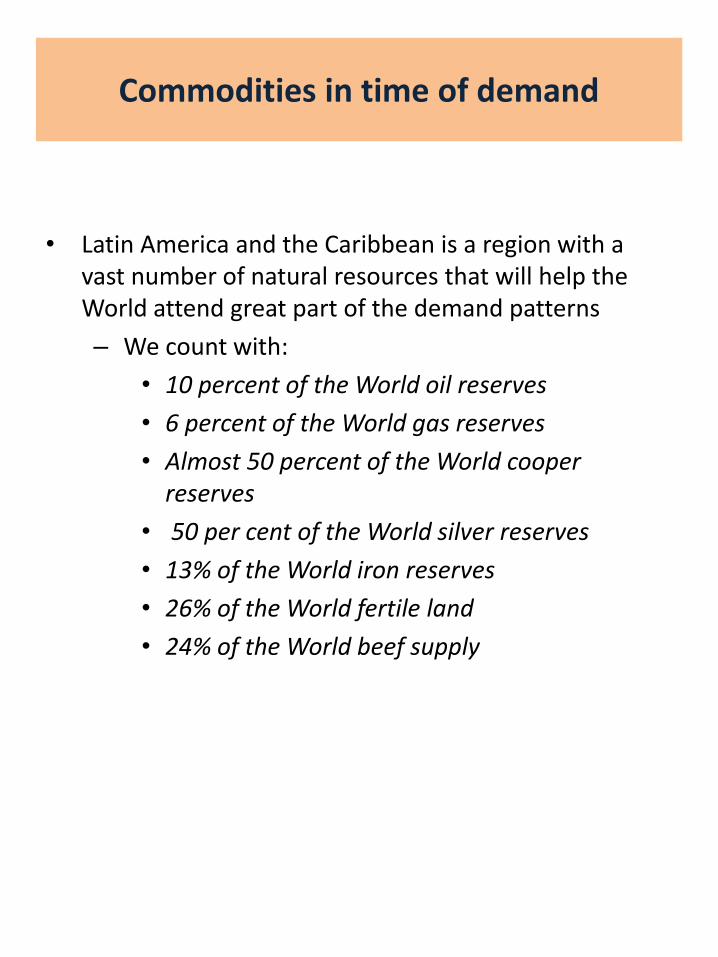
• Latin America and the Caribbean is a region with a vast number of natural resources that will help the World attend great part of the demand patterns
– We count with:
• 10 percent of the World oil reserves
• 6 percent of the World gas reserves
• Almost 50 percent of the World cooper reserves
• 50 per cent of the World silver reserves
• 13% of the World iron reserves
• 26% of the World fertile land
• 24% of the World beef supply
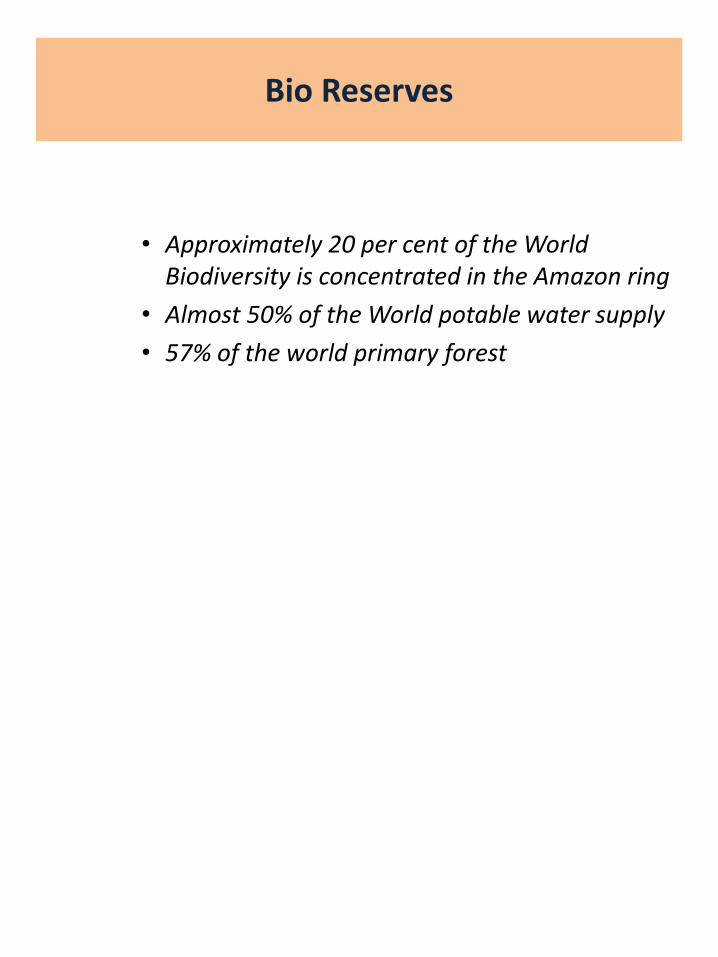
Bio Reserves
• Approximately 20 per cent of the World Biodiversity is concentrated in the Amazon ring
• Almost 50% of the World potable water supply
• 57% of the world primary forest
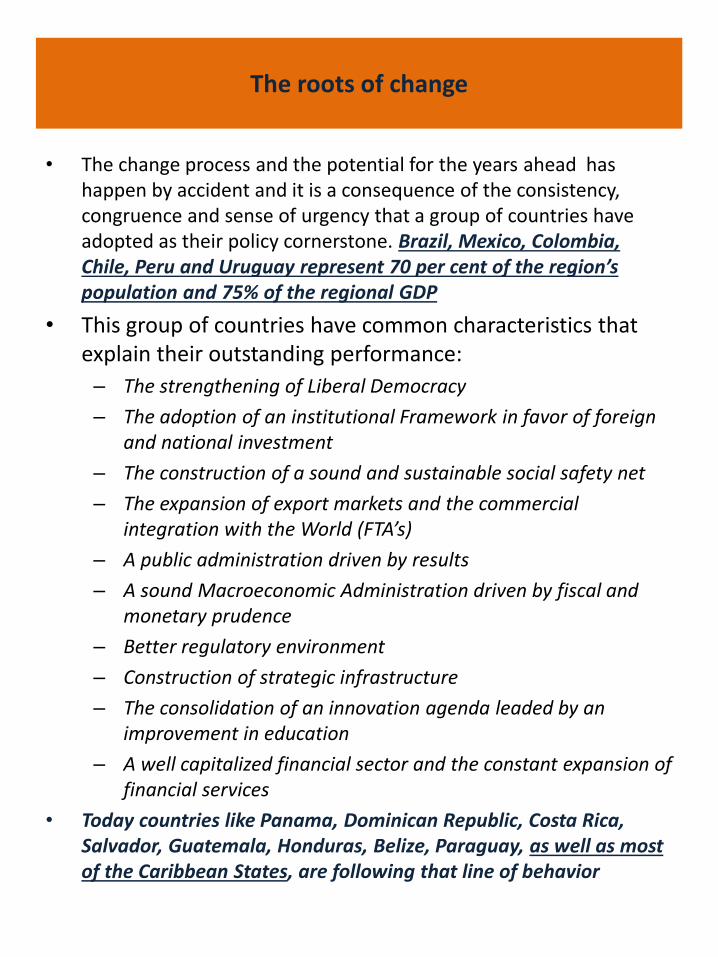
• The change process and the potential for the years ahead has happen by accident and it is a consequence of the consistency, congruence and sense of urgency that a group of countries have adopted as their policy cornerstone. Brazil, Mexico, Colombia, Chile, Peru and Uruguay represent 70 per cent of the region’s population and 75% of the regional GDP
• This group of countries have common characteristics that explain their outstanding performance:
– The strengthening of Liberal Democracy
– The adoption of an institutional Framework in favor of foreign and national investment
– The construction of a sound and sustainable social safety net
– The expansion of export markets and the commercial integration with the World (FTA’s)
– A public administration driven by results
– A sound Macroeconomic Administration driven by fiscal and monetary prudence
– Better regulatory environment
– Construction of strategic infrastructure
– The consolidation of an innovation agenda leaded by an improvement in education
– A well capitalized financial sector and the constant expansion of financial services
• Today countries like Panama, Dominican Republic, Costa Rica, Salvador, Guatemala, Honduras, Belize, Paraguay, as well as most of the Caribbean States, are following that line of behavior
The roots of change
Regional disparities
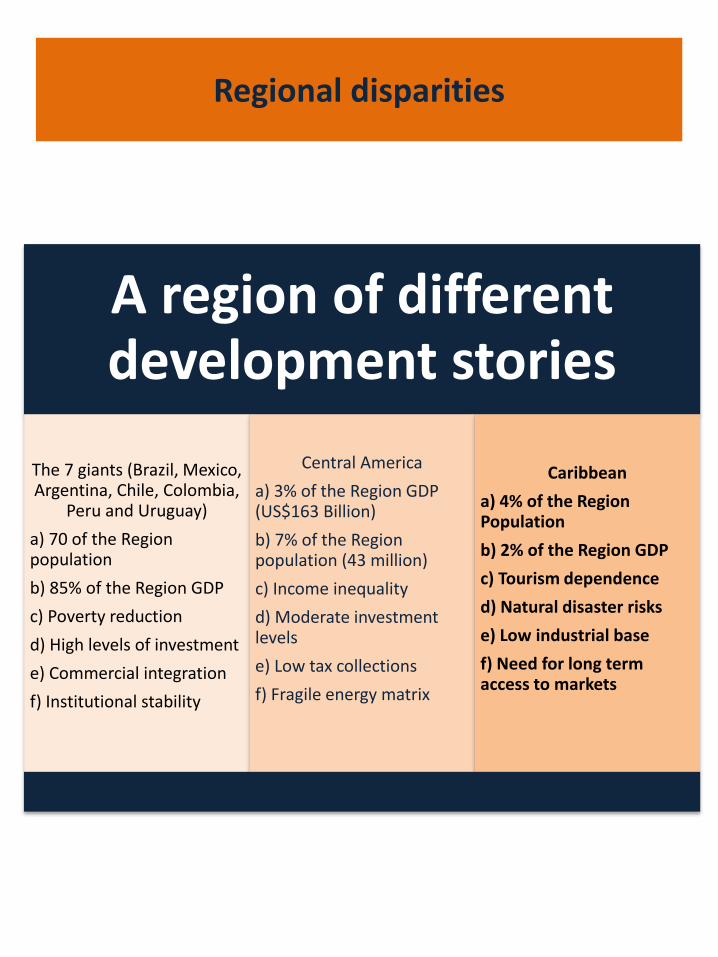
A region of different development stories
The 7 giants (Brazil, Mexico, Argentina, Chile, Colombia,
Peru and Uruguay)
a) 70 of the Region population
b) 85% of the Region GDP
c) Poverty reduction
d) High levels of investment
e) Commercial integration
f) Institutional stability
Central America
a) 3% of the Region GDP (US$163 Billion)
b) 7% of the Region population (43 million)
c) Income inequality
d) Moderate investment levels
e) Low tax collections
f) Fragile energy matrix
Caribbean
a) 4% of the Region Population
b) 2% of the Region GDP
c) Tourism dependence
d) Natural disaster risks
e) Low industrial base
f) Need for long term access to markets
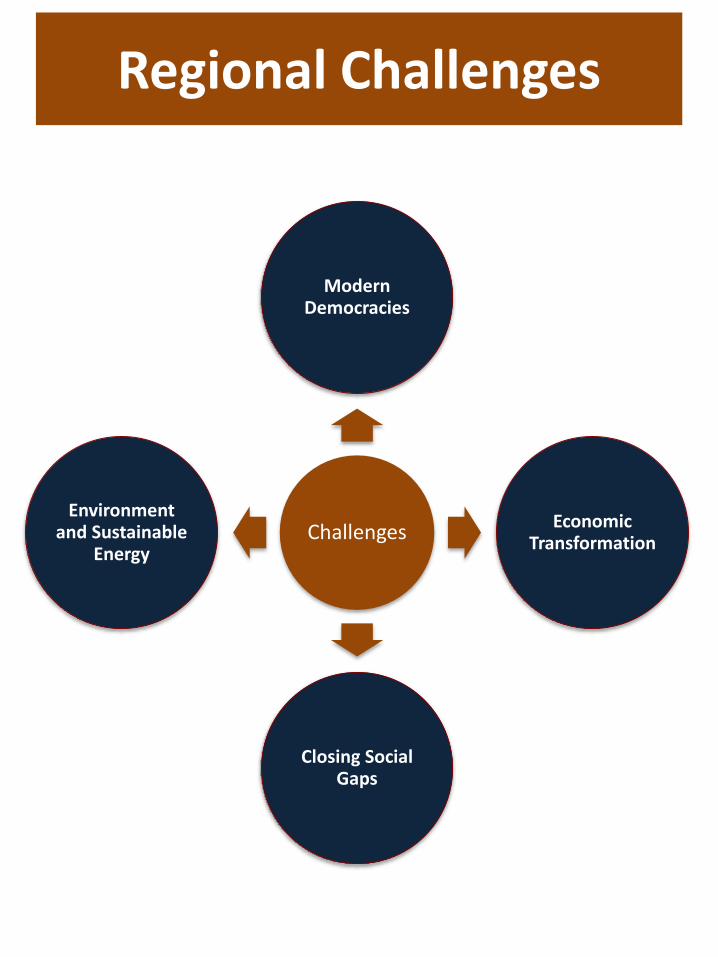
Regional Challenges
Challenges
Modern Democracies
Economic Transformation
Closing Social Gaps
Environment and Sustainable
Energy
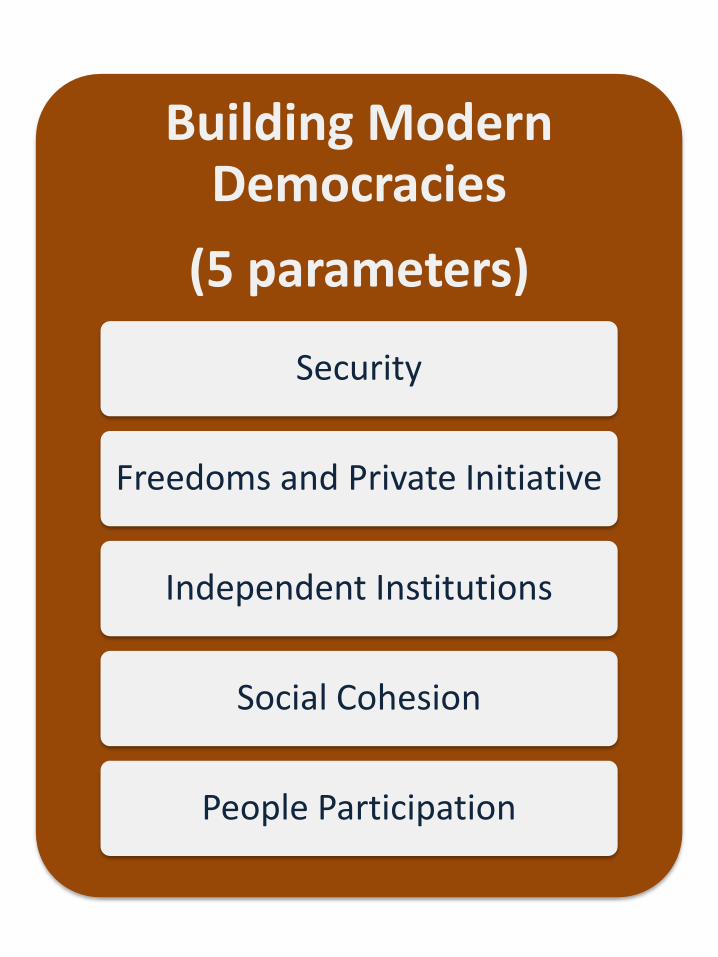
Building Modern Democracies
(5 parameters)
Security
Freedoms and Private Initiative
Independent Institutions
Social Cohesion
People Participation
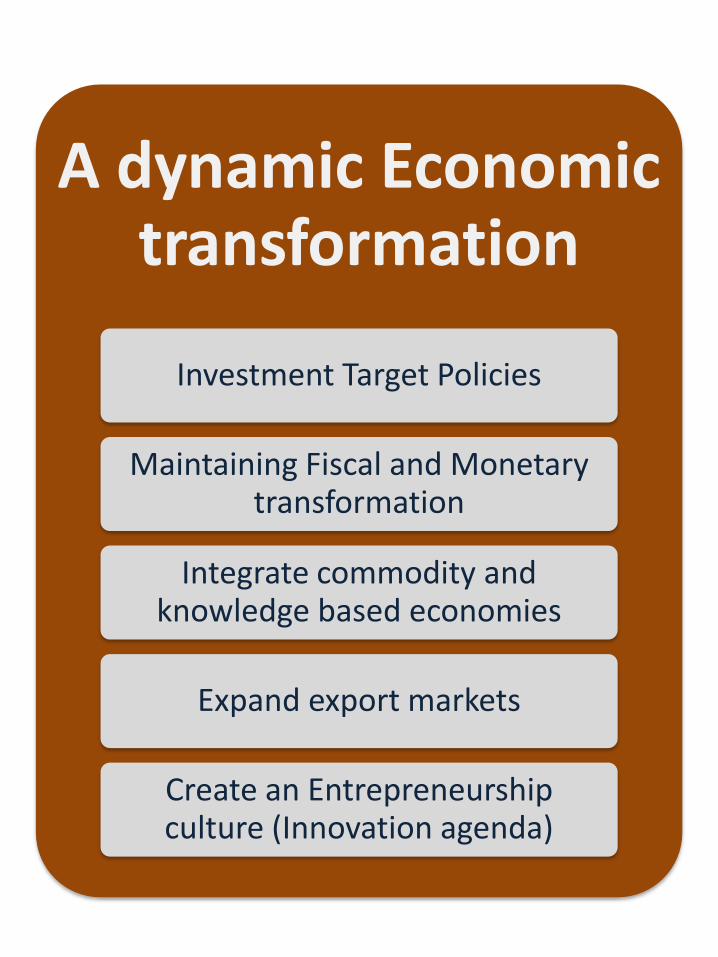
A dynamic Economic transformation
Investment Target Policies
Maintaining Fiscal and Monetary transformation
Integrate commodity and knowledge based economies
Expand export markets
Create an Entrepreneurship culture (Innovation agenda)

Closing Social Gaps
Improve education (quality, coverage, vocational)
Insure Universal Healthcare
Formal Job creation
Access to Finance
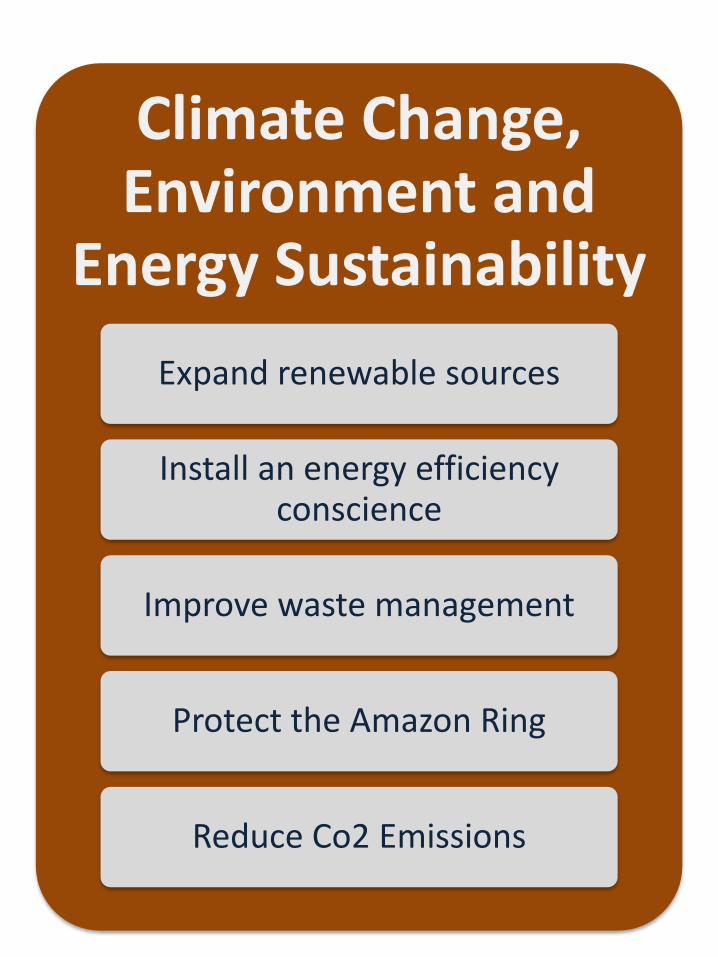
Climate Change, Environment and
Energy Sustainability
Expand renewable sources
Install an energy efficiency conscience
Improve waste management
Protect the Amazon Ring
Reduce Co2 Emissions
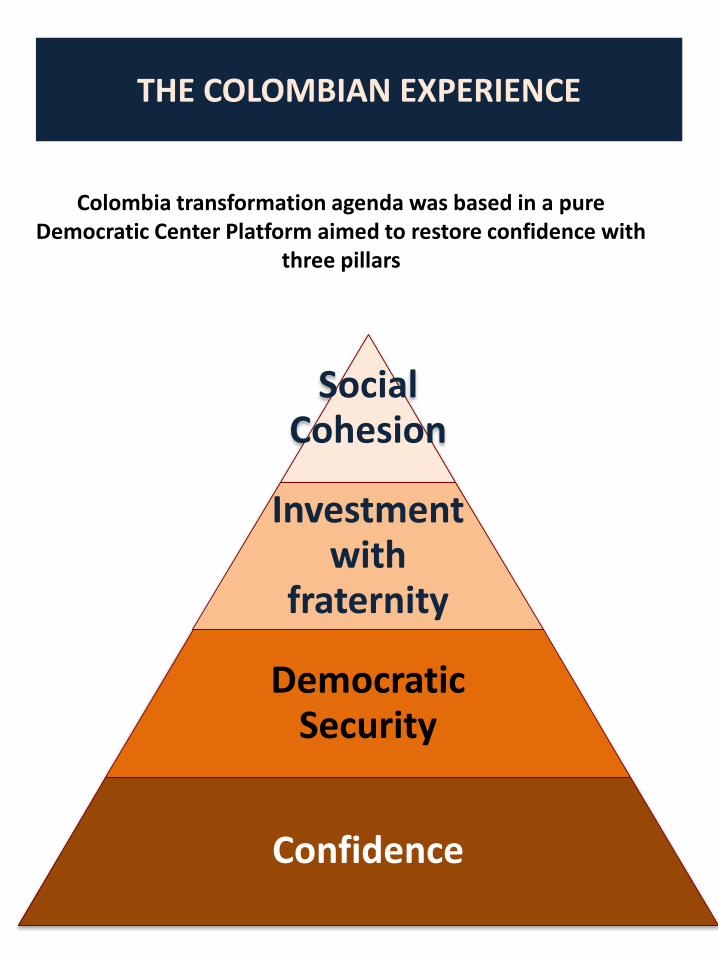
THE COLOMBIAN EXPERIENCE
Social Cohesion
Investment with
fraternity
Democratic Security
Confidence
Colombia transformation agenda was based in a pure Democratic Center Platform aimed to restore confidence with
three pillars
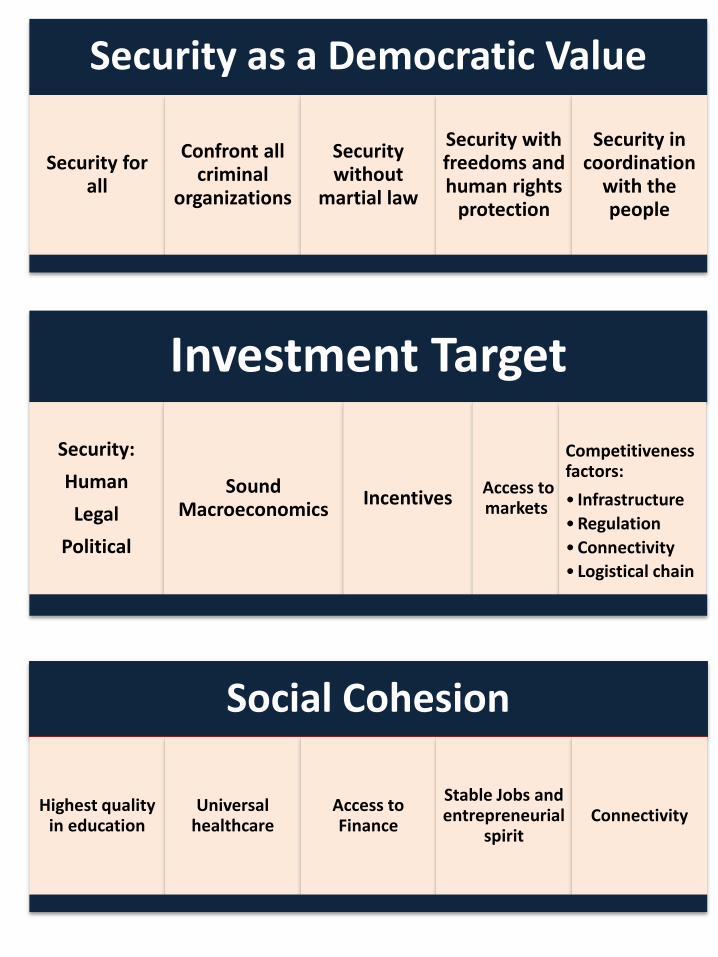
Security as a Democratic Value
Security for all
Confront all criminal
organizations
Security without
martial law
Security with freedoms and human rights
protection
Security in coordination
with the people
Investment Target
Security:
Human
Legal
Political
Sound Macroeconomics
IncentivesAccess to markets
Competitiveness factors:
• Infrastructure
• Regulation
• Connectivity
• Logistical chain
Social Cohesion
Highest quality in education
Universal healthcare
Access to Finance
Stable Jobs and entrepreneurial
spiritConnectivity
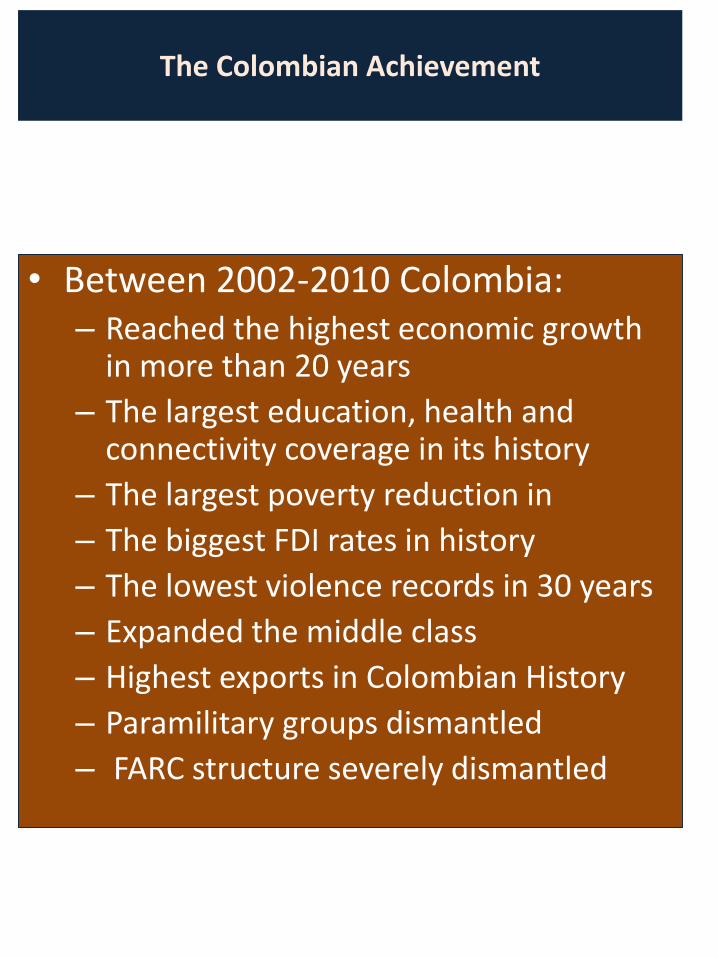
The Colombian Achievement
• Between 2002-2010 Colombia:– Reached the highest economic growth
in more than 20 years
– The largest education, health and connectivity coverage in its history
– The largest poverty reduction in
– The biggest FDI rates in history
– The lowest violence records in 30 years
– Expanded the middle class
– Highest exports in Colombian History
– Paramilitary groups dismantled
– FARC structure severely dismantled
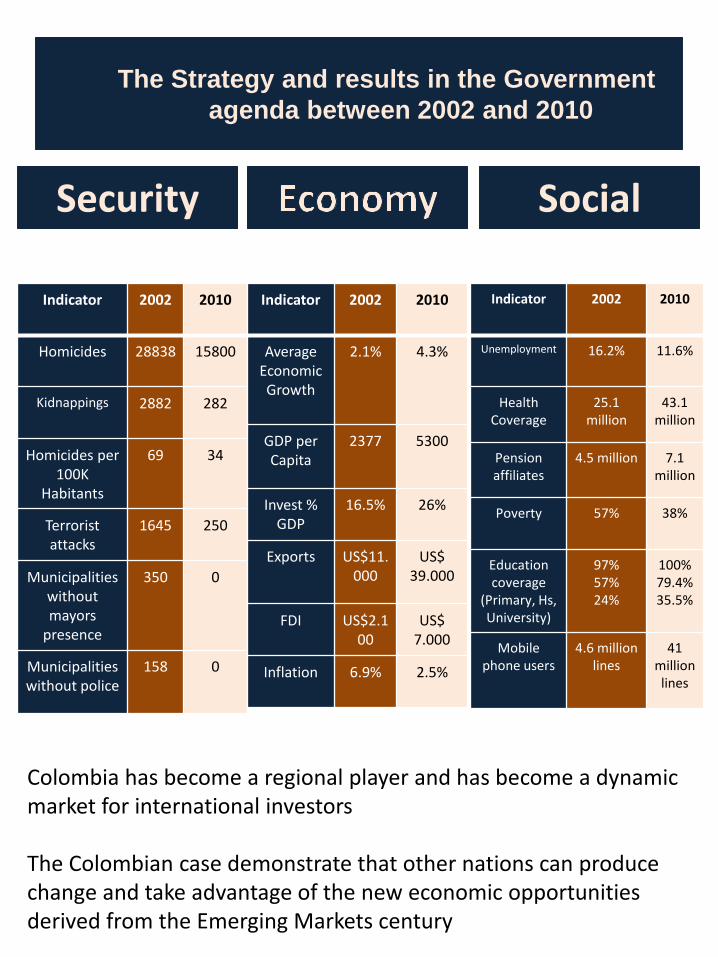
The Strategy and results in the Government
agenda between 2002 and 2010
Indicator 2002 2010
Homicides 28838 15800
Kidnappings 2882 282
Homicides per 100K
Habitants
69 34
Terrorist attacks
1645 250
Municipalitieswithout mayors
presence
350 0
Municipalities without police
158 0
Security
Indicator 2002 2010
Average Economic Growth
2.1% 4.3%
GDP per Capita
2377 5300
Invest % GDP
16.5% 26%
Exports US$11.000
US$ 39.000
FDI US$2.100
US$7.000
Inflation 6.9% 2.5%
Social
Indicator 2002 2010
Unemployment 16.2% 11.6%
Health Coverage
25.1 million
43.1million
Pension affiliates
4.5 million 7.1 million
Poverty 57% 38%
Education coverage
(Primary, Hs, University)
97%57%24%
100%79.4%35.5%
Mobile phone users
4.6 million lines
41 million lines
Colombia has become a regional player and has become a dynamic market for international investors
The Colombian case demonstrate that other nations can produce change and take advantage of the new economic opportunities derived from the Emerging Markets century

www.alvarouribevelez.com