Embed Size (px)
Citation preview

A future for the Demand Side in
Western Australia?Richard Wilson – WA Power and Gas Conference 2016
2
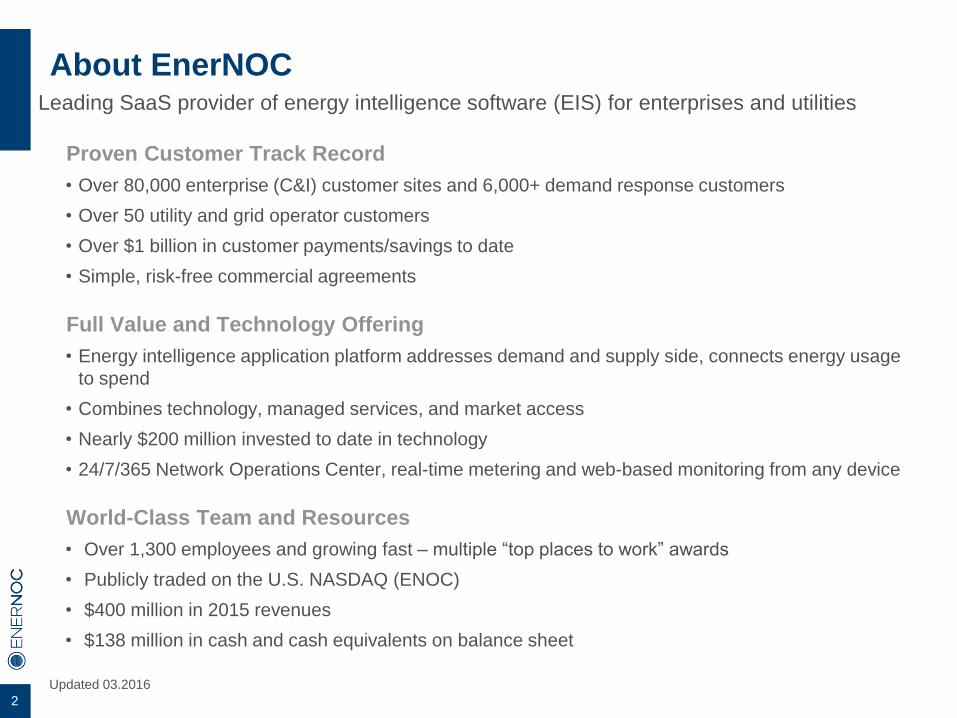
About EnerNOC
Proven Customer Track Record
• Over 80,000 enterprise (C&I) customer sites and 6,000+ demand response customers
• Over 50 utility and grid operator customers
• Over $1 billion in customer payments/savings to date
• Simple, risk-free commercial agreements
Full Value and Technology Offering
• Energy intelligence application platform addresses demand and supply side, connects energy usage
to spend
• Combines technology, managed services, and market access
• Nearly $200 million invested to date in technology
• 24/7/365 Network Operations Center, real-time metering and web-based monitoring from any device
World-Class Team and Resources
• Over 1,300 employees and growing fast – multiple “top places to work” awards
• Publicly traded on the U.S. NASDAQ (ENOC)
• $400 million in 2015 revenues
• $138 million in cash and cash equivalents on balance sheet
Updated 03.2016
Leading SaaS provider of energy intelligence software (EIS) for enterprises and utilities
3
About EnerNOC
Proven Customer Track
Record
• Thousands of enterprise
customers across over 80,000
sites
• Over $1B in customer savings
delivered to date
• Market leader in demand
response
To learn more, visit http://www.enernoc.com
Strong Financial Profile
• 2015 Revenues: $400M
• $138M in cash/cash equivalents on
balance sheet
• Publicly traded on the NASDAQ)
(ENOC)
• Over 1,300 employees and growing
fast; multiple “top places to work”
awards
Full Value and Technology
Offering
• Energy intelligence software = ~$5B
market in U.S. alone
• Energy intelligence application
platform addresses demand and
supply-side, connects energy usage
to currency
• Combines technology, managed
services, and market access
• ~$200M invested to date in
technology
Updated 11.2015
4
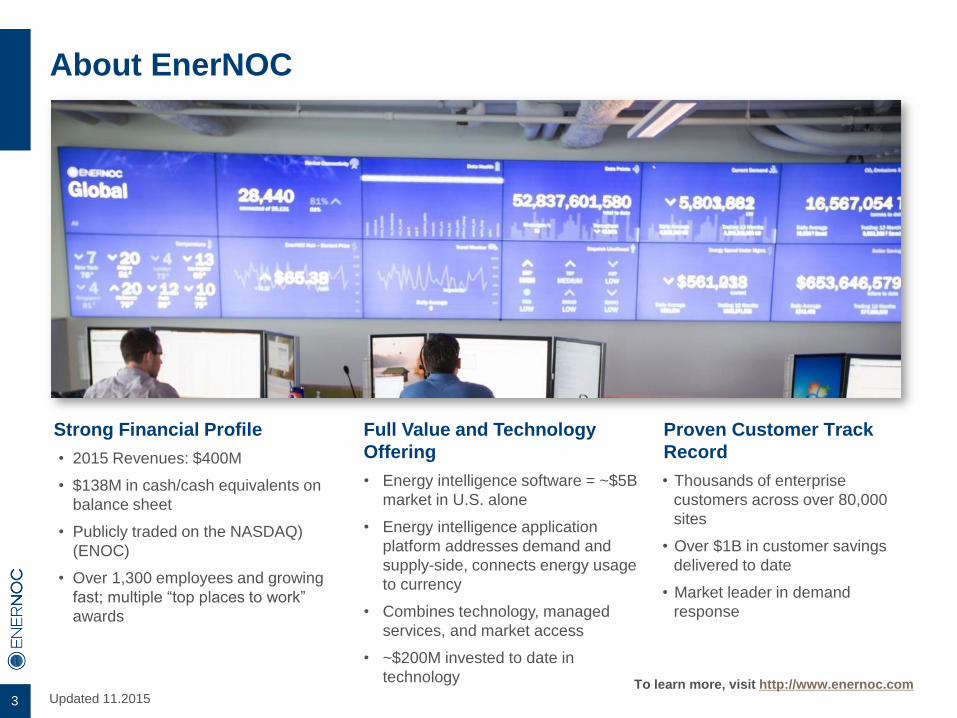
We meet you where you operate – in 104 countries
Global Capability
Supporting 15
languagesManaging one million
bills annually
Worldwide currencies
and measurements
Countries Covered
Global offices in
12 countries
Streaming data from over
14,000 enterprise sites
5
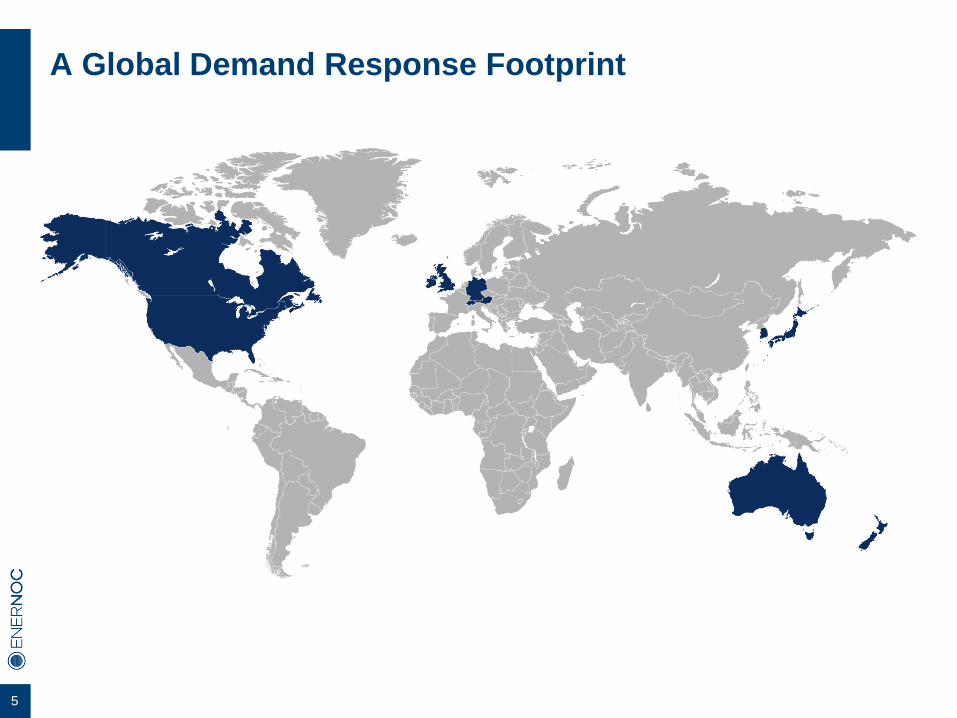
A Global Demand Response Footprint
6
The role of capacity markets
• An option to call for energy at times of scarcity.
• Sends a signal on the amount of capacity required, not the type of capacity
required.
• Combination of price signals in the capacity, energy, and ancillary services
markets ensure optimal quantity and mix of resources.
• Flawed market designs attract the wrong types of resources and lead to
over- and underinvestment that can threaten reliability and raise system
costs.
7
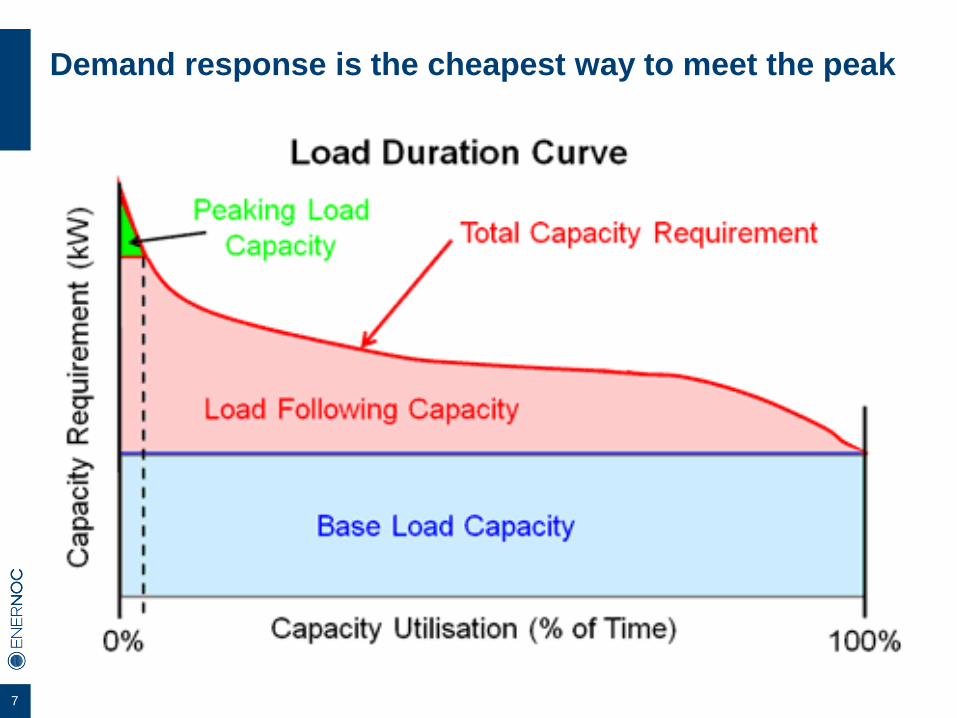
Demand response is the cheapest way to meet the peak
8
“Since demand response is actually ― and not
merely metaphorically ― equivalent to supply
response, economic efficiency requires that it be
regarded and rewarded, equivalently, as a
resource proffered to system operators, and be
treated equivalently to generation in competitive
power markets.”Late Alfred E. Kahn
Professor Emeritus of Political Economy
Cornell University
9
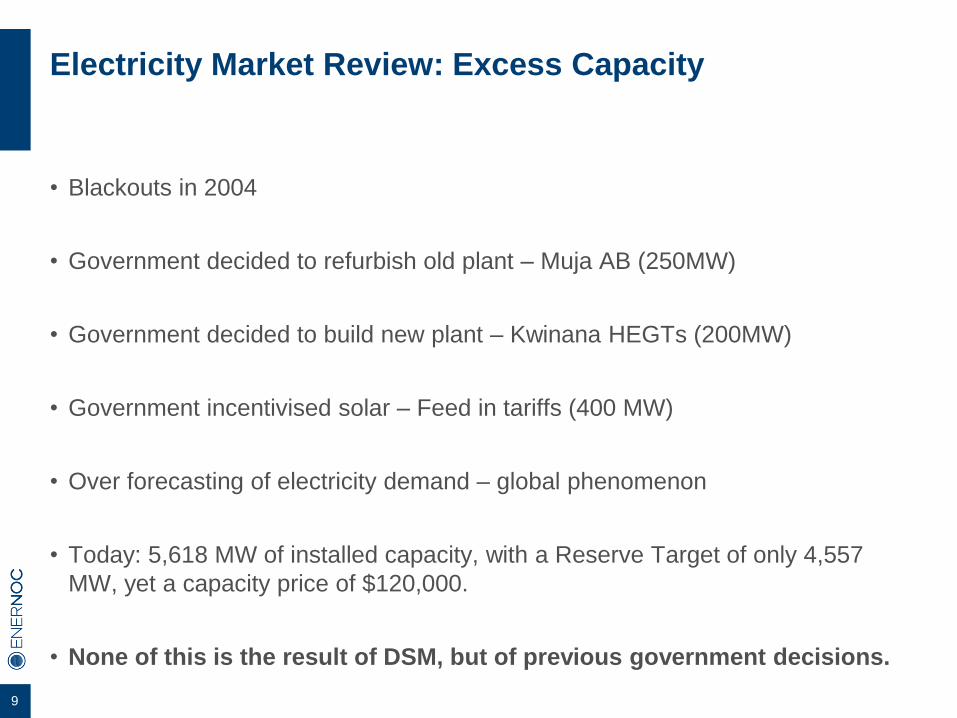
Electricity Market Review: Excess Capacity
• Blackouts in 2004
• Government decided to refurbish old plant – Muja AB (250MW)
• Government decided to build new plant – Kwinana HEGTs (200MW)
• Government incentivised solar – Feed in tariffs (400 MW)
• Over forecasting of electricity demand – global phenomenon
• Today: 5,618 MW of installed capacity, with a Reserve Target of only 4,557
MW, yet a capacity price of $120,000.
• None of this is the result of DSM, but of previous government decisions.
10
11
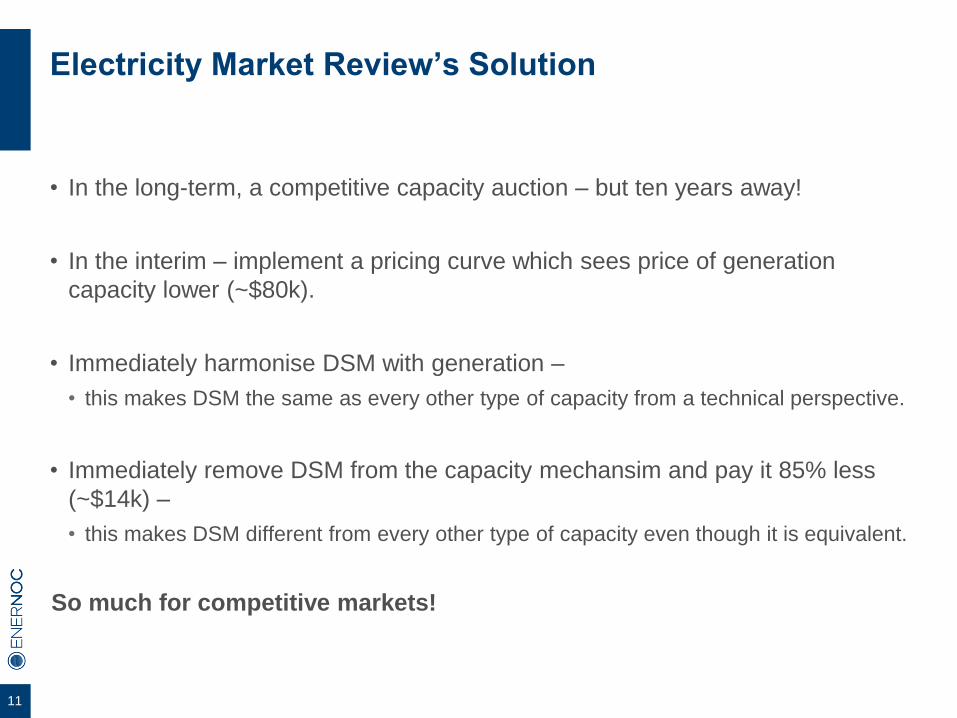
Electricity Market Review’s Solution
• In the long-term, a competitive capacity auction – but ten years away!
• In the interim – implement a pricing curve which sees price of generation
capacity lower (~$80k).
• Immediately harmonise DSM with generation –
• this makes DSM the same as every other type of capacity from a technical perspective.
• Immediately remove DSM from the capacity mechansim and pay it 85% less
(~$14k) –
• this makes DSM different from every other type of capacity even though it is equivalent.
So much for competitive markets!

12
“To fully restore appropriate incentives to market
participants, the demand side of the market should be
treated symmetrically with the supply side. Demand
response resources that are compatible with the system
operator’s reliability criteria should be compensated at levels
equivalent to what is paid to generators to make capacity
available during capacity constrained periods.”
Professor Paul Joskow
Massachusetts Institute of Technology
13
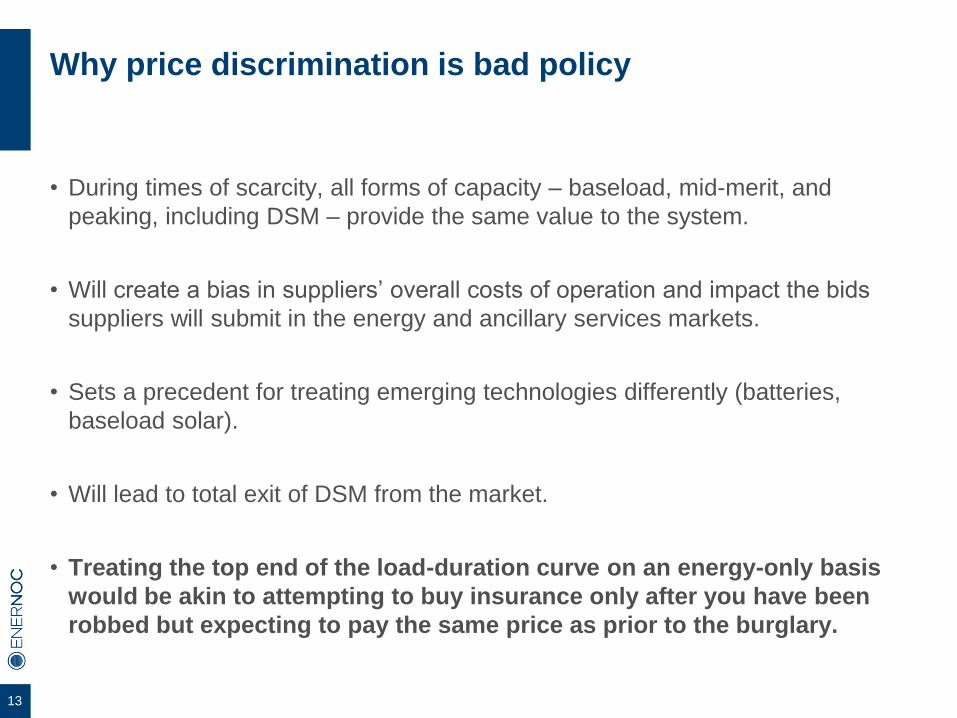
Why price discrimination is bad policy
• During times of scarcity, all forms of capacity – baseload, mid-merit, and
peaking, including DSM – provide the same value to the system.
• Will create a bias in suppliers’ overall costs of operation and impact the bids
suppliers will submit in the energy and ancillary services markets.
• Sets a precedent for treating emerging technologies differently (batteries,
baseload solar).
• Will lead to total exit of DSM from the market.
• Treating the top end of the load-duration curve on an energy-only basis
would be akin to attempting to buy insurance only after you have been
robbed but expecting to pay the same price as prior to the burglary.
14
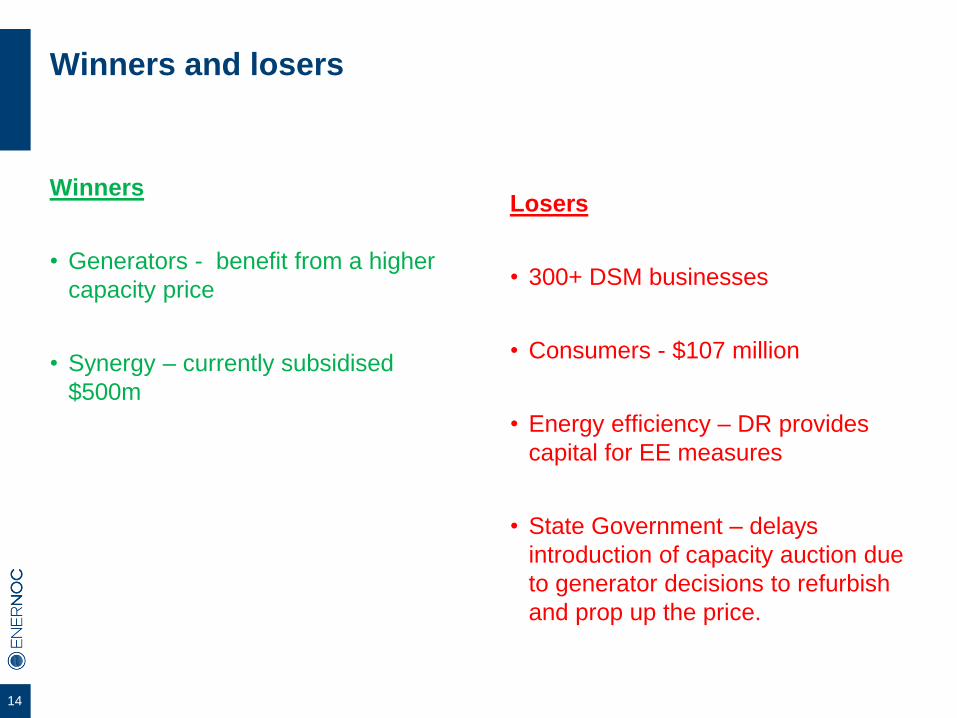
Winners and losers
Winners
• Generators - benefit from a higher
capacity price
• Synergy – currently subsidised
$500m
Losers
• 300+ DSM businesses
• Consumers - $107 million
• Energy efficiency – DR provides
capital for EE measures
• State Government – delays
introduction of capacity auction due
to generator decisions to refurbish
and prop up the price.
15
16
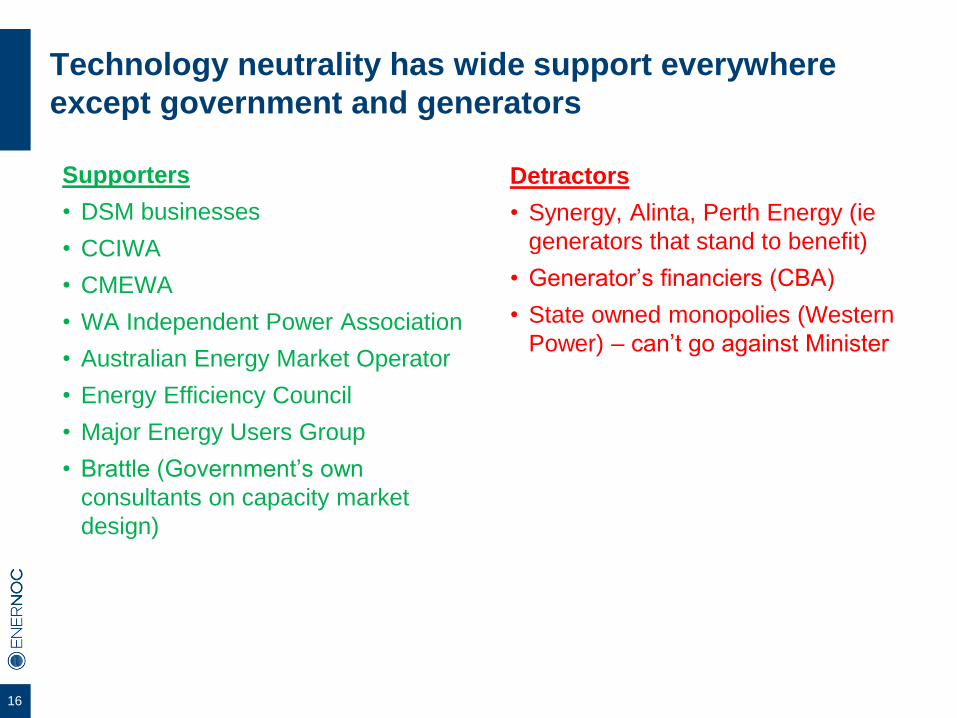
Technology neutrality has wide support everywhere
except government and generators
Supporters
• DSM businesses
• CCIWA
• CMEWA
• WA Independent Power Association
• Australian Energy Market Operator
• Energy Efficiency Council
• Major Energy Users Group
• Brattle (Government’s own
consultants on capacity market
design)
Detractors
• Synergy, Alinta, Perth Energy (ie
generators that stand to benefit)
• Generator’s financiers (CBA)
• State owned monopolies (Western
Power) – can’t go against Minister
17
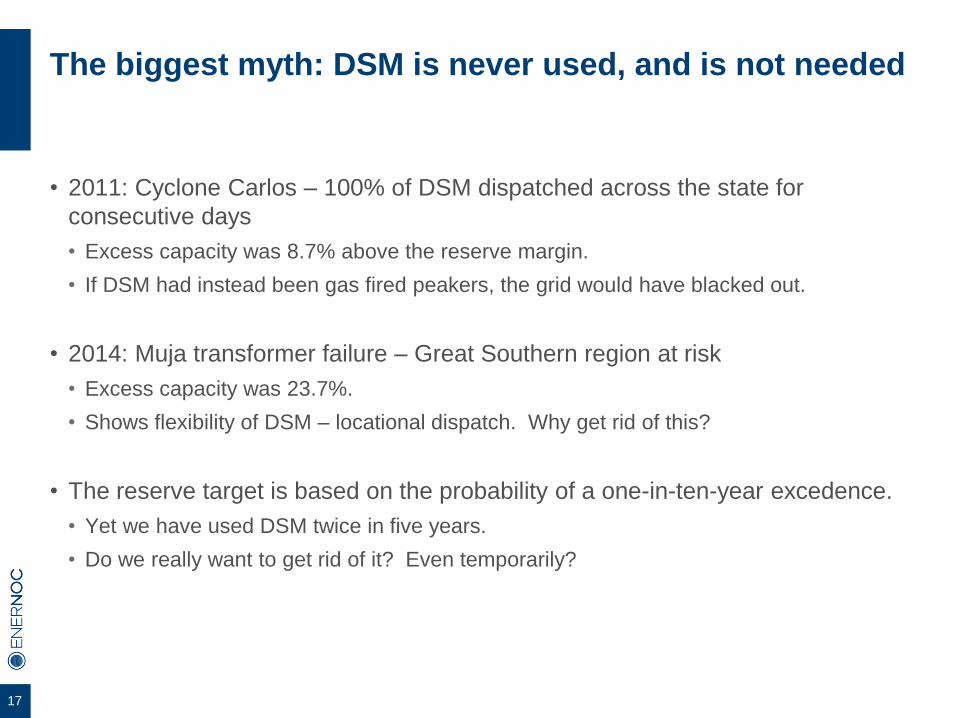
The biggest myth: DSM is never used, and is not needed
• 2011: Cyclone Carlos – 100% of DSM dispatched across the state for
consecutive days
• Excess capacity was 8.7% above the reserve margin.
• If DSM had instead been gas fired peakers, the grid would have blacked out.
• 2014: Muja transformer failure – Great Southern region at risk
• Excess capacity was 23.7%.
• Shows flexibility of DSM – locational dispatch. Why get rid of this?
• The reserve target is based on the probability of a one-in-ten-year excedence.
• Yet we have used DSM twice in five years.
• Do we really want to get rid of it? Even temporarily?
18
A better way – competitive markets
• Level playing field for all resource types
• Introduce an auction now
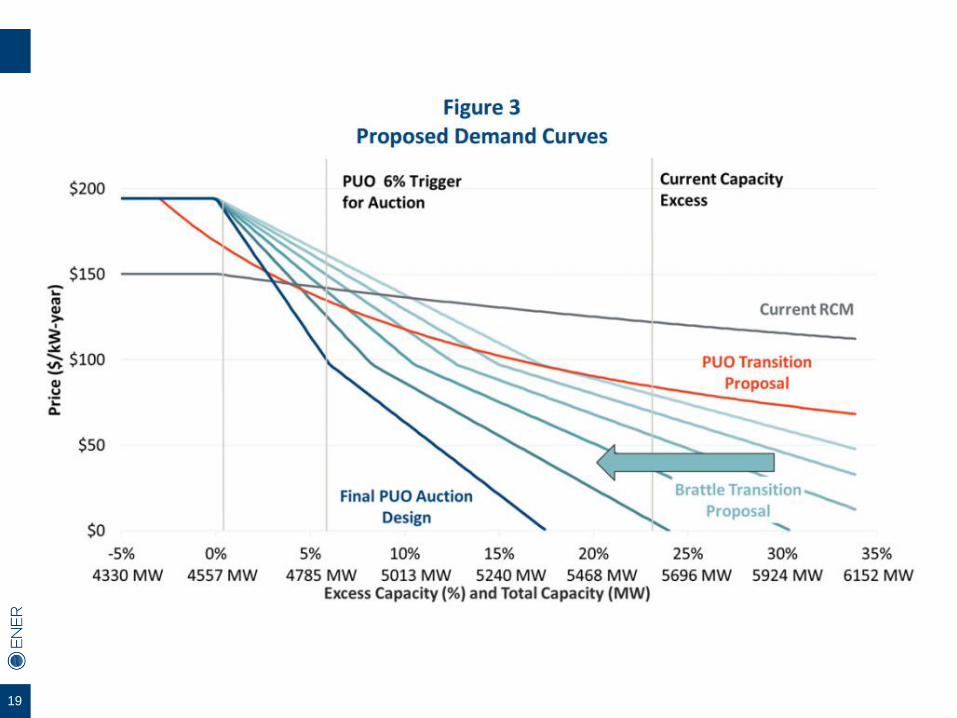
• Flat initial demand curve, as per PUO proposal
• Steepen the demand curve over time
• Institute a fixed timetable for the final design, reducing incentive for generators
to delay
19
20
21
A better way – Reform Synergy
• EMR hopelessly conflicted – Synergy’s Chairman is on Steering Committee.
• Underwater contracts
• High costs due to inefficient and ageing plant
• Lack of competition
• Effects of government ownership
• Solution: Restructure and privatise
22
Conclusion
• Blatant discrimination violates best practice and the WEM’s own objectives.
• Consumers and businesses lose while generators win.
• Government ownership is contaminating the policy process.
• There is a better way – competitive markets, now.