Embed Size (px)
Citation preview
1
JAMES BROWNLEEDEPARTMENT OF MARINE AND ENVIRONMENTAL
SYSTEMSFLORIDA INSTITUTE OF TECHNOLOGY
11/14 /2014
Optimization of the 45th Weather Squadron’s Linear “First Guess”
Minimum Temperature Prediction Equation
2
Introduction
The 45 WS provides weather forecasts for operations at KSC and CCAFS.
Some of these forecasts are used to determine whether or not weather conditions are suitable for rocket launches, ground processing, preparing for launches, personnel safety, and resource protection.
During winter, one of the most important of these forecasts is the minimum temperature advisory.
These minimum temperature advisories are critical for ground processing before launch, and can be critical for actual rocket launches.
Cold temperatures have been responsible for past disasters like Challenger.
3
Past Research and Improvements
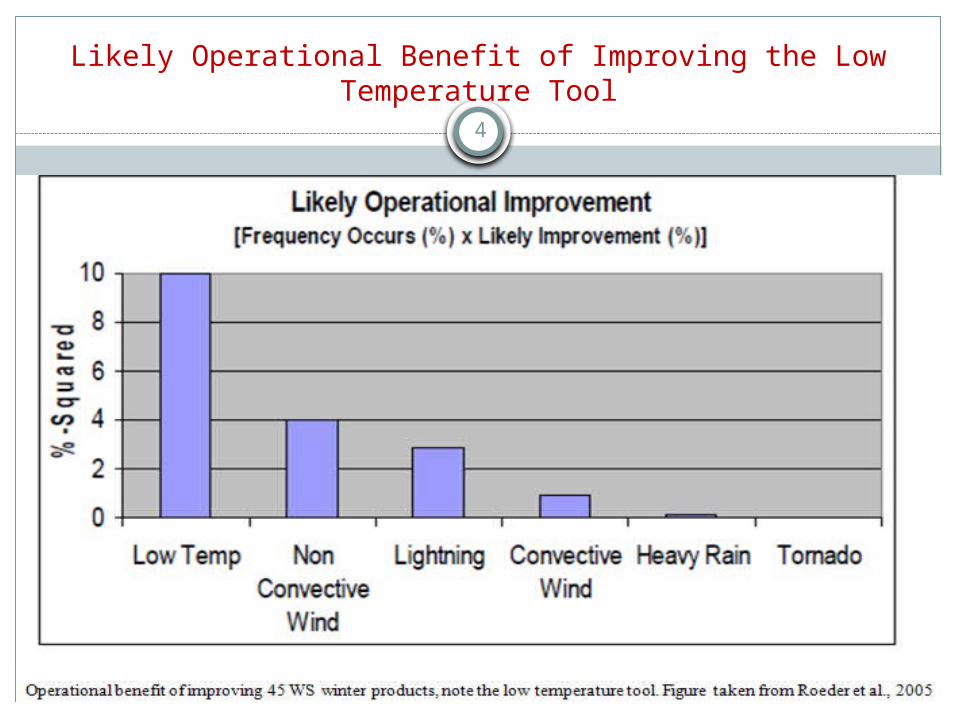
Prior research at the 45 WS has shown that improving the winter time low temperature predictions had the highest operational benefit during winter (it’s the most frequently issued product during winter).
In 2004, the old subjective low temperature flow chart was replaced with a more objective low temperature prediction tool
A major part of this upgrade included using a new linear regression “first guess” equation to make the initial minimum temperature predictions, which are then refined by various “correction factors”.
This equation was developed by the 14 WS at the request of the 45 WS.
The 45 WS slightly improved the accuracy of this equation with regression through the origin.
4
Likely Operational Benefit of Improving the Low Temperature Tool
5
Why the Linear “First Guess” Equation needs to be Re-Optimized
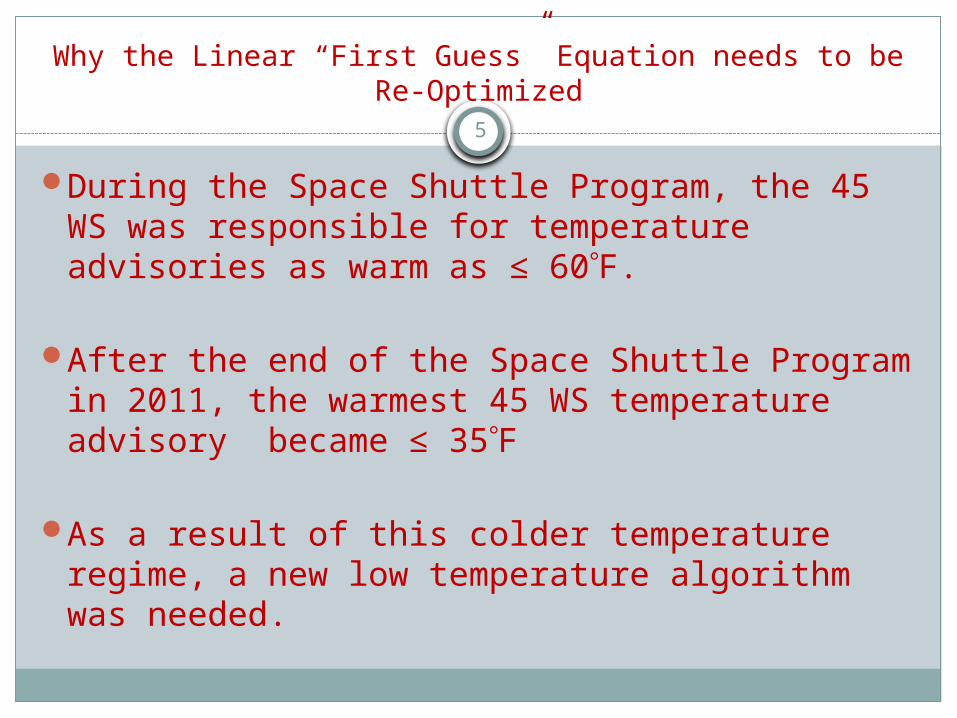
During the Space Shuttle Program, the 45 WS was responsible for temperature advisories as warm as ≤ 60F.
After the end of the Space Shuttle Program in 2011, the warmest 45 WS temperature advisory became ≤ 35F
As a result of this colder temperature regime, a new low temperature algorithm was needed.
6
The Linear Regression “First Guess” Equation
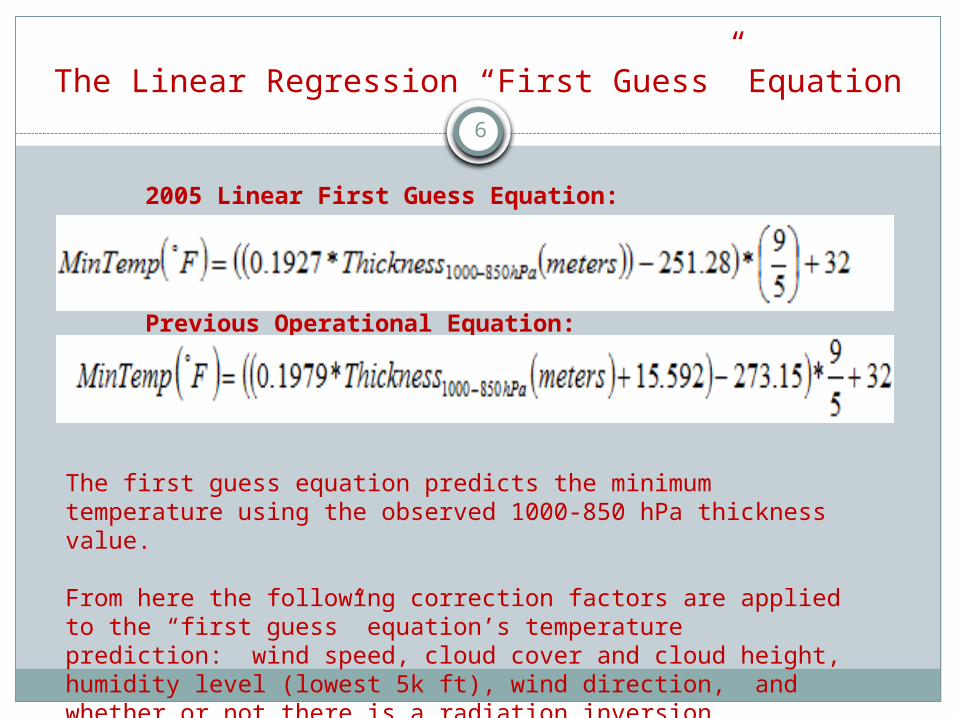
2005 Linear First Guess Equation:
Previous Operational Equation:
The first guess equation predicts the minimum temperature using the observed 1000-850 hPa thickness value.
From here the following correction factors are applied to the “first guess” equation’s temperature prediction: wind speed, cloud cover and cloud height, humidity level (lowest 5k ft), wind direction, and whether or not there is a radiation inversion.
7
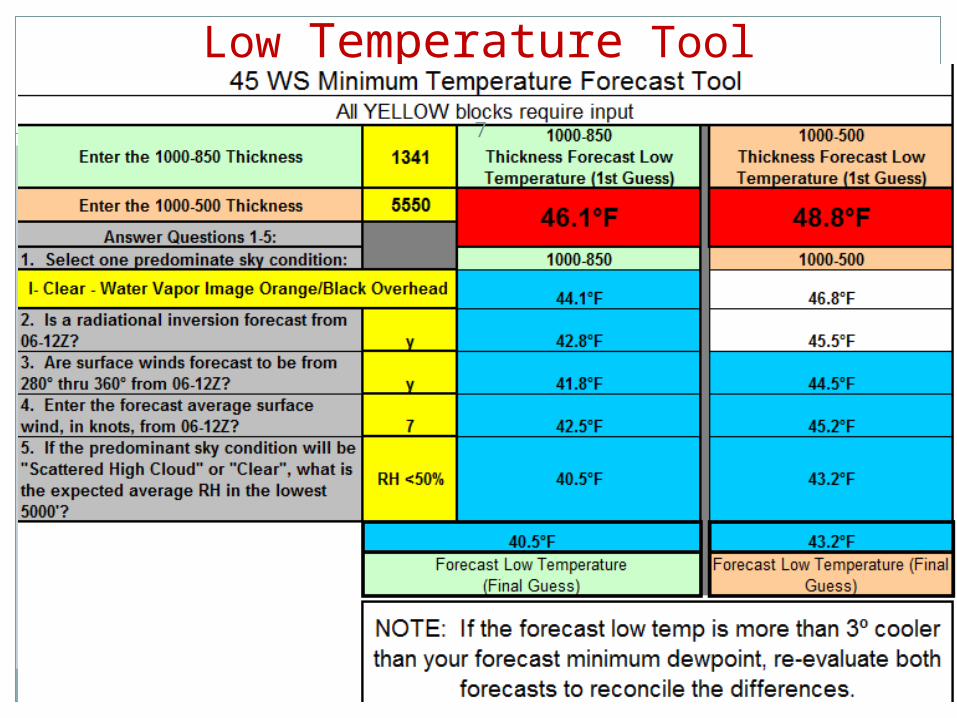
Low Temperature Tool
8
Optimization of the “First Guess” Equation
Met data for every cold event (min temp ≤ 45 °F) was collected for the years of 1986 to 2014. 45 F is warmer than the warmest advisory threshold, but was used to provide:
Adequate sample size Performance when “getting close” to the threshold and forecasters would begin using the
tool
The observed 1000-850 hPa thicknesses and minimum temperatures were used.
All cold events from 1986 to 2009 were used for optimization.2010-2014 was used for independent verification
For each event, low temperature predictions were made by the old equation
The error and error squared between the observed and predicted temperatures were calculated for each event, this was followed by RMSE and bias calculations for all events.
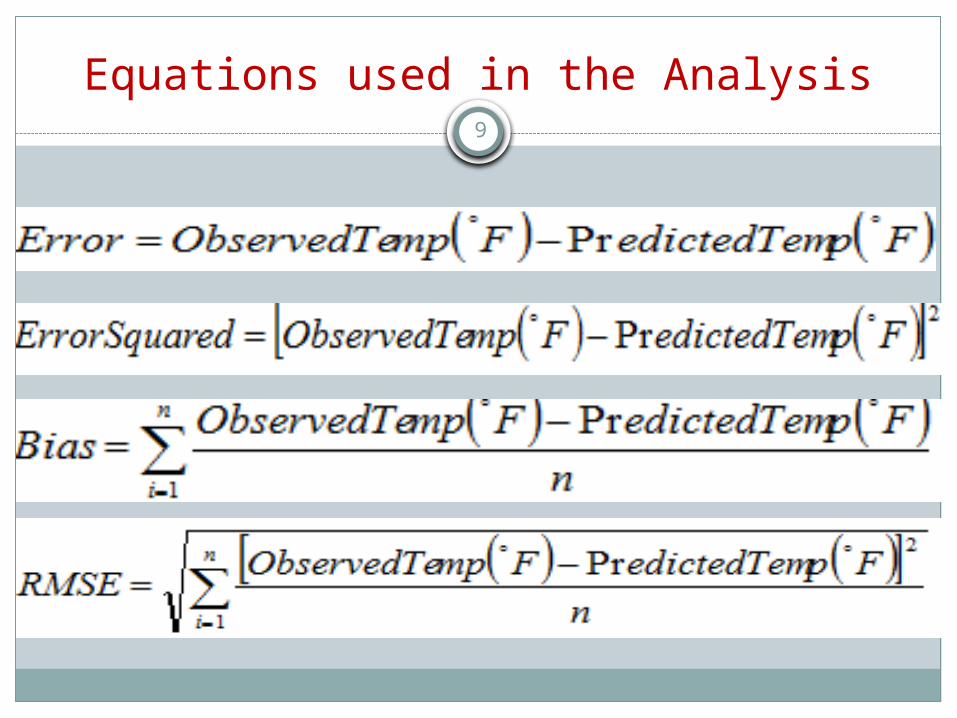
9
Equations used in the Analysis

10
Optimization of the “First Guess” Equation
After calculating the RMSE and bias values, the Excel Solver Tool was used to optimize the “first guess” equation.
To optimize the equation, the slope and y intercept of the linear equation along with the RMSE were entered into the Solver.
These three variables were set to the minimizer option.
Over a certain number of iterations, the solver attempts to minimize the RMSE by fitting the equation to the data set.
After the optimization the following new linear equation was created:
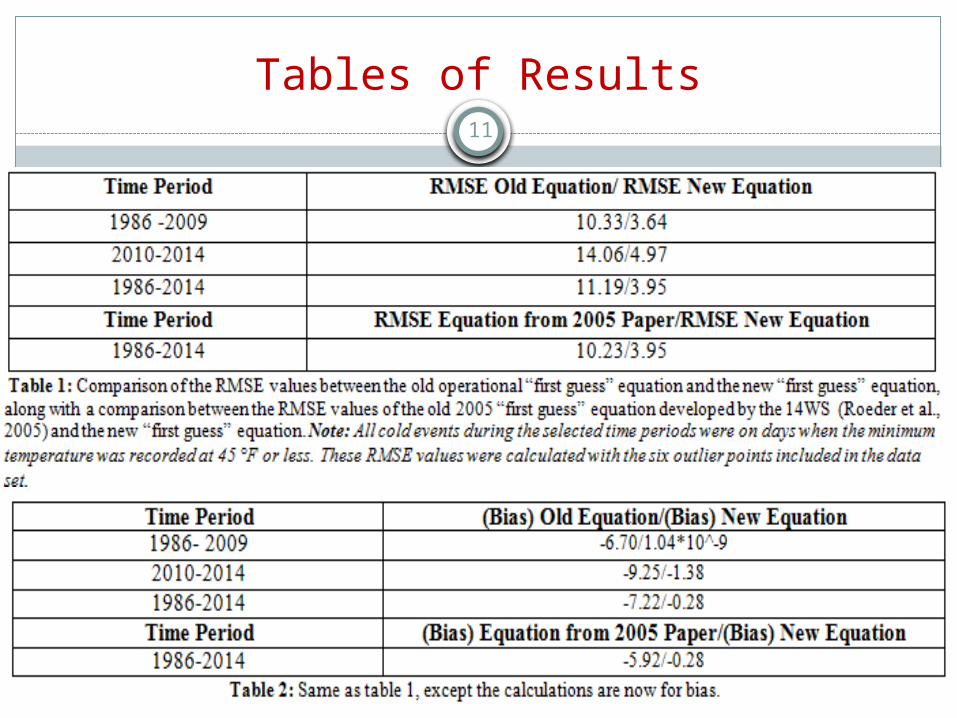
11
Tables of Results
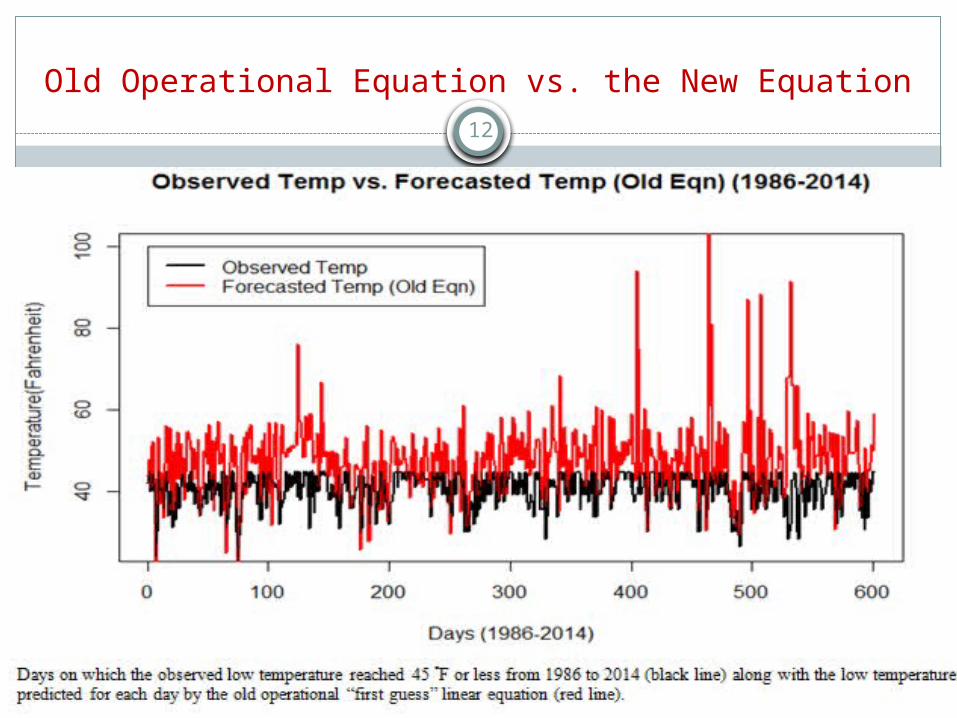
12
Old Operational Equation vs. the New Equation
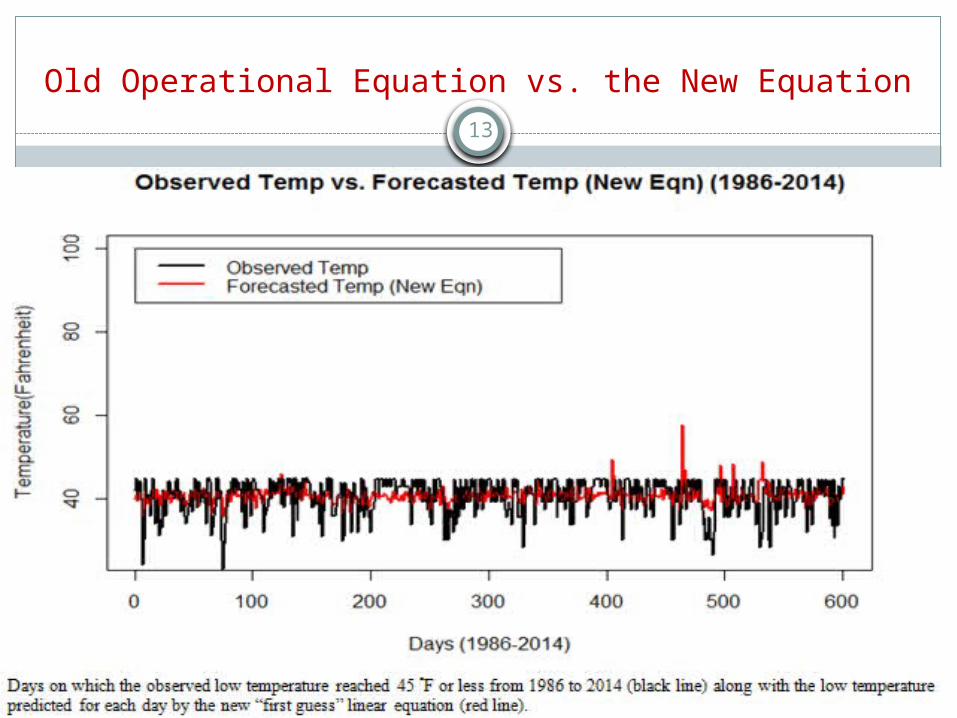
13
Old Operational Equation vs. the New Equation

14
Old Operational Equation vs. the New Equation
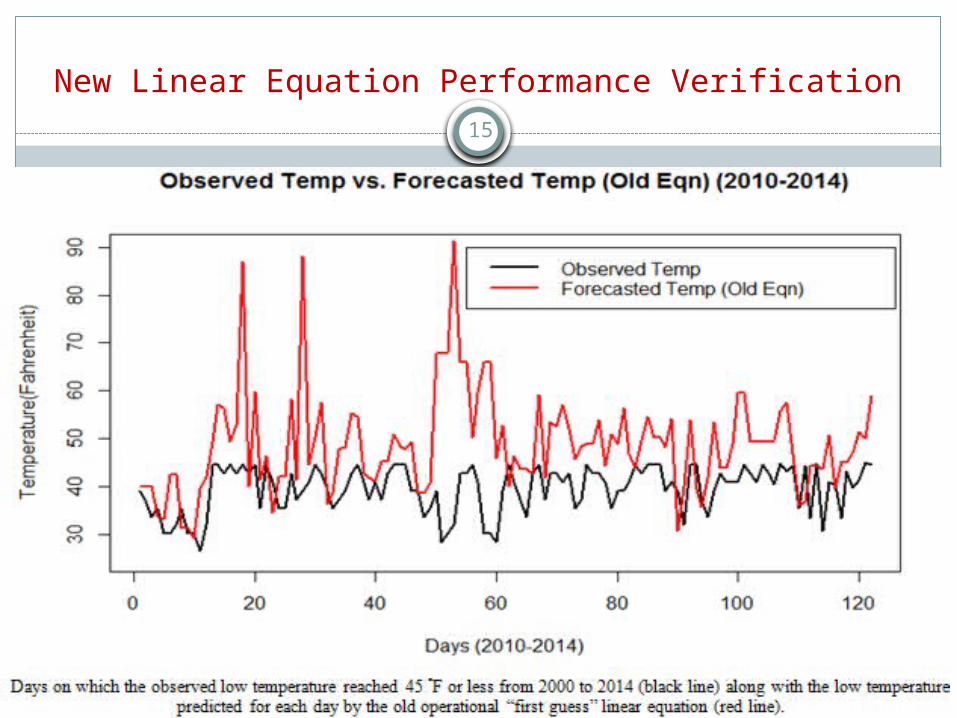
15
New Linear Equation Performance Verification

16
New Linear Equation Performance Verification
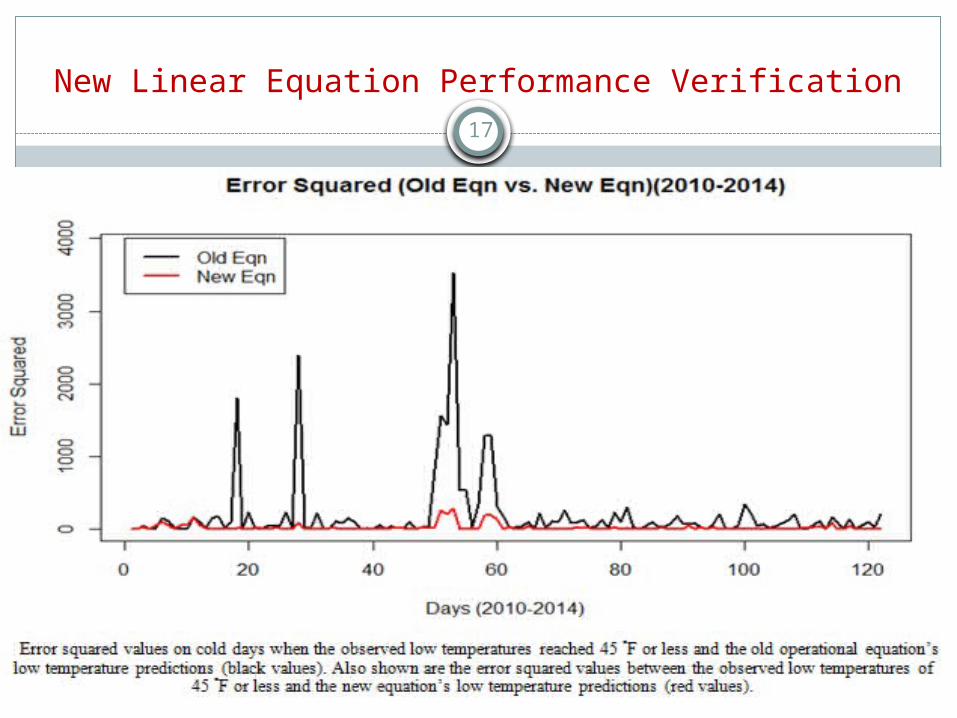
17
New Linear Equation Performance Verification
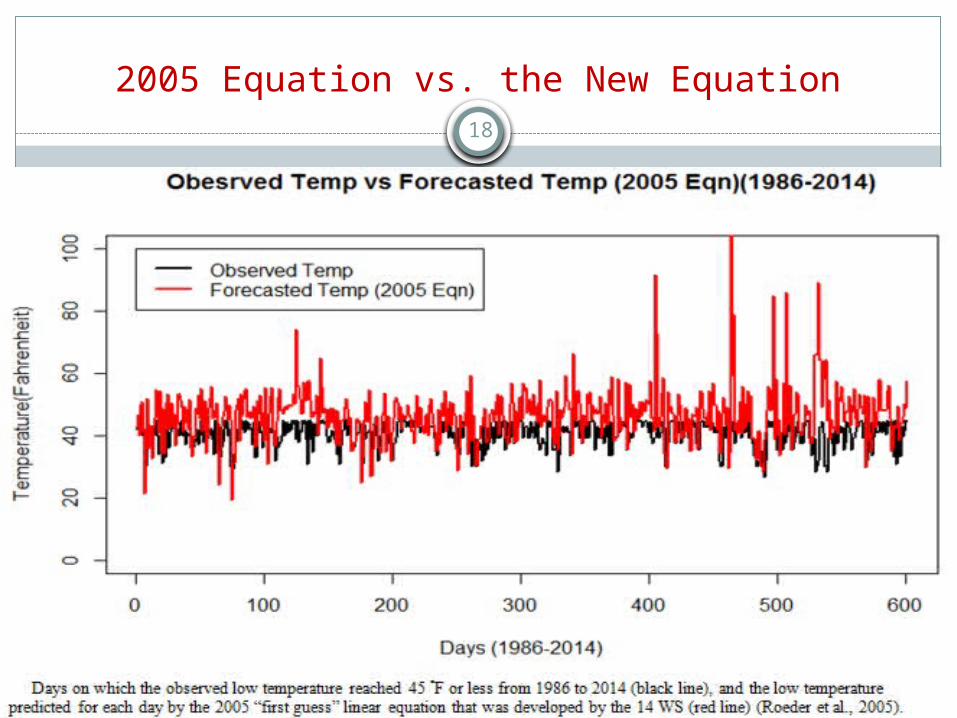
18
2005 Equation vs. the New Equation
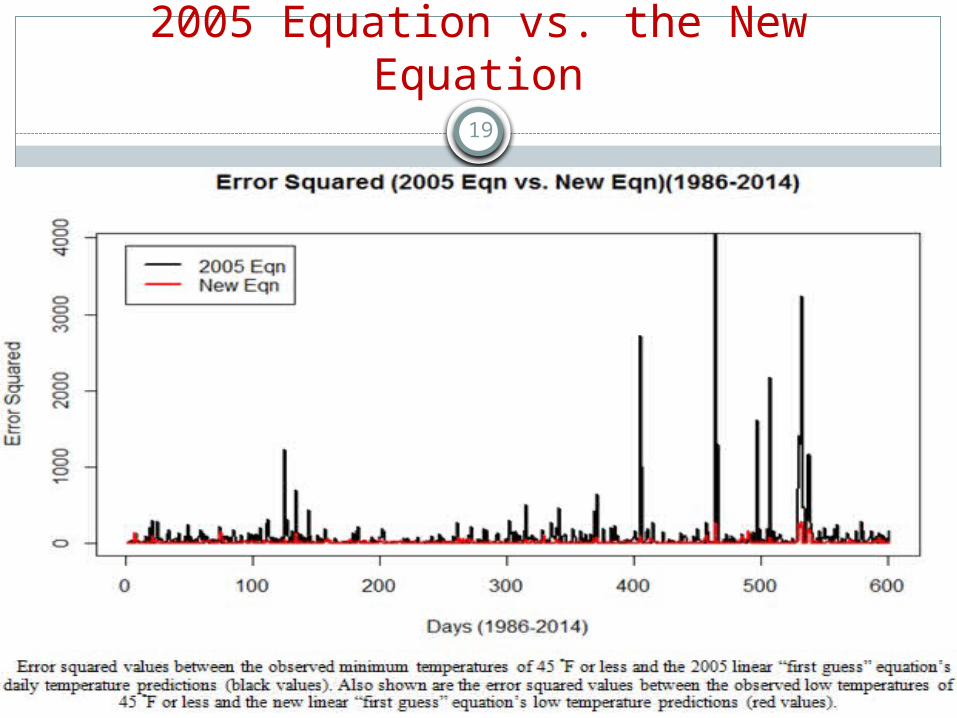
19
2005 Equation vs. the New Equation
20
Primary Points
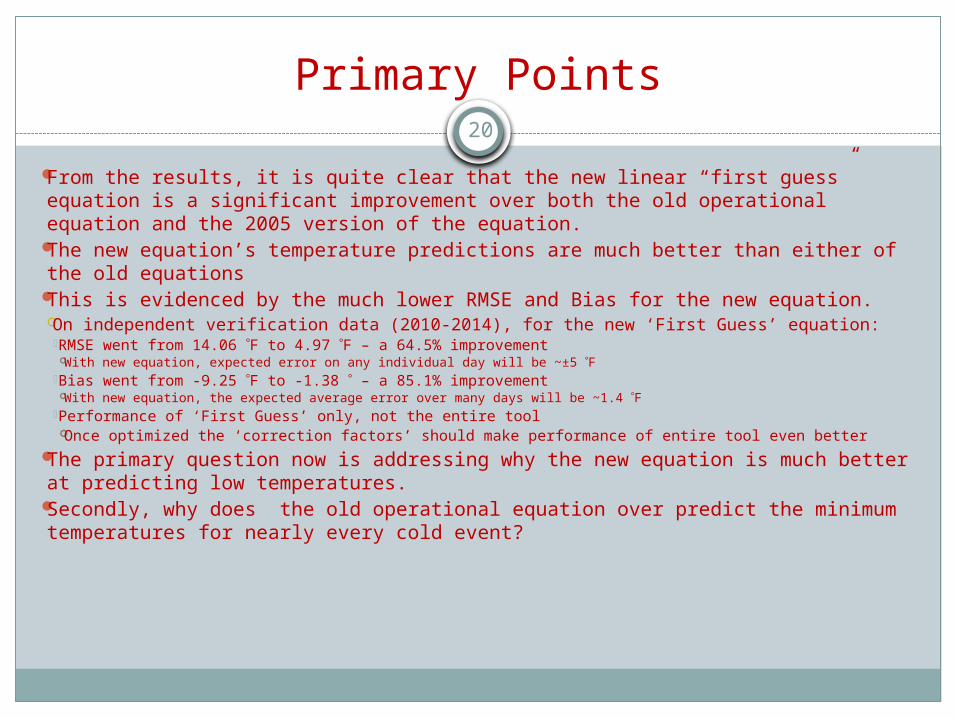
From the results, it is quite clear that the new linear “first guess” equation is a significant improvement over both the old operational equation and the 2005 version of the equation.
The new equation’s temperature predictions are much better than either of the old equations
This is evidenced by the much lower RMSE and Bias for the new equation. On independent verification data (2010-2014), for the new ‘First Guess’ equation:
RMSE went from 14.06 F to 4.97 F – a 64.5% improvement With new equation, expected error on any individual day will be ~±5 F
Bias went from -9.25 F to -1.38 – a 85.1% improvement With new equation, the expected average error over many days will be ~1.4 F
Performance of ‘First Guess’ only, not the entire tool Once optimized the ‘correction factors’ should make performance of entire tool even
better The primary question now is addressing why the new equation is much
better at predicting low temperatures. Secondly, why does the old operational equation over predict the minimum
temperatures for nearly every cold event?

21
Reasons for the New Equation’s Improved Accuracy
One significant reason for this is that the old equation was optimized for days when the low temperature was recorded at 60 °F or less.
Since the old operational linear regression equation was fitted for a data set which included low temperatures that high, the equation is less useful in predicting much colder temperatures; the old equation has a warm bias.
This warm bias is responsible for most of the high RMSE and negative bias values that occurred when the using the previous operational equation.
The new equation was optimized from a data set which included much cooler temperatures.
As a result, this new equation is much better at predicting low temperatures during major cold air advection events.
Based off this, it might be useful to use the new equation for major cold air advection events and use the old equation for less severe cold air outbreaks.
22
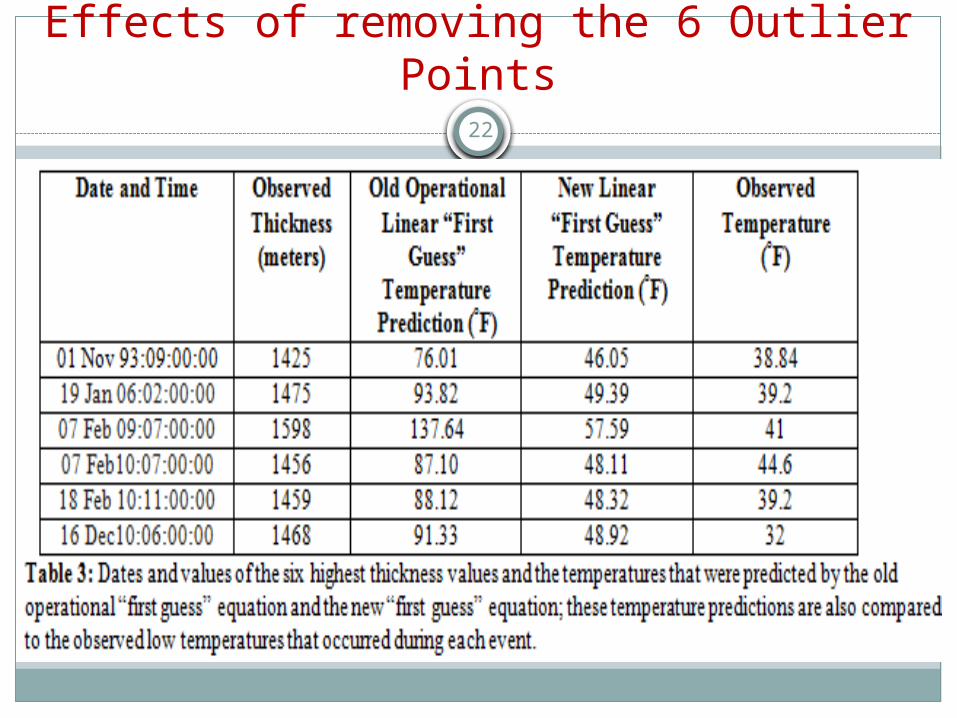
Effects of removing the 6 Outlier Points
23
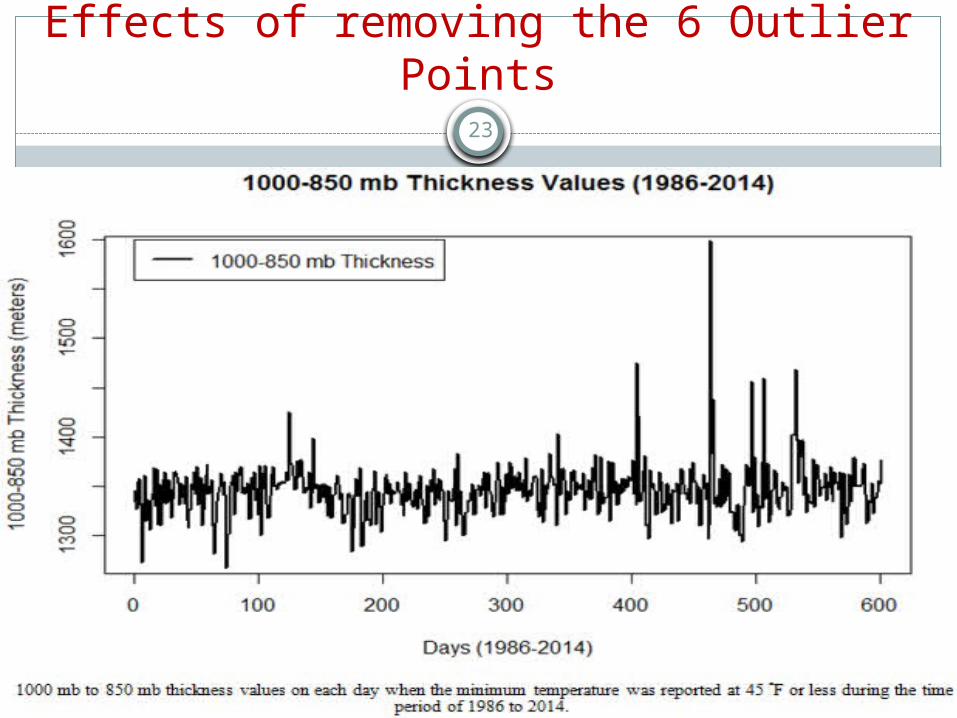
Effects of removing the 6 Outlier Points
24
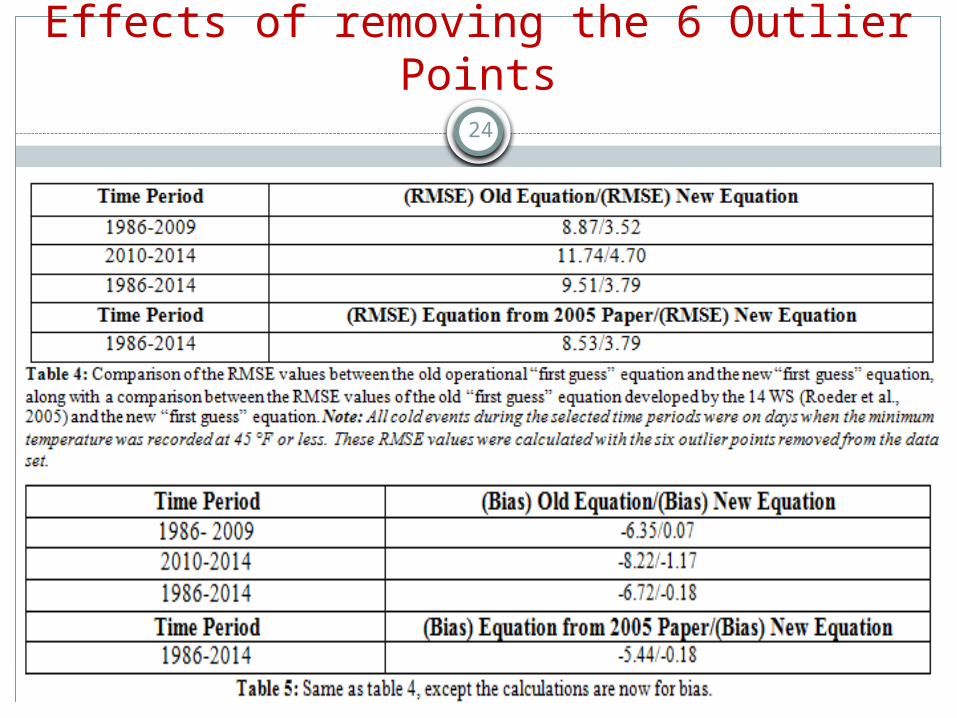
Effects of removing the 6 Outlier Points
25
Are these thickness values inaccurate?
Given the current data set, it is not really possible to really say with complete confidence.
It is interesting that all of these outlier points occurred at times when the observed temperature was much cooler than the indicated thickness height.
On some of these days, a major cold front might have moved through the area after the 850 mb height was recorded.
Such an event would reduce the 850 mb height.
This might explain the discrepancies between the reported heights and the reported minimum temperatures.
To prove this theory, more data and further analysis would be needed.
26
Other Work
The wind speed correction factor was also examined for optimization.
Initial results showed good performance, with little opportunity for improvement
Since the First Guess improvement was proving to be substantial,and since the First Guess is the most important part of the tool,we decided to concentrate the project on optimizing the First Guess
If the First Guess is wrong, minor refinements to a correction factorwill still yield poor results for the overall tool
27
Conclusion and Future Work
The new linear “first guess” equation is a much needed update to the previous “first guess” equation
It is much better at predicting low temperatures than the previous equation. First Guess RMSE improved 64.5% First Guess Bias improved 85.1%
Removing the 6 outlier points resulted in a more realistic RMSE and bias.
The next step in the optimization process is to optimize the Cloud Correction Factor. Next most important factor after ‘First Guess’ and wind speed. A proposed algorithm has already been written for this.
Optimizing the remaining correction factors should also be done
28
References
Roeder, W. P., McAleenan, M., Taylor, T. N., and T. L. Longmire, 2005: Applied Climatology In The Upgraded Minimum Temperature Prediction Tool For The Cape Canaveral Air Force Station and Kennedy Space Center, 15th Conference on Applied Climatology, 20-23 Jun 2005, 7 pp.


![Guess Lazily! [2 ]making a program guess, and guess well …okmij.org/ftp/kakuritu/StrangeLoop.pdf · · 2012-09-30making a program guess, and guess well ... and I give it away](https://img.pdfslide.us/doc/110x75/5b0d543c7f8b9ab7658c3d8a/guess-lazily-2-making-a-program-guess-and-guess-well-okmijorgftpkakuritu.jpg)