Embed Size (px)
Citation preview

Impact of point of care multiple micronutrient
fortification on anemia, iron status and cognitive
development of preschoolers
K.M Nair1, M. Black2, S.Fernandez-Rao1, K. Hurley3, N. Balakrishna1, K.
Radhakrishna, MBBS1, N.Tilton2, G. Reinhart4, Kim Harding5
1National Institute of Nutrition, 2University of Maryland School of Medicine, 3Johns
Hopkins Bloomberg School of Public Health, 4Mathile Institute for the Advancement in
Human Nutrition , 5 The Micronutrient Initiative
Registered at ClinicalTrials.gov (NCT01660958)

• ‘Point-of-care’ food fortification with MNP a novel
alternative to daily supplementation for delivering iron
and other micronutrients with foods
• Variability in the formulation of MNP, target age group,
and settings or context
• Early brain development is also sensitive to built
environment and services.
• Integrating nutrition with child development interventions
may lead to synergistic effects on early child development
that are stronger than single sector interventions.
• India provides an integrated nutrition/child development
(preschool) services through government-sponsored
Integrated Child Development Services.
Rationale
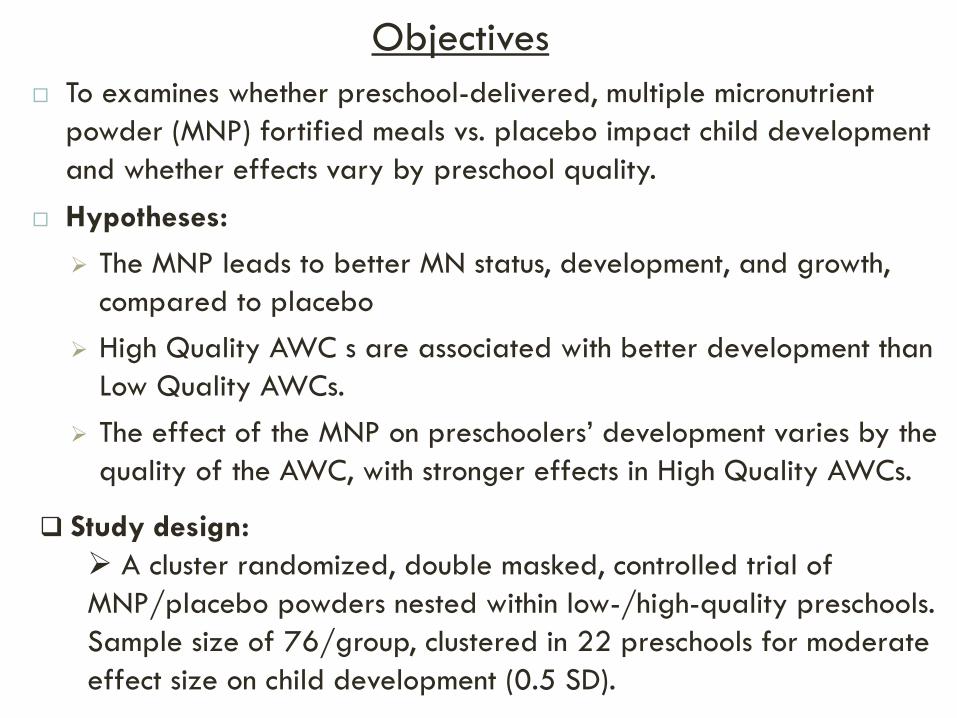
To examines whether preschool-delivered, multiple micronutrient
powder (MNP) fortified meals vs. placebo impact child development
and whether effects vary by preschool quality.
Hypotheses:
The MNP leads to better MN status, development, and growth,
compared to placebo
High Quality AWC s are associated with better development than
Low Quality AWCs.
The effect of the MNP on preschoolers’ development varies by the
quality of the AWC, with stronger effects in High Quality AWCs.
Objectives
Study design:
A cluster randomized, double masked, controlled trial of
MNP/placebo powders nested within low-/high-quality preschools.
Sample size of 76/group, clustered in 22 preschools for moderate
effect size on child development (0.5 SD).

Design
Randomly Selected AWC, n= 22
Eligible AWC Children
n= 336
Baseline
n = 321
Low Quality AWC
n=11
High Quality AWC
n=11
End line
n= 298
MNP
n=77
PLACEBO
n=88
MNP
n=94
PLACEBO
n=67
MNP
n=66
PLACEBO
n=85
MNP
n=85
PLACEBO
n=62
Rated using modified Early Childhood Environment Rating Scale (ECERS) and Home/Preschool Observation of the Environment
(HOME)
MNP/placebo nested within High/Low Quality AWCs (cluster randomization)
• Dewormed
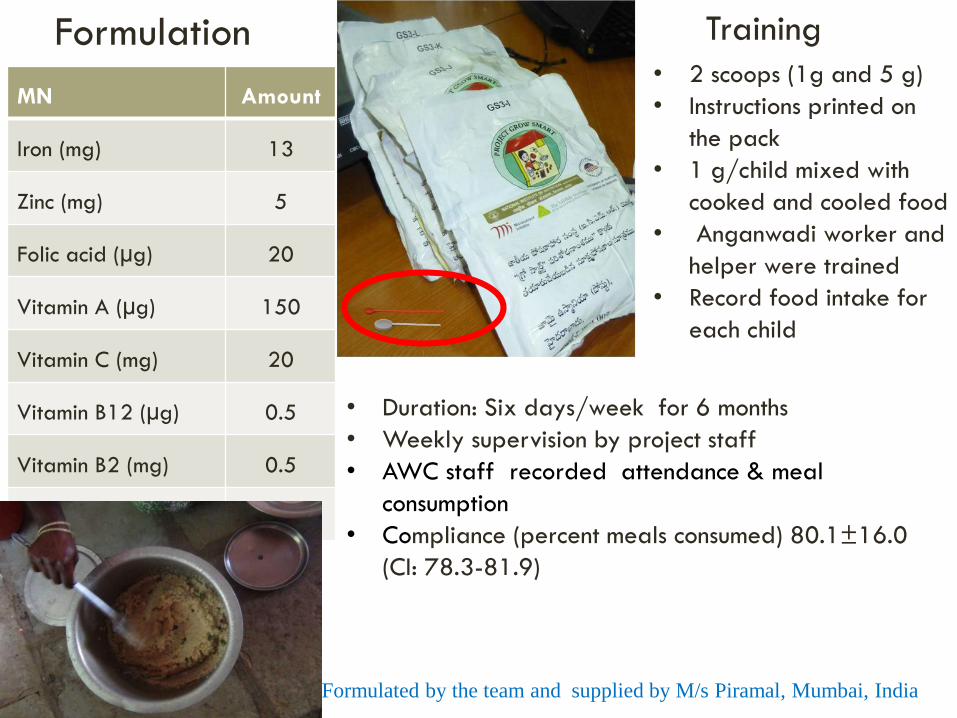
Formulation
MN Amount
Iron (mg) 13
Zinc (mg) 5
Folic acid (µg) 20
Vitamin A (µg) 150
Vitamin C (mg) 20
Vitamin B12 (µg) 0.5
Vitamin B2 (mg) 0.5
Placebo B2 (mg) 0.5
Formulated by the team and supplied by M/s Piramal, Mumbai, India
• 2 scoops (1g and 5 g)
• Instructions printed on
the pack
• 1 g/child mixed with
cooked and cooled food
• Anganwadi worker and
helper were trained
• Record food intake for
each child
Training
• Duration: Six days/week for 6 months
• Weekly supervision by project staff
• AWC staff recorded attendance & meal
consumption
• Compliance (percent meals consumed) 80.1±16.0
(CI: 78.3-81.9)
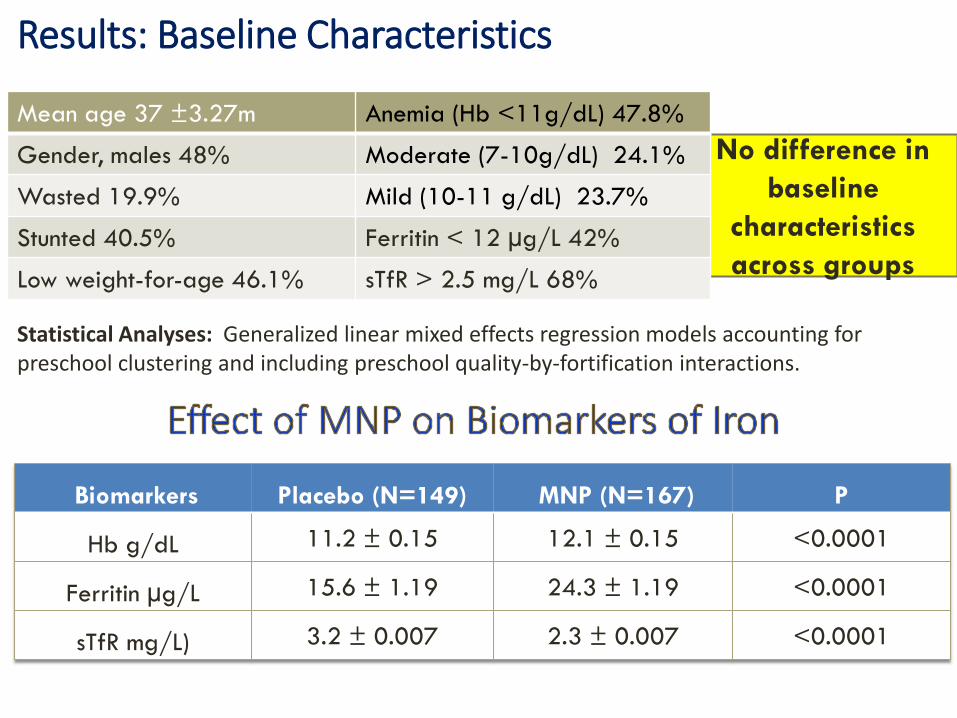
Results: Baseline Characteristics
No difference in
baseline
characteristics
across groups
Biomarkers Placebo (N=149) MNP (N=167) P
Hb g/dL 11.2 ± 0.15 12.1 ± 0.15 <0.0001
Ferritin µg/L 15.6 ± 1.19 24.3 ± 1.19 <0.0001
sTfR mg/L) 3.2 ± 0.007 2.3 ± 0.007 <0.0001
Mean age 37 ±3.27m Anemia (Hb <11g/dL) 47.8%
Gender, males 48% Moderate (7-10g/dL) 24.1%
Wasted 19.9% Mild (10-11 g/dL) 23.7%
Stunted 40.5% Ferritin < 12 µg/L 42%
Low weight-for-age 46.1% sTfR > 2.5 mg/L 68%
Statistical Analyses: Generalized linear mixed effects regression models accounting for preschool clustering and including preschool quality-by-fortification interactions.

35.1
51
66.4
9.5 7.9
24.5
0
10
20
30
40
50
60
70
Anemia <11 g/dL Ferritin <12 ng/mL sTfR >2.5mg/L
Placebo (N=151) MNP (N=170)
Pe
rce
nta
ge
End line values were adjusted with baseline values and clustering effect
64.3
15.7 19.3
0.7
90.5
7.52 0
0102030405060708090
100
No-anemia Mild Moderate Severe
Placebo MNP
Perc
enta
ge
P<0.0001
No significant change of other micronutrients
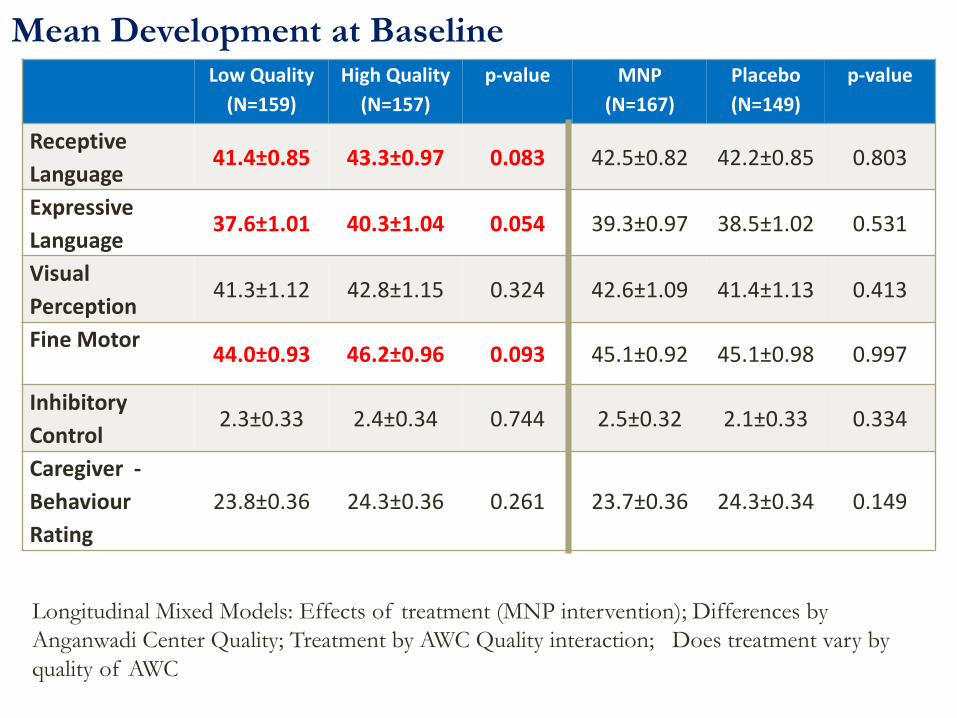
Mean Development at Baseline Low Quality
(N=159)
High Quality
(N=157)
p-value MNP
(N=167)
Placebo
(N=149)
p-value
Receptive
Language41.4±0.85 43.3±0.97 0.083 42.5±0.82 42.2±0.85 0.803
Expressive
Language 37.6±1.01 40.3±1.04 0.054 39.3±0.97 38.5±1.02 0.531
Visual
Perception 41.3±1.12 42.8±1.15 0.324 42.6±1.09 41.4±1.13 0.413
Fine Motor 44.0±0.93 46.2±0.96 0.093 45.1±0.92 45.1±0.98 0.997
Inhibitory
Control 2.3±0.33 2.4±0.34 0.744 2.5±0.32 2.1±0.33 0.334
Caregiver -
Behaviour
Rating
23.8±0.36 24.3±0.36 0.261 23.7±0.36 24.3±0.34 0.149
Longitudinal Mixed Models: Effects of treatment (MNP intervention); Differences by
Anganwadi Center Quality; Treatment by AWC Quality interaction; Does treatment vary by
quality of AWC
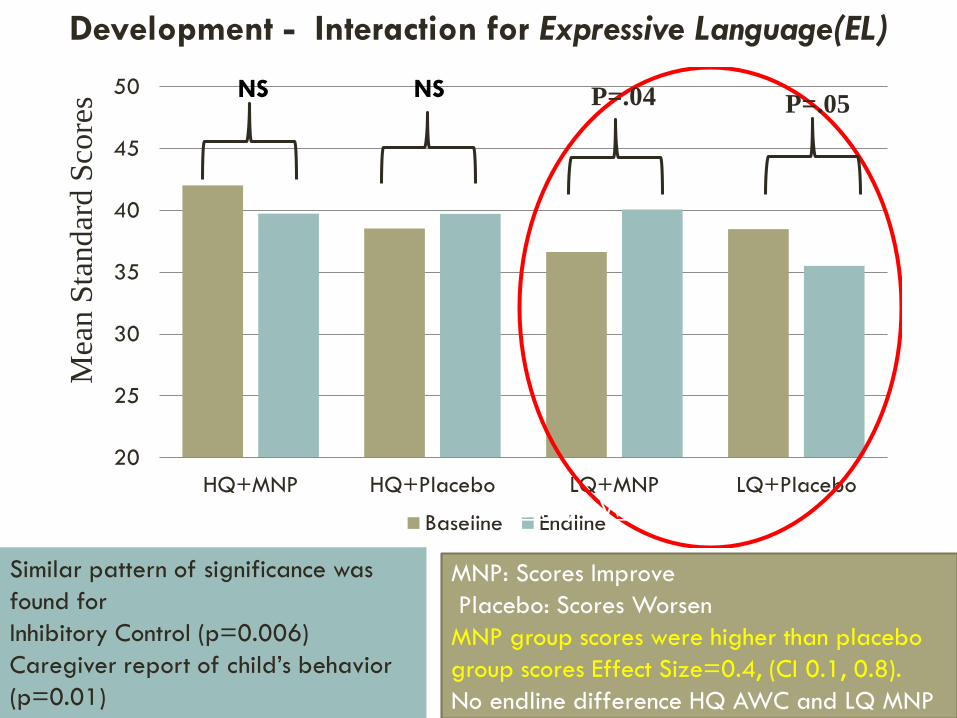
Development - Interaction for Expressive Language(EL)
20
25
30
35
40
45
50
HQ+MNP HQ+Placebo LQ+MNP LQ+Placebo
Baseline Endline
NS NSM
ean S
tandar
d S
core
s P=.04 P=.05
Low Quality AWC
MNP: Scores Improve
Placebo: Scores Worsen
MNP group scores were higher than placebo
group scores Effect Size=0.4, (CI 0.1, 0.8).
No endline difference HQ AWC and LQ MNP
Similar pattern of significance was
found for
Inhibitory Control (p=0.006)
Caregiver report of child’s behavior
(p=0.01)
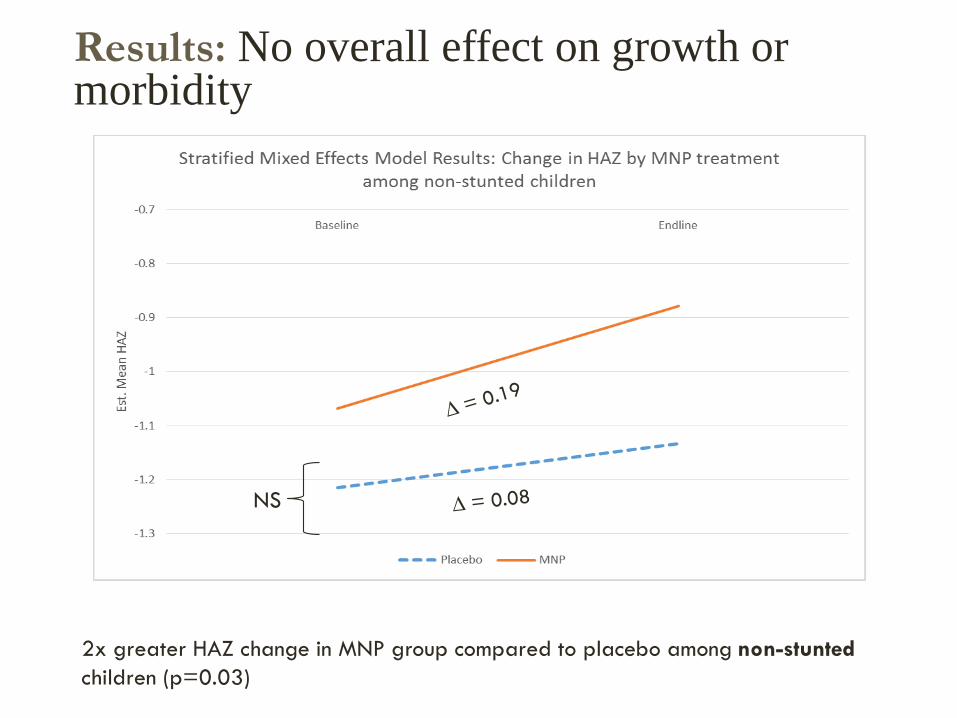
2x greater HAZ change in MNP group compared to placebo among non-stunted
children (p=0.03)
NS
Results: No overall effect on growth or morbidity

Conclusions
Adding MNP fortification to preschool meals reduces rates of anemia
and iron deficiency, and reduces disparities in language, inhibitory
control and parent-reported behavior associated with preschool
quality.
Scaling MNP meal fortification and improving preschool quality can
enhance preschoolers’ development and reduce disparities.
The ICDS platform and its supply chain (CDPOs Godown)
Cost of the MNP is 35 paise per child/day
Implications for scaling up