Embed Size (px)
Citation preview

Effectiveness of Higher Education to Labor Productivity
Jung, Dae Bum (Jinju Health College)

Ⅰ. Introduction
Key words of current world trends
Globalization
Knowledge-based economy
Communicopia
post-information
Ubiquitous-computing (mobile based network)
Harbison & Myers’s study
Education - Economic development
Human resource as the core factor for
the economic development
Limitation
Use the cross-section data (1950s – 1960s)
Research methods : Correlation, Coefficient

Direction of this study Long-term higher education rate Labor productivity Research method
Variable control Regression formulation
Compared and contrasted various regression Model
Explain labor productivity
Explain the contribution of higher education toLabor productivity
Find Unobservable individual effect to labor productivity
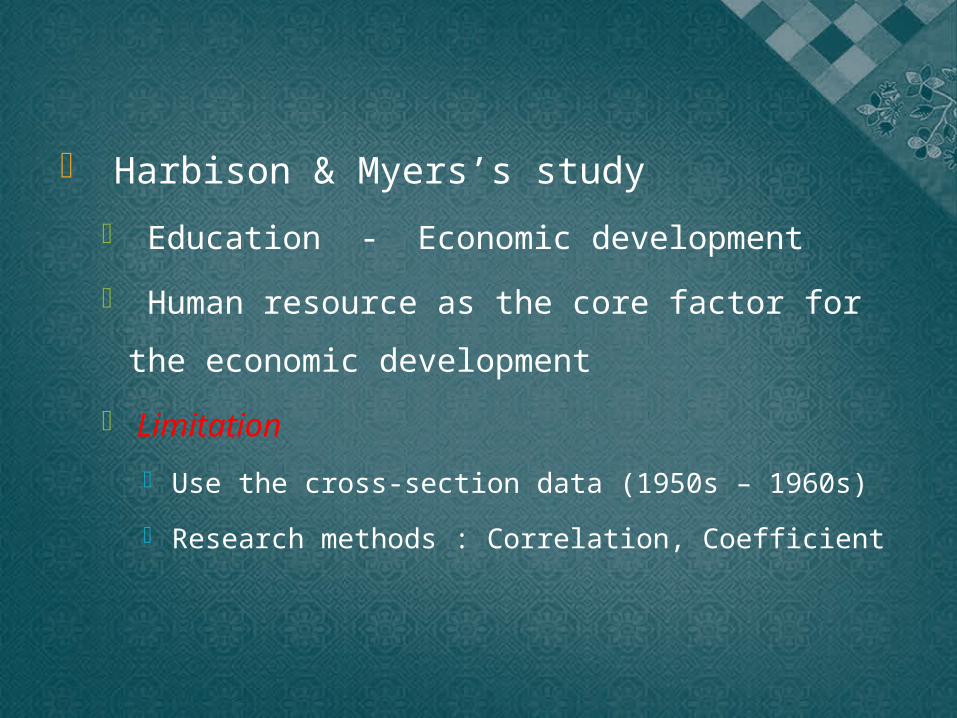
Ⅱ. Theoretical Background (Precedent Research)
Researcher Analysis Year Analysis Target Index for Educational Development Index for Economic
DevelopmentAnalysis Method
Harbison &
Myers1959 75 countries
% of enrollment in Schools
GNP / capitaEstimation of cross-sectional correlation
coefficient% of public education fee
Bannett 1955-1956 69 countries
% of academic educationin secondary school
GNP / capitaEstimation of cross-sectional correlation
coefficient% of vocational educationin secondary school
Curle 1958 57 countries
% of enrollment in secondary school
Rate of savings
Estimation of cross-sectional correlation
coefficient
GNP / capita
% of investment in education
Rate of economic growth
% of enrollment in elementary school
Infant mortality rate
Bowman 1950-1955 83 countries % of literacy GNP / capitaEstimation of cross-sectional correlation
coefficient

Ⅲ. Research Methods
Analysis Data Data from Korea Information Service-Fi-
nancial Accounting Systems(KIS-FAS)
Financial Information of Companies (1990-2009) Listed on Korea Stock Ex-change
Population of Higher Education
Economically Ac-tive population
Labor Productiv-ity

Item Variables Details of Variables
Dependent
Variables
The sales / person
(lnSPP)
the value after taking a natural logarithm to the total sales/the number
of employees (1 million won)
Explanator
y Variables
Quality of human
capital
(LnEDU)
the value after taking a natural logarithm to population with college
degree available for economical activities (1 thousand people)
Capital intensity /
person
(lnFCP)
the value after taking a natural logarithm to {(intangible fixed asset-con-
struction temporary account/the number of employees)} (1 million won)
Training cost / person
(lnEEP)
the value after taking a natural logarithm to (the total cost for training
the number of employees) (1 thousand won)
Employees
(lnNOE)the value after taking a natural logarithm to the number of employees
Proportion of incentives
(INC)Proportion of the incentives per quarter (%)
Research Variables

Year Average Standard Deviation Minimum Maximum
1990 4.496 0.674 2.706 7.719
1991 4.634 0.704 2.710 7.886
1992 4.750 0.701 2.831 8.057
1993 4.849 0.706 2.592 8.084
1994 5.010 0.679 2.975 8.352
1995 5.146 0.688 3.138 8.619
1996 5.278 0.691 3.406 8.972
1997 5.437 0.714 3.508 9.523
1998 5.578 0.773 3.494 9.794
1999 5.690 0.746 3.666 9.747
2000 5.776 0.743 3.891 8.827
2001 5.833 0.733 4.038 8.872
2002 5.930 0.760 4.163 8.765
2003 5.957 0.744 4.199 8.587
2004 6.068 0.761 4.401 8.809
2005 6.121 0.752 4.394 8.784
2006 6.189 0.778 4.416 8.732
2007 6.254 0.778 4.166 8.761
The average of the sales per person (N=216)

Variables
Average (Standard Deviation)
1990 1991 1992 1993 1994 1995 1996 1997 1998 1999 2000 2001 2002 2003 2004 2005 2006 2007
Ln
EDU8.074 8.183 8.310 8.408 8.456 8.522 8.584 8.616 8.763 8.806 8.858 8.913 8.969 9.096 9.145 9.195 9.243 9.293
Ln
EEP
3.787
(1.357)
4.024
(1.376)
4.135
(1.401)
4.1770
(1.564)
4.374
(1.524)
4.584
(1.476)
4.677
(1.427)
4.626
(1.396)
3.900
(1.736)
4.092
(1.575)
4.357
(1.537)
4.367
(1.760)
4.692
(1.504)
4.724
(1.638)
4.880
(1.449)
5.018
(1.483)
5.166
(1.513)
5.190
(1.542)
Ln
FCP
11.510
(0.754)
11.694
(0.753)
11.830
(0.740)
11.939
(0.755)
12.095
(0.708)
12.232
(0.698)
12.373
(0.710)
12.588
(0.735)
12.809
(0.772)
12.902
(0.758)
12.908
(0.760)
12.929
(0.732)
12.958
(0.750)
12.999
(0.742)
13.066
(0.746)
13.145
(0.712)
13.230
(0.744)
13.310
(0.741)
Ln
NOE
6.866
(1.156)
6.877
(1.145)
6.852
(1.144)
6.827
(1.150)
6.806
(1.145)
6.820
(1.152)
6.811
(1.158)
6.759
(1.156)
6.595
(1.188)
6.564
(1.185)
6.578
(1.193)
6.551
(1.175)
6.505
(1.154)
6.477
(1.160)
6.450
(1.187)
6.421
(1.217)
6.396
(1.231)
6.378
(1.258)
INC9.383
(4.664)
8.560
(4.812)
7.602
(4.976)
7.218
(5.228)
7.780
(5.557)
7.903
(5.848)
7.664
(5.991)
5.652
(6.922)
5.958
(8.035)
7.948
(9.202)
8.076
(9.23)
8.135
(9.197)
9.882
(10.500)
10.851
(13.464)
12.124
(16.765)
13.285
(23.274)
12.573
(17.189)
14.277
(25.122)
N 216 216 216 216 216 216 216 216 216 216 216 216 216 216 216 216 216 216
Explanatory variables technical statistics

Research Model Basic statistics model
* = firm , * = year*L= the number of labor, *Q=gross sales *EDU= the level of education
* = firm , * = year

Research Model
*= the value after taking a natural logarithm to the sales per person
* = the value after taking a natural logarithm to the percentage of people who completed middle school and high school out of all the people involved in economical activity
*= the value after taking a natural logarithm to capital intensity per person
*= the value after taking a natural logarithm to capital intensity per person
*

Analysis of correlation [Labor productivity – HER(Higher Education
Ratio)]
Ⅳ. Study Results
the sales per person (1990-2007)
people with higher education among economically active population
(1990-2007)
Spearman's correlation coefficient 0.96**
N 373
Notes. * : p < 0.05, ** : p< 0.01

Change of labor productivity to HER
YEAReconomically active population
with more than college education(EDD)
the sales per person(SPP)
the average sales of company(SPPP)
1990 3,211 242,687 484,309
1991 3,583 263,915 531,404
1992 4,068 279,507 559,920
1993 4,487 290,365 586,850
1994 4,704 317,486 644,109
1995 5,025 352,854 736,868
1996 5,350 394,950 815,067
1997 5,520 474,145 880,504
1998 6,399 539,473 821,897
1999 6,679 572,381 909,222
2000 7,031 552,099 1,016,294
2001 7,431 556,407 1,032,935
2002 7,863 606,382 1,075,459
2003 8,927 582,117 1,050,310
2004 9,371 642,522 1,153,542
2005 9,848 657,241 1,178,319
2006 10,337 698,761 1,204,078
2007 10,867 730,776 1,267,300
unit: EDU=1,000 people, SPP=10,000 won, SPPP=1,000,000 won
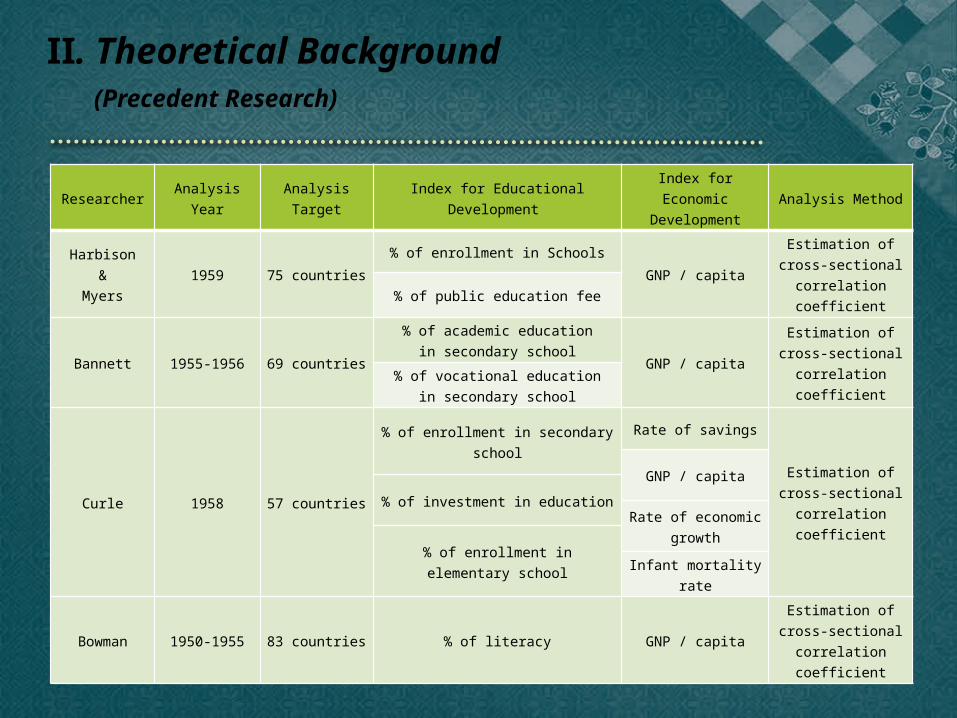
Figure 1. The change of the rate of people with higher education among economically active population and the average sales of companies by
year
Notes: SPPP= the average sales EDU= college graduates rate among economically active population

Figure 2. The change of the rate of people with higher education among economically active population and the sales per person by
year
Notes:SPP= the sales per personEDU= college graduates rate among economically active population

Analysis result of the panel data
FE POLS RE
LnEDU0.710
(33.56)**
0.286
(12.51)**
0.672
(20.86)**
LnEEP0.051
(11.83)**
0.043
(9.37)**
0.055
(12.44)**
LnFCP0.486
(36.00)**
0.781
(85.30)**
0.515
(38.79)**
LnNOE-0.008
(-0.53)
-0.036
(-5.91)
-0.042
(-3.79)**
INC0.001
(3.90)**
0.002
(5.13)**
0.001
(4.01)**
Adj-R2 0.756 0.796 0.587
N 3888 (216 companies) 3888 3888 (216 companies)
Notes : 1. * : p < 0.05, ** : p< 0.012. The value in parenthesis is t.3. variables:
LnEDU = the value taken natural logarithm into the number of economically active population with more than college educationLnEEP = the value taken natural logarithm into the education fee per personLnFCP = the value taken natural logarithm into capital intensity per personLnNOE = the value taken natural logarithm into the number of workersINC = incentive index

Analysis result of the panel data (per size of companies)
FE POLS RE
LnEDU 0.429(18.44)**
0.665(23.93)**
0.440(19.26)**
LnEEP 0.044(9.76)**
0.030(5.08)**
0.043(9.63)**
LnFCP 0.297(33.11)**
0.538(53.88)**
0.309(34.86)**
INC 0.002(5.08)**
0.002(4.10)**
0.002(5.03)**
SSIZE -0.433(-12.40)**
-1.616(-43.71)**
-0.514(-14.95)**
MSIZE -0.301(-11.02)**
-1.166(-37.85)**
-0.360(-13.34)**
MLSIZE -0.184(-8.79)**
-0.804(-29.37)**
-0.221(-10.57)**
Adj-R2 0.573 0.665 0.586
N 3888 (216 companies) 3888 3888 (216 companies)
Notes : 1. * : p < 0.05, ** : p< 0.012. The value in parenthesis is t.3. variables:
SSIZE= number of workers<350MSIZE= 350<number of workers<690MLSIZE= 690<number of workers<1320LSIZE= number of workers>1320divided by quartile of the number of workers

Ⅴ. Conclusions & Suggestions
Conclusions
People with long-term higher education has a positive effect on labor productivity
The importance of human capital development shows in case what Korea faced on 1997
The investment in human capital by company will be increase

Suggestions
Need more support to HR Development
at the level of nation and company
Further research need private approach with va-
riety method for more practical information to gov-
ernment, company and individuals

Thank you


![NAP Gen. Circular 3 [GRDS for LGUs]](https://img.pdfslide.us/doc/110x75/586a136a1a28ab677d8bb7b9/nap-gen-circular-3-grds-for-lgus.jpg)