Embed Size (px)
Citation preview
Our Story: Calfrac’s Journey to Improved Engagement
1
IBM Smarter Workforce Summit
Toronto, ON | April 30, 2015
Rob Kearley
Director Human Resources International Operations

• Our Story
• Key Drivers & Goals
• Conducting the Survey
• Key Findings – Themes Identified
– Employee Engagement
– Performance Enablement
– Manager Effectiveness
– Linking Engagement to KPIs
• What’s next?
Agenda
2
3
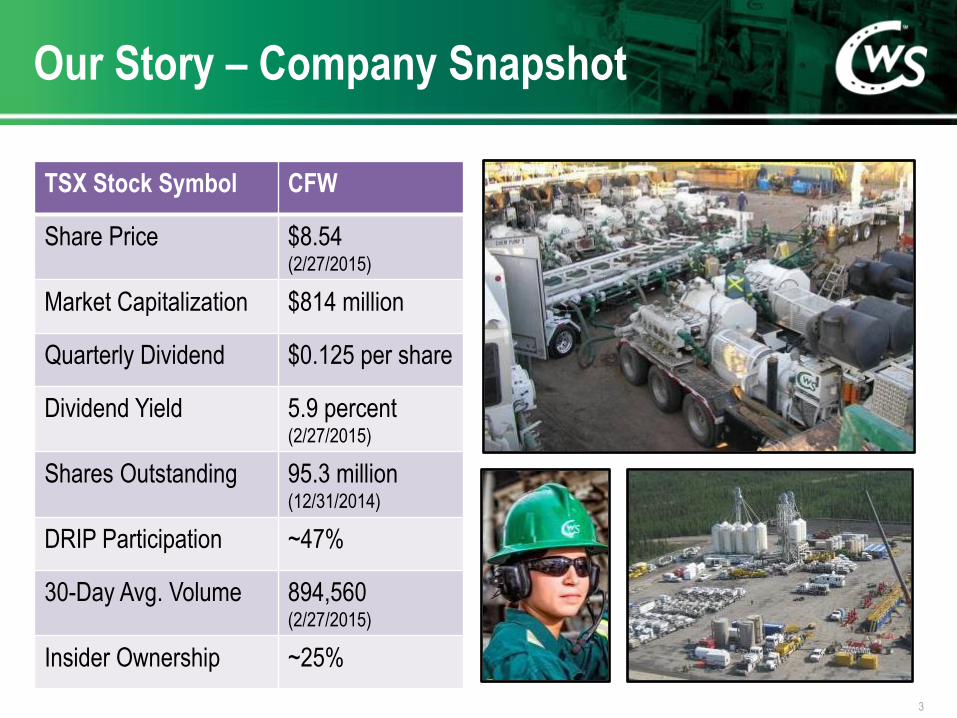
Our Story – Company Snapshot
TSX Stock Symbol CFW
Share Price $8.54 (2/27/2015)
Market Capitalization $814 million
Quarterly Dividend $0.125 per share
Dividend Yield 5.9 percent (2/27/2015)
Shares Outstanding 95.3 million (12/31/2014)
DRIP Participation ~47%
30-Day Avg. Volume 894,560 (2/27/2015)
Insider Ownership ~25%
Suppliers
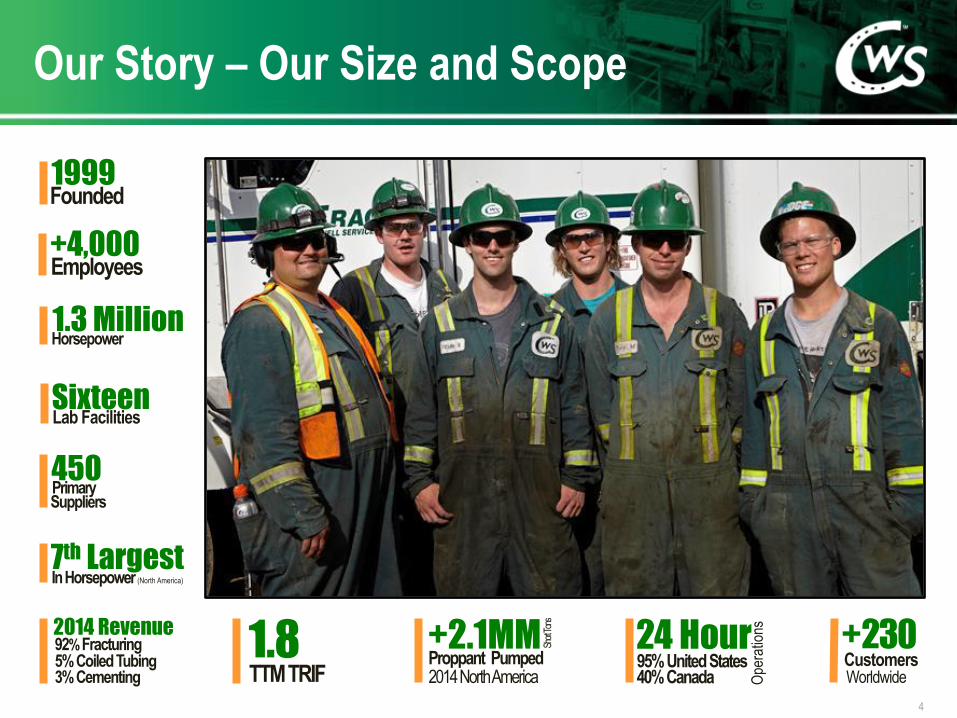
Our Story – Our Size and Scope
4
Lab Facilities Sixteen
In Horsepower (North America)
7th Largest
Primary 450
Employees +4,000
1.3 Million Horsepower
2014 Revenue 92% Fracturing 5% Coiled Tubing 3% Cementing
Customers +230 Worldwide
24 Hour 95% United States
Ope
ratio
ns
40% Canada Proppant Pumped +2.1MM Sh
ort T
ons
2014 North America
1.8 TTM TRIF
1999 Founded
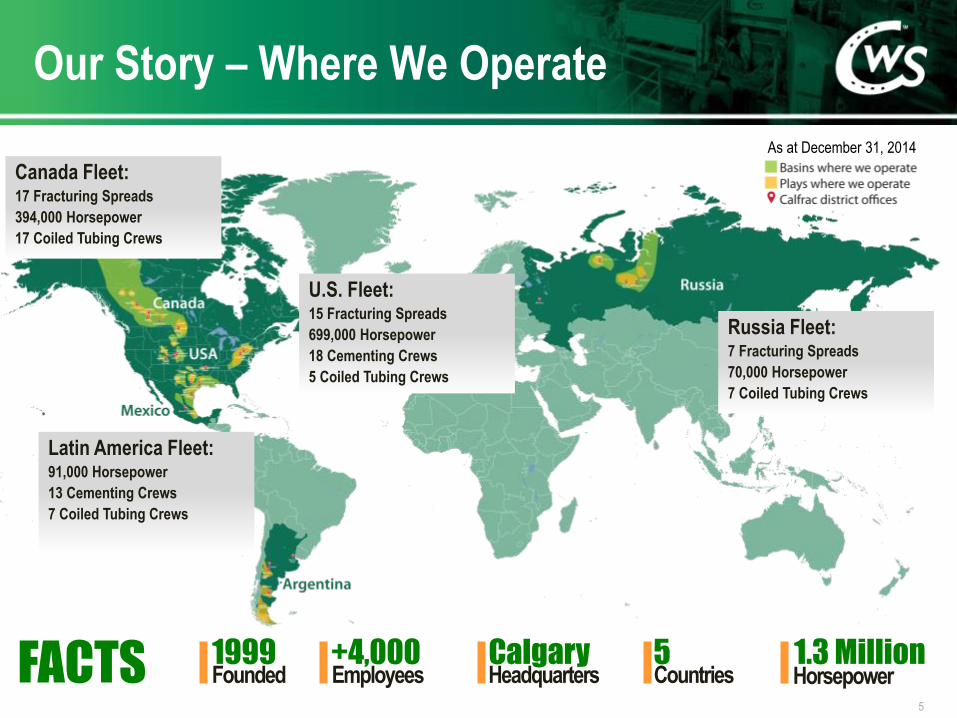
Our Story – Where We Operate
5
Canada Fleet: 17 Fracturing Spreads
394,000 Horsepower
17 Coiled Tubing Crews
U.S. Fleet: 15 Fracturing Spreads
699,000 Horsepower
18 Cementing Crews
5 Coiled Tubing Crews
Latin America Fleet: 91,000 Horsepower
13 Cementing Crews
7 Coiled Tubing Crews
Russia Fleet: 7 Fracturing Spreads
70,000 Horsepower
7 Coiled Tubing Crews
FACTS Founded 1999
Employees +4,000
Countries 5
Headquarters Calgary
Horsepower 1.3 Million
As at December 31, 2014

2006 + First multi-stage
fracturing treatment of a horizontal well is completed
2003 + Calfrac implements the
Quintuplex Nitrogen Pumper into operations
Our Story – A Brief History
6
1999 + Calfrac begins operations
in Calgary, Alberta
2000 + New equipment
transforms business
2001 + Customer-focused Lunch
& Learn sessions launched
2002 + Calfrac enters the
US market with the opening of a district office in Colorado
2004 + Calfrac becomes
a publicly traded company on the TSX
2005 + Calfrac enters the Russia
market with two long-term contracts
2007 + Calfrac enters the
Latin America market
2008 + Latin America
operations expand with entry into Argentina
2009 + Calfrac wins Encana’s Safety &
Environmental Stewardship Award
2010 + Calfrac wins
Shell’s Supplier of the Year Award
2011 + Operations continue to expand
in the US and Latin America
2012 + Calfrac starts
certification process for API Q2
2013 + CERT, Calfrac’s online and
experiential training program for field operators, is launched
2014 + Calfrac launches The 15 Days of
Giving, a program focused on volunteering time to local not-for-profits
2015 + Calfrac’s journey
continues
The Key Drivers & Goals Choosing Engagement Over Satisfaction

Survey Goals
• Global Participation – Survey championed by CEO
– All Calfrac employees could participate
– Exceed 2010 Satisfaction Survey participation rate (~50%)
• Data Quality and Reliability – Results must be reliable and actionable
– Data had to be benchmarked (historically, internally and vs. industry norm)
• Survey Results – To managers: Develop a hierarchy that will
allow the survey results to be reported by country; region; district; manager; supervisor
– To employees: Provide timely, meaningful feedback to all employees
Why an engagement survey?
• Company in transition – Global company headquartered in
Canada
• Exponential growth – Revenue, asset base, number of
employees and locations
• Culture change – Global consistency, local flexibility
• Change in Leadership – CEO, other executives and senior
managers
• Turnover and Attrition – Understand how turnover and attrition
might be limiting growth
The Key Drivers
8
Conducting the Survey …and analyzing the results
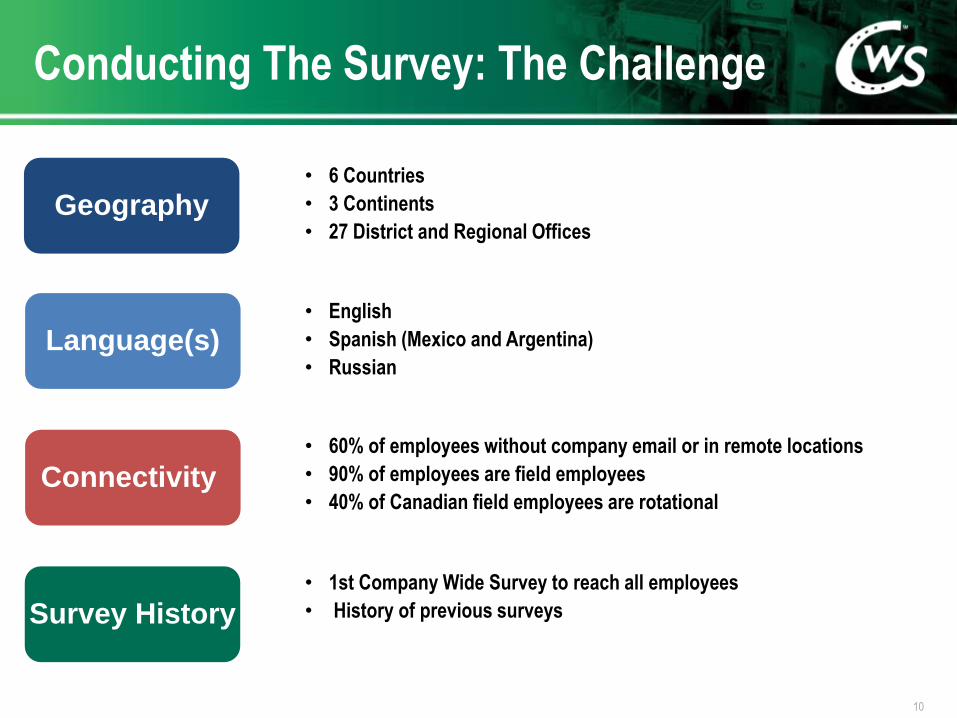
Conducting The Survey: The Challenge
10
Geography
Language(s)
Connectivity
Survey History
• 6 Countries
• 3 Continents
• 27 District and Regional Offices
• English
• Spanish (Mexico and Argentina)
• Russian
• 60% of employees without company email or in remote locations
• 90% of employees are field employees
• 40% of Canadian field employees are rotational
• 1st Company Wide Survey to reach all employees
• History of previous surveys

And The Survey Says…. Key Findings
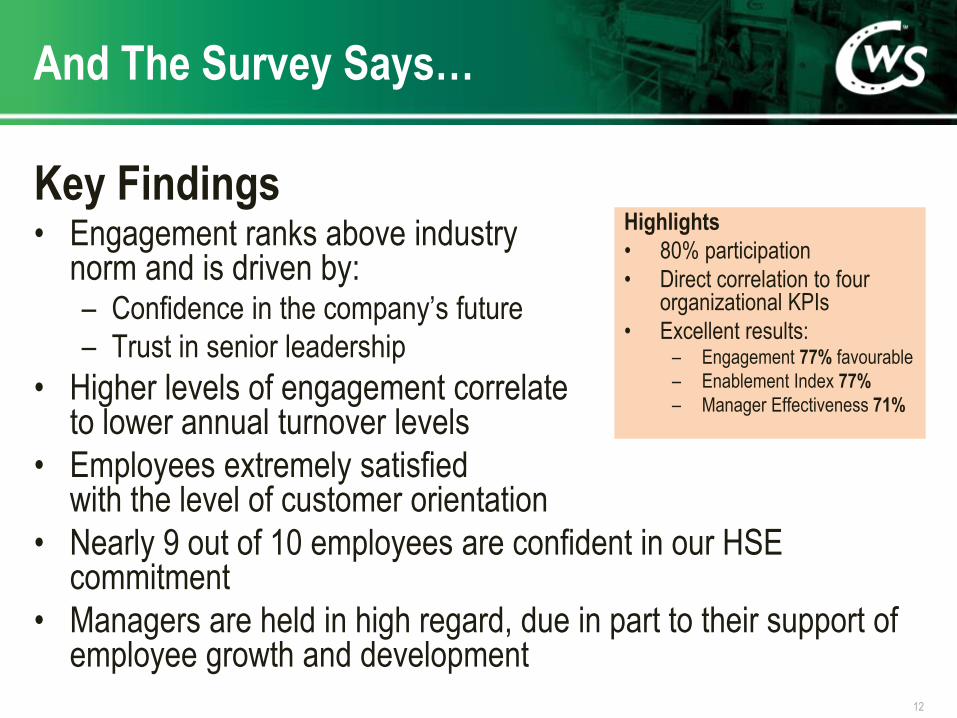
Key Findings • Engagement ranks above industry
norm and is driven by: – Confidence in the company’s future
– Trust in senior leadership
• Higher levels of engagement correlate to lower annual turnover levels
• Employees extremely satisfied with the level of customer orientation
• Nearly 9 out of 10 employees are confident in our HSE commitment
• Managers are held in high regard, due in part to their support of employee growth and development
12
And The Survey Says…
Highlights
• 80% participation
• Direct correlation to four organizational KPIs
• Excellent results: – Engagement 77% favourable
– Enablement Index 77%
– Manager Effectiveness 71%
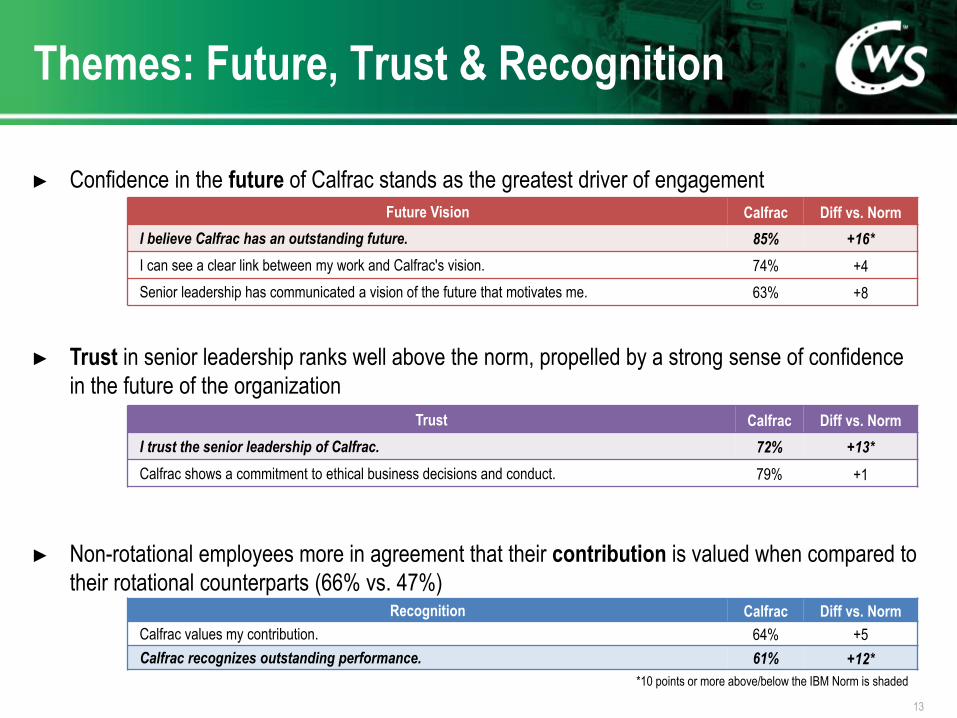
► Confidence in the future of Calfrac stands as the greatest driver of engagement
13
Themes: Future, Trust & Recognition
Future Vision Calfrac Diff vs. Norm
I believe Calfrac has an outstanding future. 85% +16*
I can see a clear link between my work and Calfrac's vision. 74% +4
Senior leadership has communicated a vision of the future that motivates me. 63% +8
*10 points or more above/below the IBM Norm is shaded
► Trust in senior leadership ranks well above the norm, propelled by a strong sense of confidence
in the future of the organization
Trust Calfrac Diff vs. Norm
I trust the senior leadership of Calfrac. 72% +13*
Calfrac shows a commitment to ethical business decisions and conduct. 79% +1
► Non-rotational employees more in agreement that their contribution is valued when compared to
their rotational counterparts (66% vs. 47%) Recognition Calfrac Diff vs. Norm
Calfrac values my contribution. 64% +5
Calfrac recognizes outstanding performance. 61% +12*
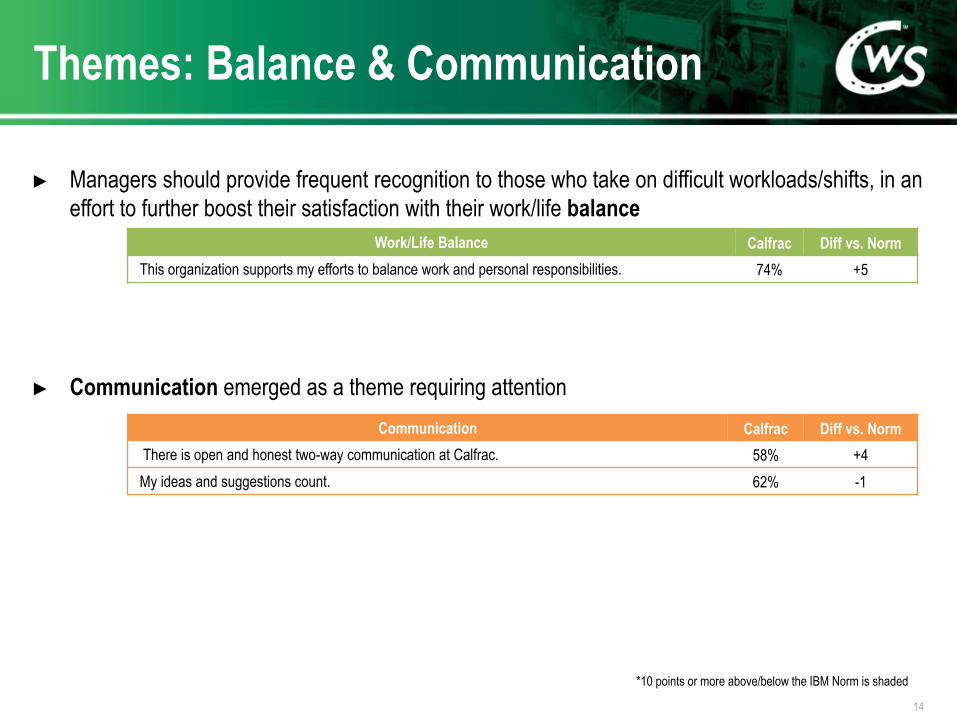
► Managers should provide frequent recognition to those who take on difficult workloads/shifts, in an
effort to further boost their satisfaction with their work/life balance
Work/Life Balance Calfrac Diff vs. Norm
This organization supports my efforts to balance work and personal responsibilities. 74% +5
► Communication emerged as a theme requiring attention
14
Themes: Balance & Communication
Communication Calfrac Diff vs. Norm
There is open and honest two-way communication at Calfrac. 58% +4
My ideas and suggestions count. 62% -1
*10 points or more above/below the IBM Norm is shaded
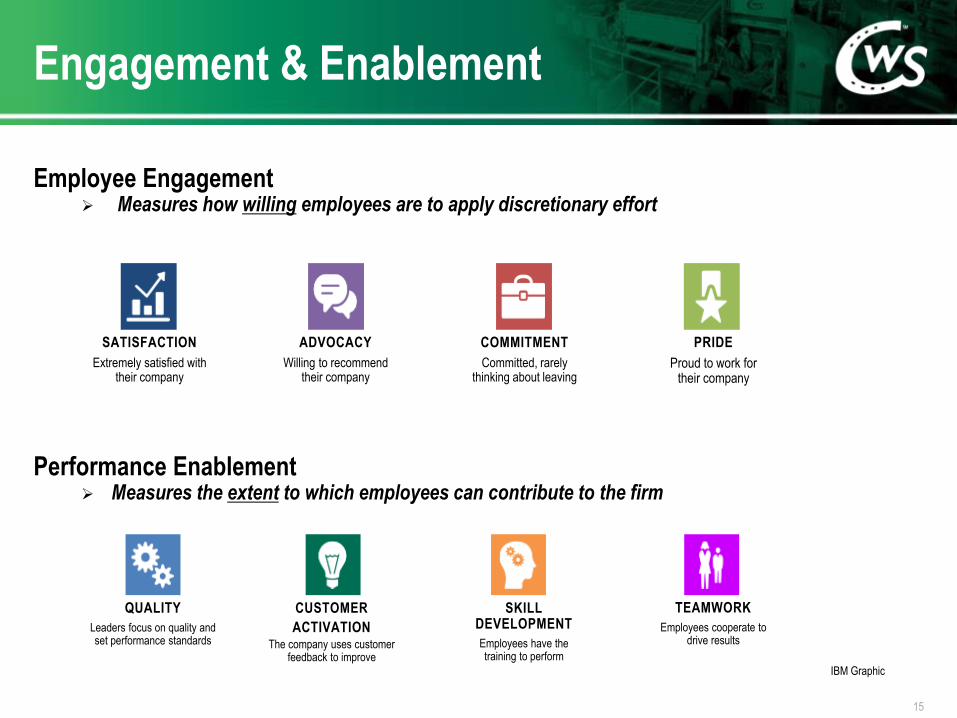
Engagement & Enablement
15
ADVOCACY
Willing to recommend their company
COMMITMENT
Committed, rarely thinking about leaving
PRIDE
Proud to work for their company
SATISFACTION
Extremely satisfied with their company
Employee Engagement Measures how willing employees are to apply discretionary effort
Performance Enablement Measures the extent to which employees can contribute to the firm
TEAMWORK
Employees cooperate to drive results
QUALITY
Leaders focus on quality and set performance standards
CUSTOMER
ACTIVATION The company uses customer
feedback to improve
SKILL DEVELOPMENT
Employees have the training to perform
IBM Graphic
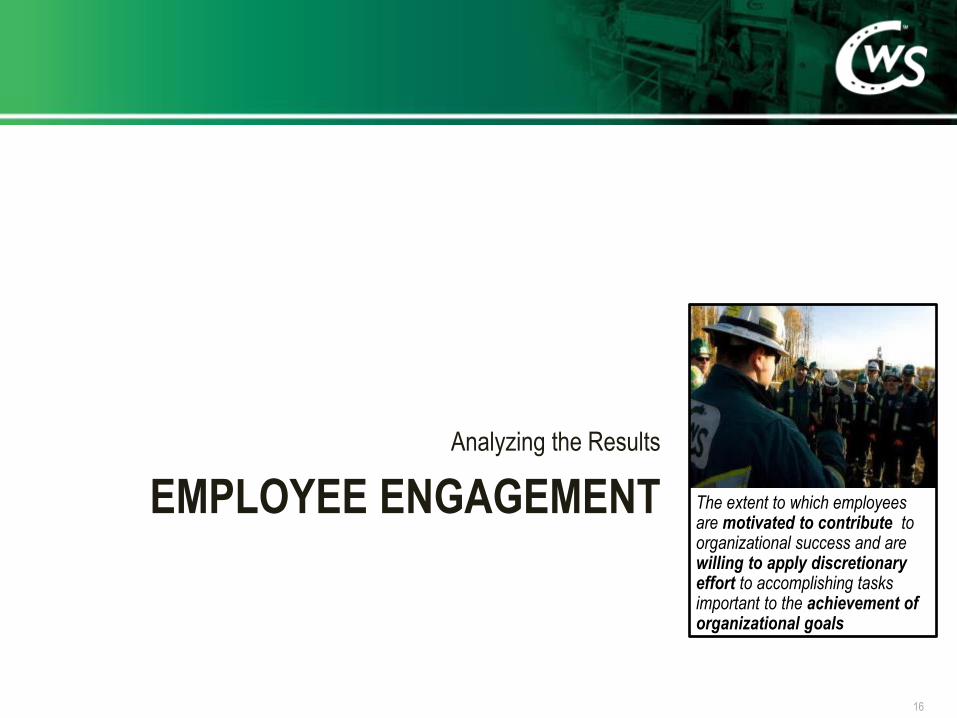
EMPLOYEE ENGAGEMENT
Analyzing the Results
16
The extent to which employees are motivated to contribute to organizational success and are willing to apply discretionary effort to accomplishing tasks important to the achievement of organizational goals
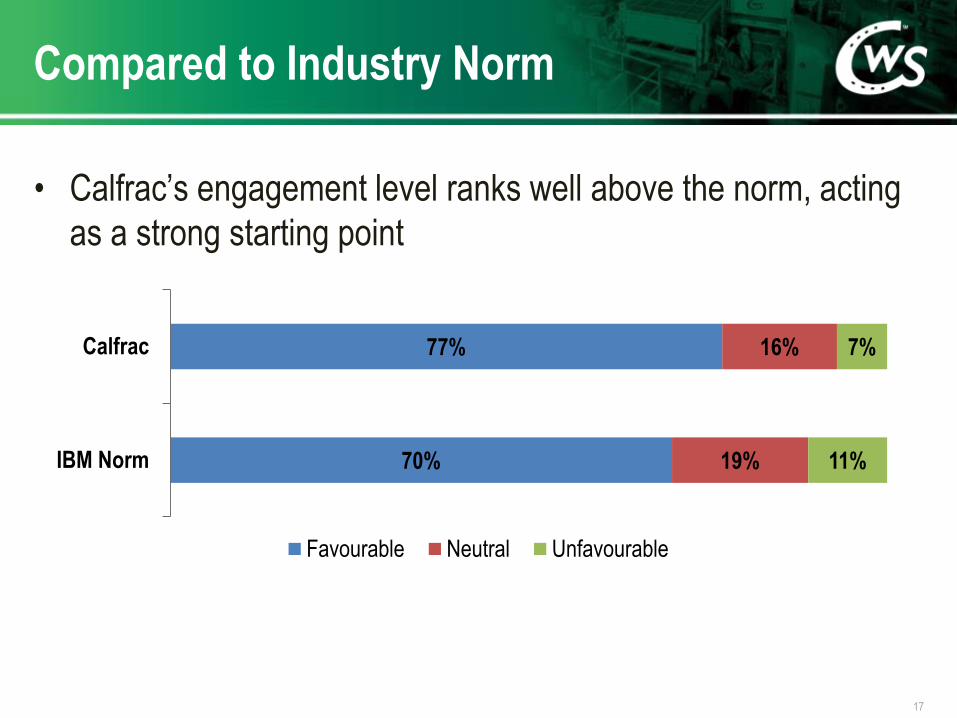
• Calfrac’s engagement level ranks well above the norm, acting
as a strong starting point
17
Compared to Industry Norm
70%
77%
19%
16%
11%
7%
IBM Norm
Calfrac
Favourable Neutral Unfavourable
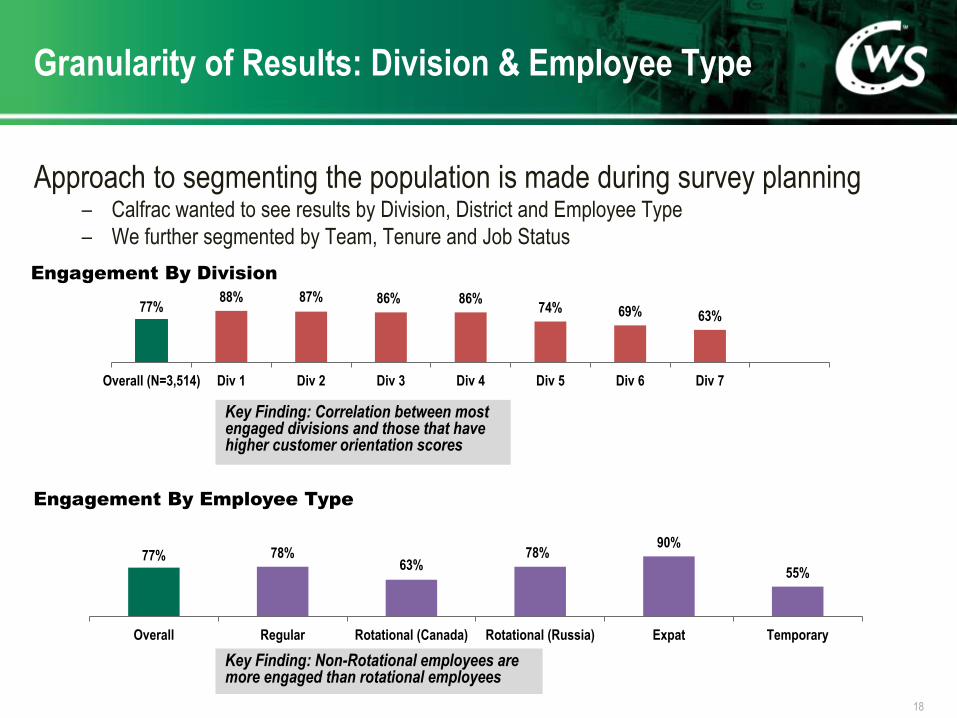
Approach to segmenting the population is made during survey planning – Calfrac wanted to see results by Division, District and Employee Type
– We further segmented by Team, Tenure and Job Status
18
Granularity of Results: Division & Employee Type
77% 88% 87% 86% 86%
74% 69% 63%
Overall (N=3,514) Div 1 Div 2 Div 3 Div 4 Div 5 Div 6 Div 7
77% 78% 63%
78% 90%
55%
Overall Regular Rotational (Canada) Rotational (Russia) Expat Temporary
Engagement By Division
Engagement By Employee Type
Key Finding: Correlation between most engaged divisions and those that have higher customer orientation scores
Key Finding: Non-Rotational employees are more engaged than rotational employees
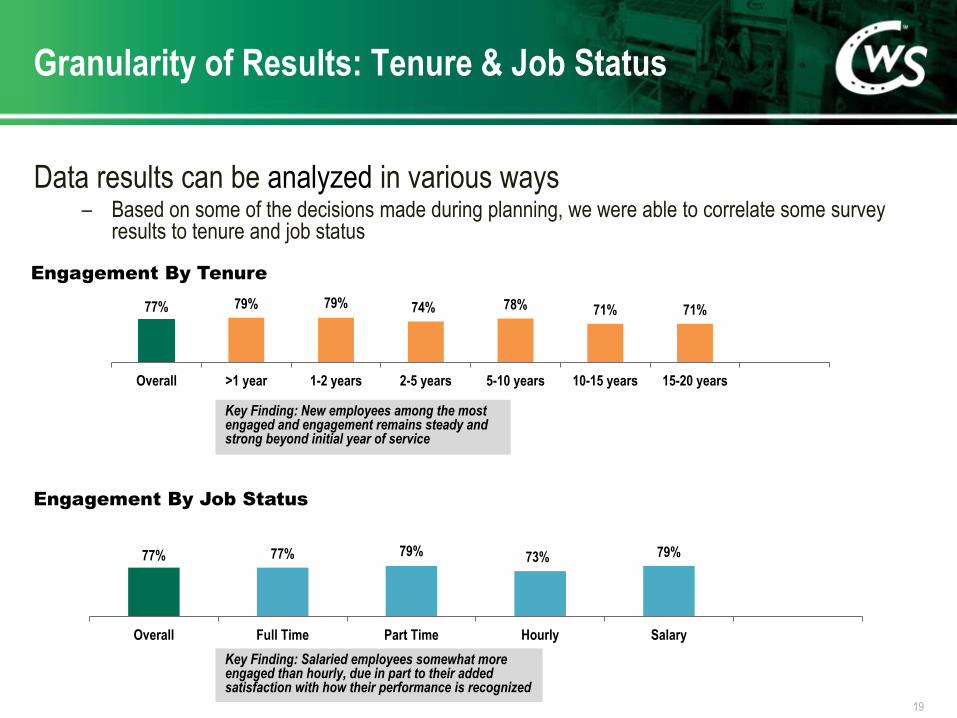
Data results can be analyzed in various ways – Based on some of the decisions made during planning, we were able to correlate some survey
results to tenure and job status
19
Granularity of Results: Tenure & Job Status
77% 79% 79% 74% 78% 71% 71%
Overall >1 year 1-2 years 2-5 years 5-10 years 10-15 years 15-20 years
77% 77% 79% 73% 79%
Overall Full Time Part Time Hourly Salary
Engagement By Tenure
Engagement By Job Status
Key Finding: New employees among the most engaged and engagement remains steady and strong beyond initial year of service
Key Finding: Salaried employees somewhat more engaged than hourly, due in part to their added satisfaction with how their performance is recognized
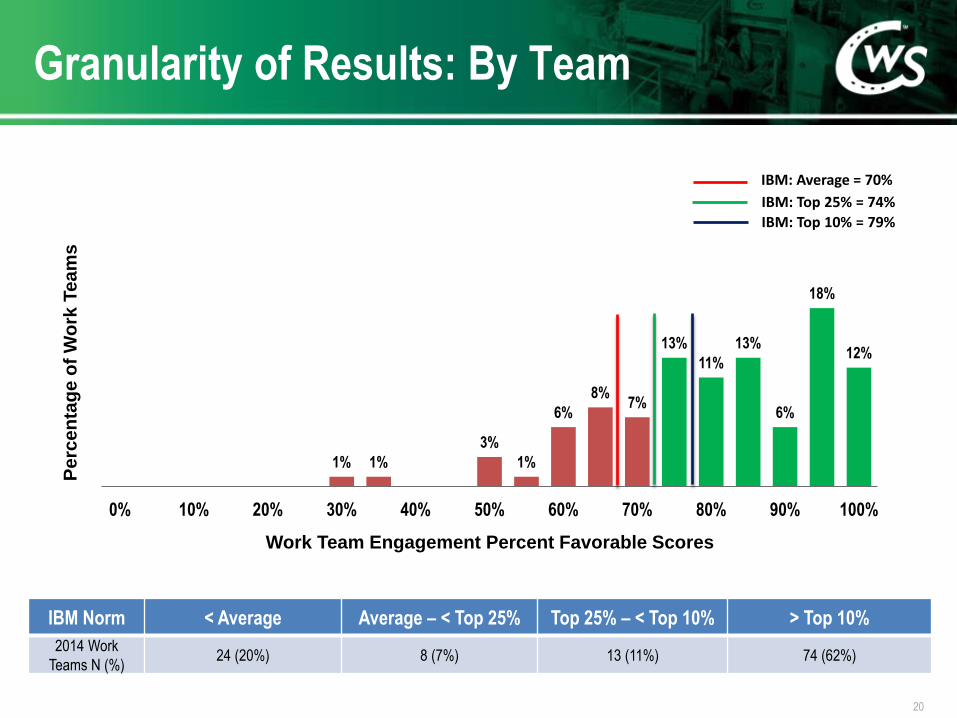
Granularity of Results: By Team
20
IBM Norm < Average Average – < Top 25% Top 25% – < Top 10% > Top 10%
2014 Work
Teams N (%) 24 (20%) 8 (7%) 13 (11%) 74 (62%)
1% 1%
3%
1%
6%
8% 7%
13%
11%
13%
6%
18%
12%
0% 10% 20% 30% 40% 50% 60% 70% 80% 90% 100%
Perc
en
tag
e o
f W
ork
Tea
ms
Work Team Engagement Percent Favorable Scores
IBM: Average = 70%
IBM: Top 25% = 74%
IBM: Top 10% = 79%
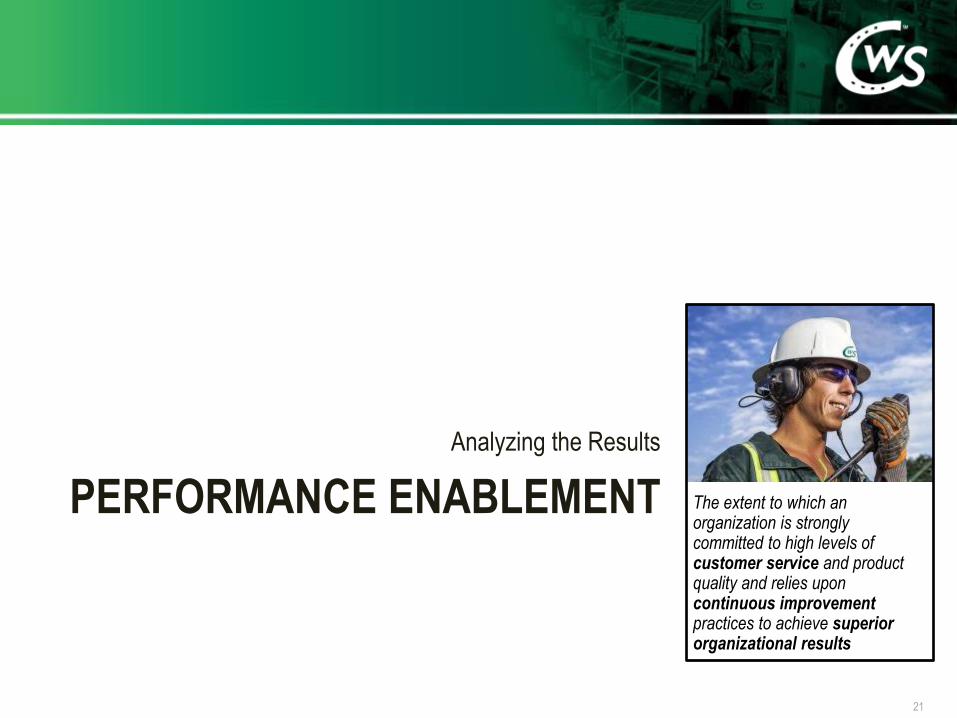
PERFORMANCE ENABLEMENT
Analyzing the Results
21
The extent to which an organization is strongly committed to high levels of customer service and product quality and relies upon continuous improvement practices to achieve superior organizational results
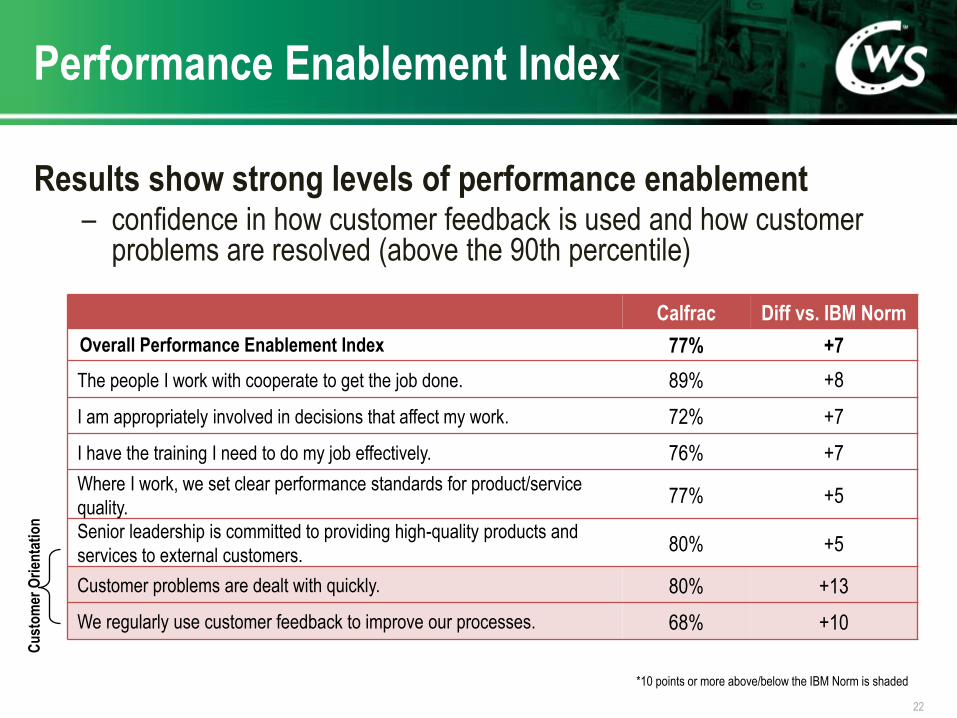
Results show strong levels of performance enablement – confidence in how customer feedback is used and how customer
problems are resolved (above the 90th percentile)
22
Performance Enablement Index
Calfrac Diff vs. IBM Norm
Overall Performance Enablement Index 77% +7
The people I work with cooperate to get the job done. 89% +8
I am appropriately involved in decisions that affect my work. 72% +7
I have the training I need to do my job effectively. 76% +7
Where I work, we set clear performance standards for product/service
quality. 77% +5
Senior leadership is committed to providing high-quality products and
services to external customers. 80% +5
Customer problems are dealt with quickly. 80% +13
We regularly use customer feedback to improve our processes. 68% +10
Cu
sto
mer
Ori
enta
tio
n
*10 points or more above/below the IBM Norm is shaded
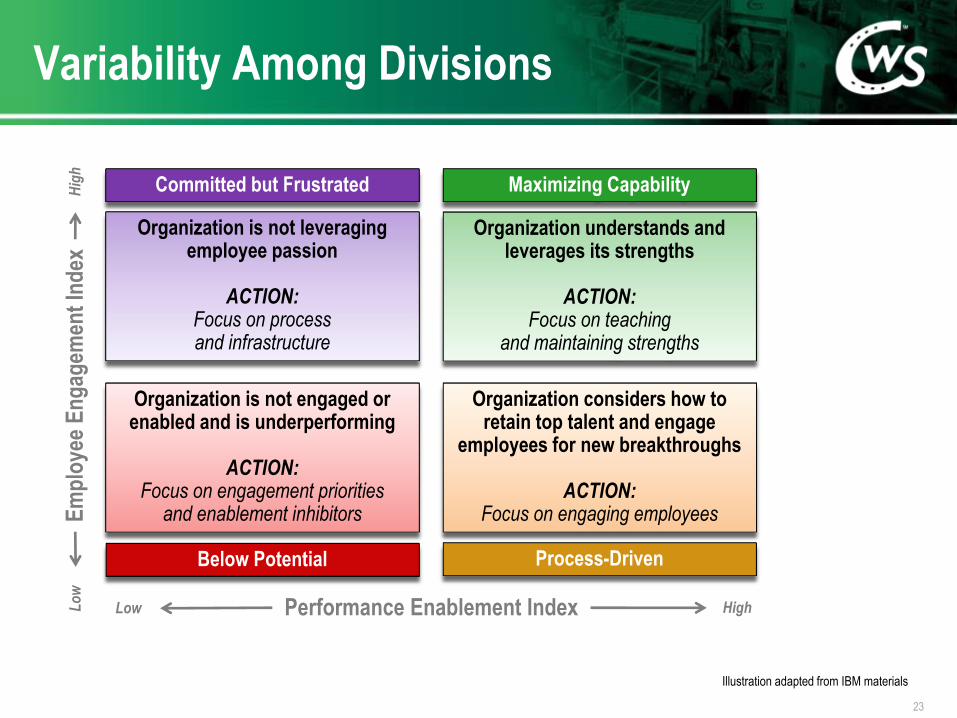
Below Potential
Committed but Frustrated Maximizing Capability
Process-Driven
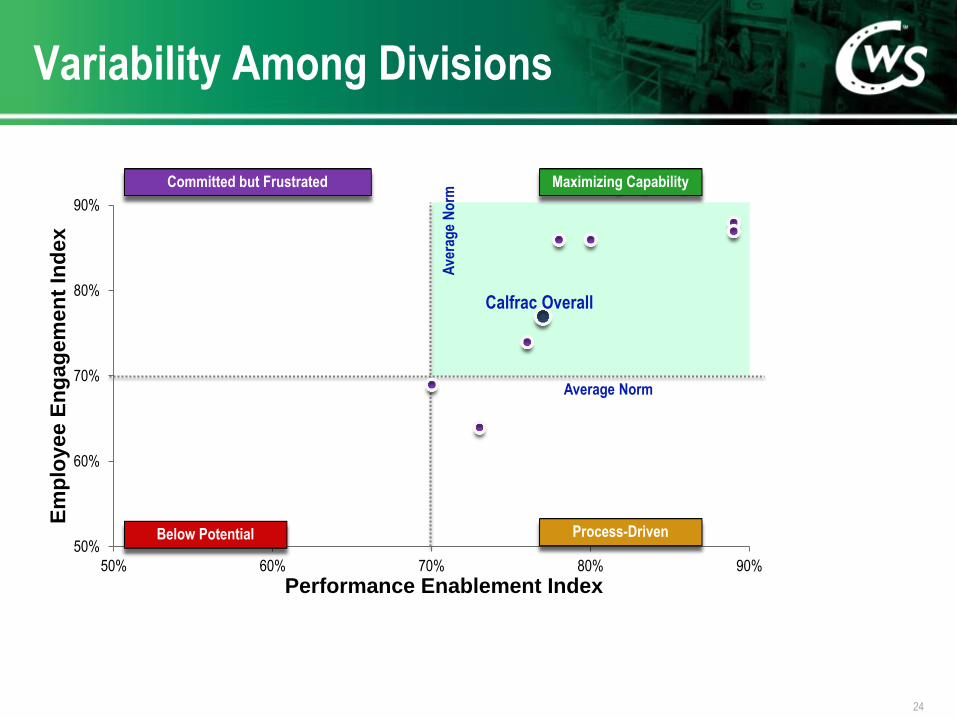
Variability Among Divisions
23
Illustration adapted from IBM materials
Organization is not leveraging employee passion
ACTION:
Focus on process and infrastructure
Organization understands and leverages its strengths
ACTION:
Focus on teaching and maintaining strengths
Organization is not engaged or enabled and is underperforming
ACTION:
Focus on engagement priorities and enablement inhibitors
Organization considers how to retain top talent and engage
employees for new breakthroughs
ACTION: Focus on engaging employees
Performance Enablement Index High Low
Em
plo
yee
En
gag
emen
t In
dex
H
igh
L
ow
50%
60%
70%
80%
90%
50% 60% 70% 80% 90%
Em
plo
yee
En
ga
gem
en
t In
dex
Performance Enablement Index
Average Norm
Below Potential
Committed but Frustrated Maximizing Capability
Process-Driven
Ave
rag
e N
orm
Calfrac Overall
Variability Among Divisions
24
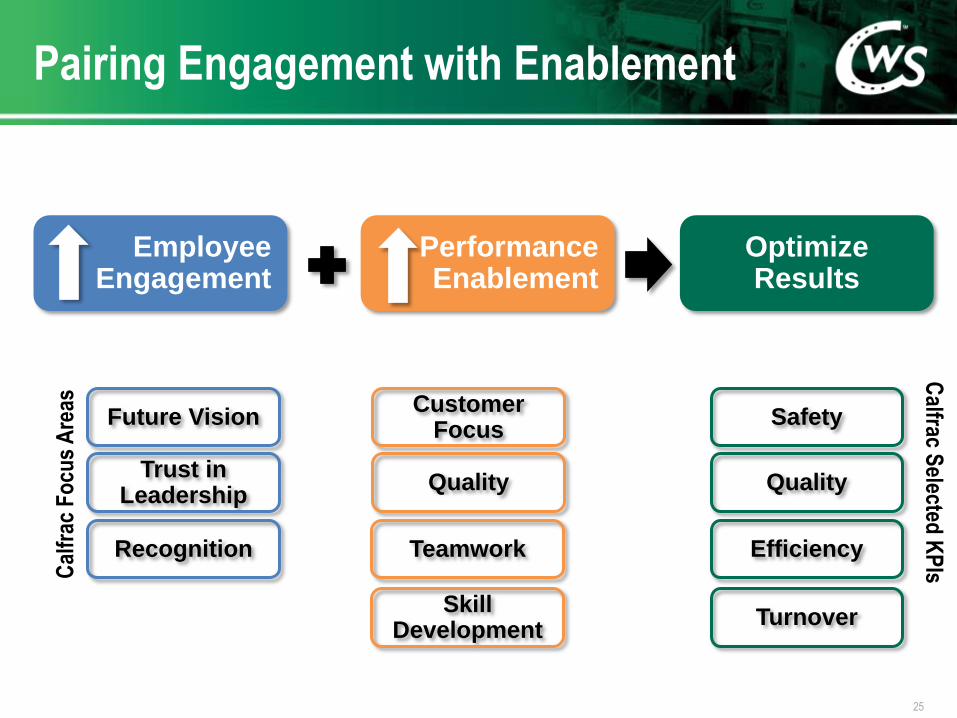
Pairing Engagement with Enablement
25
Future Vision
Trust in Leadership
Recognition
Customer Focus
Quality
Teamwork
Skill Development
Employee Engagement
Performance Enablement
Optimize Results
Cal
frac
Fo
cus
Are
as
Safety
Quality
Efficiency
Calfrac S
elected K
PIs
Turnover
MANAGER EFFECTIVENESS
Analyzing the Results
26
Extent to which leaders enhance the performance of their teams by enhancing the level of communication, accountability and execution

• Top quartile managers have teams that are far more engaged than their bottom quartile counterparts
27
Impact of Managers on Engagement
66% 70%
81% 89%
1st Quartile 2nd Quartile 3rd Quartile 4th Quartile

• Managers initially skeptical of how results impact their business, so….
– We ran additional analysis with other company data to show the links between engagement and enablement to key performance indicators
28
Linking Engagement to KPIs
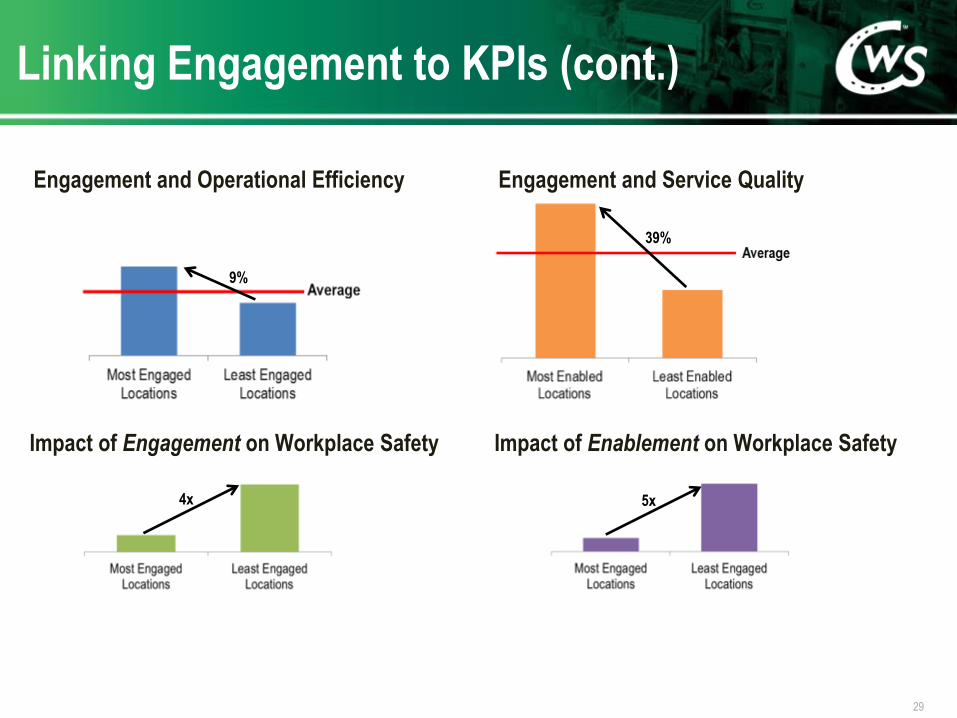
Linking Engagement to KPIs (cont.)
29
Engagement and Operational Efficiency Engagement and Service Quality
Impact of Engagement on Workplace Safety Impact of Enablement on Workplace Safety
9%
39%
5x 4x

• We compared engagement survey results to turnover statistics to identify correlations
– Turnover is 2x lower in locations with higher levels of engagement
30
Linking Engagement to Turnover
What Next? Recommendations
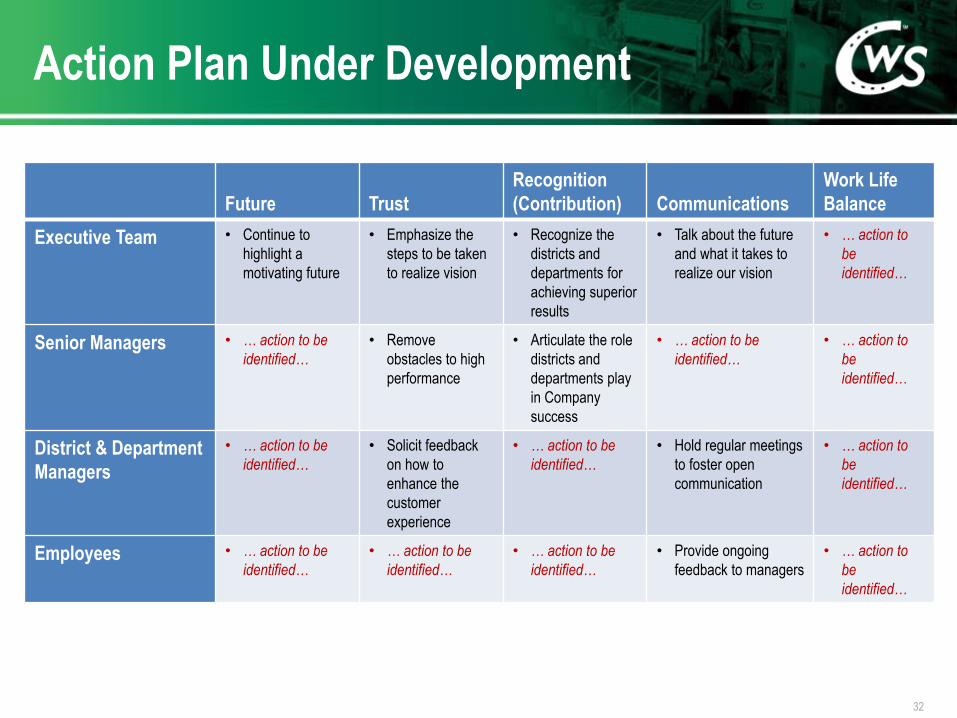
Action Plan Under Development
32
Future Trust
Recognition
(Contribution) Communications
Work Life
Balance
Executive Team • Continue to
highlight a
motivating future
• Emphasize the
steps to be taken
to realize vision
• Recognize the
districts and
departments for
achieving superior
results
• Talk about the future
and what it takes to
realize our vision
• … action to
be
identified…
Senior Managers • … action to be
identified…
• Remove
obstacles to high
performance
• Articulate the role
districts and
departments play
in Company
success
• … action to be
identified…
• … action to
be
identified…
District & Department
Managers
• … action to be
identified…
• Solicit feedback
on how to
enhance the
customer
experience
• … action to be
identified…
• Hold regular meetings
to foster open
communication
• … action to
be
identified…
Employees • … action to be
identified…
• … action to be
identified…
• … action to be
identified…
• Provide ongoing
feedback to managers
• … action to
be
identified…
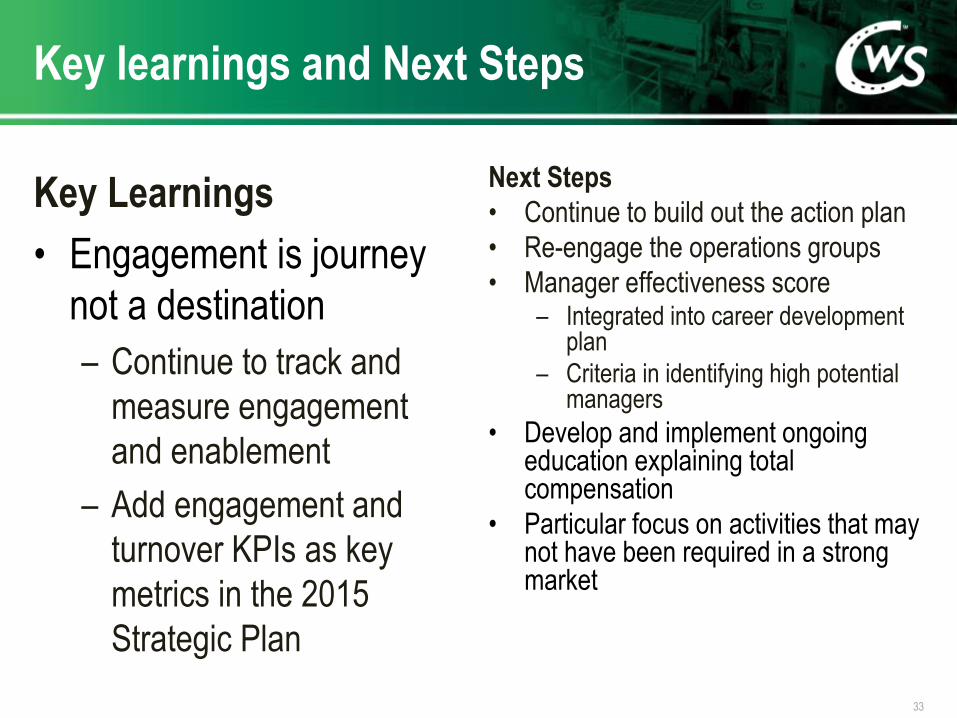
Next Steps
• Continue to build out the action plan
• Re-engage the operations groups
• Manager effectiveness score – Integrated into career development
plan
– Criteria in identifying high potential managers
• Develop and implement ongoing education explaining total compensation
• Particular focus on activities that may not have been required in a strong market
Key Learnings
• Engagement is journey
not a destination
– Continue to track and
measure engagement
and enablement
– Add engagement and
turnover KPIs as key
metrics in the 2015
Strategic Plan
Key learnings and Next Steps
33
Robert (Rob) Kearley
Director, Human Resources, International Operations
403-698-8596
www.calfrac.com
34